
Are Energy Reductions Compatible with Economic Growth?


1
Department of Design, Monash University-Caulfield Campus, P.O. Box 197, Caulfield East, VIC 3145, Australia
2
Department of Mechanical and Aerospace Engineering, Monash University-Clayton Campus, P.O. Box 31, Clayton, VIC 3800, Australia
*
Author to whom correspondence should be addressed.
Sustainability 2023, 15(10), 8043; https://doi.org/10.3390/su15108043
Submission received: 3 April 2023
/
Revised: 7 May 2023
/
Accepted: 14 May 2023
/
Published: 15 May 2023
(This article belongs to the Section Energy Sustainability)
Abstract
:Our planet faces several serious and urgent challenges to sustainability including, but not limited to, climate change; however, most researchers argue that technological solutions can solve these problems. This review first examines the prospects for decoupling environmental damages in general from economic growth, considered at the global level; then, it looks at whether the recent advances in information and communication technology (ICT) can help. It is argued that although absolute decoupling may have occurred in some countries—even after accounting for energy-intensive imports—it has not occurred at the global level, which is the relevant level for global sustainability problems. This conclusion is strengthened by the very high correlation over the past three decades found between global gross domestic product (GDP) and several parameters relevant for sustainability, particularly for atmospheric CO2 concentrations and ecological footprint as a function of GDP. ICT innovations relevant to energy use include smart grids and smart cities, especially smart urban transport. A review of recently published papers shows no definite findings of energy or carbon reduction, although some innovations show energy/carbon reduction potential if given strong policy support. Overall, it was concluded that the Earth’s sustainability challenges will probably need deep energy reductions, which in turn require profound sociopolitical changes.
1. Introduction: The Environmental Challenges Facing Earth
Our planet faces several serious environmental challenges that are global in their extent. These problems include global climate change (CC) [1,2,3]; biodiversity loss [4,5,6]; ocean deterioration, including progressive acidification [7,8]; pollution of the atmosphere, soil and waters, both fresh water and oceans, by chemicals and plastics [9,10]; and pervasive antibiotic resistance [11]. These challenges are inter-related, and all of them call for an immediate and effective response. It follows that not only must the solutions be able to be rapidly implemented, but also the solution to one problem—and CC is claiming by far the most attention—must not worsen the other global environmental challenges.
Some researchers have recognized the seriousness of these inter-related problems. In a series of papers, the late Willi Steffen and colleagues, e.g., [12,13,14,15], described a number of planetary boundaries; the crossing of any one of these will have serious consequences for our future survival. Thus far, of the original nine boundaries, only the risk to the ozone layer is declining with the phase-out of chlorofluorocarbons; the other risks are rising, or are uncertain, and require further study of the boundaries. Furthermore, Lade et al. [15] showed that synergy is at work; the transgression of one boundary can raise the likelihood of abrupt changes in the risk for other boundaries. From a different angle, Brodie and Watson [16] showed how human responses to CC will adversely impact biodiversity. Focusing only on CC, Kemp et al. [17] explored various possible CC scenarios, and concluded that there are ‘ample reasons to suspect that climate change could result in a global catastrophe’. The economic implications of keeping within the 1.5 °C target will also be serious: Trout et al. [18] showed that this target needs 40% of developed FF reserves to be kept in the ground.
It is fair to say that the majority of researchers still believe that technical solutions can respond adequately to these problems—for instance, that a global switch to RE can break the link between CO2 release and gross domestic product (GDP). The proposed technical solutions include greatly improving energy efficiency [19]; replacing fossil fuels (FF) by renewable energy (RE) and/or nuclear power; carbon dioxide removal (CDR), either by biological or mechanical means; and most ambitious of all, solar geoengineering [20]. The last two approaches would enable continued use of FFs—at least until the economic and environmental costs of continued FF use become too high.
Many of the researchers who are optimistic about technical solutions believe that RE is a solution—at least for CC—see, e.g., [21,22,23]. In previous research [23,24,25], authors have taken issue with this claim, arguing that RE itself has some serious environmental problems, and in any case will take decades to replace FFs—too late for addressing CC, as its devastating effects are already being felt.
This claim of RE having no climate change impact ignores the indirect climate change forcing that various forms of RE can produce. The most important is the CO2 and methane (CH4) releases from tropical hydro dams [26], which in their early years after construction can rival those of a natural gas plant of similar output. The estimation of the released GHGs caused by the hydro plant must be net of the annual GHG emissions before the plant is built. Furthermore, large bodies of water, such as hydro reservoirs, have a lower albedo than vegetated land such as forests, which adds to climate forcing [27]. Geothermal plants can also release CO2 in addition to that from input energy. Although O’Sullivan et al. [28] have shown that after plant retirement, CO2 emissions eventually fall below natural levels, resulting in no net emissions after several centuries, this is of little help, since the next one or two decades are crucial for emissions reduction.
While in the long term, RE may be able to eliminate much of the climate forcing from energy use, this is of little use in the short time we have left to effectively mitigate CC, as RE is still a minor energy source. While CC is already producing record-breaking extreme weather around the globe, the future damage caused by continuing CC could be much worse, as damage rises non-linearly with temperature increases [29]. Even when low carbon sources come to dominate global energy use, atmospheric CO2 concentrations will likely be well over 450 parts per million (ppm) (in 2023 they were already about 425 ppm). Disastrous CC will continue, unless atmospheric CO2 levels are reduced, not merely held constant [1,3].
Bioenergy with carbon capture and storage (BECCS) is often seen as a way of not only using a seemingly low-carbon source of energy, but as a means of reducing atmospheric concentrations of CO2 [30]. BECCS simply combines bioenergy with carbon capture and underground (or undersea) storage of the CO2 produced. However, the global potential for bioenergy as a fuel is limited, and could well decline with the increasing need for food as the global population continues to rise [25]. Although CCS has been promoted for decades, only a few tens of megatons are presently stored annually, which is a negligible amount compared with the 2021 energy and industrial emissions of 36.3 Gt (gigaton) CO2 equivalent (Gt CO2-eq)—or with the global total of 40.8 Gt CO2-eq from all sources [31]. Hence, the scope for BECCS as a key means of climate mitigation seems small: not only will available amounts of bioenergy be limited, but CCS has its own difficulties, and may never become important.
In an earlier paper, the authors claimed that three proposed new RE sources—airborne wind turbines, microalgae for fuels, and photolysis—despite their claimed advantages over more conventional RE, will never become major energy sources [32]. Currently, another RE source is being proposed. The existence of fires from naturally occurring hydrogen (H2) seeps has been recognized for centuries, but recently, attempts have been made to understand the various processes by which it is formed, and how it could be utilized as an energy source [33,34,35]. Some advocates have even suggested that it could supply the world with an inexhaustible supply of zero-carbon energy [33].
Zgonnik [35] has estimated that the annual flow of hydrogen from all geological sources is at least 23 Mt/year. which corresponds to under 3 EJ, a marginal figure compared with the 2019 global primary energy consumption of over 600 EJ [36]. He also argued that ‘a deep-seated origin is potentially the most likely explanation for its abundance in nature’. Even if the figure of 23 Mt of H2 seeping to the Earth’s surface is an underestimate, it must be remembered that much of this seepage will occur along mid-oceanic ridges and other inaccessible places. Thus far, the first and only commercial application has been in supplying electricity to a village in Mali [34].
This review examines the evidence for the frequently-made claim that environmental problems can be decoupled from economic growth—in short, that ‘green growth’ (where GDP continues to grow, but the environment improves) is not only possible, but is the way forward. Section 2 discusses the approach used in this review. From a global viewpoint, the evidence presented in Section 3 shows that absolute decoupling is not presently occurring, despite decades of concern about CC, and may never happen. Next, in Section 4, the question of whether the new information and communication technologies (ICT) approaches, especially smart grids (SGs) and smart cities (SCs), can provide major improvements in environmental sustainability is discussed. ICT was chosen as a potential solution, since technological advances are most rapid in this area. It was concluded that only travel replacement by ICT has the potential for reducing vehicular travel’s environmental damage. Smart grids also have some potential, but serious concerns exist about their privacy, and especially their security problems.
This review has two important innovations. Firstly, it presents new evidence for the difficulties facing global absolute decoupling, both now and in the future. While there is some evidence for (absolute) decoupling at the national level in some countries, there is none at the global level, as the data presented make clear. Secondly, to the authors’ knowledge, it makes the first attempt to assess the system-wide net energy benefits of ICT, both at present and in the future.
2. Materials and Methods
This review has two related themes: the difficulty of decoupling energy and carbon emissions from GDP growth, treated in Section 3, and the potential for the new ICTs to facilitate decoupling, considered in Section 4. Several time series for the relationship between global GDP, global energy, and transport are developed, relying on data from organizations which regularly publish annual statistical reports. For energy-related statistics, this review relied mainly on the annual global energy statistics available from BP [37] and the IEA [36,38]. For global car fleet statistics, the Organization of the Petroleum Exporting Countries (OPEC) data [39] were used, along with data for earlier years. Their data had to be supplemented by US Bureau of Transportation Statistics (BTS) statistics on US sports utility vehicles [40]. For climate science, the latest Intergovernmental Panel on Climate Change (IPCC) reports were used [29,30], along with more recent CC studies.
Global electricity was chosen to represent global energy use, because the data for global primary energy is subject to two uncertainties:
- Bioenergy use is uncertain because of lack of information on traditional fuelwood use;
Although traditional fuelwood use is expected to disappear [38], primary electricity generation (especially from wind and solar) is anticipated to dominate future energy production.
Treatment of the second theme, whether SGs, SCs, and other ICT applications can help decoupling, relies heavily on recently published literature, although some relevant topics, such as artificial intelligence and machine learning have been discussed for decades. Others, including SGs, SCs, and the internet of things (IoTs), are of much more recent origin [41,42]. The volume of published literature on these latter topics is rapidly increasing, with new insights available each year. Hence, preference was given to the very latest articles, chiefly those published after 2020. Moreover, the papers selected to at least partly focus on the energy (or carbon) savings possible with these new approaches, and whether they are likely to be cost-effective.
As with Section 3, an Earth System Science (ESS) approach was used to evaluate the claims made in the published literature. In the context of this review, the ESS approach has two important components. First, even in the country or city being assessed, it is important to take a system view, as illustrated in Section 4 for transport systems in SCs. Second, environmental damages incurred in countries other than the one under consideration must be included. Possible barriers to the introduction of ICT-based energy-saving innovations are also discussed, as well as their potential, as these will impact when the ICT innovations can be deployed.
Figure 1 shows the breakdown of the papers selected. As well as consulting the Scopus database, the authors relied on their 30 years of research into similar topics, and the many hundreds of articles in their files.
3. Earth’s Environmental Problems and Economic Growth: Review of Literature and Evaluation of Empirical Data
The majority of researchers still believe that decoupling is possible; in other words, that ‘Green Growth’ is possible. Some believe that not only is it possible, but that the rate of economic growth can be accelerated by such a shift, which would include a large increase in RE investment. Global GDP may still be strongly correlated with energy use, but this would not matter if the energy was supplied from renewable sources. There are, of course, better measures of welfare than GDP, such as the human development index (HDI); however, unlike GDP, comprehensive time series data are not available. Furthermore, the use of HDI would unlikely change much the relationships found at the global level.
Some studies have found decoupling for individual countries, even when imports of energy-intensive goods are considered, e.g., [43,44,45]. The most thorough of these studies included not only these imports, but at least some of the environmental costs incurred outside the country or the European Union overall [45]. Haberl and colleagues [43] distinguish between ‘absolute decoupling’ (with ‘absolute reductions in emissions or resource use’ and ‘relative decoupling’, ‘where resource use or emissions increase less so than does GDP’. They found that relative was more common than absolute decoupling, and was usually found in studies that did not consider embodied energy in imports.
Parrique and colleagues [46] are strong critics of the decoupling thesis, concluding that ‘there is no empirical evidence for such a decoupling currently happening’. They added that ‘This is the case for materials, energy, water, greenhouse gases, land, water pollutants, and biodiversity loss for which decoupling is either only relative, and/or observed only temporarily, and/or only locally’. Niebuhr and colleagues [47] have also stressed that RE installations can affect biodiversity beyond the areas occupied by the installations—a reminder that CC is not the only environmental challenge we face.
The data assembled by the present authors support the conclusions of the decoupling sceptics. Figure 2 shows a number of critical quantities plotted against global GDP, measured in purchase parity pricing (PPP) constant 2017 US dollars (USD) as reported by the World Bank [48]. The quantities are normalized by 2017 values to show the relative growth in each. Moreover, a linear trend line for each quantity is shown.
For global atmospheric CO2 levels (measured in parts per million (ppm) from 1990 (the year of the first IPCC report) to 2021, as provided by Statista [50], the R2 is over 99%, suggesting that GDP is the key factor determining atmospheric ppm. A further consideration is that since economic growth is a human-derived activity, there remains a strong possibility that population (growth) also plays a key role in determining atmospheric CO2 levels; this is explored in Appendix A. The CO2 levels are, of course, largely the result of continued heavy dependence on fossil fuel use by most countries. This is shown in Table 1, which also shows the large variations in non-carbon electricity production from country to country.
Figure 2 also shows, from 1990 to 2018—the most recent year for which data are available—the number of Earths that would be needed for sustainability, as determined from the Environmental Footprint (EF) approach [49]. All values are greater than 1.0 over this period, which means we are presently in overshoot, which can only be temporary. R2 is again very high, at about 95%.
Figure 2 also shows global electricity production in TWh from BP [37], as a function of global GDP. The R2 coefficient (as generated by the Excel program) is very close to 100%. An earlier study [25], Figure 5.2 found a similarly high correlation for global primary energy vs. GDP (however, see the comments in Section 2 about their lower reliability compared with global electricity figures). Figure 2 also shows the global car fleet against global GDP, and again finds an R2 value of nearly 100%. Although not shown, airline revenue passenger-km also shows a strong correlation with global GDP (R2 = 0.98)—at least up to 2019, before COVID-19 severely disrupted air travel [52]. Finally, Garrett et al. [53] found that current global energy use correlated strongly with cumulative global economic production.
In Section 1, the existing problems facing RE were discussed, and from the data presented in Figure 2, no evidence could be found for decoupling, at least up to the present. However, could decoupling still occur in the future, as RE increases its share of global primary energy? This seems doubtful, for several reasons. Firstly, as Hall and colleagues have shown [54], the energy return on investment (EROI) is much lower for RE than for FFs—if CO2 emissions are ignored. Unfortunately, most calculations on the costs of RE, whether monetary or environmental, ignore some important factors. Secondly, RE per GW of installed electrical capacity, is much more materials-intensive than FF plants (for concrete, glass, plastics, copper), and some of the rarer materials necessary for wind and solar energy plants could face shortages in the future [23,25]. Furthermore, as ore grades decline, the energy costs per ton of refined metal will rise, and so will the environmental costs associated with the increase in wastes. Lawton [55] called his article on the environmental costs of RE ‘Net zero’s dirty secret’.
Fizaine and Court [56] examined the minimum EROI for our present economies to function, and concluded that for the US, the minimum value for economic growth to continue is 11, although smaller values have been reported [23]. Capellán-Pérez et al. [57] used dynamic energy analysis to examine the energy and material needs for achieving 100% RE electricity by 2060. Such a transition would reduce the overall EROI for power production to 3–5, below that which is needed to sustain industrial growth economies. Similarly to Lawton [55], they also stressed that materials availability could be a problem. Azadi and colleagues [58] focused on copper availability, and showed that ‘fuel consumption increased by 130% and electricity consumption increased by 32% per unit of mined copper in Chile from 2001 to 2017, largely due to decreasing ore grade’. Franssen and de Wilde [59] also reported that not only there was no evidence for global decoupling of GDP and resource use, but that no viable scenario for future decoupling existed. The tentative conclusion is that for sustainability—especially over the next decade or two—global energy reductions are needed.
What explains the strong correlation between CO2 atmospheric levels and global GDP (and global electricity use, global car fleet, EF, and global GDP)? The main cause is probably global inequality—the huge disparity between the OECD countries and the rest of the world, especially tropical Africa, in vehicle ownership, air travel, and ownership of domestic appliances such as refrigerators [25]. This inequality drives their rapid growth in low- and middle-income countries. If all countries had the average 2021 OECD levels of primary commercial energy use, global energy use would increase by a factor of around 2.2, and electricity consumption around 2.5 times higher. The global car fleet would be 3.1 times larger. All of these factors would be much higher if instead, US levels were used as the standard (e.g., the global energy factor rise would be 3.7, not 2.2). The global car fleet over the years 2021 to 2045 as forecasted by OPEC, will rise by 813 million, with 95% occurring in non-OECD countries [37,39].
Ownership levels of one household and office appliance—air conditioners (A/C)—are also important in helping to explain why decoupling is unlikely to work in the future. In year 1990, there were only 576 million A/C units worldwide; by 2021 there were 2.020 billion. The IEA [60] expect this exponential rise to continue, with 5.578 billion 180 units forecast for year 2050. According to a 2018 IEA report [61], A/C units in 2016 consumed 10% of global electricity use, or ‘over 2000 TWh’. For 2000 TWh, each of the 1622 million units in use in 2016 annually used an average of 1233 kWh, although the energy efficiency of different units varied greatly [61]. If A/C growth continues, as forecasted by the IEA, electricity use will rise accordingly, unless A/C efficiency can be greatly improved.
As Raymond et al. [62] reported, wet-bulb temperatures exceeding 35 °C, which marks the ‘upper physiological limit’ for humans, are already occurring in some sub-tropical regions. Even below this temperature, the effects on human health (and productivity) can be severe. As more of the global population incurs life-threatening wet-bulb temperatures, the demand for A/C could well continue to rise exponentially, as forecasted by the IEA.
4. Proposed New Technological Solutions: Smart Grids and Smart Cities
Section 3 showed how difficult it will be to rapidly reduce both energy use and atmospheric CO2 ppm if we persist with a global growth economy. In this section, the potential for new ICT approaches, especially SGs and SCs (chiefly smart transport, but also smart homes) to make a significant contribution to sustainability, is analyzed. An essential component of both SGs and SCs is the Internet of Things (IoTs), with its many millions of interconnected sensors. One report [63] estimated that the IoT in 2020 consisted 26 billion devices worldwide. In 2030, these authors forecast as many as 500 billion Internet-connected devices.
Processing the vast data sets provided by these sensors, in turn, requires artificial intelligence (AI) [41]. The processing of data from these billions of sensors also requires large amounts of energy, which must be offset against the energy savings from SGs [64]. Section 4.1 looks at smart grids, and because smart meters are an important part of SGs, it also examines the potential savings in domestic energy and buildings in general. In Section 4.2, SCs are discussed, focusing on transport.
4.1. Smart Grids
Electricity was traditionally supplied to homes, offices, and industry by large utility-owned power plants. Electricity consumption, however, varies both seasonally and by the time of day; utilities responded by switching power plants on or off to match this variable demand. With the advent of domestic rooftop PV cells connected to the grid, customers have become ‘prosumers’, in that they both produce and consume electricity [42]. Their surplus electricity can be sold to the utility. Thus, there are three components of a SG: the utility itself, the prosumers, and the multitude of sensors comprising the IoT.
Smart grids can potentially cut emissions by reducing energy in several ways:
- By ensuring that the power factor is kept high;
- By reducing the need for new transmission lines through the decentralization of the power supply, and reducing transmission losses;
- Through load demand management, SGs can potentially eliminate the need for the storage of surplus intermittent RE;
- By supplying domestic consumers with details of real-time energy use and costs, SGs can potentially cut energy use.
Intermittent RE will need to provide most of the energy in future energy systems, because of the limited potential of non-intermittent sources [24]. As the share of intermittent RE production rises, whether from utility-operated wind or solar farms, or from non-utility PV suppliers, grid management becomes more difficult. Electricity supply will then become more variable, as well as weather-dependent.
One way of overcoming this difficulty is by load demand management. If home appliances are grid-connected, large energy-intensive appliances, such as air conditioners, refrigerators, and freezers, can be temporarily turned off if overall grid demand exceeds the instantaneous supply. Smart electricity meters are a further means of demand management. Utilities can provide real-time information on electricity prices, which will now vary depending on electricity production.
Sovacool and colleagues [65] found that the number of smart meters globally rose from 23.5 million in 2010 to 729.1 million by 2019. Despite this large volume of smart meters, they found that ‘energy savings data was present in only a small number of programs (26), a striking conclusion given that smart meter programs are often implemented on the grounds that they will improve the efficiency of household energy consumption’. The carbon emissions impact was similarly ignored, being reported in only one study. The actual energy savings from smart meters appears to be small, and in some cases, energy increases can occur. Nevertheless, because householders can defer some energy use to times of low energy costs, smart grids and smart meters potentially offer a means of a more equitable way of reducing emissions.
Both Ghiasi et al. [66] and Moretti et al. [64] found that the lack of standardization in SG studies made findings difficult to interpret. Nevertheless, Moretti et al. in their review of a number of studies found some energy savings from smart grids, but no economic benefits from their introduction.
4.2. Smart Cities
Cities already account for more than half of the global population, and their share is still rising. Over 70% of global GDP is attributed to cities, and their share of global energy use and CC emissions is likely similar under ESS accounting [23]. Therefore, the energy savings from cities are vital for global sustainability, and this subsection has cities as its focus. Longo et al. [67] analyzed the energy savings possible by converting a ‘traditional house’ built in 1968 to a smart house. Their modeled results showed that energy savings of around 48% were possible, but much of this resulted from the replacement of the original domestic appliances with more energy-efficient models.
Humayun et al. [68] pointed out that the many interconnected devices and sensors SCs use require significant energy for their operation. If overall net energy savings are to result from smart city operation, energy optimization is needed. It is not enough to optimize energy consumption in an individual smart home, as in the study by Longo et al., or even in all of a city’s buildings. The authors proposed the overall optimization of ‘four key dimensions of smart cities including street lights, buildings and street billboards, smart homes, and smart parking’ is required. Thus, energy and GHG reductions, specifically from ‘smart street lighting’, have been analyzed by Bachanek [69].
Thornbush and Golubchikov [70] reviewed the history, prospects, and possible barriers for the ‘smart energy city’, which evolved since the 2010s from the smart city concept. Smart energy cities will only become low-carbon cities by the introduction of low-carbon energy sources, as already considered in Section 4.1.
Kim and colleagues [71] wrote a recent review on energy savings from smart homes and smart cities overall. As with other studies on energy savings, including those reviewed here, they found that the savings are hypothetical, as SCs and smart homes have not been implemented at scale. Their review also discussed three important barriers to implementation, which are the difficulties facing interoperability (different hardware and software elements are not always compatible or capable of interconnection); flexibility (the extent to which the grid can adapt to variations in either output or demand); and decentralization (risk from malicious attacks are greater for centralized grid management systems than decentralized ones). Such barriers will delay their implementation, and consequently any CC mitigation benefits that such innovations may produce.
In the rest of this subsection, the focus is on transport, which accounts for a large share of global energy use. Two transport innovations have already been implemented to at least some extent; smart parking and traffic flow optimization, both of which can save energy and emissions for an individual trip, but could lead to increased energy use and emissions from a system viewpoint. This occurs because of well-known feedback effects.
Smart transport requires both smart vehicles and smart infrastructure. Here, the potential for energy/GHG reductions from electric vehicles (EVs) and fully automated vehicles (AVs), together with vehicle-to-grid (V2G) technologies, are first discussed, followed by a very different approach, travel substitution by ICT. EVs do not need ICT to function, as Evs have been around for more than a century. The sale of EVs will doubtless be helped, now that the EU has formally banned the sale of internal combustion engine vehicles after year 2035 [72]. Nevertheless, controversy exists as to whether EVs save energy/GHGs compared with conventional vehicles [73]. Of course, at a regional level, EVs can reduce CO2 emissions if the grid has a high share of RE. From a system viewpoint, however, RE electricity input into non-transport uses is correspondingly reduced. Only when nearly all electricity comes from RE will overall CO2 reductions occur.
The introduction of V2G technology would enable connected EVs to help level out peak electricity by storing excess electricity from the grid at times of low demand, and supplying electricity at times of high demand. Cars are parked about 95% of the time; if electric, their stored battery energy could be used [74]. Although the V2G concept has been around since the early 1990s, it has not been adopted, although trials have been undertaken in a number of countries.
Proponents have claimed that fully automated vehicles (AVs) (vehicles at level 5, the highest in the Society of Automotive Engineers (SAE) classification system) can not only help environmental sustainability, but also greatly reduce road collisions, cutting both human casualty numbers and costs. These two advantages are related, since most road collisions have human error as a component. Driverless SAE level 5 AVs can dispense with present safety equipment, reducing vehicle weight. Further energy reductions are possible because the steering mechanism and brake and accelerator controls can also be dispensed with. Furthermore, AVs, even at lower than SAE level 5, can travel in platoons, where the close spacing reduces overall wind drag (as well as saving road space). It is assumed that AVs would be EVs.
An important question is whether travel would increase or decrease if level 5 AVs generally replaced conventional driver-operated vehicles. AVs would allow those presently unable to obtain licenses (because of age or disability) to ‘drive’ vehicles, which would tend to increase overall travel. However, it is likely that SAE level 5 AVs will ever come into general use [75], although lower levels of automation (which still need a driver) are already common.
Another way in which ICT could potentially improve transport sustainability is by replacing physical travel with communications. Nilles, as early as 1976 [76], discussed the possibility of telecommuting. Well before Internet use became widespread, telecommuting was possible as long as target workers had a home computer. The potential for using modern ICT was seen during COVID-19 lockdowns, when physical travel was restricted. Global air travel, for example, fell from 8.5 trillion revenue passenger-km (RPK) to only 2.8 trillion RPK in 2020 [8]. Car travel fell by a much smaller percentage, but was sufficient to produce notably less-polluted cities [77]. In the US at least, road traffic levels have now passed 2019 levels; the decline was not sustained once travel restrictions were lifted [8]. This suggests that large travel reductions can only be sustained in the presence of strong government policies. This issue is further discussed in Section 6.
Chen and colleagues [78] discussed the conditions under which smart transport can yield net energy savings. Firstly, transport users must change their behavior so that vehicular travel is reduced overall, and passenger-km (p-k) per MJ is improved by modal shift or fuel better energy efficiency. Travelers could also ‘change to a less-congested route, change their departure time, or drive less aggressively’. They presented findings from a number of smart transport cities that showed actually-obtained or potential energy savings from various ICT innovations. However, smart transport must result in large savings in overall transport energy for it to become an important part of urban sustainability.
Overall, the conclusion is that while there are possibly hundreds of cities that label themselves as smart, little evidence is available to show that they use less energy per capita than comparable ‘non-smart’ cities. A further point is the need to assess whether those smart cities that currently use less energy per capita than others also used less energy before they were considered ‘smart’. The only ICT innovation that could potentially produce large cuts in energy use is travel substitution, and this would only do so with strong policy support.
5. The Need for Global Equity
Global inequality was briefly discussed in Section 3 as a reason for the existing strong correlation between GDP and atmospheric CO2 levels. This section argues for the need for global and national equity in any proposed solutions to global sustainability challenges. The UN’s Sustainable Development Goals (SDGs) have been widely promoted as a means of tackling global inequity. However, as Hickel [79] has shown, these are sometimes contradictory, suggesting that achieving both equity and sustainability will not be easy.
Kartha and colleagues [80] showed that globally, at the household level, carbon emissions are very unevenly distributed; in 2015, the top household decile accounted for 49% of carbon emissions, and the bottom five household deciles only for 7%. Similarly, Moriarty and Honnery [8] showed that when ranked by wealth, the poorest 50% of the global population only generate 9% of global nominal GDP, and account for 16% of energy-related global GHG emissions. Table 2 shows CO2 emissions per capita at the national level for selected countries for the year 2019. The highest emitting country has an annual CO2/capita that is more than 200 times larger than the lowest [36]. One reason for this is that some 940 million people, or 13% of the global population, have no access to electricity at all [81].
In the 1950s, the present OECD countries, particularly the US, dominated global emissions. Currently, the OECD countries directly produce only one third of global energy-related emissions [36,37], and the leading emitters by far are hydrocarbon-exporting OPEC nations (Table 2). China, which has overtaken the US as the world’s leading emitter, is building half of the planet’s new coal power stations [82]. France’s emissions are slightly below the global average (Table 2). Accounting for embodied energy imports would increase this figure; on the other hand, factoring in emissions from (especially tropical) deforestation would tend to lower it, as most OECD countries, unlike much of the tropics, are gaining in forested area. However, CO2 has a long lifetime in the atmosphere, so cumulative emissions, which are predominantly from OECD countries, are important from an equity viewpoint.
This inequity will make the task of making deep reductions in carbon emissions in a short time available even more difficult. Countries with presently low carbon emissions per capita are really doing the most to avert CC; if their per capita emissions were at the global 2019 level of about 4.4 t CO2/capita—let alone the levels in the US or some Gulf states—annual global emissions and resulting temperature increases would be much higher than at present. The important challenge is to allow presently low-emitting countries to increase their energy use and living standards while maintaining their low emissions profile. This can be achieved if their rising energy use comes from low-carbon RE sources.
Carbon taxes, which are already implemented to a limited extent in a number of countries, are seen as an effective means of cutting carbon emissions. One difficulty is that if they are high enough to be effective, the burden will fall disproportionally on lower-income households, who spend a higher proportion of their household expenditure on energy, as shown for selected OECD countries in Table 3. Recent quintile figures are not available for the US, but Drehobl et al. [83] reported from their survey that ‘Low-income households spend three times more of their income on energy costs compared to the median spending of non-low-income households (8.1% versus 2.3%)’. Table 3 (and data for all OECD countries [36]) also shows that higher prices for domestic energy (and other energy sectors) reduce average per capita primary energy use.
One proposed approach for improving global equity is through a redistribution of some of the carbon taxes collected in high-income countries to low-income countries. The problem is to devise ways for this transfer that do not lead to a big rise in emissions from the recipient countries.
To sum up the findings of this section, global equity in income is urgently needed, but it will not necessarily make achieving global CO2 reduction goals any easier. Given their high share of accumulated atmospheric CO2, the core OECD countries must take the lead in emissions reductions. Carbon taxes in OECD countries are likely to be inequitable (see Table 3), so it may be better if non-market policies, such as much-lower speed limits and parking restrictions for private transport, are implemented.
6. Discussion and Conclusions
The Earth now faces a number of inter-related challenges to global sustainability, but recent decades have witnessed inaction on CC. As Stoddard and colleagues [87] put it in their review: ‘Since the first IPCC report was published in 1990, more anthropogenic fossil CO2 has been released into the atmosphere than previously throughout all of human history’. Dyke et al. [88] argued that an important reason for this climate inaction is the promotion of technologies, such as the various CDR approaches, which—if successfully implemented—would allow solutions to be deferred to the future. The result of this folly is that we now have a very limited time left for effective action. Furthermore, solutions must also factor in global inequality and rising international tensions, as well as the other challenges to global sustainability.
The key points from the discussion in earlier sections can be summarized as follows:
- A global approach is needed to assess decoupling of GDP from energy use and emissions. A wider approach is also needed when evaluating urban sustainability, as benefits at the individual household or traveler level may be negated at the city-wide level.
- There is little evidence at the global level for the absolute decoupling of GDP from atmospheric CO2 levels, energy use, or resources. Absolute decoupling could prove even more difficult to achieve in the future, given the likely availability problems for key metals, as well as rising energy needs as ore grades decline and mining wastes rise.
- There is also currently little evidence for any significant reductions in energy or carbon emissions from ICT approaches, including smart grids and smart transport. Furthermore, any potential benefits of SGs will be reduced if the replacement of FFs by mainly intermittent RE is too slow. With all of the effort and money going into ICT approaches to improving sustainability, we may well have been putting our efforts in the wrong place.
- Out of all the ICT approaches discussed in this review, only the replacement of transport by ICT has the potential for carbon savings; however, this requires supporting policies, as evidenced by the lockdowns induced by COVID-19 in 2020.
- Given the risks to privacy and security raised by the use of AI and the IoT, with its millions of sensors, it seems only prudent to examine whether comparable or even larger reductions in energy use and emissions can be obtained by simpler methods. For transport, one possibility is to focus on accessibility, not (vehicular) mobility [25].
- Carbon emissions at the household level are very unequally distributed, largely as a consequence of income inequity, which is still increasing globally [80]. Large global emission reductions are essential, but must be achieved while effecting increased carbon and income equity at the household level.
- Given the present and likely future absence of global energy decoupling, and the failure of ICT approaches to produce significant net energy or carbon savings, the conclusion is that global energy use must be cut for a sustainable future. In the short term, carbon reductions must come from the high-emitting countries through reductions in energy use, and ensuring that low-energy countries use non-carbon sources for new energy development. In the longer term, further reductions will come from decarbonizing energy sources in all countries, but shifting to non-carbon sources will take time.
Although carbon emissions today are dominated by anthropogenic emissions—those from FF combustion and deforestation—this could change in the coming decades if global warming continues. Emissions from permafrost (both CO2 and CH4) and from forest dieback (caused by drought, pests, or fires from lightning strikes) could come to dominate climate forcing. As Natali et al. [89] argued, our climate mitigation efforts could be undermined by permafrost carbon feedbacks. Even if atmospheric CO2 levels continue to rise because of anthropogenic emissions and breach the 1.5 °C limit, the world must still work to avoid levels which lead to such permafrost feedbacks.
This review has argued that none of the existing technical solutions, including use of ICT-based approaches, are likely to produce emissions reductions that are simultaneously timely, significant, and equitable. As has been shown, absolute decoupling of GDP and emissions has not occurred, and is probably even less likely in the future. The only solution would seem to be to reduce global GDP, and with it the use of energy-intensive devices and practices, especially in the high-income countries. As noted in Appendix A, despite the role of population growth in environmental problems, reducing its impact lies well outside the time scale of the problems at hand.
An increasing number of researchers have come to the same conclusion, including Wiedmann et al. [90] with their ‘Scientists’ warning on affluence’, degrowth writers such as Kallis [91], and others such as Hickel and Hallegatte [92] and Hickel et al. [93]. Given the support for economic growth from across the political spectrum, there is no guarantee that voluntary GDP reductions will be implemented. Instead, it is possible that the global economy will shrink because of catastrophic CC and other environmental damages.
The limitations of this study essentially arise from uncertainty about the future. Another limitation arises because of uncertainty concerning SG benefits resulting from lack of agreement over their measurement. It is possible, although the authors regard it as unlikely, that a new technical breakthrough or RE source will deliver abundant net green energy. Thus, future research will need to assess the likelihood of these possible breakthroughs. If they have only a remote chance of success, research must focus on non-technologically based means of reductions in carbon emissions and environmental harms in general, as discussed in the previous paragraph.
Author Contributions
Conceptualization, P.M. and D.H.; methodology, P.M. and D.H.; investigation, P.M.; data curation, D.H.; writing—original draft preparation, P.M.; writing—review and editing, D.H.; visualization, D.H.; project administration, P.M. All authors have read and agreed to the published version of the manuscript.
Funding
This research received no external funding.
Institutional Review Board Statement
Not applicable.
Informed Consent Statement
Not applicable.
Data Availability Statement
The sources for each table and graph provide the data.
Conflicts of Interest
The authors declare no conflict of interest.
Nomenclature
| AV | automated vehicle |
| BECCS | bioenergy with carbon capture and storage |
| BD | Big data |
| BTS | Bureau of Transportation Statistics |
| CC | climate change |
| CCS | carbon capture and storage |
| CDR | carbon dioxide removal |
| CH4 | methane |
| CO2 | carbon dioxide |
| CO2-eq | carbon dioxide equivalent |
| EIA | Energy Information Administration |
| EJ | exajoule (1018 joules) |
| EROI | energy return on investment |
| ESS | Earth System Science |
| FF | fossil fuels |
| GDP | gross domestic product |
| GHG | greenhouse gas |
| GJ | gigajoule (109 joules) |
| Gt | gigaton = 109 tons |
| GW | gigawatt (109 Watts) |
| H2 | hydrogen |
| HDI | human development index |
| IAMs | integrated assessment models |
| ICT | information and communication technology |
| IEA | International Energy Agency |
| IoT | Internet of Things |
| IPCC | Intergovernmental Panel on Climate Change |
| MJ | megajoule (106 joules) |
| Mt | megaton (106 tons) |
| OECD | Organization for Economic Cooperation and Development |
| OPEC | Organization of the Petroleum Exporting Countries |
| Ppm | parts per million (atmospheric) |
| p-k | passenger-km |
| PPP | purchase parity pricing |
| PV | photovoltaic |
| RE | renewable energy |
| RPK | revenue passenger-km |
| SAE | Society of Automotive Engineers |
| SDG | sustainable development goal |
| SG | smart grid |
| t CO2/cap | tons CO2 per capita |
| TWh | terawatt-hour (1012 watt-hrs) |
| USD | US dollars |
| V2G | vehicle-to-grid |
Appendix A
As noted in the text, there exists a strong linear correlation between atmospheric CO2 levels and GDP (Figure A1). The role that population and population growth play in determining atmospheric CO2 levels is worth considering here, given that GDP is a quantity that is derived from human activity. The 1992 paper of distinguished demographer John Bongaarts provides valuable early insight into the relative importance of population and wealth as drivers of global CO2 emissions [94]. Bongaarts predicted that population growth would contribute 50% towards the growth in CO2 emissions over the period 1988–2025, falling to 22% over the period 2025–2100 as population growth declined. He also found that over time, population growth in under-developed countries contributed more to CO2 emissions than population growth in developed countries. It is worthy of note that in his paper he quoted an EPA study from 1990 on future emissions growth that predicted for their “no response” scenario that by 2025 atmospheric CO2 would be 440 ppm, resulting in an average global atmospheric temperature rise of 1.5 °C. An IPCC study quoted by Bagaart predicted similar results. Given how close these predictions are to current values further reinforces the dominance that primary drivers have on climate change when their trends remain over time.
Figure A1.
Atmospheric CO2 concentration measured at Mauna Loa (ppm) [95] against global population in billions. The trend line is developed from Figure 2a with extrapolation based on the UN Medium Fertility Variant population growth model [96] over the period 2023–2050. Also shown are key dates of IPCC Climate Assessment Reports and the critical CO2 concentration range.

Commencing from 1958, Figure A1 plots annual average atmospheric CO2 levels using the Keeling Curve data from Mauna Loa [95] against world population. The rise in CO2 levels with increasing population is very clear, although the relationship between these is more complex than the simple linear trend observed for CO2 levels with GDP. Also shown in the figure are critical dates in the delivery of UN IPCC Climate Assessment Reports since the first final report in 1992. As noted in the body of this review, these reports have continued to issue warnings about the rising levels of atmospheric CO2, but they appear to have had little effect; CO2 continues to rise, and at an increasing rate. The figure also shows that the generally agreed range of atmospheric CO2 concentration we must not exceed by 2050, if we are to limit global heating, is less than 1.5 to 2 °C. It is evident that we are already near the mid-point of this critical range.
To simplify the correlation between population and atmospheric CO2, we recast the data in Figure A1 as the annual growth rate in atmospheric CO2 levels per capita; this is shown in Figure A2. When expressed in this way, a linear correlation is found between time and the rate of growth in CO2 (bpm/capita).
It is evident from the data in Figure A2 that although it is declining, population growth has exceeded the rate of growth of atmospheric CO2 levels up to the present. Should the trend continue to 2050, the growth in atmospheric CO2 levels could be expected to exceed the growth in population by 2042. Similar to Bongaarts’ findings, this shift provides evidence of the increasing emissions from non-OECD countries as they increase their population relative to OECD countries, as well as their share of GDP that is powered by fossil fuels, notwithstanding the existing inequity between the share of OECD and non-OECD countries in GDP (and consequently GHG emissions) noted in Section 5.
Applying the trend shown in Figure A2 to the population data of Figure A1 yields the trend line in Figure A1. Extending this trend using the UN Median Fertility Variant population growth model to 2050 [96] yields the atmospheric CO2 level from the present to 2050. Thus, should the trend that we have seen since 1958 continue, we could expect atmospheric CO2 levels to exceed the climate stabilization range by around 2035. By 2050, CO2 concentrations could exceed 490 ppm.
Figure A2.
Annual change in atmospheric CO2 concentration per capita over the period 1958–2022. Sources: as for Figure A1. The trend line is a linear fit to data.
Figure A2.
Annual change in atmospheric CO2 concentration per capita over the period 1958–2022. Sources: as for Figure A1. The trend line is a linear fit to data.

Altering trends in population requires multigenerational timescales. These timescales are much longer than the time we have to reduce GHG emissions and their concentration in the atmosphere to the levels that are required to limit the rise in average global temperature by 1.5 to 2 °C. As we note in this review, what remains possible is for us to alter human activity such that far less GHGs are emitted through a rapid shift to reduced-consumption life styles, mainly in the high energy-consuming countries. Countries with low energy use will need to be powered by an increasing use of renewable energy sources that have a low environmental impact and a high EROI.
References
- Ripple, W.J.; Wolf, C.; Gregg, J.W.; Levin, K.; Rockström, J.; Newsome, T.M.; Betts, M.G.; Huq, S.; Law, B.E.; Kemp, L.; et al. World scientists’ warning of a climate emergency 2022. Bioscience 2022, 72, 894–898. [Google Scholar] [CrossRef]
- Rising, J.; Tedesco, M.; Piontek, F.; Stainforth, D.A. The missing risks of climate change. Nature 2022, 610, 1149–1151. [Google Scholar] [CrossRef] [PubMed]
- Steel, D.; DesRoches, C.T.; Mintz-Woo, K. Climate change and the threat to civilization. Proc. Natl. Acad. Sci. USA 2022, 119, e2210525119. [Google Scholar] [CrossRef] [PubMed]
- Bradshaw, C.J.A.; Ehrlich, P.R.; Beattie, A.; Ceballos, G.; Crist, E.; Diamond, J.; Dirzo, R.; Ehrlich, A.H.; Harte, J.; Harte, M.E.; et al. Underestimating the challenges of avoiding a ghastly future. Front. Conserv. Sci. 2021, 1, 615419. [Google Scholar] [CrossRef]
- Dirzo, R.; Ceballos, G.; Ehrlich, P.R. Circling the drain: The extinction crisis and the future of humanity. Phil. Trans. R. Soc. B 2022, 377, 20210378. [Google Scholar] [CrossRef]
- Naeem, S.; Lu, Y.; Jackson, J. Curtailing the collapse of the living world. Sci. Adv. 2022, 8, eadf9317. [Google Scholar] [CrossRef]
- Dryden, H.; Duncan, D. Climate disruption caused by a decline in marine biodiversity and pollution. IJECC 2022, 12, 3414–3436. [Google Scholar] [CrossRef]
- Moriarty, P.; Honnery, D. Review: Renewable energy in an increasingly uncertain future. Appl. Sci. 2023, 13, 388. [Google Scholar] [CrossRef]
- World Economic Forum. Plastic Pollution is a Public Health Crisis. How Do We Reduce Plastic Waste? WEF, Cologny, Switzerland. 2022. Available online: https://www.weforum.org/agenda/2022/07/plastic-pollution-ocean-circular-economy/ (accessed on 3 November 2022).
- Gross, M. Pollution passes boundaries. Curr. Biol. 2022, 32, R141–R157. [Google Scholar] [CrossRef]
- Larsson, D.G.J.; Flach, C.-F. Antibiotic resistance in the environment. Nat. Rev. Microbiol. 2022, 20, 257–269. [Google Scholar] [CrossRef]
- Steffen, W.; Richardson, K.; Rockström, J.; Cornell, S.E.; Fetzer, I.; Bennett, E.M.; Biggs, R.; Carpenter, S.R.; de Vries, W.; de Wit, C.A.; et al. Planetary boundaries: Guiding human development on a changing planet. Science 2015, 347, 1259855. [Google Scholar] [CrossRef] [PubMed] [Green Version]
- Steffen, W.; Broadgate, W.; Deutsch, L.; Gaffney, O.; Ludwig, C. The trajectory of the Anthropocene: The Great Acceleration. Anthrop. Rev. 2015, 2, 1–18. [Google Scholar] [CrossRef]
- Steffen, W.; Rockström, J.; Richardson, K.; Lenton, T.M.; Folke, C.; Liverman, D.; Summerhayes, C.P.; Barnosky, A.D.; Cornell, S.E.; Crucifix, M.; et al. Trajectories of the Earth system in the Anthropocene. Proc. Natl. Acad. Sci. USA 2018, 115, 8252–8259. Available online: http://www.pnas.org/cgi/doi/10.1073/pnas.1810141115 (accessed on 18 December 2022). [CrossRef] [PubMed] [Green Version]
- Lade, S.J.; Steffen, W.; de Vries, W.; Carpenter, S.R.; Donges, J.F.; Gerten, D.; Hoff, H.; Newbold, T.; Richardson, K.; Rockström, J. Human impacts on planetary boundaries amplified by Earth system interactions. Nat. Sustain. 2020, 3, 119–128. [Google Scholar] [CrossRef]
- Brodie, J.F.; Watson, J.E.M. Human responses to climate change will likely determine the fate of biodiversity. Proc. Natl. Acad. Sci. USA 2023, 120, e2205512120. [Google Scholar] [CrossRef]
- Kemp, L.; Xu, C.; Depledge, J.; Ebi, K.L.; Gibbins, G.; Kohler, T.A.; Rockström, J.; Scheffer, M.; Schellnhuber, H.J.; Steffen, W.; et al. Climate endgame: Exploring catastrophic climate change scenarios. Proc. Natl. Acad. Sci. USA 2022, 119, e2108146119. [Google Scholar] [CrossRef]
- Trout, K.; Muttitt, G.; Lafleur, D.; Van de Graaf, T.; Mendelevitch, R.; Mei, L.; Meinshausen, M. Existing fossil fuel extraction would warm the world beyond 1.5 °C. Environ. Res. Lett. 2022, 17, 064010. Available online: https://iopscience.iop.org/article/10.1088/1748-9326/ac6228/pdf (accessed on 28 December 2022). [CrossRef]
- Lovins, A.B. How big is the energy efficiency resource? Environ. Res. Lett. 2018, 13, 090401. [Google Scholar] [CrossRef] [Green Version]
- Moriarty, P.; Honnery, D. Renewable energy and energy reductions or solar geoengineering for climate change mitigation? Energies 2022, 15, 7315. [Google Scholar] [CrossRef]
- Davis, S.J.; Lewis, N.S.; Shaner, M.; Aggarwal, S.; Arent, D.; Azevedo, I.L.; Benson, S.M.; Thomas Bradley, T.; Brouwer, J.; Chiang, Y.-M.; et al. Net-zero emissions energy systems. Science 2018, 360, eaas9793. [Google Scholar] [CrossRef] [Green Version]
- Jacobson, M.Z.; Delucchi, M.A.; Bauer, Z.A.F.; Goodman, S.C.; Chapman, W.E.; Cameron, M.A.; Bozonnat, C.; Chobadi, L.; Clonts, H.A.; Enevoldsen, P.; et al. 100% clean and renewable wind, water, and sunlight all-sector energy roadmaps for 139 countries of the world. Joule 2017, 1, 108–121. [Google Scholar] [CrossRef] [Green Version]
- Moriarty, P.; Honnery, D. Feasibility of a 100% global renewable energy system. Energies 2020, 13, 5543. [Google Scholar] [CrossRef]
- Moriarty, P.; Honnery, D. The limits of renewable energy. AIMS Energy 2021, 9, 812–829. [Google Scholar] [CrossRef]
- Moriarty, P.; Honnery, D. Switching Off: Meeting Our Energy Needs in a Constrained Future; Springer Briefs on Energy; Springer: Berlin/Heidelberg, Germany, 2022; 90p, ISSN 2191-5520. [Google Scholar]
- Fearnside, P.M. Hydropower: Don’t waste climate money on more dams. Nature 2019, 568, 33. Available online: https://www.nature.com/articles/d41586-019-01057-1 (accessed on 28 December 2022). [CrossRef] [Green Version]
- Moriarty, P.; Honnery, D. Can renewable energy power the future? Energy Pol. 2016, 93, 3–7. [Google Scholar] [CrossRef]
- O’Sullivan, M.; Gravatt, M.; Popineau, J.; O’Sullivan, J.; Mannington, W.; McDowell, J. Carbon dioxide emissions from geothermal power plants. Renew. Energy 2021, 175, 990–1000. [Google Scholar] [CrossRef]
- Intergovernmental Panel on Climate Change (IPCC). Climate Change 2021: The Physical Science Basis; AR6, WG1; CUP: Cambridge, UK, 2021. [Google Scholar]
- Intergovernmental Panel on Climate Change (IPCC). Climate Change 2022: Mitigation of Climate Change. 2022. Available online: https://www.ipcc.ch/report/ar6/wg3/ (accessed on 12 July 2022).
- International Energy Agency (IEA). Global Energy Review: CO2 Emissions in 2021; IEA: Paris, France, 2022; Available online: https://www.iea.org/reports/global-energy-review-co2-emissions-in-2021-2 (accessed on 26 July 2022).
- Moriarty, P.; Honnery, D. New energy technologies: Microalgae, photolysis and airborne wind turbines. Science 2019, 1, 43. [Google Scholar] [CrossRef] [Green Version]
- Hand, E. Hidden hydrogen. Science 2023, 379, 630–636. Available online: https://www.science.org/content/article/hidden-hydrogen-earth-may-hold-vast-stores-renewable-carbon-free-fuel (accessed on 2 April 2023). [CrossRef]
- Lapi, A.; Chatzimpiros, P.; Raineau, L.; Prinzhofer, A. System approach to natural versus manufactured hydrogen: An interdisciplinary perspective on a new primary energy source. Int. J. Hydrogen Energy 2022, 47, 21701–21712. [Google Scholar] [CrossRef]
- Zgonnik, V. The occurrence and geoscience of natural hydrogen: A comprehensive review. Earth-Sci. Rev. 2020, 203, 103140. [Google Scholar] [CrossRef]
- International Energy Agency (IEA). Key World Energy Statistics 2021; IEA/OECD: Paris, France, 2021. [Google Scholar]
- BP. BP Statistical Review of World Energy 2022; BP: London, UK, 2022; Available online: https://www.bp.com/content/dam/bp/business-sites/en/global/corporate/pdfs/energy-economics/statistical-review/bp-stats-review-2022-full-report.pdf (accessed on 26 July 2022).
- International Energy Agency (IEA). World Energy Outlook 2022; IEA/OECD: Paris, France, 2022; Available online: https://www.iea.org/topics/world-energy-outlook (accessed on 2 April 2023).
- Organization of the Petroleum Exporting Countries (OPEC). 2022 OPEC World Oil Outlook; OPEC: Vienna, Austria, 2022; Available online: http://www.opec.org (accessed on 2 April 2023).
- Bureau of Transportation Statistics (BTS). National Transportation Statistics 2021; BTS: Tokyo, Japan, 2021. Available online: https://www.bts.gov/sites/bts.dot.gov/files/2021-12/NTS-50th-complete-11-30-2021.pdf (accessed on 1 March 2023).
- Wikipedia. Internet of Things. 2023. Available online: https://en.wikipedia.org/wiki/Internet_of_things (accessed on 20 January 2023).
- Moriarty, P. Advanced communication and computational technologies in a sustainable urban context: Smart grids, smart cities and smart health. In Smart Grid 3.0: Computational and Communication Technologies; Bhargav Appasani, B., Bizon, N., Eds.; Springer: Berlin/Heidelberg, Germany, 2023. [Google Scholar]
- Haberl, H.; Wiedenhofer, D.; Virag, D.; Kalt, G.; Plank, B.; Brockway, P.; Fishman, T.; Hausknost, D.; Krausmann, F.; Leon-Gruchalski, B.; et al. A systematic review of the evidence on decoupling of GDP, resource use and GHG emissions, part II: Synthesizing the insights. Environ. Res. Lett. 2020, 15, 065003. [Google Scholar] [CrossRef]
- Ritchie, H. A Number of Countries Have Decoupled Economic Growth from Energy Use, Even if We Take Offshored Production into Account. 2021. Available online: https://ourworldindata.org/energy-gdp-decoupling (accessed on 2 April 2023).
- Sanye-Mengual, E.; Secchi, M.; Corrado, S.; Beylot, A.; Sala, S. Assessing the decoupling of economic growth from environmental impacts in the European Union: A consumption-based approach. J. Cleaner Prod. 2019, 236, 117535. [Google Scholar] [CrossRef] [PubMed]
- Parrique, T.; Barth, J.; Briens, F.; Kerschner, C.; Kraus-Polk, A.; Kuokkanen, A.; Spangenberg, J.H. Decoupling Debunked: Evidence and Arguments Against Green Growth as a Sole Strategy for Sustainability. 2019. Available online: https://eeb.org/wp-content/uploads/2019/07/Decoupling-Debunked.pdf (accessed on 2 April 2023).
- Niebuhr, B.B.; Sant’Ana, D.; Panzacchi, M.; van Moorter, B.; Sandström, P.; Ronaldo, G.; Morato, R.G.; Skarin, A. Renewable energy infrastructure impacts biodiversity beyond the area it occupies. Proc. Natl. Acad. Sci. USA 2022, 119, e2208815119. [Google Scholar] [CrossRef] [PubMed]
- World Bank. GDP, PPP (Constant 2017 International $); World Bank: New York, NY, USA, 2023; Available online: https://data.worldbank.org/indicator/NY.GDP.MKTP.PP.KD (accessed on 20 March 2023).
- Lin, D.; Wambersie, L.; Wackernagel, M. Estimating the Date of Earth Overshoot Day. 2022. Available online: https://www.overshootday.org/content/uploads/2022/06/Earth-Overshoot-Day-2022-Nowcast-Report.pdf (accessed on 14 November 2022).
- Statista. Historic Average Carbon Dioxide (CO2) Levels in the Atmosphere Worldwide From 1959 to 2021 (In Parts Per Million); Statista: 2023. Available online: https://www.statista.com/statistics/1091926/atmospheric-concentration-of-co2-historic/ (accessed on 25 February 2023).
- Wikipedia. Motor Vehicle. 2023. Available online: https://en.wikipedia.org/wiki/Motor_vehicle (accessed on 28 February 2023).
- Airbus. Global Market Forecast; Airbus: Toulouse, France, 2022; Available online: https://www.airbus.com/en/products-services/commercial-aircraft/market/global-market-forecast (accessed on 28 August 2022).
- Garrett, T.J.; Grasselli, M.; Keen, S. Past world economic production constrains current energy demands: Persistent scaling with implications for economic growth and climate change mitigation. PLoS ONE 2020, 15, e0237672. Available online: https://journals.plos.org/plosone/article?id=10.1371/journal.pone.0237672 (accessed on 5 November 2022). [CrossRef] [PubMed]
- Hall, C.A.S.; Lambert, J.G.; Balogh, S.B. EROI of different fuels and the implications for society. Energy Pol. 2014, 64, 141–152. [Google Scholar] [CrossRef] [Green Version]
- Lawton, G. Net zero’s dirty secret. New Sci. 2021, 252, 38–43. [Google Scholar] [CrossRef]
- Fizaine, F.; Court, V. Energy expenditure, economic growth, and the minimum EROI of society. Energy Pol. 2016, 95, 172–186. [Google Scholar] [CrossRef]
- Capellán-Pérez, I.; de Castro, C.; González, L.J.M. Dynamic Energy Return on Energy Investment (EROI) and material requirements in scenarios of global transition to renewable energies. Energy Strategy Rev. 2019, 26, 100399. [Google Scholar] [CrossRef]
- Azadi, M.; Northey, S.A.; Ali, S.H.; Edraki, M. Transparency on greenhouse gas emissions from mining to enable climate change mitigation. Nat. Geosci. 2020, 13, 100–104. [Google Scholar] [CrossRef]
- Franssen, T.; de Wilde, M. A clean energy future isn’t set in stone. Nat. Geosci. 2021, 14, 636–637. [Google Scholar] [CrossRef]
- International Energy Agency (IEA). Global Air Conditioner Stock, 1990–2050. IEA 2022. Available online: https://www.iea.org/data-and-statistics/charts/global-air-conditioner-stock-1990-2050. (accessed on 2 March 2023).
- International Energy Agency (IEA). The Future of Cooling: Opportunities for Energy Efficient Air Conditioning; OECD/IEA: Paris, France, 2018; Available online: https://www.iea.org/reports/the-future-of-cooling (accessed on 2 February 2023).
- Raymond, C.; Matthews, T.; Horton, R.M. The emergence of heat and humidity too severe for human tolerance. Sci. Adv. 2020, 6, eaaw1838. [Google Scholar] [CrossRef]
- Nguyen, D.C.; Ding, M.; Pathirana, P.N.; Seneviratne, A.; Li, J.; Niyato, D.; Dobre, O.; Poor, H.V. 6G Internet of Things: A Comprehensive Survey. 2021. Available online: https://arxiv.org/pdf/2108.04973.pdf (accessed on 12 February 2023).
- Moretti, M.; Djomo, S.N.; Azadi, H.; May, K.; De Vos, K.; Van Passel, S.; Witters, N. A systematic review of environmental and economic impacts of smart grids. Renew. Sustain. Energy Rev. 2017, 68, 888–898. [Google Scholar] [CrossRef]
- Sovacool, B.K.; Hook, A.; Sareen, S.; Geels, F.W. Global sustainability, innovation and governance dynamics of national smart electricity meter transitions. Glob. Environ. Chang. 2021, 68, 102272. [Google Scholar] [CrossRef]
- Ghiasi, M.; Wang, Z.; Mehrandezh, M.; Jalilian, S.; Ghadimi, N. Evolution of smart grids towards the Internet of energy: Concept and essential components for deep decarbonisation. IET Smart Grid 2023, 6, 86–102. [Google Scholar] [CrossRef]
- Longo, M.; Roscia, M.C.; Zanelli, D. Net zero energy of smart house design. In Proceedings of the 2015 International Conference on Clean Electrical Power (ICCEP), Taormina, Italy, 16–18 June 2015. [Google Scholar] [CrossRef]
- Humayun, M.; Alsaqer, M.S.; Jhanjhi, N. Energy optimization for smart cities using IoT. Appl. Artif. Intel. 2022, 36, e2037255. [Google Scholar] [CrossRef]
- Bachanek, K.H.; Tundys, B.; Wi´sniewski, T.; Puzio, E.; Maroušková, A. Intelligent street lighting in a smart city concepts—A direction to energy saving in cities: An overview and case study. Energies 2021, 14, 3018. [Google Scholar] [CrossRef]
- Thornbush, M.; Golubchikov, O. Smart energy cities: The evolution of the city-energy sustainability nexus. Environ. Dev. 2021, 39, 100626. [Google Scholar] [CrossRef]
- Kim, H.; Choi, H.; Kang, J.H.; An, J.; Yeom, S.; Hong, L.T. A systematic review of the smart energy conservation system: From smart homes to sustainable smart cities. Renew. Sustain. Energy Rev. 2021, 140, 110755. [Google Scholar] [CrossRef]
- Thomson, C. Europe Officially Bans New ICE Cars. 2023. Available online: https://www.msn.com/en-au/motoring/news/europe-officially-bans-new-ice-cars/ar-AA17uUvu?ocid=msedgdhp&pc=U531&cvid=c9f3241b3511464f9b74d39958ae1572 (accessed on 15 February 2023).
- Moriarty, P. Electric vehicles can have only a minor role in reducing transport’s energy and environmental challenges. AIMS Energy 2022, 10, 131–148. [Google Scholar] [CrossRef]
- Wikipedia. Vehicle-to-Grid. 2023. Available online: https://en.wikipedia.org/wiki/Vehicle-to-grid (accessed on 9 January 2023).
- Chafkin, M. Even After $100 Billion, Self-Driving Cars Are Going Nowhere; Bloomberg: New York, NY, USA, 2022; Available online: https://www.bloomberg.com/news/features/2022-10-06/even-after-100-billion-self-driving-cars-are-going-nowhere?leadSource=uverify%20wall#xj4y7vzkg (accessed on 14 January 2023).
- Nilles, J.M. Talk is cheaper. IEEE Spectrum 1976, 91–93. [Google Scholar] [CrossRef]
- Venter, Z.S.; Aunan, K.; Chowdhury, S.; Lelieveld, J. COVID-19 lockdowns cause global airpollution declines. Proc. Natl. Acad. Sci. USA 2020, 117, 18984–18990. Available online: https://www.pnas.org/cgi/doi/10.1073/pnas.2006853117 (accessed on 28 December 2022). [CrossRef] [PubMed]
- Chen, Y.; Ardila-Gomez, A.; Frame, G. Achieving energy savings by intelligent transportation systems investments in the context of smart cities. Transp. Res. Pt. D 2017, 54, 381–396. [Google Scholar] [CrossRef]
- Hickel, J. The contradiction of the sustainable development goals: Growth versus ecology on a finite planet. Sustain. Dev. 2019, 27, 873–884. [Google Scholar] [CrossRef]
- Kartha, S.; Kemp-Benedict, E.; Ghosh, E.; Nazareth, A.; Gore, T. The Carbon Inequality Era. Joint Research Report; Stockholm Environment Institute: Stockholm, Sweden, 2020. [Google Scholar]
- Our World in Data. Access to Energy. 2023. Available online: https://ourworldindata.org/energy-access (accessed on 2 March 2023).
- Vaughan, A. China is building more than half of the world’s new coal power plants. New Sci. 2022, 26. Available online: https://www.newscientist.com/article/2317274-china-is-building-more-than-half-of-the-worlds-new-coal-power-plants/ (accessed on 29 April 2022).
- Drehobl, A.; Ross, L.; Ayala, R. How High Are Household Energy Burdens? ACEEE: Washington, DC, USA, 2020; Available online: https://www.aceee.org/sites/default/files/pdfs/u2006.pdf (accessed on 20 January 2023).
- Australian Bureau of Statistics (ABS). 2015–16 Household Expenditure Survey Australia: Summary of Results (Cat No. 65300DO003); ABS: Canberra, Australia, 2017. [Google Scholar]
- Statistics Bureau Japan (SBJ). Japan Statistical Yearbook 2023; Statistics Bureau: Tokyo, Japan, 2023. Available online: https://www.stat.go.jp/english/data/nenkan/72nenkan/index.html (accessed on 18 March 2023).
- Office for National Statistics (ONS). Family Spending Workbook 1: Detailed Expenditure and Trends; ONS: London, UK, 2022. Available online: https://www.ons.gov.uk/peoplepopulationandcommunity/personalandhouseholdfinances/expenditure/datalist?filter=datasets (accessed on 18 March 2023).
- Stoddard, I.; Anderson, K.; Capstick, S.; Carton, W.; Depledge, J.; Facer, K.; Gough, C.; Hache, F.; Hoolohan, C.; Hultman, M.; et al. Three decades of climate mitigation: Why haven’t we bent the global emissions curve? Annu. Rev. Environ. Resour. 2021, 46, 653–689. Available online: https://www.annualreviews.org/doi/pdf/10.1146/annurev-environ-012220-011104 (accessed on 10 March 2023). [CrossRef]
- Dyke, J.; Watson, R.; Knorr, W. Climate Scientists: Concept of Net Zero Is a Dangerous Trap. The Conversation April 21. 2021. Available online: https://theconversation.com/climate-scientists-concept-of-net-zero-is-a-dangerous-trap-157368 (accessed on 7 March 2023).
- Natali, S.M.; Holdren, J.P.; Rogers, B.M.; Treharne, R.; Duffy, P.B.; Pomerance, R.; MacDonald, E. Permafrost carbon feedbacks threaten global climate goals. Proc. Natl. Acad. Sci. USA 2021, 118, e2100163118. [Google Scholar] [CrossRef]
- Wiedmann, T.; Lenzen, M.; Lorenz, T.; Keyßer, L.T.; Steinberger, J.K. Scientists’ warning on affluence. Nat. Comm. 2020, 11, 3107. [Google Scholar] [CrossRef]
- Kallis, G. Limits, ecomodernism and degrowth. Pol. Geog. 2021, 87, 102367. [Google Scholar] [CrossRef]
- Hickel, J.; Hallegatte, S. Can we live within environmental limits and still reduce poverty? Degrowth or decoupling? Dev. Pol. Rev. 2022, 40, e12584. [Google Scholar] [CrossRef]
- Hickel, J.; Brockway, P.; Kallis, G.; Keyßer, L.; Lenzen, M.; Slameršak, A.; Steinberger, J.; Ürge-Vorsatz, D. Urgent need for post-growth climate mitigation scenarios. Nat. Energy 2021, 6, 766–768. [Google Scholar] [CrossRef]
- Bongaarts, J. Population growth and global warming. Pop. Dev. Rev. 1992, 18, 299–319. [Google Scholar] [CrossRef]
- Tans, P.; Keeling, R. Trends in Atmospheric Carbon Dioxide, Mauna Loa CO2 Mean Annual Data; NOAA: Washington, DC, USA, 2023. Available online: https://gml.noaa.gov/ccgg/trends/data.html (accessed on 20 March 2023).
- United Nations (UN). World Population Prospects 2019; UN: New York, NY, USA, 2019; Available online: https://population.un.org/wpp/ (accessed on 24 November 2022).
Figure 1.
Breakdown of papers selected for inclusion in this review.
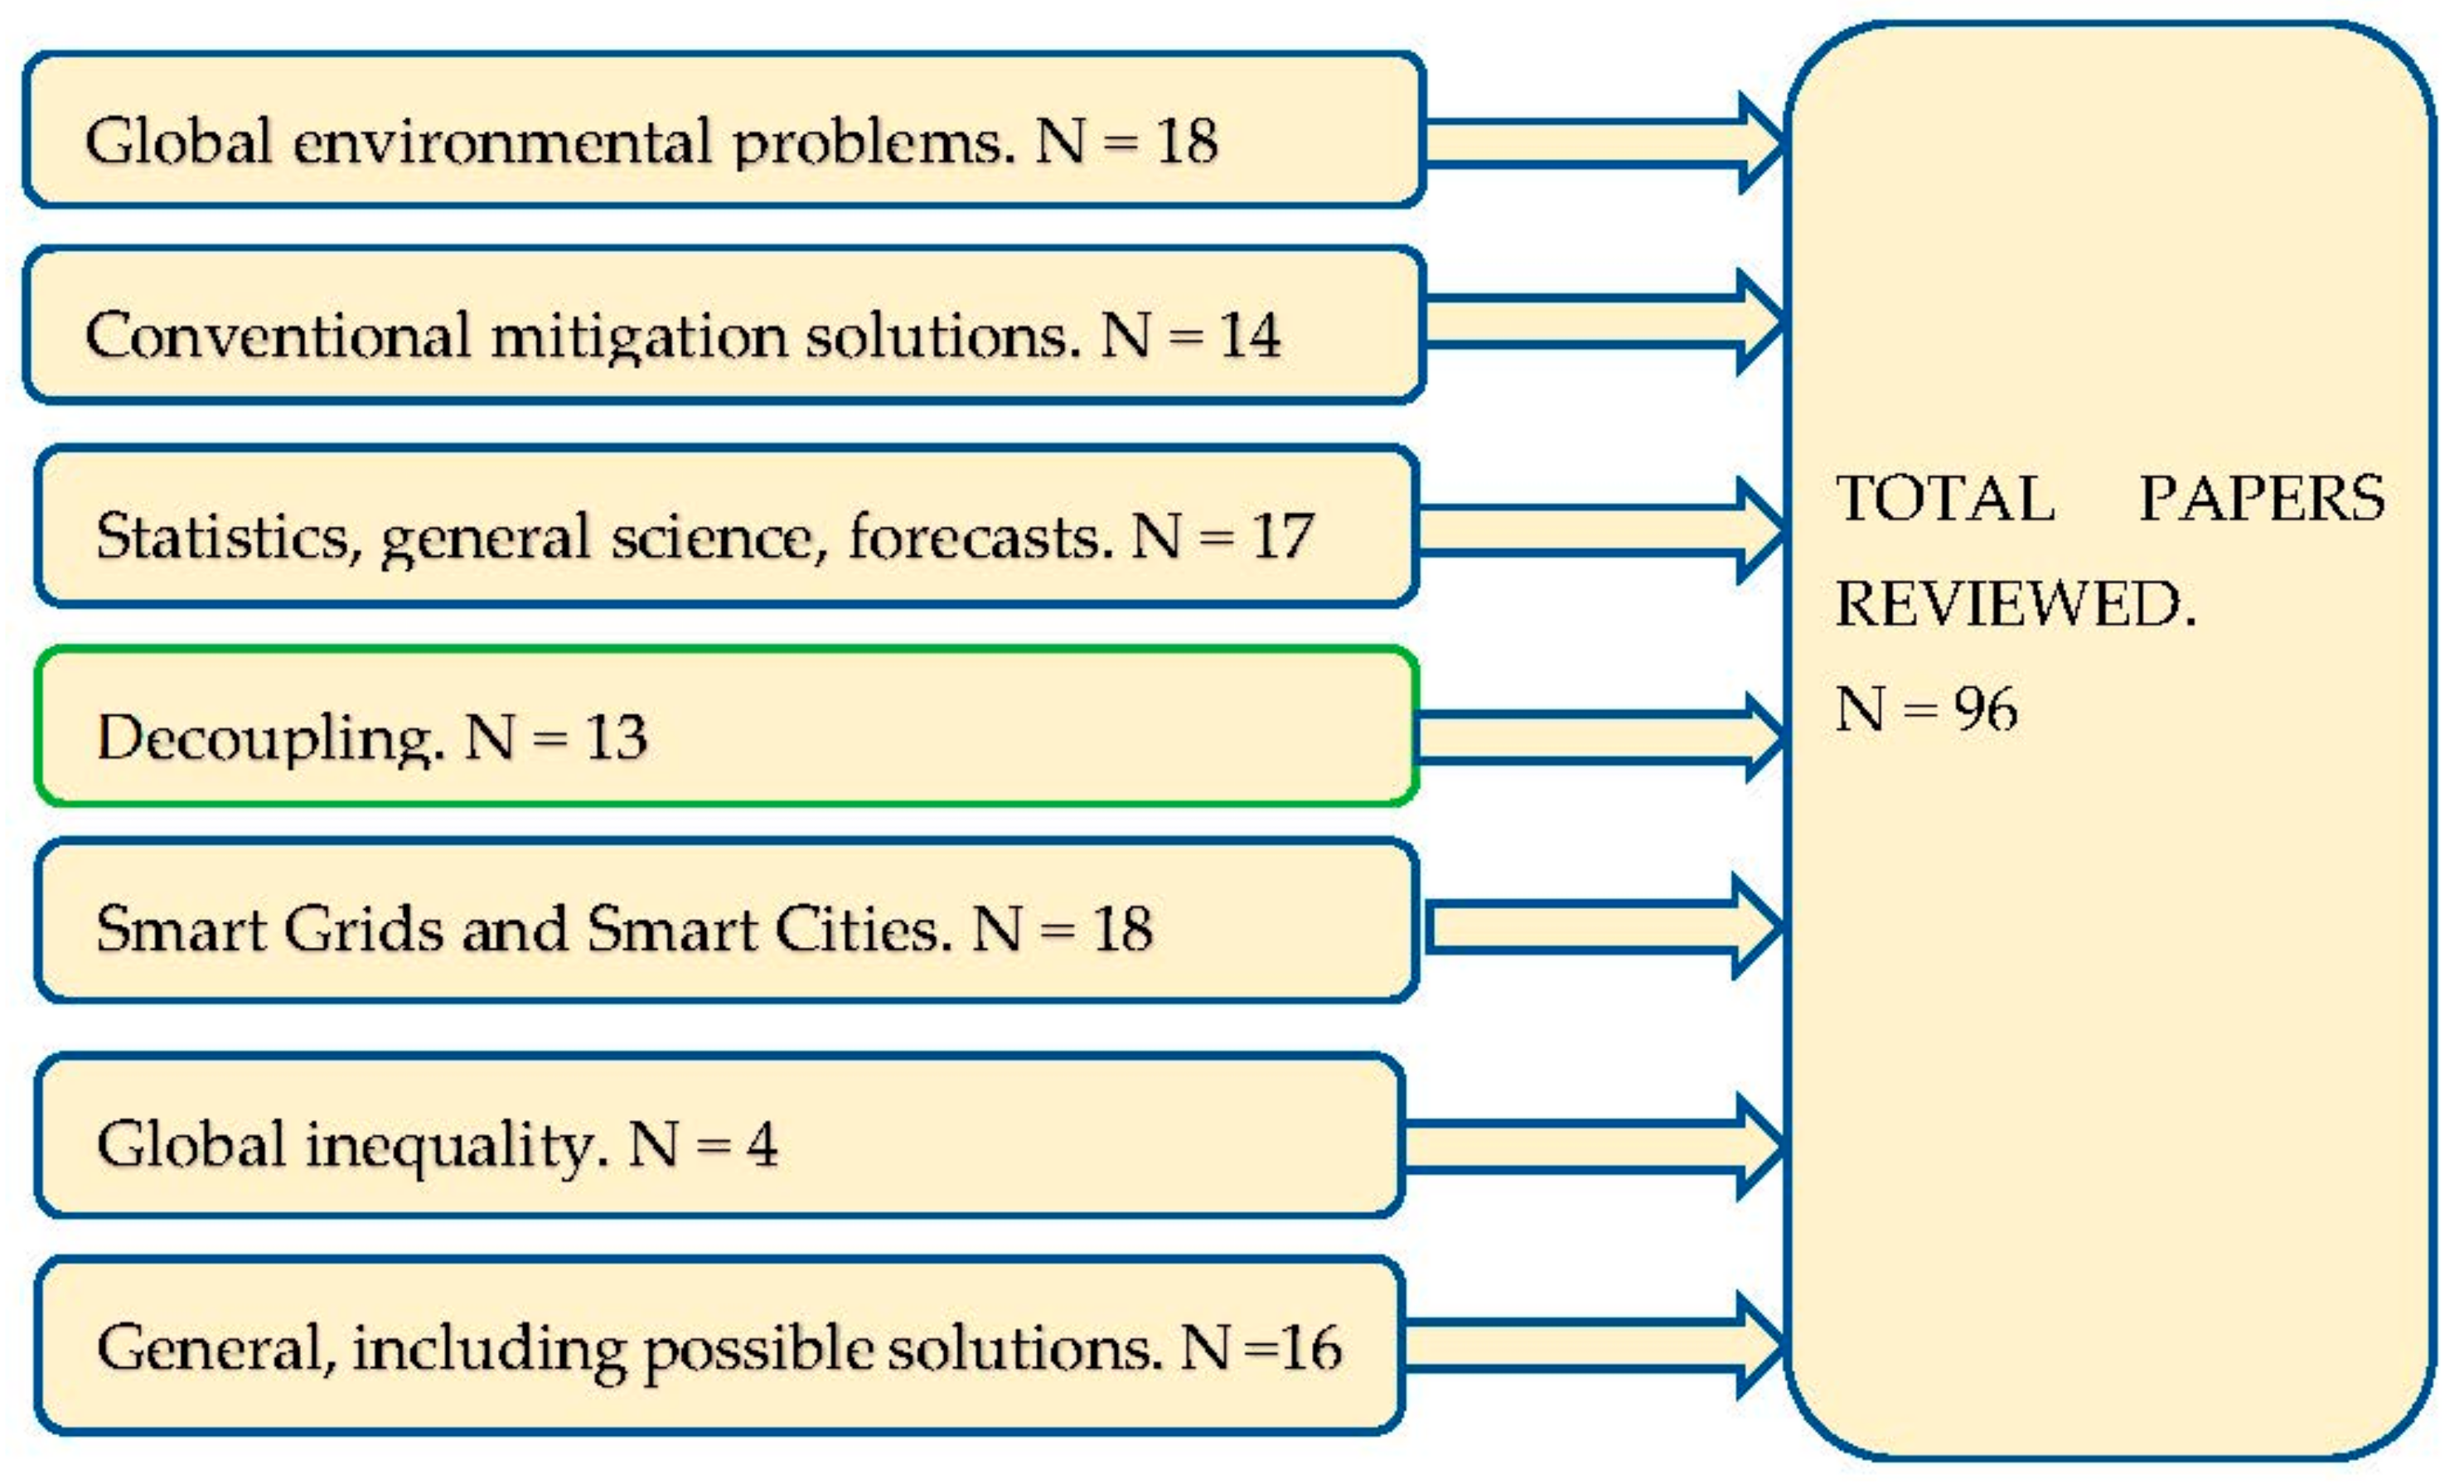
Figure 2.
Number of Earths 1990–2018 [49]; global electricity production, atmospheric 1990–2021 [37], atmospheric CO2 levels (ppm) 1990–2021 [50], and world car fleet [39,40,51] vs. global GDP (2017 PPP USD) [48]. All quantities shown relative to 2017 values, see legend. Linear trends shown as dashed lines; R2 see legend.


Table 1.
Average % share of non-carbon electricity for selected countries, 2021.
| Country | Non-Carbon Electricity Production (%) |
|---|---|
| Saudi Arabia | 0.2 |
| UAE | 11.3 |
| China | 33.6 |
| US | 38.6 |
| Brazil | 79.7 |
| Norway | 98.9 |
| World | 37.7 |
Source: BP [37].
Table 2.
Average energy-related CO2 emissions per capita at the national level, for selected countries, 2019.
Table 2.
Average energy-related CO2 emissions per capita at the national level, for selected countries, 2019.
| Country | Tonnes CO2/Capita |
|---|---|
| China | 7.07 |
| Eritrea | 0.16 |
| Ethiopia | 0.13 |
| France | 4.36 |
| Kuwait | 21.26 |
| Qatar | 30.68 |
| US | 14.44 |
| OECD | 8.34 |
| World | 4.39 |
Source: [36].
Table 3.
Selected parameters for domestic energy in Australia, UK, Japan, and the US, latest data.
| Country | Dom. Elec. (c/kWh) 1 | Lowest Quintile dom. Energy % dom. exp. | Highest Quintile dom. Energy % dom. exp. | Primary Energy Use GJ/Capita 5 |
|---|---|---|---|---|
| Australia | 21.0 | 4.4 2 | 2.1 2 | 222.1 |
| Japan | 25.5 | 8.0 3 | 4.1 3 | 140.8 |
| UK | 27.5 | 8.0 4 | 3.5 4 | 108.9 |
| US | 13.2 | NA | NA | 279.9 |
Disclaimer/Publisher’s Note: The statements, opinions and data contained in all publications are solely those of the individual author(s) and contributor(s) and not of MDPI and/or the editor(s). MDPI and/or the editor(s) disclaim responsibility for any injury to people or property resulting from any ideas, methods, instructions or products referred to in the content. |
© 2023 by the authors. Licensee MDPI, Basel, Switzerland. This article is an open access article distributed under the terms and conditions of the Creative Commons Attribution (CC BY) license (https://creativecommons.org/licenses/by/4.0/).
Share and Cite
MDPI and ACS Style
Moriarty, P.; Honnery, D. Are Energy Reductions Compatible with Economic Growth? Sustainability 2023, 15, 8043. https://doi.org/10.3390/su15108043
AMA Style
Moriarty P, Honnery D. Are Energy Reductions Compatible with Economic Growth? Sustainability. 2023; 15(10):8043. https://doi.org/10.3390/su15108043
Chicago/Turabian StyleMoriarty, Patrick, and Damon Honnery. 2023. "Are Energy Reductions Compatible with Economic Growth?" Sustainability 15, no. 10: 8043. https://doi.org/10.3390/su15108043
Note that from the first issue of 2016, this journal uses article numbers instead of page numbers. See further details here.