Abstract
The COVID-19 pandemic and the subsequent lockdown of cities have led to the rapid growth of online food delivery (OFD). Moreover, there are concerns that OFD platforms may impose offers on users in order to continue to increase their market share, leading to numerous environmental issues such as overconsumption and a significant increase in plastic packaging waste. Most studies have focused on the environmental impacts associated with food packaging and have been mostly limited to China. However, less research has been carried out on the overall CO2 emissions of an OFD order including food. In this study, the CO2 emissions of an OFD order were assessed by considering the production, distribution, consumption and disposal of the ingredients, based on lifecycle thinking and existing secondary data, for three representative food groups (Western food, Japanese food and Chinese food) in Japan. This study found that the food production of an OFD order accounts for more than 70% of the CO2 emissions of the entire process, especially food ingredient production. Policy support and initiatives such as OFD platforms being able to serve different quantities of food based on actual consumer demand to avoid food waste, as well as changes in delivery methods, would help reduce the CO2 emissions of OFD.
1. Introduction
1.1. Background
Explosive growth in the online food delivery (OFD) industry has been observed in recent years. Internet platforms allow customers to buy food from partnering restaurants through smartphone applications and have it delivered to their households [1]. The rapid uptake of OFD in the last decade has been attributed to factors such as the growth of the internet and e-commerce, hedonic motivation, increasing household discretionary income and convenience and time-saving in increasingly busier lives [2,3].
The COVID-19 pandemic has accelerated OFD development in Japan over the past two years. According to Measurable AI’s e-receipts data, Japan’s OFD market share comprises two major companies from 2020 to 2021: Uber Eats (market share of over 60%) and Demae-Can (market share of about 30%) [4]. The OFD industry increased by 25% from 2016 to 2020, and it is set to increase by a further 17% from 2021 to 2025 [5].
There have been many studies on OFD in recent years, mainly focusing on obesity [6,7,8], cloud kitchens [9,10], food safety issues [11], consumption habits [12,13], social relationships [14] and traffic accidents [15,16,17]. However, the impact of OFD comes from three main areas: economic, social and environmental. In social terms, OFD has greatly increased food accessibility, but it has also greatly increased the availability of unhealthy food [18]. This is because OFD platforms have a large selection of dishes with low nutritional value. OFD provides work opportunities for more people and greatly enhances work flexibility. However, in some countries, couriers have few employment rights and are subject to a dangerous working environment [19]. On an economic level, OFD’s market revenue was boosted by 27% to USD 136.4 billion in 2020 [20]. Furthermore, the development of OFD brings benefits to many industries, such as the food packaging industry, manufacturing (e-bikes) and sales. However, there have also been some negative effects on the traditional restaurant industry, with many restaurants having to adapt their business models to stay afloat [21]. Moreover, OFD platforms, through aggressive marketing and promotional strategies, may lead to over-consumption by consumers [18]. This behavior will greatly increase the burden on waste disposal. As for the environmental impact, the most important point is the generation of large amounts of plastic packaging and how to deal with it [21]. For example, the amount of waste from OFD packaging in China increased by 650% in 2017 compared to 2015 levels [22]. In 2020, influenced by COVID-19, consumers preferred single-use plastic packaging, which in turn led to a rapid growth in plastic packaging waste [21]. Another important environmental issue is CO2 emissions associated with OFD. The main sources of environmental impact (solid waste pollution, water pollution, recourse consumption, and air pollution) are production and waste disposal along the whole industry chain of OFD packaging [23].
Since the OFD industry is relatively young, research and discourse on OFD and its environmental effects is limited. In addition, many studies have focused on China, as OFD was growing rapidly in China before the COVID-19 pandemic. Meanwhile, due to the impact of the pandemic, the OFD industry has grown rapidly in Japan. Meals from restaurants/fast food chains will facilitate the next increase in OFD over the next five years [4,5]. This makes OFD research in Japan a new academic hotspot.
1.2. Unresolved Issues
Current research on the CO2 emissions of OFD has focused on the CO2 emissions of OFD-related packaging from production to disposal, and researchers have found that the production of raw packaging materials accounts for at least 50% of the entire process. However, due to the complexity and limitations of the food data, most studies do not consider the contribution of food ingredients in the CO2 emissions of OFD. Moreover, distribution, an important part of OFD, is not addressed in many studies. Based on secondary data, this study analyzes the CO2 emissions of OFD from three different types of food (Western food, Japanese food and Chinese food) in Japan, taking food production in particular into account.
1.3. Research Objectives
Existing studies have only focused on CO2 emissions from OFD-related packaging and have not considered the CO2 emissions of food production and distribution. This study considered Western food, Japanese food and Chinese food as three representative OFD food groups and developed a framework to estimate the overall greenhouse gas emissions of an OFD order through an entire process by considering the production, distribution, consumption and disposal of the food ingredients and related plastics, based on lifecycle thinking and existing secondary data in Japan. Through scenario analysis, the framework not only compared the impact of three different food groups on the CO2 emissions of OFD, but also calculated the contribution of the different distribution method and disposal method to the CO2 emissions of OFD. Furthermore, policy recommendations to prevent and reduce CO2 emissions are provided based on the scenario analysis.
2. Literature Review
The relevant literature and the main findings on CO2 emissions from OFD and on consumer behavior have been reviewed as follows.
2.1. CO2 Emissions from OFD
The increase in OFD will affect all stages of the food supply chain and have more serious environmental issues. Significant CO2 emissions have occurred from food packaging production, food delivery and waste generation [21,24]. Two-thirds of packaging demand comes from the food industry, such as food containers, cutlery, napkins and plastic bags, which will lead to resource depletion and large CO2 emissions due to the high demand for energy and raw materials [21]. These materials are frequently single-use, necessitating huge amounts of energy and raw materials to manufacture, transport and dispose of them. Packaging production and disposal can also lead to the release of a wide range of pollutants into the environment [25]. All of this points to the OFDs catalyzing the increasing consumption of packaging-derived plastics, which already account for 46% of worldwide plastic waste.
Research on OFD has mainly focused on CO2 emissions related to different OFD product packaging processes, from production to waste treatment [1,26], and CO2 emissions related to OFD waste disposal [27]. For example, Arunan et al. [1] quantified the packaging-related greenhouse gas emissions associated with OFD orders in Australia. Packaging raw materials contribute at least 50%. As the OFD industry continues to grow, CO2 emissions associated with OFD packaging are expected to increase by 132% by 2024. Liu et al. [28] found that OFD waste is a small proportion of municipal solid waste; however, food packaging waste accounts for 15.7% of the total. Plastic bags were the most used packaging at 35%, and plastic boxes accounted for 27%. However, the environmental impact of paper boxes cannot be ignored. Despite their lower usage, the environmental impact potential of NOx generated during the production of paper boxes far exceeds that of CO2. Camps-Posino et al. [29] assessed the impact of OFD’s packaging and its waste disposal on climate change based on LCA and explored the advantages of increasing recycling rates, the amount of packaging recycled and the use of reusable packaging. This study found that takeaway packaging in China emits approximately 13 million tons of CO2. If the recycling rate is increased to 35%, packaging emissions would be reduced by 16%. If packaging made from recyclable materials is increased by 50%, emissions would be reduced by 60%. In addition, if reusable packaging is used, emissions would be reduced by 63%. Zhang et al. [27] combined the direct weighing method with a questionnaire to analyze the scale, pattern and impact of OFD waste. This research found that the total amount of OFD waste in 2019 was 177.6 kilotons, CO2 emissions were 168.3 kilotons and packaging waste accounted for 32%. Significant differences in OFD waste were found between different consumer groups, with white-collar workers contributing the highest amount at 58%. This could be reduced by 25% if waste-to-energy technologies were implemented as planned, and by 55% if the avoidable portion of OFD waste was avoided. Some researchers found that recycling these packages could significantly ease energy consumption for production, thereby reducing CO2 emissions [24,30]. In Australia, some food companies offer reusable food containers (stainless-steel containers), greatly enhancing the sustainability of food packaging [1].
2.2. Consumer Behavior Impacts
The impact of consumer behavior on OFD comes from two main components, purchasing behavior and the selection of the disposal of OFD waste.
For consumers, there is no doubt that selecting OFD can save them a great deal of time. In China, each OFD order can save consumers at least 48 min [21]. Studies have also shown that OFD produces less food waste than eating at home, because home cooking sometimes has led to an increase in food waste by producing more food than household demand [31]. The relatively small amount of food, due to the limitations of the container, makes it easier for consumers to finish their meal. Furthermore, CO2 emissions from the production and preparation of different foods are different. For example, in Japan, a study found that Western food has higher CO2 emissions than Chinese food or Japanese food in the household [32]. So, from an environmental point of view, the kind of food that consumers choose determines the carbon footprint of OFD at the production stage, and selecting OFD can reduce a certain amount of food waste.
Consumer attitudes are an important factor in evaluating the environmental impact of the food supply chain, particularly in waste disposal and recycling [33]. Some studies have found that changes in consumer behavior at the waste disposal stage can significantly reduce CO2 emissions [34]. Despite consumers’ environmental awareness, most people are unaware of how food waste is generated, as well as recooking leftovers and reusing meal containers in the future [12]. For example, in Changchun, China, more than half of university students do not separate leftover food from its container and throw it away. The main reason for this is a lack of knowledge about waste separation [35]. While there are many factors that influence consumer sorting behavior, such as age, gender, education level, income level and the uneven distribution of waste facilities [36], for those consumers who are not interested in recycling, the inconvenience of disposal and recycling is the main reason [1].
3. Materials and Methods
3.1. Scope and Unit Definition
The scope of this research is to assess the environmental impact of online food delivery. As shown in Figure 1, this study divides the environmental impact of OFD into four components: production, distribution, consumption and end of life/recycling. The environmental impact indicators for assessing OFD mainly consider CO2 emissions and waste volumes. For this research, the functional unit is defined as a single packaged online food order for one person.
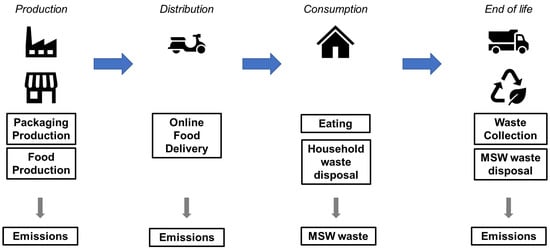
Figure 1.
System boundaries.
3.2. Calculation Framework
Figure 2 shows the calculation framework for OFD consisting of the production stage, distribution stage, consumption stage and waste disposal stage. The red rectangle represents the target, the green rectangle represents the calculation process and the dotted line represents no data. In production, this stage not only considers food ingredient production and OFD container production, but also considers cooking in restaurants. In distribution, this stage contains a wide range of transport options, such as cycling, motorized bicycles, motorbikes and vehicles. Waste disposal considers not only waste collection and transportation but also landfill and incineration.
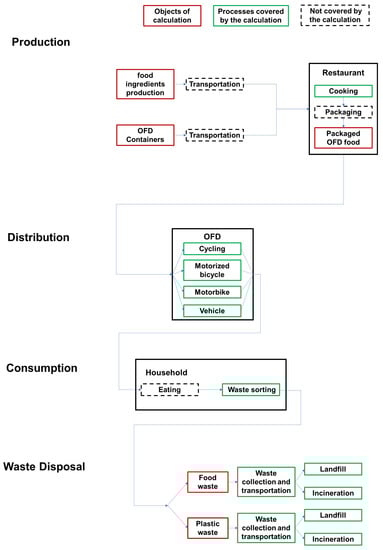
Figure 2.
Calculation framework.
The framework analyzes the environmental impacts of different OFDs and the impacts of different consumer behaviors on OFD. Firstly, the contribution of CO2 emissions at different LCA stages of different OFDs is analyzed. Secondly, the environmental impacts associated with consumer decisions regarding OFD purchase, consumption and disposal are analyzed.
3.3. Databases
3.3.1. Food Production
In this research, food production includes food ingredient production and cooking in the restaurant. Table 1 shows the CO2 emissions of food ingredient production and the household cooking of three types of food, where food ingredient production includes the processes of ingredient production, packaging and transportation [32]. CO2 emissions from restaurants are 1.2 to 1.8 times higher than household emissions, averaging 1.5 times [37]. Table 2 shows the LCA progress of CO2 emissions of food cooking in restaurants.

Table 1.
CO2 emissions of food production in households.
Table 2.
Total CO2 emissions of food production in households and restaurants.
3.3.2. Food Weight
Based on previous studies [38,39], the different components were weighed. Compared to Western and Japanese food, Chinese food is the heaviest. This is because the raw materials for Chinese soups come mainly from large amounts of chicken and water, whereas Western soups are based on small amounts of vegetables and milk. As shown in Table 3, compared with Western food and Japanese food, the containers for Chinese food are complex.
Table 3.
Weight of three food types.
3.3.3. Container Production
We obtained some common materials and weights of OFD containers from a website [40] (Table 4). The selection of container styles is based on the images in Table 3.
Table 4.
Weight of container.
This study describes the CO2 emissions from containers made of different materials (Table 5) [41]. For environmentally friendly materials (Bio-PE, PLA and PHBH), CO2 emissions data from the manufacturing process are not available and are not considered in this study.
Table 5.
CO2 emissions of container material.
3.3.4. Distribution of OFD
A survey conducted by Tokyo Smart Restaurant LLC in 2022 of 1013 takeaways found that delivery was mainly carried out using bicycles, motorized bicycles, motorbikes and vehicles [42]. Table 6 shows the CO2 emissions from OFD’s main distribution [43]. Within the framework of the system we designed (Figure 2), the distribution of OFD is only considered from the restaurant to the home, and the main CO2 emissions from this process are mainly from energy consumption.
Table 6.
CO2 emissions of distribution.
3.3.5. Waste Disposal
According to the IDEA database, this study established a waste disposal database (Table 7). It includes landfill services and incineration services without power generation.
Table 7.
CO2 emissions of waste treatment.
3.4. Impact Assessment
3.4.1. Quantifying the CO2 Emissions of Packaging Production
Combining Table 5 and Table 6, the environmental impacts of food packaging were estimated. The CO2 emissions of OFD packaging in the production progress can be calculated using Equation (1):
where is the CO2 emissions from production food packaging, is the carbon intensities, and is the weight of the food package per order.
3.4.2. Quantifying the CO2 Emissions of Distribution
If we want to quantify the delivery-related CO2 emissions from restaurant to household, we need to consider two important factors: the type of delivery and the distance from the restaurant to the household. According to the Demae-Can website, we found that the average delivery distance is 1.7 km [44]. Therefore, according to Table 6, we could calculate the CO2 emissions of different types of OFDs.
3.4.3. Quantifying the CO2 Emissions of Waste Treatment
The annual CO2 emissions of the waste treatment of OFD packaging waste can be calculated using Equations (2) and (3) [45]:
where is the total CO2 emissions of the waste collection and transportation (kg CO2); is the total CO2 emissions of the OFD waste treatment (kg CO2); is the GHG emission intensity of the waste collection and transportation (kg CO2/kg); is the GHG emission intensity of the waste treatment (kg CO2/kg).
3.5. Scenario Analysis
Consumers’ dietary choices and waste disposal will largely influence the environmental impact of OFD. As a result, scenario analysis was used to test it in the framework’s last section under diverse consumer behavior patterns. The frameworks of scenarios representing various customer behavior patterns are shown in Figure 3. Food and packaging selection, distribution, distance, food waste, packaging disposal, trash transportation and plastic treatment are the seven pattern steps investigated.
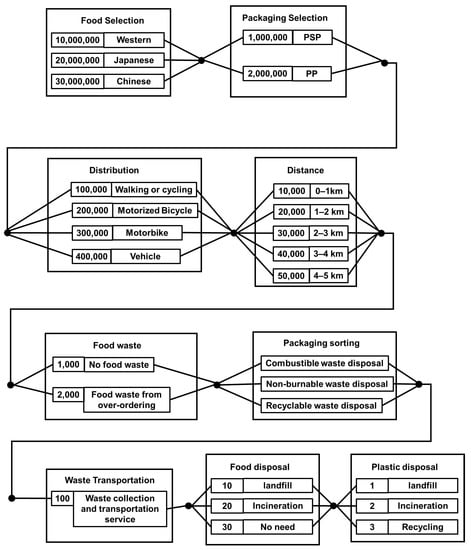
Figure 3.
Scenario analysis from food selection to plastic disposal.
Combinations of patterns from the nine stages are used to illustrate the scenarios. A eight-digit number combination is used to identify each food product situation. Each digit in the scenario’s nomenclature corresponds to a pattern in eight of the nine stages, excluding packaging disposal patterns. For example, one scenario is designated as “12321142” when food selection is Western food (pattern 10000000), packaging is PP (pattern 1000000), distribution is by motorbike (pattern 300000), distance is 1–2 km (pattern 20000), food waste is 0 (pattern 1000), the weight of the soup is ignored, waste transportation is pattern 100, food disposal is not needed (pattern 30) and plastic disposal is via incineration (pattern 2). Waste treatment is determined by the consumer when they dispose of food waste and packaging. Due to the lack of recycling data, this model calculation only considers landfill and incineration.
4. Results
4.1. CO2 Emissions from OFD
Figure 4 shows the CO2 emissions from three typical OFD foods. The selection of food and plastic containers is determined by the actual situation. According to the questionnaire on the iideli website [46], during the pandemic, 69.7% of takeaways chose motorbikes, so motorbike was chosen as the distribution. According to the Demae-Can website, the average delivery distance is 1.7 km [44]. Because the functional unit was set up as a one-person takeaway, we assumed that the consumer ate all the food and did not produce food waste. According to the Fundamentals of Plastics Recycling report [47], 79.5% of municipal waste (included plastic waste) is incinerated, so the form of plastic waste disposal was chosen as incineration.
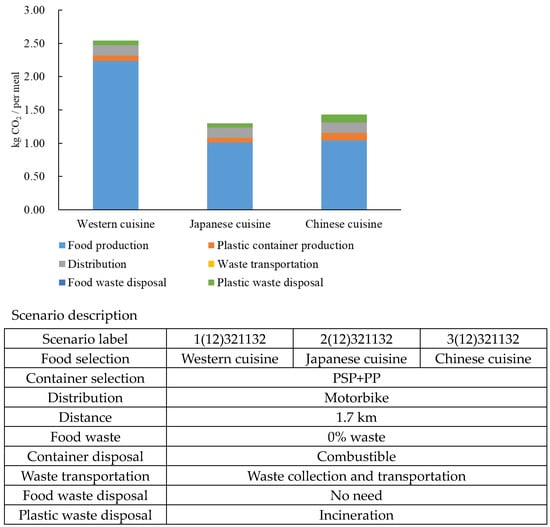
Figure 4.
CO2 emissions of OFD.
We can find that Western cuisine has the highest CO2 emissions, followed by Chinese and Japanese cuisines. Food production accounts for 87.9%, 77.7% and 72.7% of the total CO2 emissions, respectively. On the other hand, plastic container production only accounts for 3.1%, 5.2% and 8.1% of the total emissions, and all CO2 emissions related to plastic, including plastic manufacturing, the production of plastic containers, plastic waste collection and transportation and disposal of waste, account for 6.0%, 10.3% and 16.4%, respectively. Therefore, it has been found that food production has a significant impact on the CO2 emissions of OFD. On the other hand, the option of OFD container materials does not have a significant environmental impact on OFD since the total weight per meal is not high.
4.2. The CO2 Emissions of Distributions
Figure 5 illustrates the best, average and worst scenarios for CO2 emissions from OFD in Japanese food. According to the Japan Food Delivery Company report [48], the most popular OFD food is Japanese food, accounting for 88%, so Japanese food was selected as the food. The material of food packaging, depending on the actual situation, is HIPS. Due to the hilly terrain in Japan, OFD cannot rely entirely on bicycle delivery. Therefore, the appropriate distribution method was chosen for different areas and distances. We roughly assumed 0–2 km distances were traveled by cycling, 2–4 km distances were covered with motorized bicycles or motorbikes, and distances of over 4 km were covered with motorbikes or other vehicles for the calculation. Therefore, the best scenario was to choose cycling for a distance of 0–1 km. The average conditions would be a motorbike and a distance of 1.7 km. According to the Demae-Can APP, the maximum distance found for OFD was about 5 km, so the worst scenario was a vehicle and a distance of 5 km [44]. The selection of food waste, packaging disposal, waste transportation, food treatment and plastic treatment are the same results as 3.1.
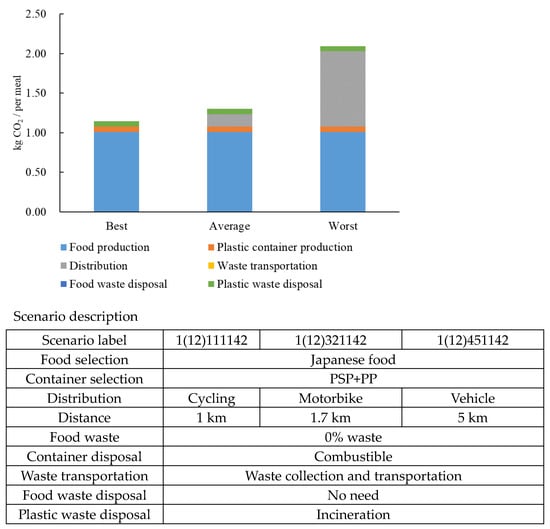
Figure 5.
CO2 emissions of different distributions for Japanese food.
In the different conditions of each scenario, the distribution stage contributes from 0% to 45.4% of the entire CO2 emissions. Cycling delivery does not generate any CO2 emissions. However, when the customer lives far from the restaurant and gasoline vehicles need to be used for delivery, CO2 emissions for the distribution stage suddenly make up a large share. Although the environmental impact of OFD distribution can be small or large, the share of vehicle distribution in Japan is only 3.6%, with 94.7% of distribution coming from bicycles and motorbikes. Overall, the environmental impact of OFD distribution ranges from 0 to 12.0%.
5. Discussion
5.1. Over-Ordering
The results of this study are based on the Japanese Food Guide Spinning Top for food intake per person per meal [49]. However, many businesses in OFD platforms set minimum spending amounts, resulting in consumers having to buy 1.5–2 times more food. Therefore, Figure 6 is based on the scenario design of result 4.1 and adds a second salad, tempura and dumplings to the Western, Japanese and Chinese meals, respectively, to meet the minimum spending requirement. However, for health reasons, the extra food (second salad, tempura and dumplings) is not eaten and ends up being disposed of as food waste. According to the latest Japan Waste Disposal Report that was published by the Ministry of the Environment, Japan [50], 224 out of 1741 municipalities collected food waste separately from burnable waste, which means the remaining 1517 municipalities put food waste into incineration facilities together with burnable waste. Therefore, food waste disposal is carried out via incineration.
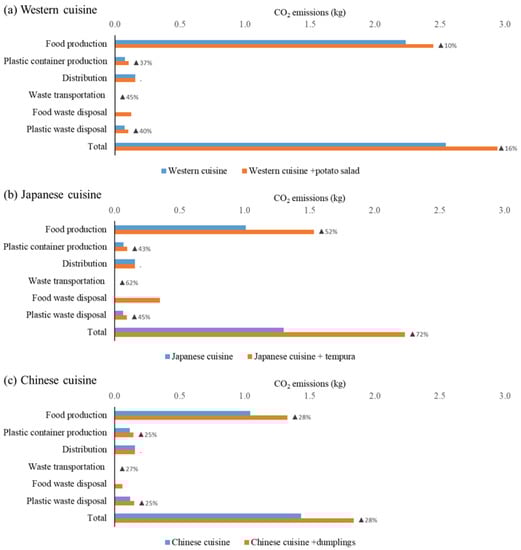
Figure 6.
Differences in CO2 emissions of OFD by over-ordering.
Figure 6 shows the excess CO2 emissions triggered by the increase in food leftovers due to over-ordering at different stages of OFD. We can find that additional food led to an increase of 16%, 72% and 28% in the total CO2 emissions of OFD for Western cuisine, Japanese cuisine and Chinese cuisine, respectively. Meanwhile, over-ordering food leads to an increase in CO2 emissions at different stages of OFD, especially food waste disposal. Taking Japanese cuisine as an example, the second tempura led to an increase in CO2 emissions of 52%, 43%, 62% and 45% in food production, plastic production, waste transportation and plastic waste disposal. For food waste disposal, CO2 emissions increased from 0 to 15.7% of total emissions. Therefore, food leftovers due to over-ordering have a significant impact on the CO2 emissions of OFD.
Food wastage as a result of OFD is frequently associated with the “minimum price” set by restaurants on the OFD platform, which leads to users buying more food than they need to satisfy the “minimum price” of the free delivery service [12]. This pattern of minimum prices leads to the creation of leftovers for consumers. The inability to preserve leftovers in a timely manner or the reluctance of consumers to preserve them leads, on the one hand, to an increase in food waste, visible to the consumer, and on the other hand, to an increase in CO2 emissions due to over-ordering, especially at the waste collection and disposal stage, which is a part of the impact that is invisible to the consumer. If OFD platforms could offer different amounts of food options to meet the different needs of different consumers, it would not only reduce food waste but also significantly reduce CO2 emissions.
5.2. Shifting the Distribution
Although the environmental impact of distribution for each order is not high, the question remains as to whether the environmental impact of distribution for OFD is also not significant at urban or national scales due to the increasing demand. According to public data, we discovered that the total number of orders in 2019 from Demae-Can was 3.25 million orders, and the current shares of delivery methods were as follows: bicycle (25%), motorbike (69.7%), vehicle (3.6%) and other (3.6%) [44].
Therefore, we have simply estimated the environmental impact of Demae-Can’s distribution at the national scale in 2019 (Figure 7). The original pattern is the total CO2 emissions of Demae-Can’s distribution in 2019 with a delivery distance of 1.7 km [44]. The S1 pattern replaces 50% of motorcycle with a motorized bicycle while keeping everything else unchanged. The S2 pattern replaces all motorcycles with a motorized bicycle and replaces all cars with motorcycles.
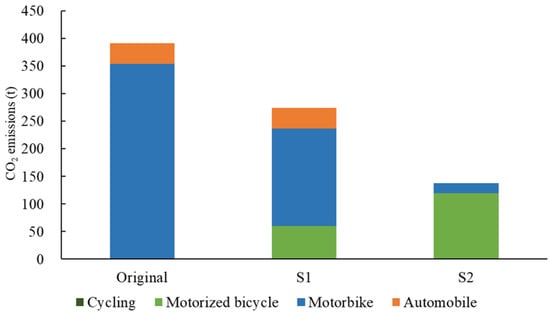
Figure 7.
Differences in CO2 emissions of OFD by changing the distribution.
Figure 7 indicates that CO2 emissions from OFD can be reduced by shifting delivery method from high-emitting transportation to low-emitting transportation. When shifting from the original pattern to the S1 pattern, CO2 emissions are reduced by 29.96%, while when shifting from the original pattern to the S2 pattern, CO2 emissions drop by 64.89%, suggesting that a change in OFD distribution can contribute significantly to regional emissions reductions. Obviously, the best choice for OFD delivery is cycling for a short distance, followed by motorized bicycles for a relatively short distance. Thus, reconsidering the business area of the restaurants from a delivery perspective will contribute a lot to reducing CO2 emissions. Moreover, a single OFD delivery to fulfill multiple orders will significantly alleviate the environmental impact of distribution.
5.3. Changing Plastic Containers
CO2 emissions of PSP+PP, Bio-PE and PHBH using Japanese food were compared as an example. Due to data limitations, this analysis only considers the production of raw materials for plastic packaging containers and does not include the manufacturing process. Although Bio-PE is a bio-based plastic, it is not biodegradable, so incineration is considered as the suitable waste disposal option [51]. On the other hand, PHBH is biodegradable, so it could be treated as plastic landfill waste when separated at the source.
Figure 8 shows that PHBH material has the highest CO2 emissions, followed by Bio-PE. We can find that new plastic production has a much higher CO2 emission than PSP+PP. In the plastic production stage, CO2 emissions from PHBH production were 1.35 times those of PS. Although PHBH is a biodegradable material, most plastic disposal in Japan is via incineration [50]. The total CO2 emissions of PHBH are higher than conventional materials (PSP+PP). Therefore, from the perspective of CO2 emissions, PHBH and Bio-PE materials are not environmentally friendly in Japan.
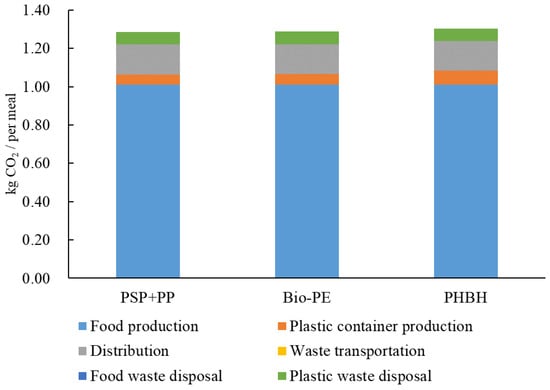
Figure 8.
Differences in CO2 emissions of OFD by changing the plastic containers.
5.4. Limitations
This study has designed a relatively comprehensive system framework using a meal as a functional unit, evaluating not only the CO2 emissions associated with the production and handling of food products in OFD orders, but also the CO2 emissions associated with the production and disposal of packaging materials used in OFD orders. However, as secondary data were used for both food production and packaging production, particularly as the food production data were not up to date, this may have led to an underestimation of the results. Additionally, items such spoons, chopsticks and napkins that may be associated with OFD orders were not considered.
Although CO2 emissions are one of the most important indicators for evaluating environmental impact, a more comprehensive evaluation is needed to accurately assess the environmental impact of OFD, including considerations such as water pollution, SOx and NOx. Future studies will consider more evaluation indicators, such as water pollution, SOx and NOx.
6. Conclusions
This study evaluated the CO2 emissions of an OFD order, considering multiple factors such as food options, types of plastic containers, delivery methods and distances, proportions of consumption, and methods of waste disposal. The scenario analysis could reveal how much each process contributes to the overall CO2 emissions, providing directions for reducing CO2 emissions from OFD. It showed that food production was the largest contributor to CO2 emissions. Choosing environmentally friendly food options can significantly reduce the total CO2 emissions of each OFD meal. On the other hand, when consumers leave leftovers, extra CO2 emissions are generated during the production stage of the excess food, as well as during the collection, transportation and disposal of food waste. Therefore, if restaurants could provide more options for the volume of food and encourage customers to order appropriate amounts of food, it would make a major contribution to reducing CO2 emissions.
On the other hand, the total amount of plastic required for each OFD meal is relatively small, and the delivery distance is also relatively short in Japan, resulting in a smaller environmental impact from the food portion. However, initiatives such as improving delivery methods and using “green” containers can contribute to reducing CO2 emissions from OFD.
There is still much research to be carried out. Our next step will involve conducting interviews with OFD platforms, restaurant owners and customers through surveys to gather real information and data. This will help us verify the results of our study and measure the actual amounts of food waste and plastic waste from OFD, allowing us to develop a more comprehensive environmental impact assessment of OFD.
Author Contributions
Conceptualization by C.L.; methodology, data collection and analysis and writing (original draft) by X.H., Q.Z. and C.L.; review and supervision by D.M. and C.L.; funding acquisition and project administration by C.L. All authors have read and agreed to the published version of the manuscript.
Funding
This research was funded by the Institute for Global Environmental Strategies (IGES) under the Strategic Research Fund 2021–2023 and supported by the Environment Research and Technology Development Fund (S-21) of the Environmental Restoration and Conservation Agency of Japan, ‘Development of an Integrated Assessment Model linking Biodiversity and Socio-Economic Drivers, and its Social Application (IAM-B)’ (2023–2027).
Institutional Review Board Statement
Not applicable.
Informed Consent Statement
Not applicable.
Data Availability Statement
Not applicable.
Acknowledgments
The authors would like to thank Emma Fushimi for proofreading this paper and would also like to express gratitude to the referees for their useful comments and suggestions.
Conflicts of Interest
The authors declare no conflict of interest.
References
- Arunan, I.; Crawford, R.H. Greenhouse gas emissions associated with food packaging for online food delivery services in Australia. Resour. Conserv. Recycl. 2021, 168, 105299. [Google Scholar] [CrossRef]
- eServices Report 2018 Online Food Delivery. Available online: https://statistacloudfront.s3.amazonaws.com/download/pdf/OnlineFoodDelivery_Preview.pdf (accessed on 18 January 2023).
- Yeo, V.C.S.; Goh, S.K.; Rezaei, S. Consumer experiences, attitude and behavioral intention toward online food delivery (OFD) services. J. Retail. Consum. Serv. 2017, 35, 150–162. [Google Scholar] [CrossRef]
- Japan’s Untapped Food Delivery Market Is Already Crowded: Who’s Winning? Available online: https://www.linkedin.com/pulse/japans-untapped-food-delivery-market-already-crowded-whos-sheng (accessed on 18 January 2023).
- Food Delivery Service Market in Japan: Key Research Findings. 2021. Available online: https://www.yanoresearch.com/en/press-release/show/press_id/2800 (accessed on 18 January 2023).
- Anderson, B.; Lyon-Callo, S.; Fussman, C.; Imes, G.; Rafferty, A.P. Peer reviewed: Fast-food consumption and obesity among michigan adults. Prev. Chronic Dis. 2011, 8, A71. [Google Scholar] [PubMed]
- Wang, Y.; Wang, L.; Xue, H.; Qu, W. A review of the growth of the fast food industry in China and its potential impact on obesity. Int. J. Environ. Res. Public Health 2016, 13, 1112. [Google Scholar] [CrossRef]
- Fraser, L.K.; Clarke, G.P.; Cade, J.E.; Edwards, K.L. Fast food and obesity: A spatial analysis in a large United Kingdom population of children aged 13–15. Am. J. Prev. Med. 2012, 42, 77–85. [Google Scholar] [CrossRef] [PubMed]
- Choudhary, N. Strategic analysis of cloud kitchen–a case study. Manag. Today 2019, 9, 184–190. [Google Scholar] [CrossRef]
- Belleri, C. Deliveroo: Improving a Service Making IT 24 Hours. Master’s Thesis, EAE Business School, Madrid, Spain, 2020. [Google Scholar]
- Li, J. Research on food safety supervision on online Food Delivery industry. China Food Saf. Mag. 2019, 13, 68–71. [Google Scholar]
- Liu, C.; Chen, J. Consuming takeaway food: Convenience, waste and Chinese young people’s urban lifestyle. J. Consum. Cult. 2021, 21, 848–866. [Google Scholar] [CrossRef]
- Meah, A.; Jackson, P. Convenience as care: Culinary antinomies in practice. Environ. Plan. A 2017, 49, 2065–2081. [Google Scholar] [CrossRef]
- Ma, Y.; Kang, J.; Zhang, J.; Zheng, F. College Students’ Consumption Behavior—A Case Study on Students in Ningxia University. Sustain. Dev. 2019, 9, 776–782. [Google Scholar] [CrossRef]
- Yin, Y.; Hu, J. The analysis of the advantages and disadvantages of the online food delivery phenomenon in universities and the research on the countermeasures—Based on the empirical study of Jiangpu campus of Nanjing university of technology and its surroundings. Pop Stand 2019, 16, 46–48. [Google Scholar]
- Byun, J.H.; Park, M.H.; Jeong, B.Y. Effects of age and violations on occupational accidents among motorcyclists performing food delivery. Work 2020, 65, 53–61. [Google Scholar] [CrossRef] [PubMed]
- Zhang, Y.; Huang, Y.; Wang, Y.; Casey, T.W. Who uses a mobile phone while driving for food delivery? The role of personality, risk perception, and driving self-efficacy. J. Saf. Res. 2020, 73, 69–80. [Google Scholar] [CrossRef] [PubMed]
- Jia, S.S.; Gibson, A.A.; Ding, D.; Allman-Farinelli, M.; Phongsavan, P.; Redfern, J.; Partridge, S.R. Perspective: Are Online Food Delivery Services Emerging as Another Obstacle to Achieving the 2030 United Nations Sustainable Development Goals? Front. Nutr. 2022, 9, 858475. [Google Scholar] [CrossRef] [PubMed]
- Ma, Y. Current situation and solution of online food delivery in campus—A case study on students of Anhui Economic University. Mod. Bus. Trade Ind. 2019, 7, 50–51. [Google Scholar]
- Online Food Delivery Market to Hit $151.5B in Revenue and 1.6B Users in 2021, a 10% Jump in a Year. Available online: https://ajot.com/news/online-food-delivery-market-to-hit-151.5b-in-revenue-and-1.6b-users-in-2021-a-10-jump-in-a-year (accessed on 18 January 2023).
- Li, C.; Mirosa, M.; Bremer, P. Review of online food delivery platforms and their impacts on sustainability. Sustainability 2020, 12, 5528. [Google Scholar] [CrossRef]
- Song, G.; Zhang, H.; Duan, H.; Xu, M. Packaging waste from food delivery in China’s mega cities. Resour. Conserv. Recycl. 2018, 130, 226–227. [Google Scholar] [CrossRef]
- Wen, Z.; Zhang, Y.; Fu, D. The environmental impact assessment of a takeaway food delivery order based on of industry chain evaluation in China. China Environ. Sci. 2019, 39, 4017–4024. [Google Scholar]
- Yi, Y.; Wang, Z.; Wennersten, R.; Sun, Q. Life cycle assessment of delivery packages in China. Energy Procedia 2017, 105, 3711–3719. [Google Scholar] [CrossRef]
- Fan, W.; Xu, M.; Dong, X.; Wei, H. Considerable environmental impact of the rapid development of China’s express delivery industry. Resour. Conserv. Recycl. 2017, 126, 174–176. [Google Scholar] [CrossRef]
- Zhang, H.; Xue, L.; Jiang, Y.; Song, M.; Wei, D.; Liu, G. Food delivery waste in wuhan, china: Patterns, drivers, and implications. Resour. Conserv. Recycl. 2022, 177, 105960. [Google Scholar] [CrossRef]
- Zhang, Y.; Wen, Z. Mapping the environmental impacts and policy effectiveness of takeaway food industry in China. Sci. Total Environ. 2022, 808, 152023. [Google Scholar] [CrossRef] [PubMed]
- Liu, G.; Agostinho, F.; Duan, H.; Song, G.; Wang, X.; Giannetti, B.F.; Lega, M. Environmental impacts characterization of packaging waste generated by urban food delivery services. A big-data analysis in Jing-Jin-Ji region (China). Waste Manag. 2020, 117, 157–169. [Google Scholar] [CrossRef] [PubMed]
- Camps-Posino, L.; Batlle-Bayer, L.; Bala, A.; Song, G.; Qian, H.; Aldaco, R.; Fullana-i-Palmer, P. Potential climate benefits of reusable packaging in food delivery services. A Chinese case study. Sci. Total Environ. 2021, 794, 148570. [Google Scholar] [CrossRef]
- Vitale, G.; Mosna, D.; Bottani, E.; Montanari, R.; Vignali, G. Environmental impact of a new industrial process for the recovery and valorisation of packaging materials derived from packaged food waste. Sustain. Prod. Consum. 2018, 14, 105–121. [Google Scholar] [CrossRef]
- Evans, D. Beyond the throwaway society: Ordinary domestic practice and a sociological approach to household food waste. Sociology 2012, 46, 41–56. [Google Scholar] [CrossRef]
- Inaba, A.; Kazama, R.; Tamari, Y.; Morimoto, R. Method for estimating CO2 emissions from home cooking. J. LCA Soc. Jpn. 2014, 10, 155–164. [Google Scholar]
- Mancini, P.; Marchini, A.; Simeone, M. Which are the sustainable attributes affecting the real consumption behaviour? Consumer understanding and choices. Br. Food J. 2017, 119, 1839–1853. [Google Scholar] [CrossRef]
- Vasileva, E.; Ivanova, D. Towards a sustainable consumer model: The case study of Bulgarian recyclers. Int. J. Consum. Stud. 2014, 38, 475–484. [Google Scholar] [CrossRef]
- Qiu, Z.; Meng, B.; Lin, Y.; Chen, S. Research on the status quo of sorting and disposing of food waste from takeout of college students. Mod. Food 2019, 5, 187–191. [Google Scholar]
- Cichocka, I.; Krupa, J.; Mantaj, A. The consumer awareness and behaviour towards food packaging in Poland. Econ. Sociol. 2020, 13, 304–317. [Google Scholar] [CrossRef]
- Inaba, A.; Masayuki, M.; Kazama, R.; Tamari, Y.; Morimoto, R. Method for estimating CO2 emissions from restaurant menus. J. LCA Soc. Jpn. 2014, 10, 308–314. [Google Scholar]
- Tsuda, Y.; Oie, C.; Seto, M.; Kubokura, H.; Inaba, A. Practical quantification of life cycle CO2 emissions from cooking. J. LCA Soc. Jpn. 2006, 2, 288–297. [Google Scholar]
- Tsuda, Y.; Kubokura, H.; Tsujimoto, S.; Ueda, R.; Oie, C. Evaluation of LC-CO2 of Japanese diet by model menu. J. LCA Soc. Jpn. 2007, 3, 157–167. [Google Scholar]
- Packstyle. Available online: https://www.packstyle.jp/ (accessed on 5 April 2023).
- Plastic Recycling and Use Association. Considering LCA; Plastic Recycling and Use Association: Beijing, China, 2019; p. 27. [Google Scholar]
- Nearly 40% Complain That Orders Are Hard to Get! What Are the Real Feelings on the Part of Delivery Staff about the Growing Demand for Food Delivery? Available online: https://prtimes.jp/main/html/rd/p/000000003.000099828.html (accessed on 18 January 2023).
- Matsuhashi, K.; Kudo, Y.; Ueoka, N.; Moriguchi, Y. Comparative study on methods for estimating CO2 emissions in the transportation sector of municipalities. Environ. Syst. Res. 2004, 32, 235–242. [Google Scholar] [CrossRef]
- Demaecan. Available online: https://corporate.demae-can.co.jp/ (accessed on 5 April 2023).
- Heard, B.R.; Bandekar, M.; Vassar, B.; Miller, S.A. Comparison of life cycle environmental impacts from meal kits and grocery store meals. Resour. Conserv. Recycl. 2019, 147, 189–200. [Google Scholar] [CrossRef]
- Iideli. Available online: https://iideli.com/archives/3418 (accessed on 5 April 2023).
- Plastic Recycling and Utilisation Association. Available online: https://www.pwmi.or.jp/pdf/panf1.pdf (accessed on 18 January 2023).
- Bento Delivery Service Survey 88% of Respondents Said That What They Want in a Delivery Bento Is “Taste”. The Popularity Ranking of Bento by Genre Is Also Announced! Available online: https://prtimes.jp/main/html/rd/p/000000011.000007949.html (accessed on 18 January 2023).
- Japanese Food Guide Spinning Top. Available online: https://www.mhlw.go.jp/bunya/kenkou/pdf/eiyou-syokuji5.pdf (accessed on 5 April 2023).
- Japan Waste Disposal Report. Available online: https://www.env.go.jp/recycle/waste_tech/ippan/r2/data/disposal.pdf (accessed on 5 April 2023).
- Siracusa, V.; Blanco, I. Bio-Polyethylene (Bio-PE), Bio-Polypropylene (Bio-PP) and Bio-Poly (ethylene terephthalate) (Bio-PET): Recent developments in bio-based polymers analogous to petroleum-derived ones for packaging and engineering applications. Polymers 2020, 12, 1641. [Google Scholar] [CrossRef]


Disclaimer/Publisher’s Note: The statements, opinions and data contained in all publications are solely those of the individual author(s) and contributor(s) and not of MDPI and/or the editor(s). MDPI and/or the editor(s) disclaim responsibility for any injury to people or property resulting from any ideas, methods, instructions or products referred to in the content. |
© 2023 by the authors. Licensee MDPI, Basel, Switzerland. This article is an open access article distributed under the terms and conditions of the Creative Commons Attribution (CC BY) license (https://creativecommons.org/licenses/by/4.0/).