Article

Cross-Scale Analysis on the Working Performance of Micropile Group and Talus Slope System

1
School of Civil Engineering, Dalian University of Technology, Dalian 116024, China
2
Wuhan Center of China Geological Survey (Central South China Innovation Center for Geosciences), Wuhan 430205, China
3
Key Laboratory of High-Speed Railway Engineering, Ministry of Education, Southwest Jiaotong University, Chengdu 610031, China
4
Institute of Geotechnical Engineering, Hebei University, Baoding 071000, China
*
Authors to whom correspondence should be addressed.
Sustainability 2023, 15(10), 8154; https://doi.org/10.3390/su15108154
Submission received: 2 March 2023 / Revised: 24 April 2023 / Accepted: 11 May 2023 / Published: 17 May 2023

Abstract

:
Micropile groups (MPGs), combined with the advantages of the anti-slip pile and anchor cable, offer an efficient support system that can be used as countermeasures for stabilizing the talus slopes. However, the performance of MPGs in stabilizing the talus slopes is rarely numerically investigated from the continuous-discontinuous viewpoints. To fulfil this knowledge gap, a numerical method coupled with the discrete element method (DEM) with the finite element method (FEM) is proposed first, and validated to be with good accuracy by the centrifuge model tests. A series of cross-scale analysis cases are then adopted to assess the behavior of MPG in the talus slopes, in which the influencing factors are also taken into account. The numerical results indicate that the MPGs reinforcement can significantly improve the stability of the talus slopes, avoiding the potential progressive shallow slip. For the MPGs with different pile spacing, the distribution laws of deformation and internal force are rather similar, but the one whose pile spacing is four times the pile diameter shows better performance. Moreover, the effective anchorage length of MPG is approximately 1/3 of the pile length, and the axial force distribution is influenced by the type of pile bottom constraint and the tangential contact between the micropile and the bedrock. Finally, the “bidirectional anchorage” attributed to the platform and the bedrock can greatly improve the performance of the MPG, which is a non-negligible part of the anti-slip mechanism of the MPG. This study is of great significance for facilitating the design of MPG in stabilizing the talus slopes.

1. Introduction

The talus slopes are widely distributed worldwide, especially in high-altitude areas, and they have obvious discontinuous and non-homogeneous characteristics [1,2]. With the implementation of China’s “One Belt, One Road” initiative, numerous roads, railroads, and other infrastructures under construction are affected by this type of slope [3]. The instability of the talus slope usually causes geological disasters such as landslides, collapse, and debris flow, which may lead to tremendous economic losses and human casualties. To control or mitigate the potential disaster risk of the talus slopes, it is necessary and important to carry out emergency treatments, in which the micropile (MP) is most commonly used owing to its advantages of light structure, faster construction, and less disturbance [4].
Currently, the anti-slip mechanism and design of the MP have been studied and analyzed using model tests [5,6] and numerical simulations [7,8]. Numerical methods, such as the finite difference method (FLAC) and finite element method (ABAQUS, ANSYS) [9,10], are commonly used in the simulation of MPs, focusing on pile parameters, reinforcement position, soil arching effect, and other aspects. Elaziz et al. [11] and Alnuaim et al. [12] numerically investigated the performance of roadbed slopes reinforced by MP using the finite element method (FEM), which is more suitable for the simulation of small-strain deformations. Wang et al. [13] present a numerical model for the seismic behavior of the embankment constructed on an MP composite foundation, embankments on the soils treated by MPs were simulated by an axisymmetric elastoplastic FEM.
At this late hour, many experts and engineers worldwide have conducted in-depth research on the MPG from the perspective of theoretical analyses [14,15,16] and engineering applications [17] and have arrived at considerable achievements. However, there is still a lack of systematic research on the working performance of the MPG in the talus slopes, such as the internal force and deformation characteristics of the pile group, the thrust transfer from the potential sliding mass, and the coordinated deformation of the pile and soil. Thus, there are still safety risks or waste of resources in the current design methods for the talus slopes stabilized with MPGs. Particularly, the current simulation of MPs in slope engineering mostly adopts a single numerical method [12,16,18], which does not apply to the large deformation behavior of the talus slope with discontinuities [19]. At the same time, the numerical simulation based on the discrete element method (DEM) is more suitable for the talus slope, whose discontinuous characteristics can be highlighted better.
With the development of numerical methods and the growth in engineering demands, refined simulation has gradually become mainstream in geotechnical engineering. Therefore, a coupled DEM-FEM numerical method was developed, where the DEM was adopted to simulate loose deposits, and the FEM was used to simulate the bedrock and MPG. The cross-scale analysis based on the coupled DEM-FEM method was carried out herein to explore the stabilization mechanism, stress and stain in the MPG-reinforced talus slopes, facilitating the development and improvement of the design methods for the MPG used in the talus slopes.

2. Cross-Scale Analysis Based on Coupled DEM-FEM Method

2.1. Discrete Element Model

The loose deposit of the talus slope usually consists of a soil and rock mixture, with the obvious discrete characteristics of discontinuities and non-homogeneity [20]. Compared with the finite element method (FEM), the discrete element method (DEM) is highly capable of modeling the discrete nature of granular materials. Instead of assuming a complex soil constitutive model, DEM can automatically reflect the macroscopic physico-mechanical behaviors of the geomaterials based on simple microscopic contact models between particles. The talus slope is discretized into rigid DEM particles with the PD3D type elements; the movement of each particle is determined by Newton’s equations:
m i v ˙ i = F i
I i ω ˙ i = M i
where mi and Ii are the mass and moment of inertia v ˙ i and ω ˙ i are the acceleration and angular acceleration of the particle i, respectively. F i denotes the total force applied on the particle i while M i representing relevant torques [21].
Quaternary glacial deposits simulated in this paper have poor cementation. To consider the irregular shape and the occluding effect between deposits, the Johnson–Kendall-Roberts (JKR) adhesive normal contact model was adopted as a contact model for spherical particles in the simulation. In this model, the governing equation was formulated according to Newton’s second law, and the contact forces can be calculated as follows [22]:
F = 4 E a 3 3 R 8 π Γ a 3
δ n = a 2 R 2 π Γ a E
R = R 1 R 2 R 1 + R 2
1 E = 1 ν 1 2 E 1 + 1 ν 2 2 E 2
In the above equations, Γ is the surface energy per unit area of the two contacting particles; δn is the distance of two spherical particles in contact; E1, ν1 and E2, ν2 are the effective Young’s modulus and Poisson’s ratio of the two contacting particles, respectively; R1 and R2 are the radii of the two contacting particles, respectively.
In the particle flow simulated by the DEM, overlapping spheres are usually used to describe irregular morphological granules and present a certain gradation law, but this will increase computation amounts [23,24]. Therefore, the discrete element particles in this paper were simplified as spheres with uniform sizes to reduce the computation amounts [25]. The DEM model can reproduce the macroscopic mechanical properties of the loose deposit through the calibration of the microscopic contact parameters such as friction coefficient and contact stiffness, etc.

2.2. MPG-Soil Interaction Modelling

MPGs and bedrock are simulated using the linear elastic model in ABAQUS, where the damage and plastic deformation of the materials are not taken into account to simplify the simulation. General contact is a simple but effective contact model in coupled simulations of ABAQUS. In general contact, the particles are not part of the general contact domain, similar to other 1-node elements (such as point masses), while the finite element is considered as the “wall”. The Hertz contact model was adopted in the simulation of MPG-soil interaction; the normal and tangential contact forces are calculated by the following equation:
F = 4 3 E R δ n 3
F = { K τ δ τ τ C t V ( | F | < | F f | ) μ | F | τ ( | F | | F f | )
where F is the normal extrusion force, is the tangential contact force, Kτ is the tangential stiffness coefficient, τ is the tangential direction vector in the contact surface, δτ is the tangential displacement, Ct is the tangential damping coefficient, V is the tangential relative velocity vector, μ is the friction coefficient, and F f is the ultimate tangential force (Equation (9)). Since the pile is not the discrete element in Hertz contact, E and R in Equation (7) are taken to be the elasticity modulus and the radius of the particle.
| F f | = μ | F |

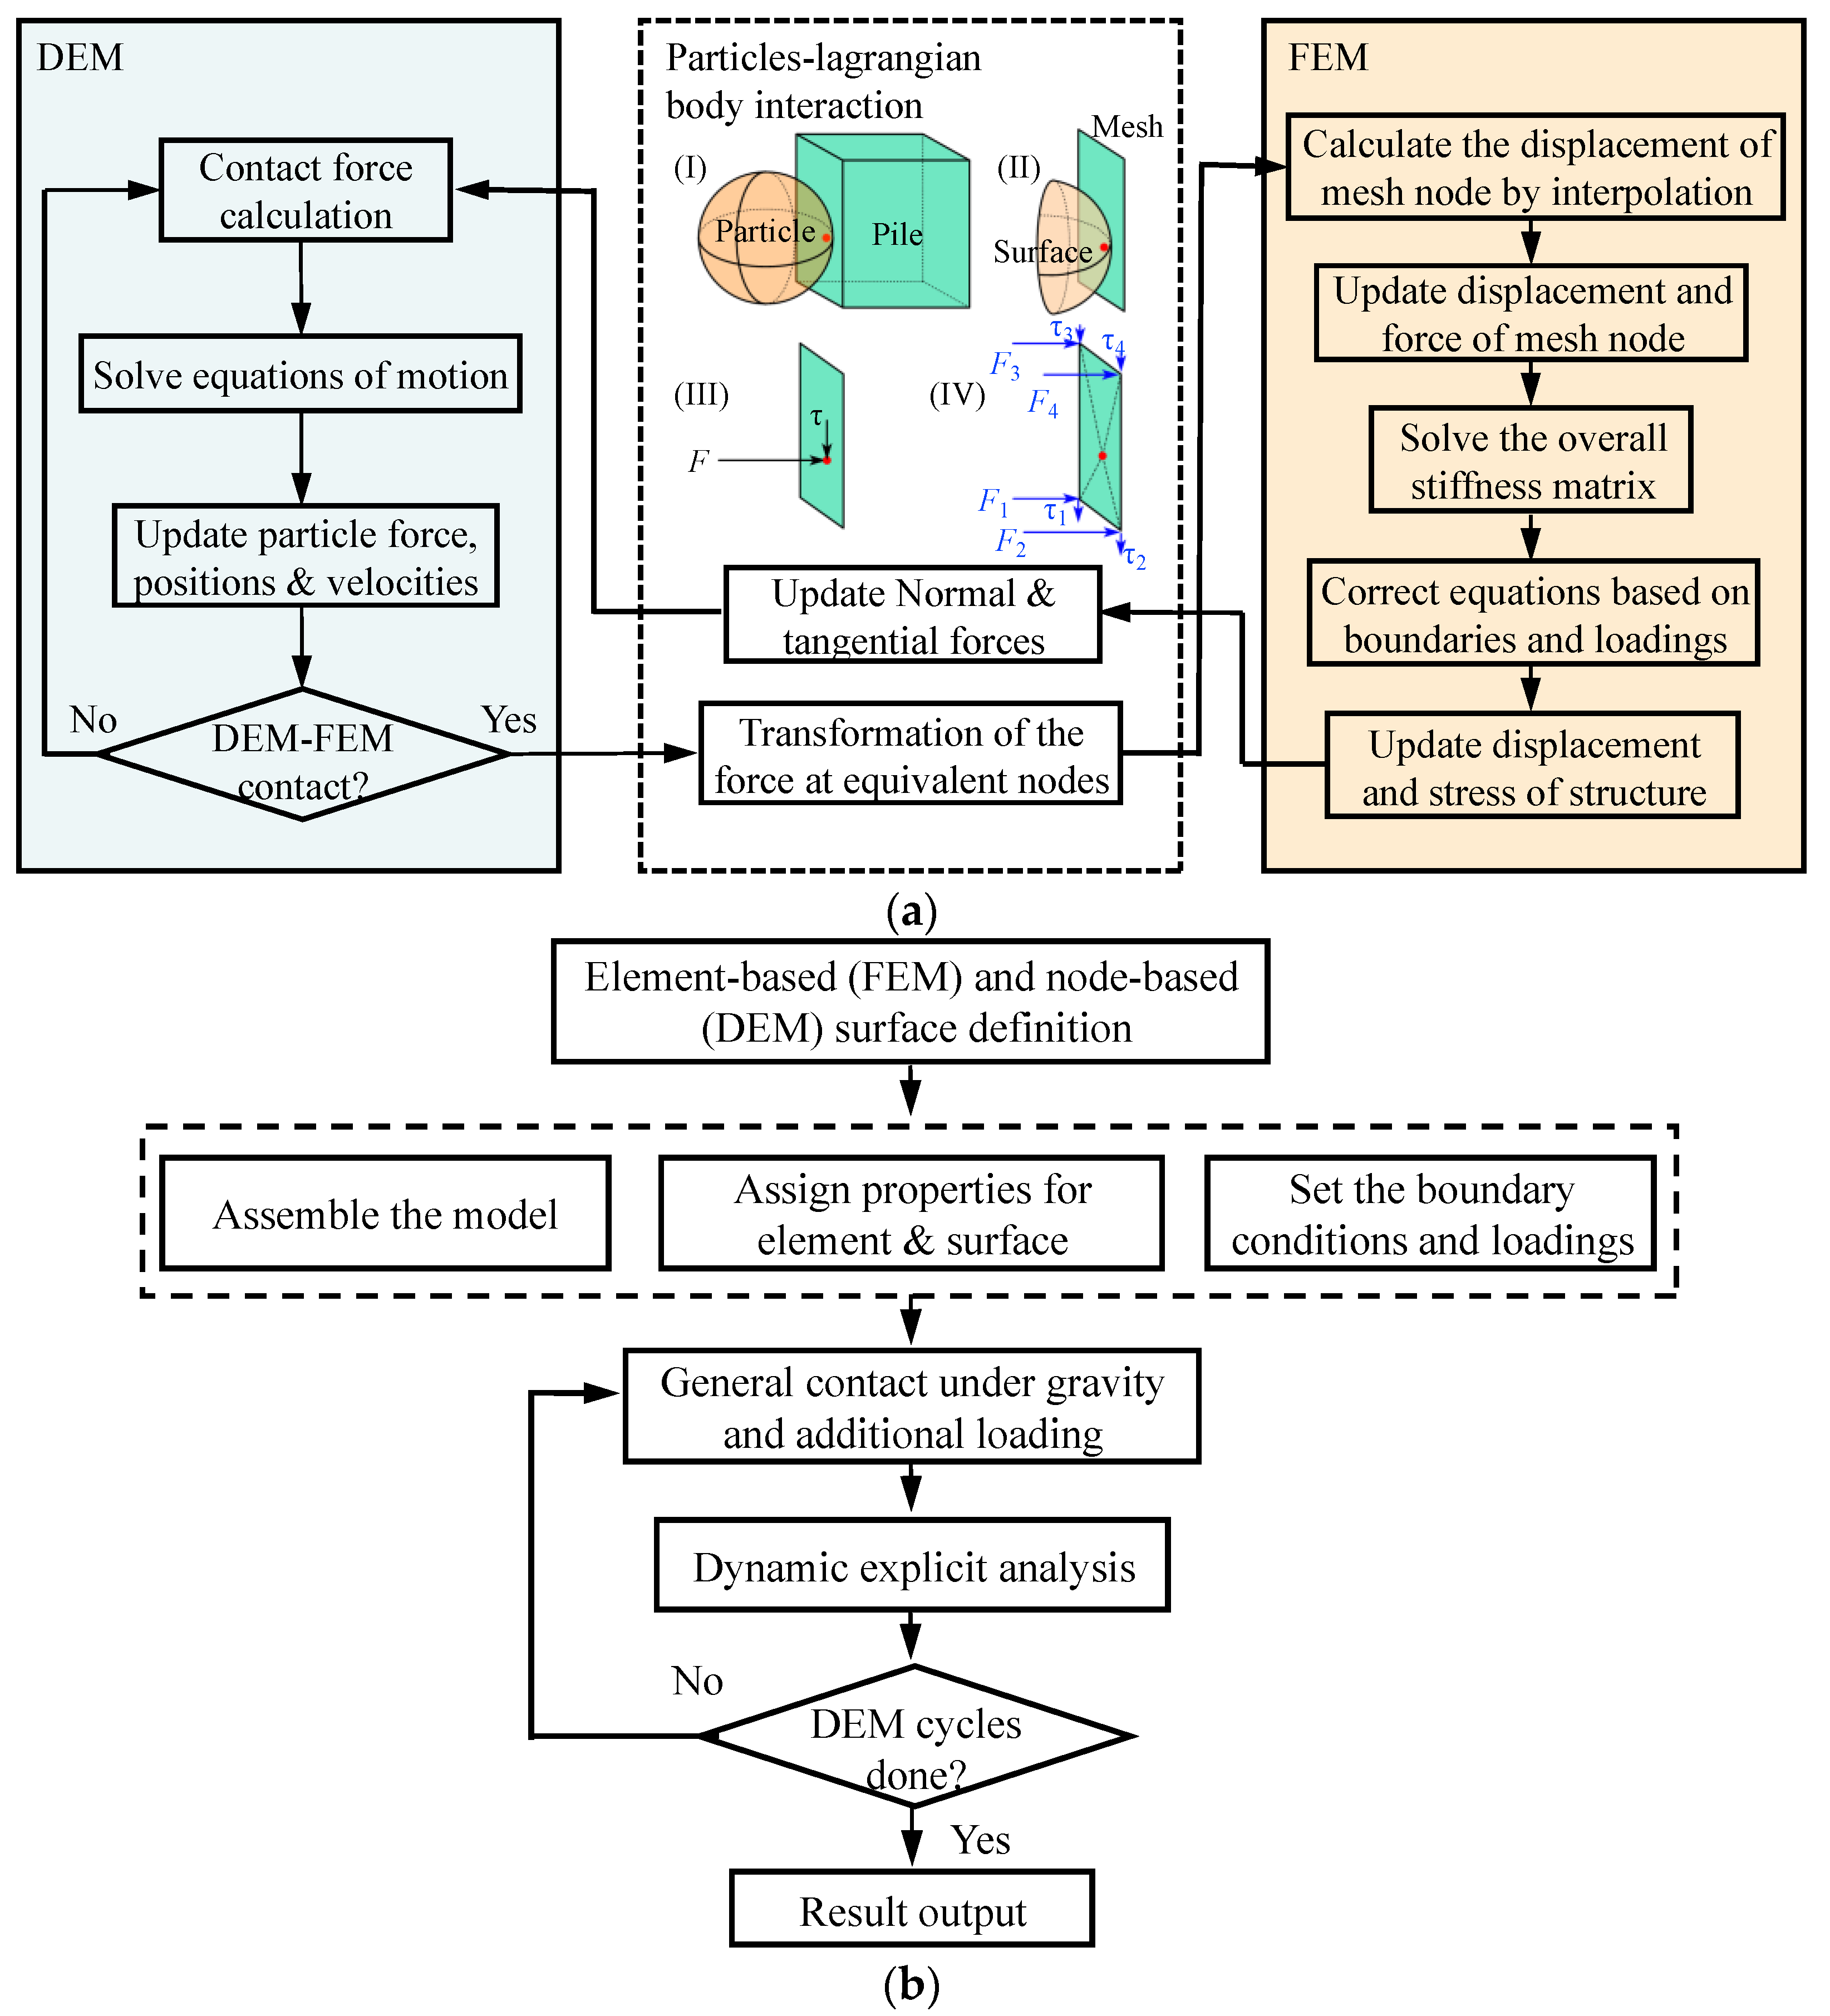
2.3. Cross-Scale Analysis Based on Coupled DEM-FEM Method

The key to the implementation of the cross-scale analysis based on the couple DEM-FEM numerical method is the contact between the particles and the finite element cell (Lagrangian bodies). The core is to consider the particles in contact with the finite element as the 1-node elements (such as point mass), which would convert the particles’ action into an equivalent nodal force applied to the finite element mesh (Figure 1a). The coupled simulation employs a surface-based contact method; the first is the surface definitions for the bodies that could be in contact (DEM particles and Lagrangian surfaces). Then, the “general contact” of the interacting surfaces is set, where the surface properties need to be considered in the contact. Finally, an appropriate contact model is selected to perform the dynamic explicit analysis (Figure 1b).
In this paper, the discrete element models are constructed by modifying the model file, replacing the original model with the point mass, then modifying the element type to the rigid discrete element (PD3D), and generating the particles at the original mesh nodes. These generated discrete particles require user customization of material properties, surface properties, damping and constitutive models via the Python code, and contact assignment in the subsequent dynamic explicit analysis.
Dynamic explicit analysis based on the direct integration method is adopted in the coupled simulation, and the numerical simulation performed by the coupled DEM-FEM method belongs to a mode-based transient response analysis. To achieve an accurate solution, it is necessary to keep the time increment smaller enough to satisfy the condition that the acceleration remains constant during a time increment step. Thus, the amount of incremental steps in this coupled simulation is large, and a higher-performance computer with optimized simulation settings is usually required to increase the efficiency of the calculation.

3. Validation of the Cross-Scale Analysis Based on the Coupled DEM-FEM Method

3.1. Example of the Talus Slope with Micropiles

To validate the coupled DEM-FEM method for the pile–soil interaction, a typical talus slope with continuous-discontinuous characteristics is employed in this study (Figure 2). The adopted slope is a kind of widespread talus slope in nature, which has a dual structure formed by underlying bedrock and overlying loose deposits, where the loose deposit is mainly a mixture of the soil and the rock, which is poorly graded and slightly cohesive [26]. The initial condition of the slope is not in line with the engineering requirements (with a factor of safety of approximately 1.1 by limit equilibrium method); therefore, three pile types, conventional piles (CP), and MPGs, were selected for the reinforcement in the validation (Table 1).

3.2. Numerical Simulation Settings

The model constructed in this study is based on the presented coupled DEM-FEM method, i.e., the upper loose deposit is simulated by discrete particles (each particle serves as an independent rigid unit), while the pile and the bedrock are modeled by the finite-element cell (Figure 3). Moreover, it is also necessary to set a “box” as the simulation domain of discrete particles, which were simulated by rigid elements.
To simulate the well-anchored effect of bedrock on the pile, the bedrock is simulated by a continuous finite element cell. However, the contact between the bedrock and the particles cannot be performed by the JKR contact model, so a part named “Slide” simulated by discrete particles is added close to the surface of the bedrock to realize the contact between the bedrock and loose deposit (Figure 3c). The physical and mechanical parameters of the model are shown in Table 2 [20,27].
The vital part of the model setup is the identification of contact parameters between the loose deposit and the bedrock (Slide). The parameters of contacts between the loose deposit and the bedrock are referred to in the setup of the centrifuge model test previously performed by Pei et al. [20]. The direct shear test was conducted to measure the contact property between the bedrock and the loose deposit, and the results are close to that of the loose deposit, also obtained by the direct shear test. Thus, the self-contact parameters of the loose deposit are also adopted for the contacts between the bedrock and the loose deposit.

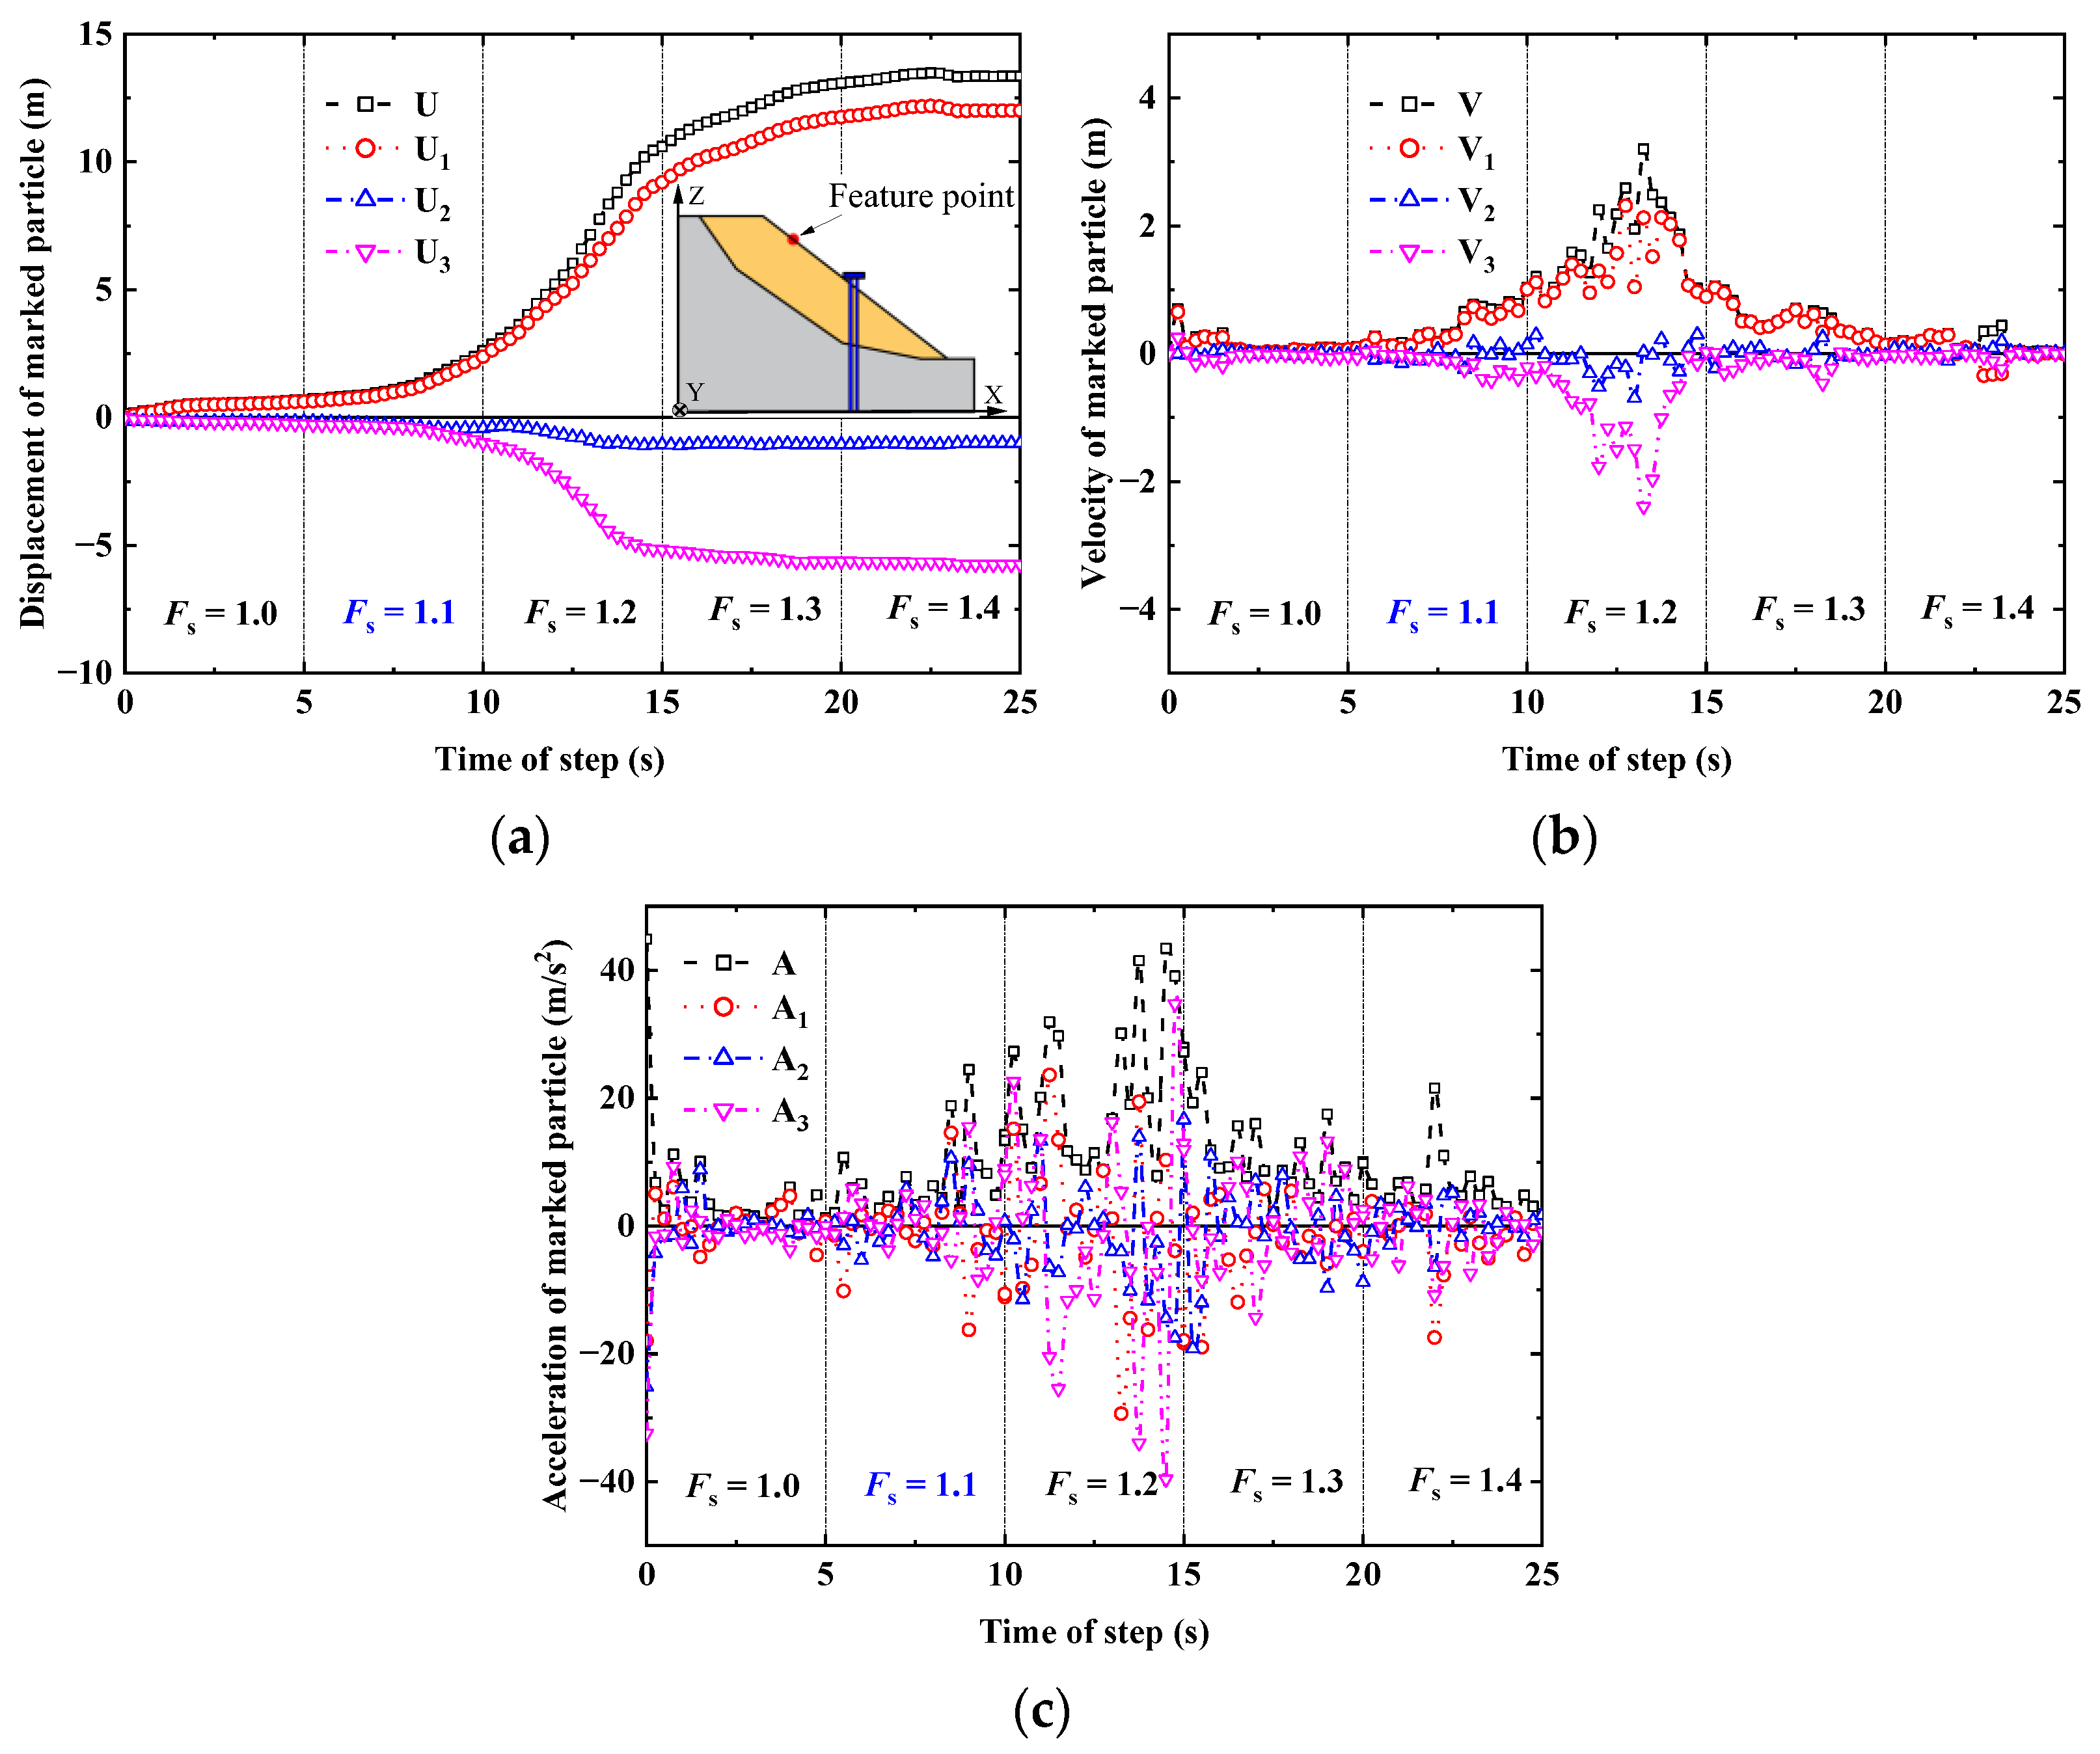
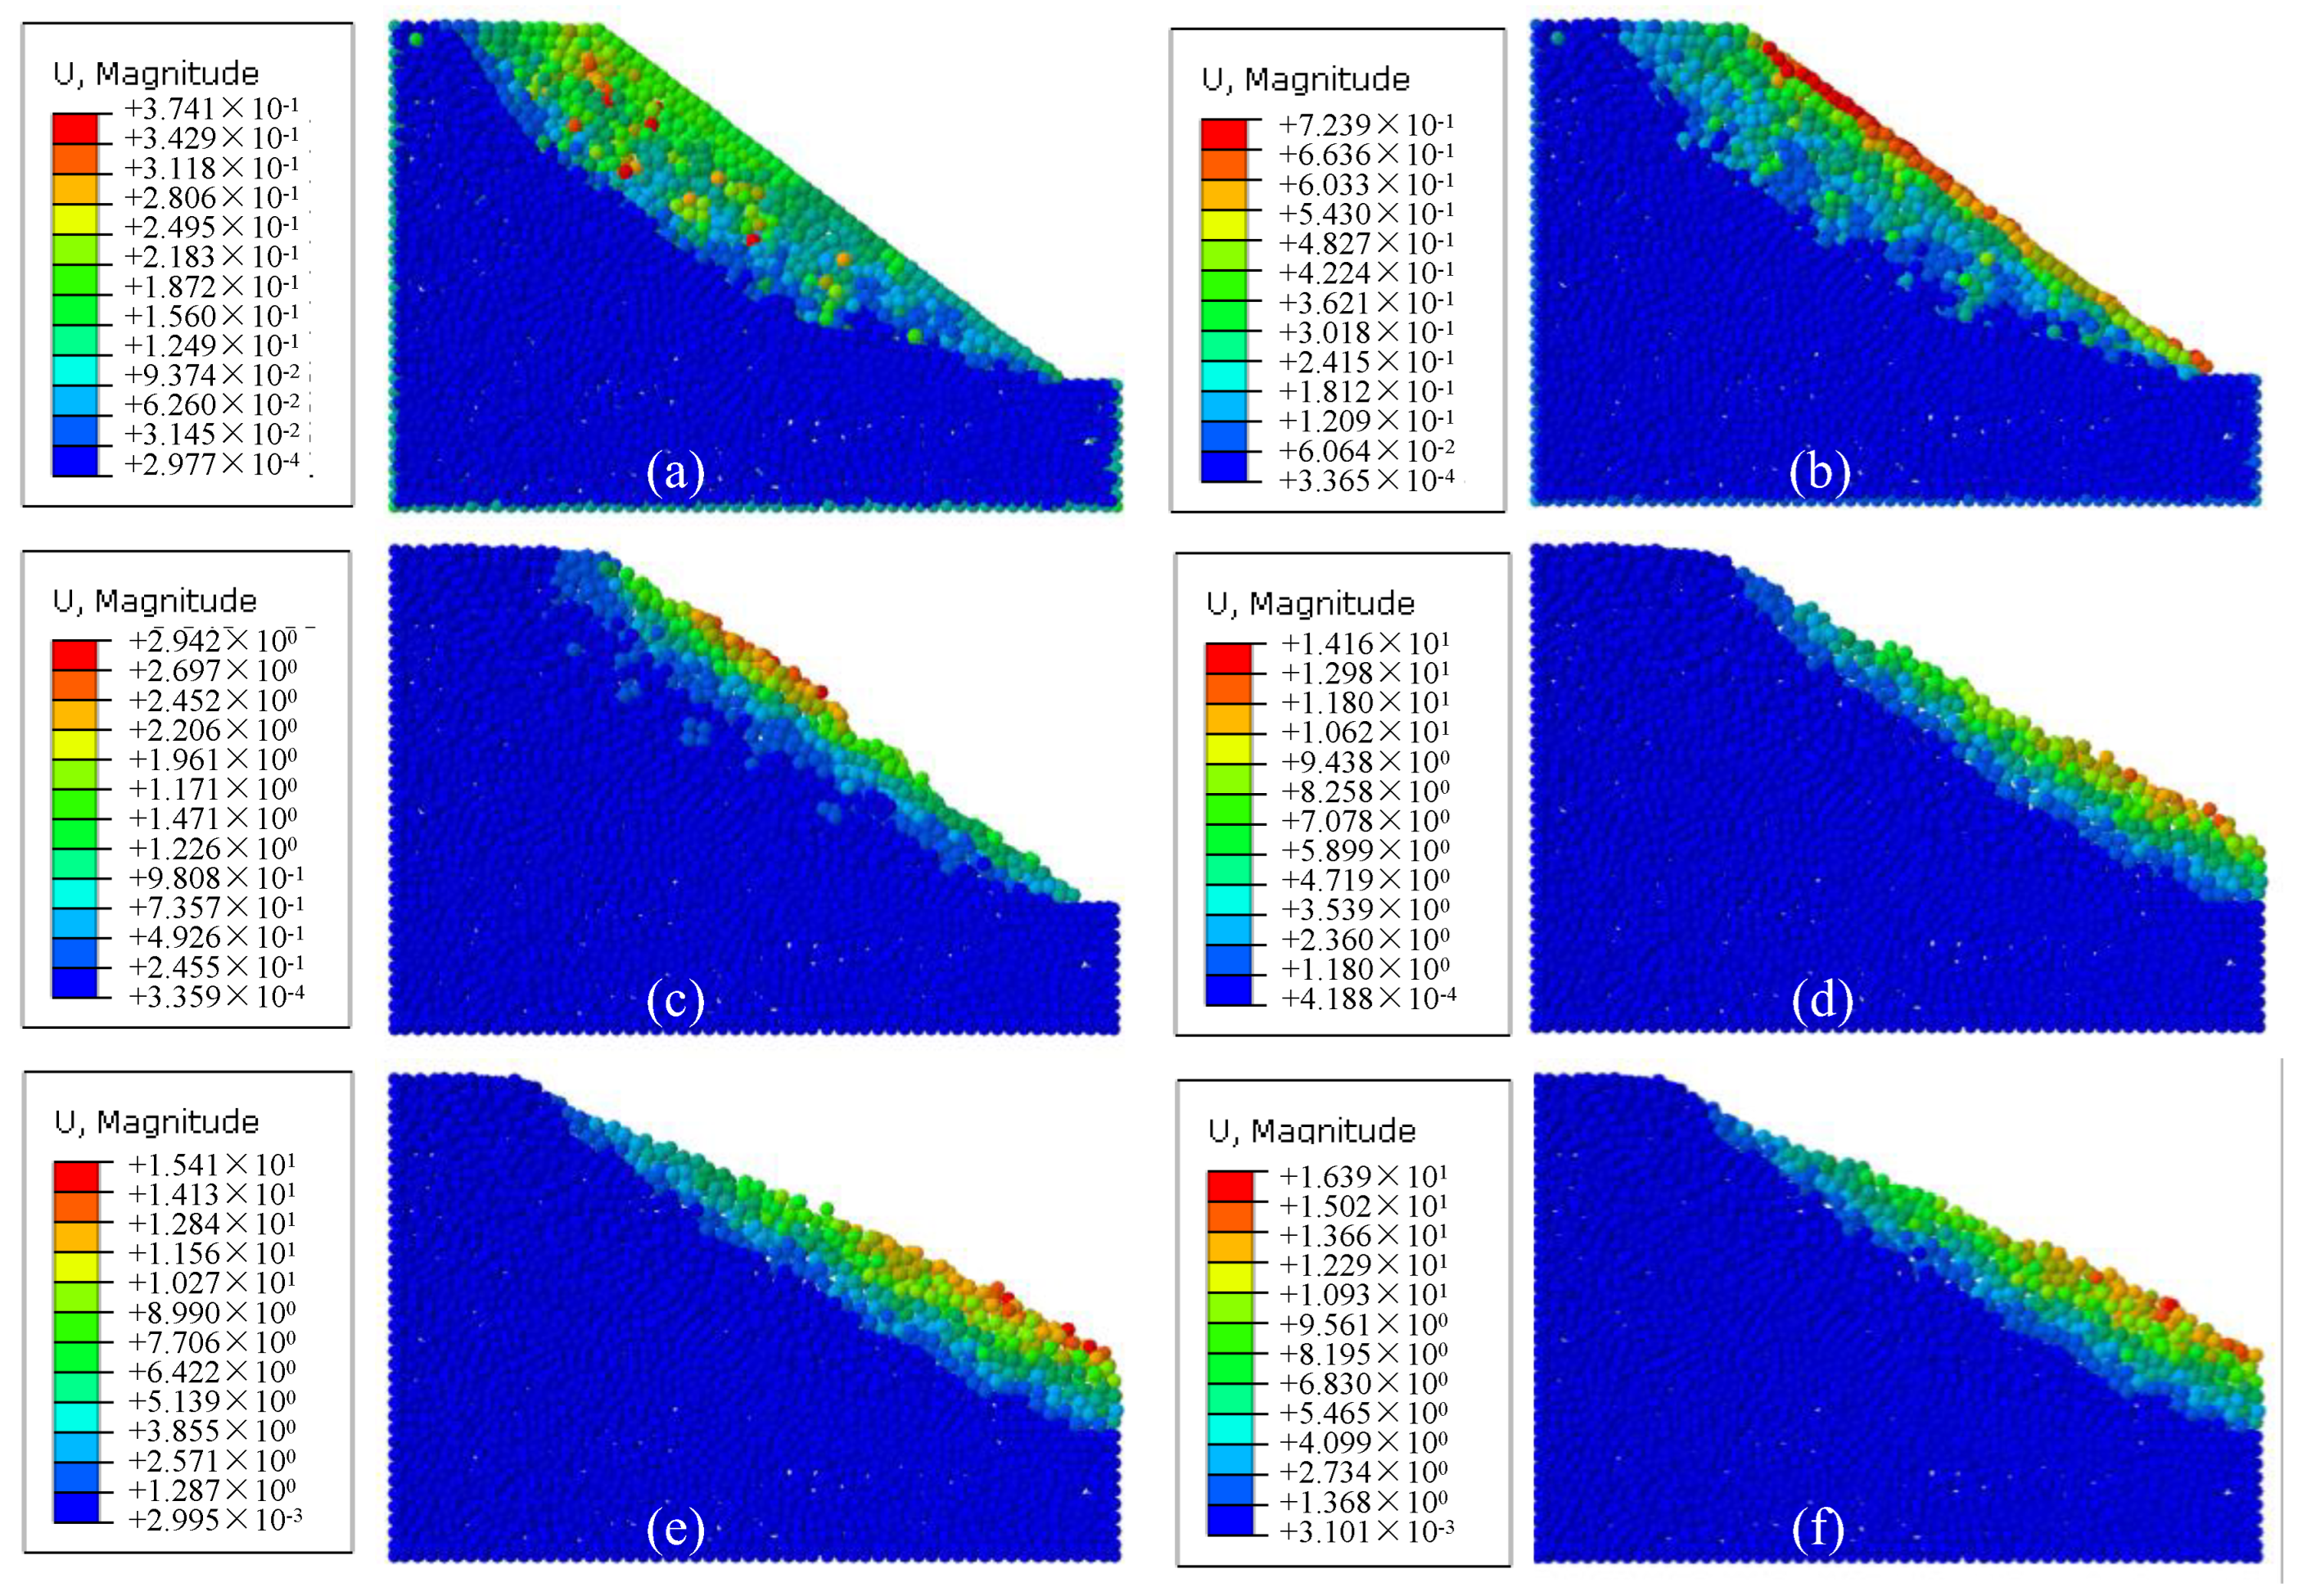
3.3. Validation of the Numerical Simulation

3.3.1. Calibration of Contact Parameters Adopted in Cross-Scale Analysis

Since there is no pile in the simulations for the unreinforced talus slope, the bedrock is directly simulated using DEM (similar to the part of “Slide”) to facilitate the calculation. In the simulation, the particle with the largest displacement in the slip process of the talus slope was chosen as the feature point. Multiple simulations based on the gravity increase method (GIM) were performed to obtain a combination of contact parameters (Table 3) and the time-history curves of displacement, velocity, and acceleration of the feature point (the point has the maximum displacement at 1 g), illustrated in Figure 4. The time–history curves of the displacement, velocity, and acceleration show that the overload multiple of gravity under the critical failure state for the talus slope is 1.1, which is in agreement with the Fs of the centrifuge model test (with a stability factor of 1.1 calculated by limited equilibrium method) [28,29].
The stability analysis of the unreinforced slope is conducted based on the GIM; the profile displacement contours are depicted in Figure 5. The deformation of the talus slope simulated by DEM can be divided into three stages as follows: (1) the initial stable stage (Figure 5a,b), the overall deformation of the loose deposit has mainly resulted from the crowding effect of the particles by gravity, with the largest displacement emerging at the slope surface and gradually spreading from the slope top to the slope toe (progressive failure); (2) the stage of accelerated instability (Figure 5c,d), a shallow slip occurs because the adhesion between the particles is insufficient to resist relative sliding as the gravity increases to 1.1 g, [30,31]; (3) The stage of re-stabilization (Figure 5e,f), the slope angle continuously decreases to a threshold value owing to the cumulative slip, the slope gradually re-stabilizes when the average positive stress between the particles greater than the shear stress [32,33,34].

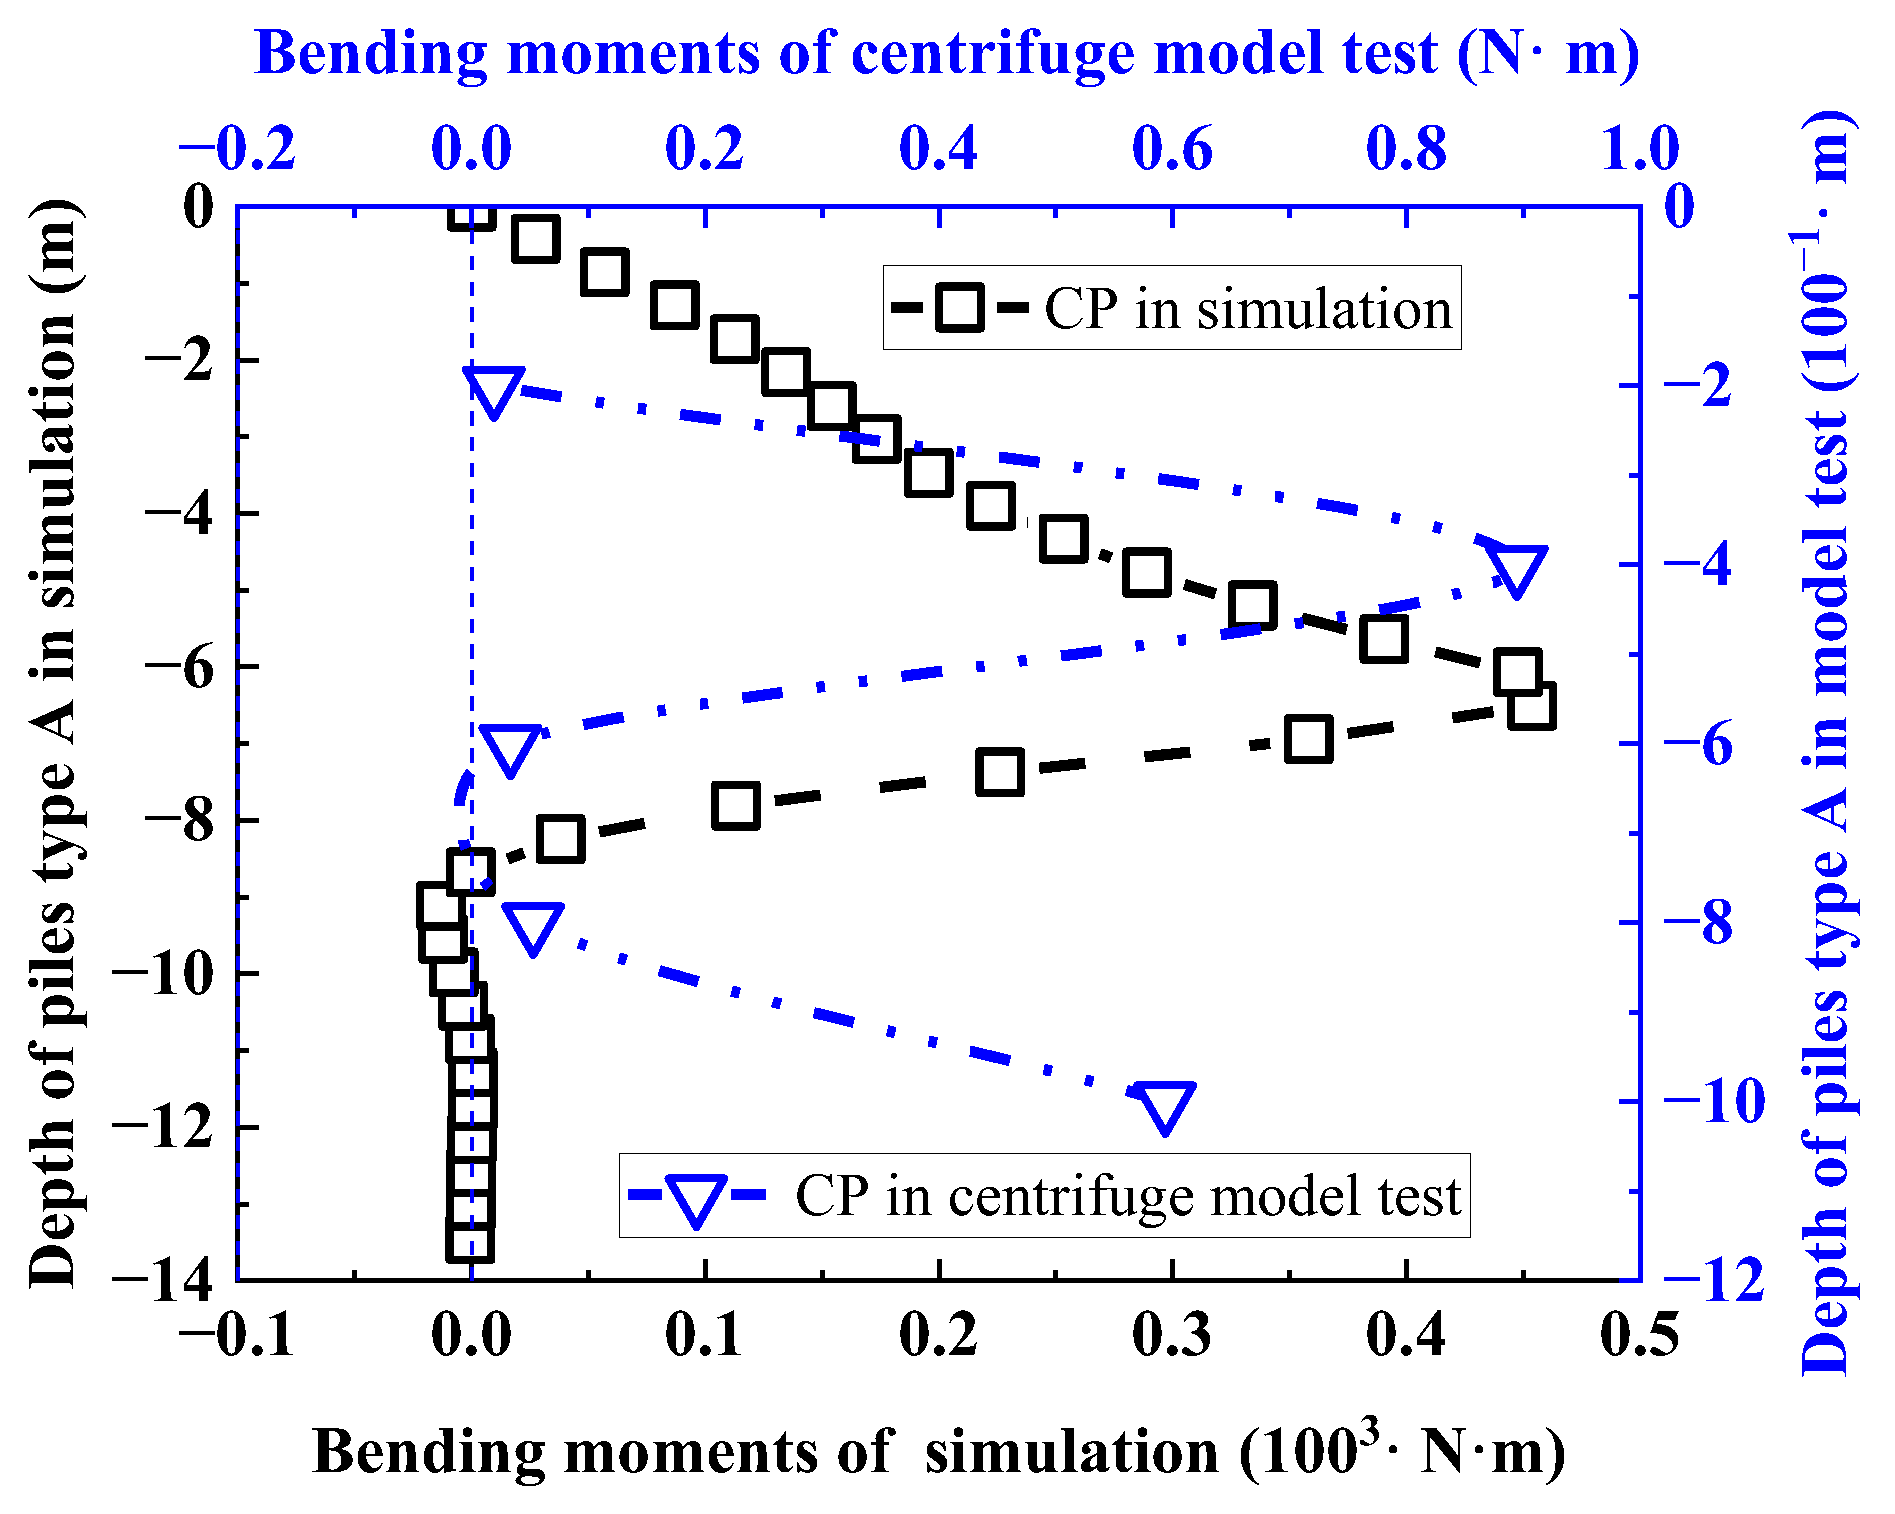
3.3.2. Talus Slope Reinforced by Pile Type A

Although shallow sliding occurs on the talus slope, the anchoring effect of the loose deposit is much less than that of the bedrock. For ease of expression, the anchoring section is defined below the bedrock surface, and the anti-slip section above the bedrock surface. To validate the internal force and deformation distribution of piles in simulation, the same ratio of the slope width and pile diameter was adopted in the simulation and centrifuge model test (the diameter of piles had increased due to the principle of similar flexural stiffness in the centrifuge model test).
Figure 6 presents the comparison of bending moment distribution for the piles type A (CP) obtained by the centrifuge model test [20] and the numerical simulation. The bending moment distributions of the anti-slip section are basically the same in the physical and numerical simulations. The bending moment increases first and then decreases along the depth, indicating that the piles type A shows a positive deflection (the clockwise deflection is defined as positive deflection), and the maximum bending moment is close to the interface of bedrock and loose deposits. In addition, the ratio of the bending moment obtained by centrifuge model tests to that calculated by numerical simulations is in accordance with the scaling ratio of 1:N3 (N is the scaling law) [35,36].
Within the anchored section, the bending moment distribution of pile type A in the numerical simulation is at variance with that determined by the centrifuge test; to be specific, the bending moment curve acquired by the model test shows another deflection. The main reason for the discrepancy lies in the difference between numerically and experimentally simulated contacts between the pile and the bedrock. In the numerical simulation, the ideal elastic model was used for the pile and the bedrock; the contact between the bedrock and the pile could be considered as a surface-to-surface contact so that the anchoring action of the bedrock to the pile equates to a continuously distributed load (Figure 7a). In contrast, the point–surface contact rather than surface–surface contact between the pile (Acrylic) and the bedrock (Cemented soil) in the centrifuge model test is inadequate, which would cause warping and deformation during pile anchoring (Figure 7b). The discontinuous rigid anchoring action along the depth would be magnified due to the scaling law, which would lead to an unreasonable deflection in the anchored section.
Moreover, the relative stiffness of the bedrock and the pile also affects the deformation characteristics of the pile. In the numerical simulation, there would be a greater flexural deformation as the bedrock deforms in compression with increasing depth (Figure 7c). While the flexural stiffness of model piles in the centrifuge test is obviously lower than the compressive stiffness of bedrock, the starting position for pile deflection deformation of model piles in the centrifuge test is higher (Figure 7d). Thus, the inflection location of the bending moment curve for the model test is near the bedrock surface.

3.3.3. Talus Slope Reinforced by Pile Type B

Similar to the piles type A, the performances of back row piles revealed by numerical and physical simulations are basically similar; bending moment curves were also shifted upwards in the test due to the difference in relative stiffness and anchorage (Figure 8a). However, there is a non-negligible difference in the relative magnitude of positive and negative bending moments of the front row piles between the simulations and the centrifuge tests (Figure 8b). The main reason is that the discontinuous bedrock support does not provide a sufficient anchoring effect, so the stress concentration in the anchored section in the centrifuge test results in a larger negative bending moment for the front row piles. Whereas the ideal and continuous anchoring effect in the simulation allows the deflection deformation of the piles to be mainly in the anti-slip section, so the positive bending moment in the anti-slip section is greater (Figure 8b). Moreover, due to the limitations of scaling down in the centrifuge model test, it was not possible to achieve stress and strain distribution with a strict scaling law between the centrifuge model test and simulation.
In cases where the slope is simulated by discrete particles, the contact pressure behind the piles is usually used to characterize the post-pile earth pressure or landslide thrust [37]. The contact between the MP and particles is discontinuous due to the discrete characteristics of the loose deposit; thus, the fitted envelopes of the discrete contact pressures are adopted as the soil pressure distribution curves in this paper [38].
The soil pressure distribution in the simulation still shows a trend of increasing at first and then decreasing with the depth of the pile [39], which is highly compatible with the centrifugal test, indicating that the coupled numerical method could simulate the pile–soil interactions in the prototype-scale (Figure 8c,d). However, there are some discrepancies between the extreme values of soil pressure determined by the numerical simulations and the model tests. The reasons for this phenomenon include two aspects. On the one hand, the slope in the centrifuge test has not exhibited an obvious deformation, the slope is still in a relatively stable state, and thus, the monitored soil pressures are smaller. On the other hand, the contact parameters adopted in the numerical simulation fail to reproduce the real properties of the coarse-grained soils fully. Therefore, establishing the quantitative correspondence between the contact parameters and the real soil properties will be the key issue in the future.
The deformation contour of the talus slope in coupled simulation is shown in Figure 9. There is a non-negligible settlement near the crest, and a bulge also occurs at the toe of the slope, which is consistent with the experimental phenomenon recorded in the centrifuge model test [20]. Moreover, the location of the potential slip surface is close to the bedrock surface, which agrees with the profile displacement vector map determined by the centrifuge test, indicating that the coupled numerical method is capable of solving the problems regarding the talus slope reinforced by pile type B. In addition, the displacement of the soil between the MPGs is noticeably greater than that of the soil behind the MPGs due to the pile group spacing being greater than the pile spacing (4D). The main reason for this phenomenon is a lack of effective support near the slope toe. The numerically simulated slope can shear out and form a bulge, and these phenomena are visible in the centrifuge model tests. In summary, the DEM-FEM coupling method could effectively reproduce the pile–soil interaction within the talus slope reinforced by the MPG, considering large deformation.

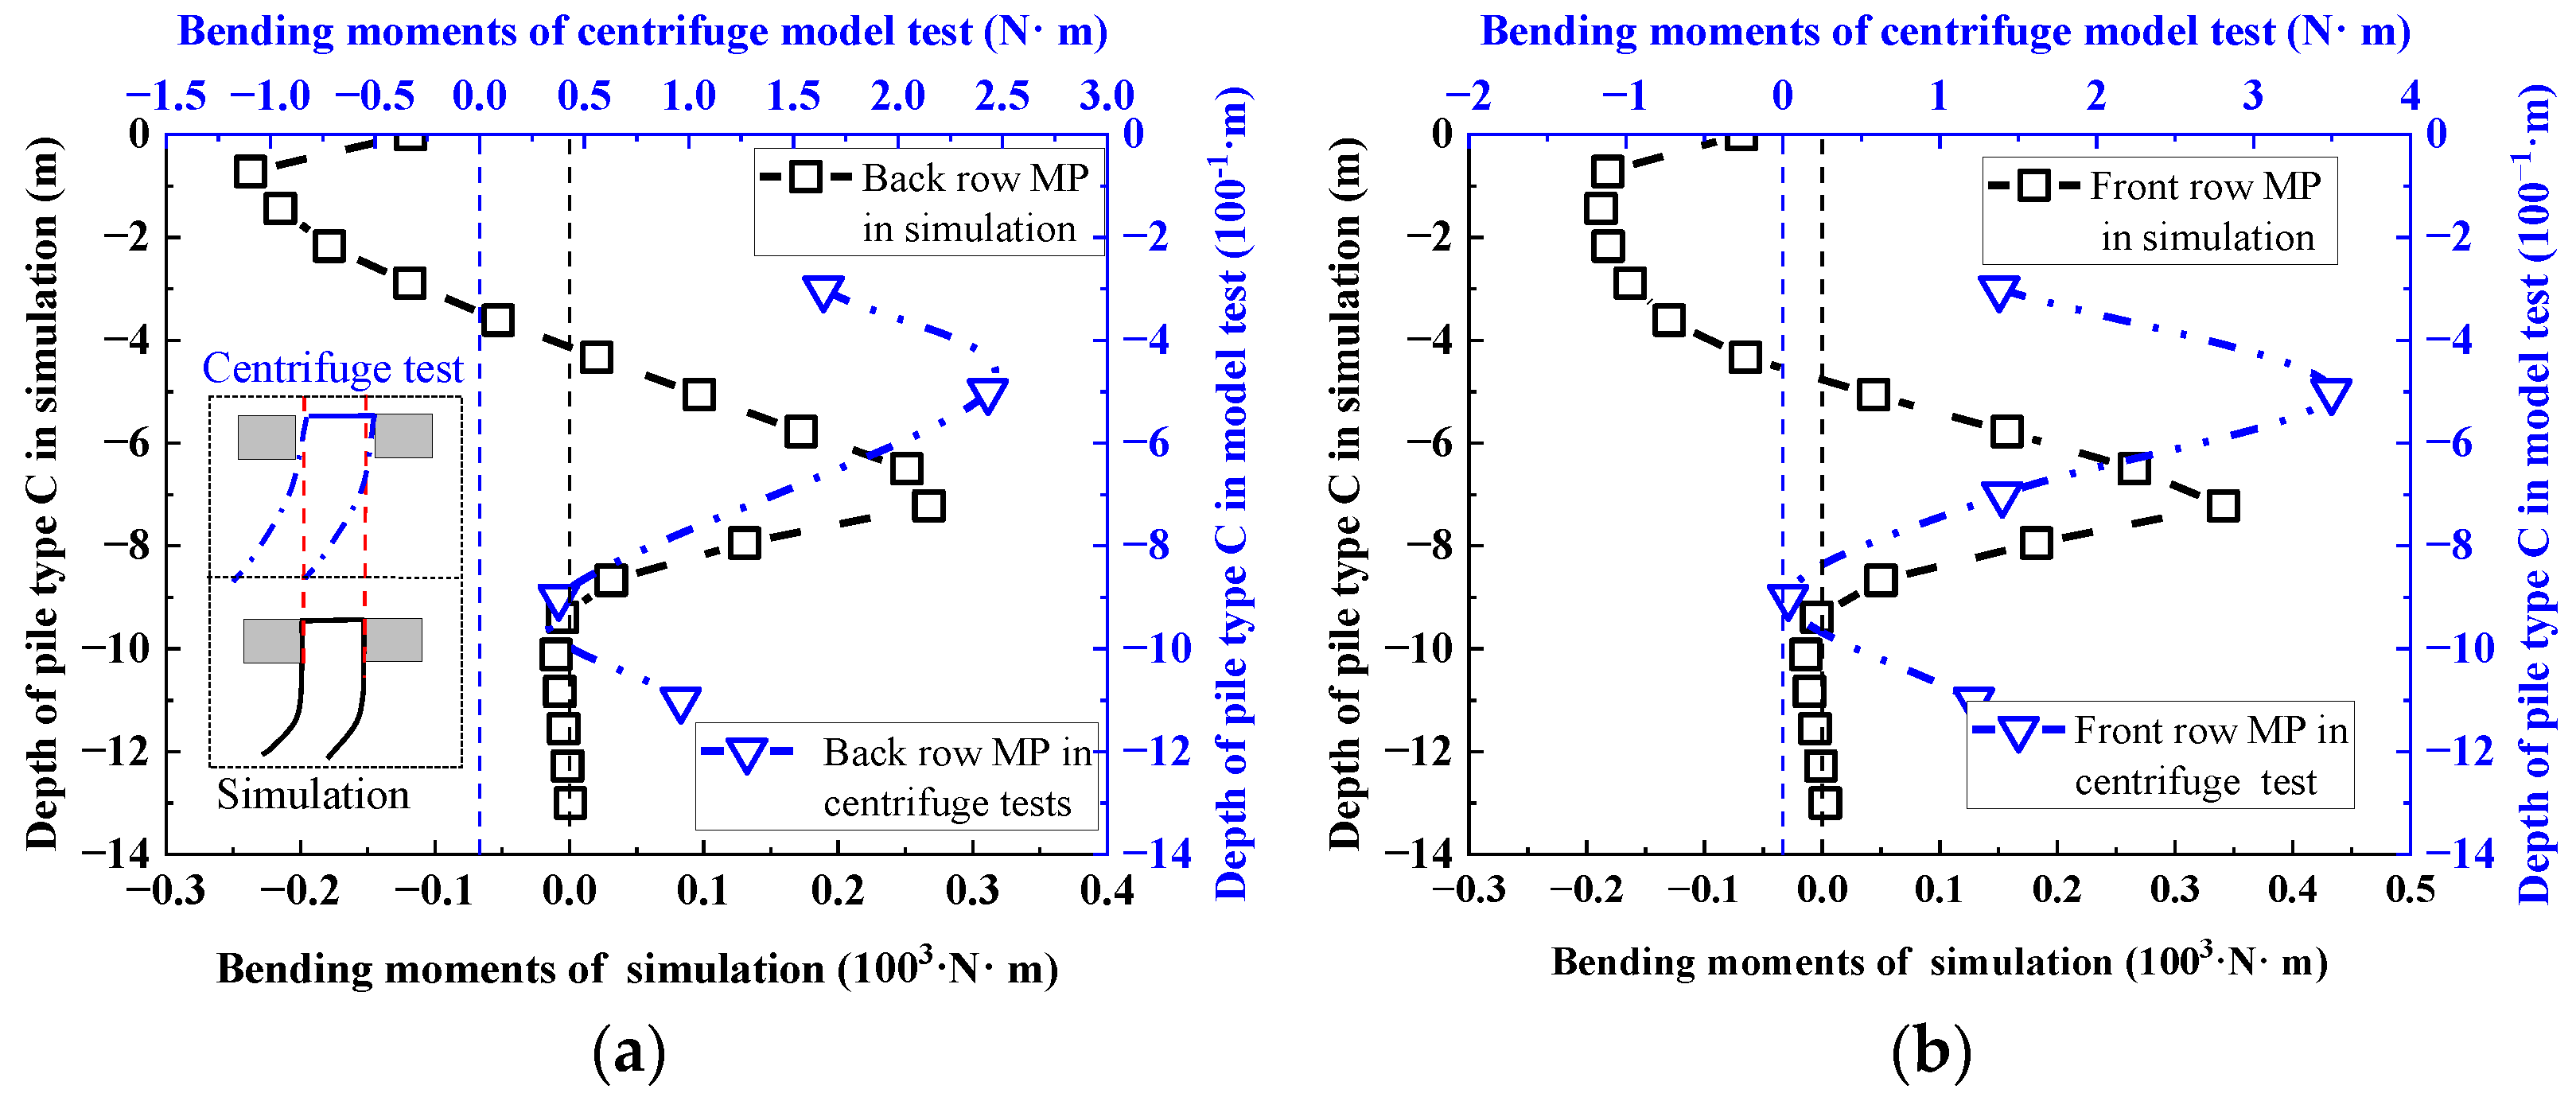
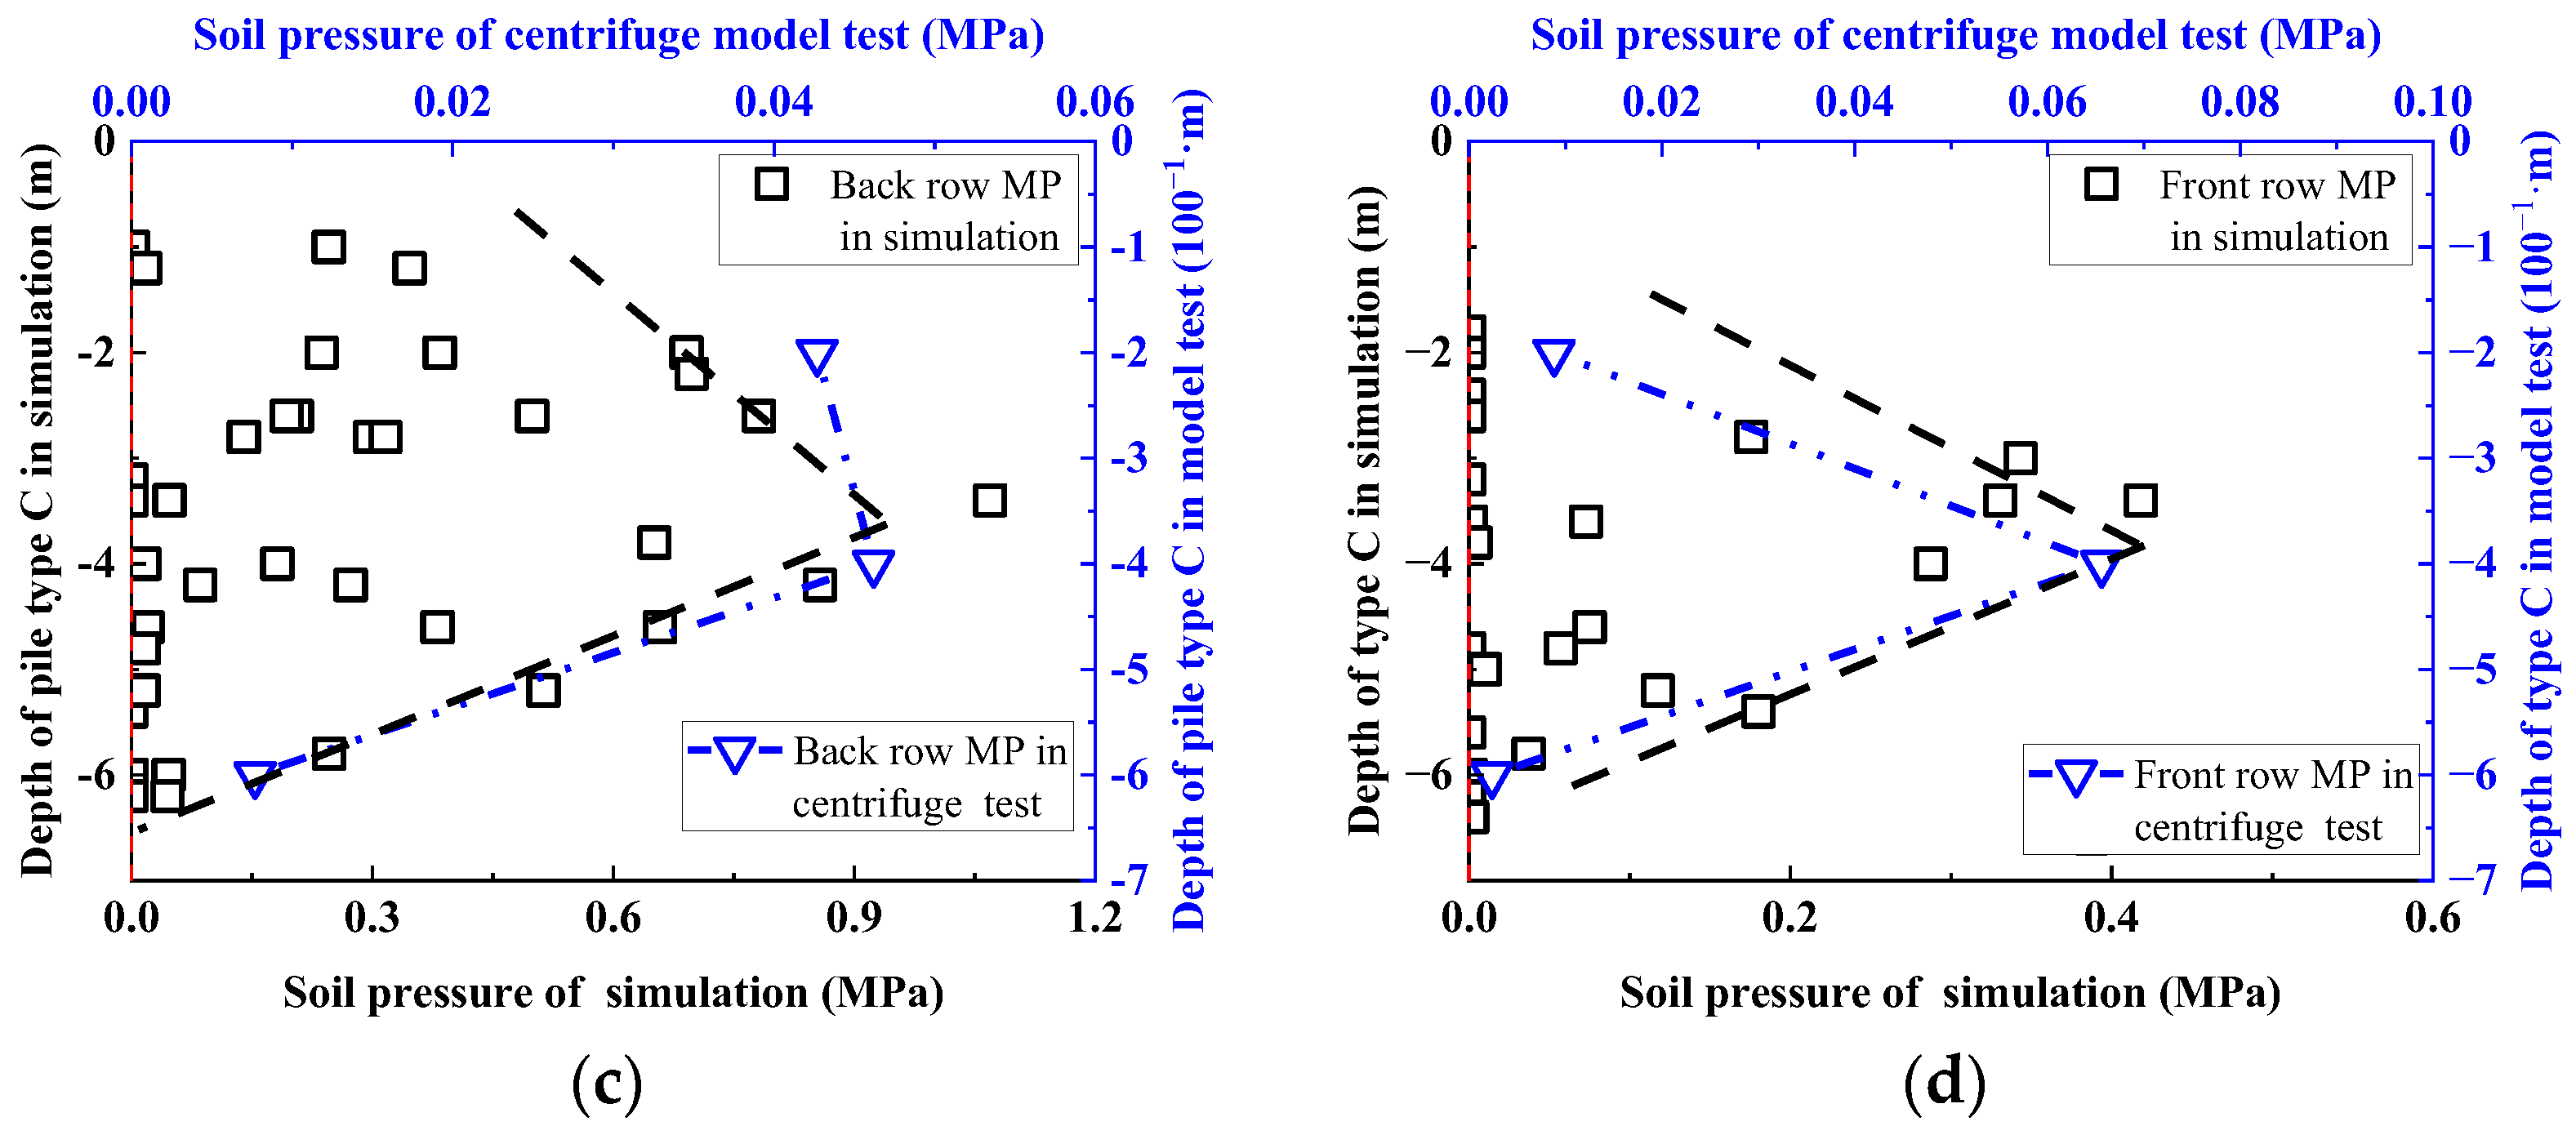
3.3.4. Talus Slope Reinforced by Pile Type C

The bending moment distribution acquired by the numerical simulation is well-fitted with the centrifuge test result; both are characterized by a tensile “S” type (Figure 10a,b). Similar to pile type B, the bending moment curves of pile type C obtained by the numerical and experimental method also suffer from an offset due to the differences in the anchoring section between the centrifuge tests and numerical simulations. As to the coupled numerical method, the ideal elastic constitutive model makes it more competent in simulating the behavior of piles and bedrock at the macroscopic level. In contrast, due to the size limitation of scaled model tests, some inaccuracy would be magnified and further affects the performance of the structure. Therefore, scaled model tests on a reinforced slope are usually used to explore its overall deformation pattern, while numerical simulations have advantages in vividly visualizing the behaviors of the structure.
In the coupled numerical simulation, there is a visible difference in the bending moment distribution between pile type C and type B. The main reason is that the platform can coordinate the deformation of the front and back row piles and limits the rotational freedom of the pile-top; the bidirectional anchoring action enables the deflection of the MP in the anti-slip section to be center-symmetric. According to the shape of the bending moment curve, it is clear that the restraint of the platform on the pile-top is similar to the anchoring effect of the bedrock, so the shape of the bending moment curve of the pile type B is only a half of the center-symmetric “S”.
The distribution of the bending moment is directly associated with the soil pressure behind the pile. The position of the maximum soil pressure is usually assumed to be the location of the potential slip zone [20]; thus, it is clear from Figure 10 that the location of the potential slip zone (slip zone) in the model test and numerical simulation are basically consistent. Due to the anchoring effect of the platform, the deflection of pile type C is slighter than that of type B, so the soil pressure behind pile type C is smaller, and accordingly, the bending moment is also smaller.

4. Performance of MPGs under Various Conditions

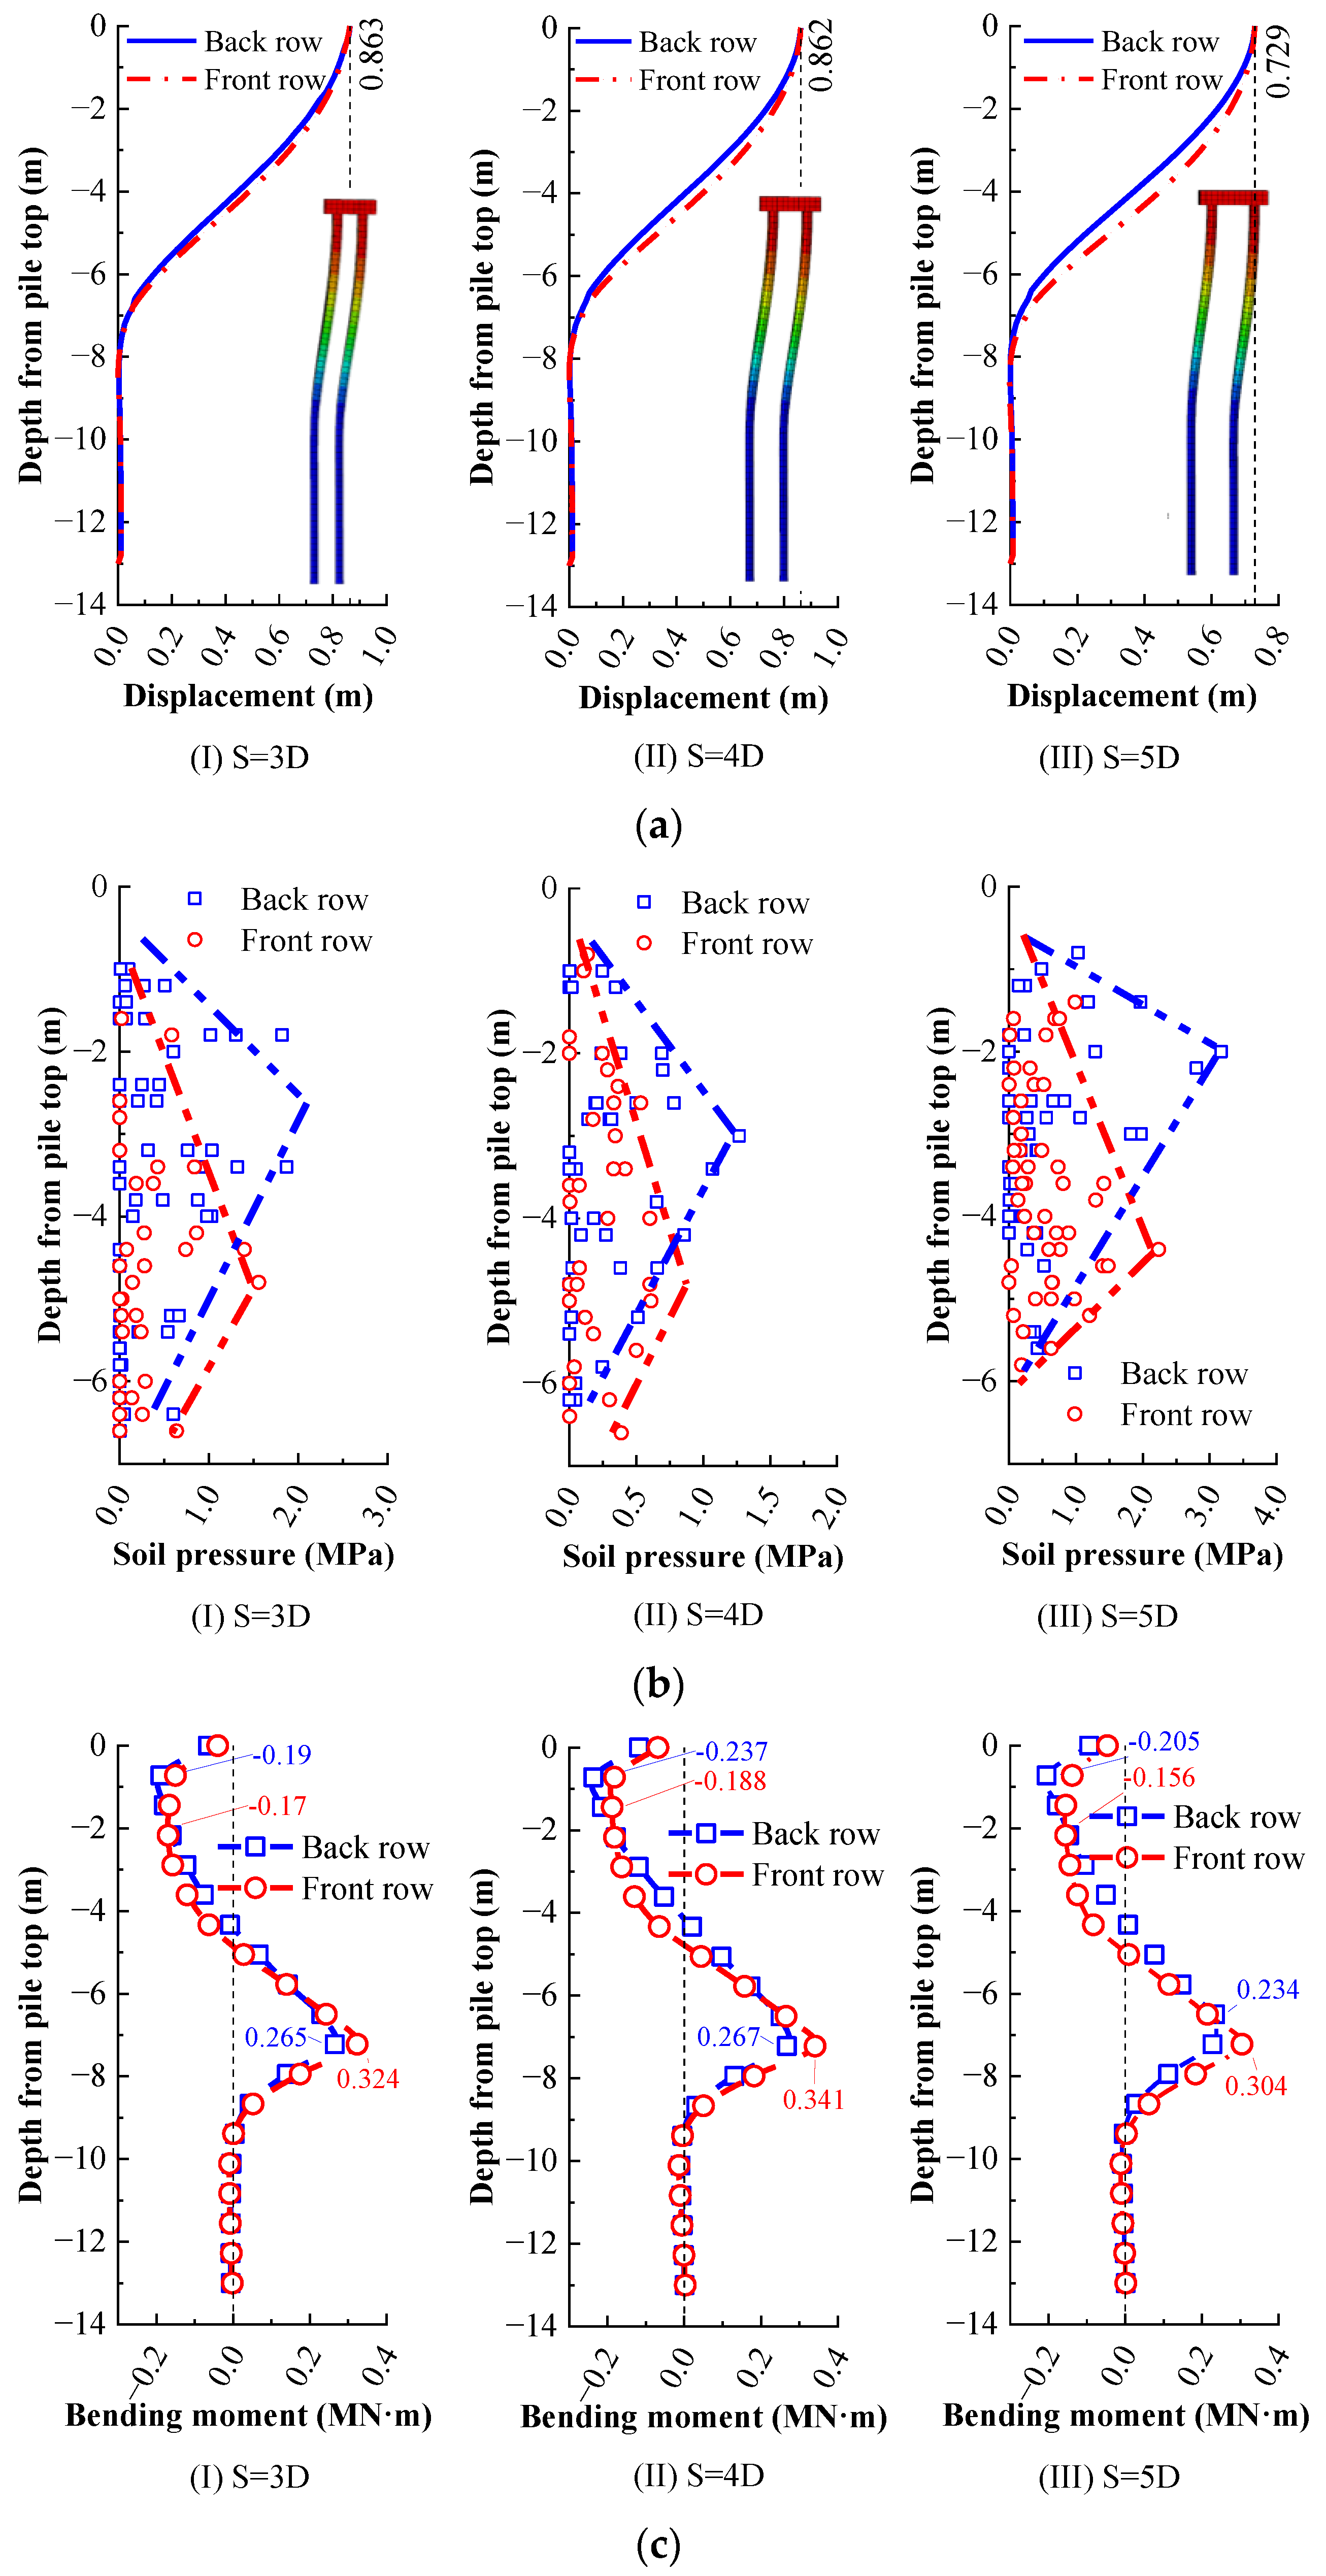
4.1. Performance of MPGs with Different Pile Spacing

Pile spacing is a significant factor in the layout of the MPG, which would directly affect the formation of the pile–soil composite and the performance of the MPG. Therefore, the performance of MPGs installed in the dual-structure talus slope at different pile spacing was investigated. Figure 11 illustrates the variations of displacement, bending moment, soil pressure, shearing force, and axial force for the MPG, with the pile spacing being three times (3D), four times (4D), and five times the pile diameter (5D), respectively.

4.1.1. Displacement Distribution for MPGs

The distribution patterns of lateral displacements in MPGs with different pile spacing are almost identical (Figure 11a). Moreover, the lateral displacements of the front and back row piles with a pile spacing of 3D are basically the same, and the difference gradually emerges and enhances with the increasing pile spacing. The main reason is that as the pile spacing increases, the enlarged volume of soil between piles enables the soil pressure (thrust) behind the pile group to transfer to the front row piles more easily, and the soil pressure (landslide thrust) acting on the front row piles was greater. When a shallow sliding occurs (Figure 5) on the talus slope, the lower part of the loose deposit (below the sliding surface and above the bedrock) has an insufficient anchoring effect on the front row piles, resulting in the lateral displacement of the front row piles being greater than the back row piles.

4.1.2. Soil Pressure Distribution for MPGs

In the simulation by the coupled DEM-FEM method, the loose deposit was simulated by discrete particles, and its contact with the piles was discontinuous. Thus, the fitted envelopes of the discrete contact values could be regarded as the soil pressure distribution curves (Figure 11b). For the MPGs with a given pile spacing, the soil pressure of the front and back row piles increase first and then decreases, but the back row piles have greater soil pressure extreme values, and the depths of the extremes are lower. The soil pressure behind the piles is related to the relative position of the slip zone and bedrock, usually increasing and then decreasing with an increase in the depth within homogeneous soil slopes and reaching extreme values in the (potential) slip zone [20,40]. Thus, the distribution of soil pressure could indicate a shallow sliding risk of the talus slope (Figure 5).
As to the MPGs with different pile spacing, the soil pressure distribution along the depth of the back row piles is the smallest at 4D pile spacing, and the depth of the extreme point of the soil pressure of the back row piles is the lowest, indicating that the soil pressure behind the piles is the smallest at 4D pile spacing, and the potential slip zone is deeper. The soil pressure distribution of the back row piles is mainly related to the stability of the slope (the stabilizing effect of the pile–soil composite), the slip or deformation of the slope is a process of releasing energy, and the slope deformation is accompanied by a process of “stress release” [20], i.e., the soil pressure of the back row of piles is the smallest at 4D pile spacing, indicating that the MPG with 4D pile spacing has the best reinforcement effect.
Moreover, the depths of the soil pressure extremes along the front row piles at different pile spacing are approximately the same. The main reason is that the front row piles are deformed by the joint action of the soil between the piles and the platform, and the contact pressure only comes from the soil pressure of the geomaterials between the piles and the squeezing action of the back row piles, so the contact pressure distribution of the front pile at different pile spacing is basically the same [41].

4.1.3. Bending Moment Distribution for MPGs

The bending moment distribution of MPGs with different pile spacing is basically the same, showing a center-symmetric “S” shape (Figure 11c). The magnitude of the bending moment increases with depth and then decreases, and there is a reverse flection (the negative bending moment becomes positive) near the bedrock surface. For the MPGs with a given piles spacing, minor differences in the distribution of bending moments between the front and back row piles, with the back row piles having a greater value of negative bending moment at the top of the MP, while the front row piles produce a greater positive bending moment near the bedrock surface. The main reason is that the soil pressure near the platform acting on the back row piles is greater (Figure 11b), while the contact position between the front row piles and bedrock is lower, resulting in a low position of deflection along the depth.
As to the bending moment distributed along the back row pile of MPGs with different pile spacing, there is a marginal difference; the greater the pile spacing, the more dramatic the change in bending moment near the pile top. Similarly, there is a minor difference in the bending moment distribution along the front row piles; the greater the pile spacing, the greater the difference in the bending moment distribution between the front row piles and the back row piles.
The main reason is that the small the pile spacing, the strong the wholeness of the pile–soil composite, and the closer the internal force and deformation between the front and back row piles. As for the large pile spacing (5D), the soil between the piles cannot fully transfer the soil pressure to the front row piles, resulting in a large discrepancy in the internal force and deformation between the front and back row piles. Moreover, the extreme value of bending moment is the largest (0.341 MN·m) when the pile spacing is 4D, indicating that the slip resistance of MPGs under such circumstances is more sufficiently developed. Moreover, the bending moment of the pile below 10 m is basically zero, and it can be deduced that the effective anchorage length of the pile is about 10 m.

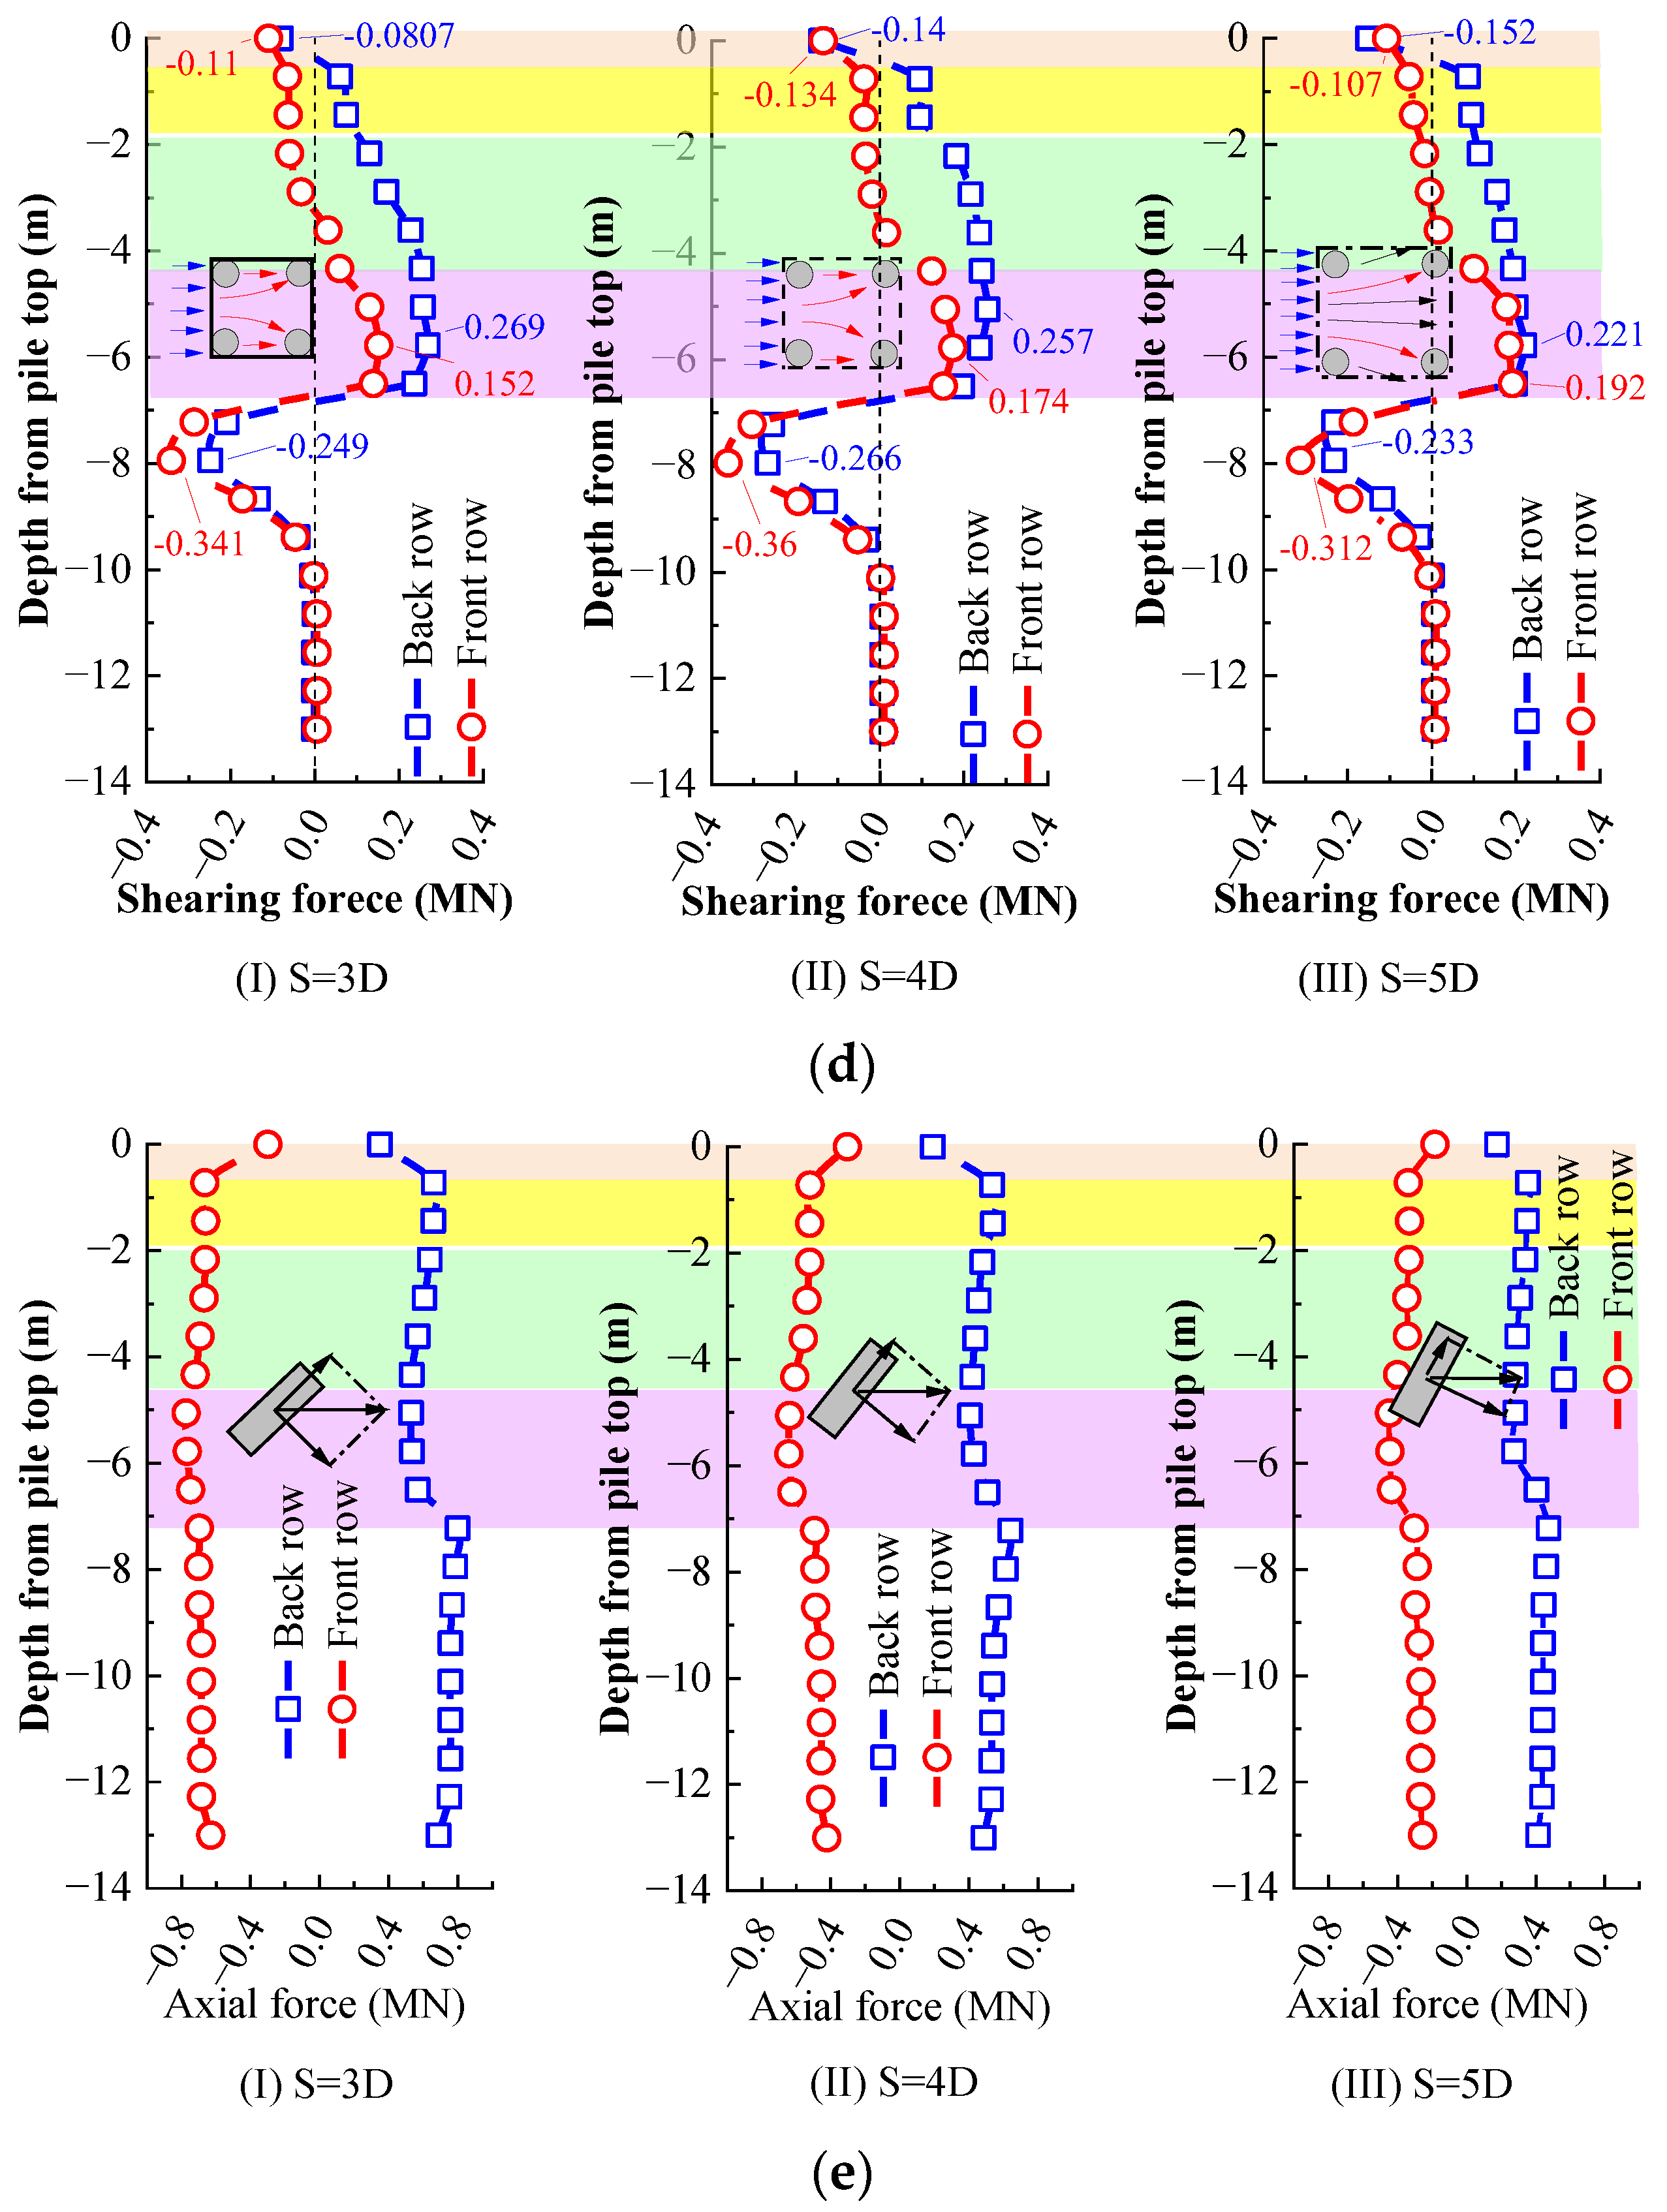
4.1.4. Shearing Force Distribution for MPGs

The shearing force distributions of the front and back row piles at a given pile spacing vary widely (Figure 11c). First, the initial negative shearing force appears at the pile top under the anchoring effect of the platform and then gradually changes to the positive shearing force with increasing depth due to the soil pressure (the orange area). Then, the shearing force of the MP increases with the depth under soil pressure and reaches a maximum near the bedrock surface (the yellow, green, and purple area), and there is a positive correlation between the increased rate of shearing force and the values of soil pressure. Finally, a reverse directional change until a negative shearing force appears due to the opposite directional (i.e., in the opposite direction to the lateral displacement of the MP) support of the bedrock interface and gradually returns to zero under continuous anchoring action (the white area).
Similar to the distribution of the bending moment, the shearing force distribution along the piles at different pile spacing does not vary significantly, mainly showing a variation in the magnitude of the extremes (Figure 11c), which is negatively correlated with the soil pressure behind the piles. The discrepancy in shearing force distribution is mainly accounted for by the state difference in pile–soil composite. For the MPGs with a pile spacing of 5D, the soil behind and within the MPGs moves around the MP, and the tight pile–soil composite is difficult to form, resulting in a smaller difference in the shearing force between the front and back row piles. In contrast, the MPGs with 4D pile spacing have the best stabilizing effect, so the maximum shearing force is also the largest. Although the pile–soil composite under 4D pile spacing is not as tight as that of 3D, the larger width of the pile–soil composite makes the pile subjected to a greater soil pressure behind the MPGs.

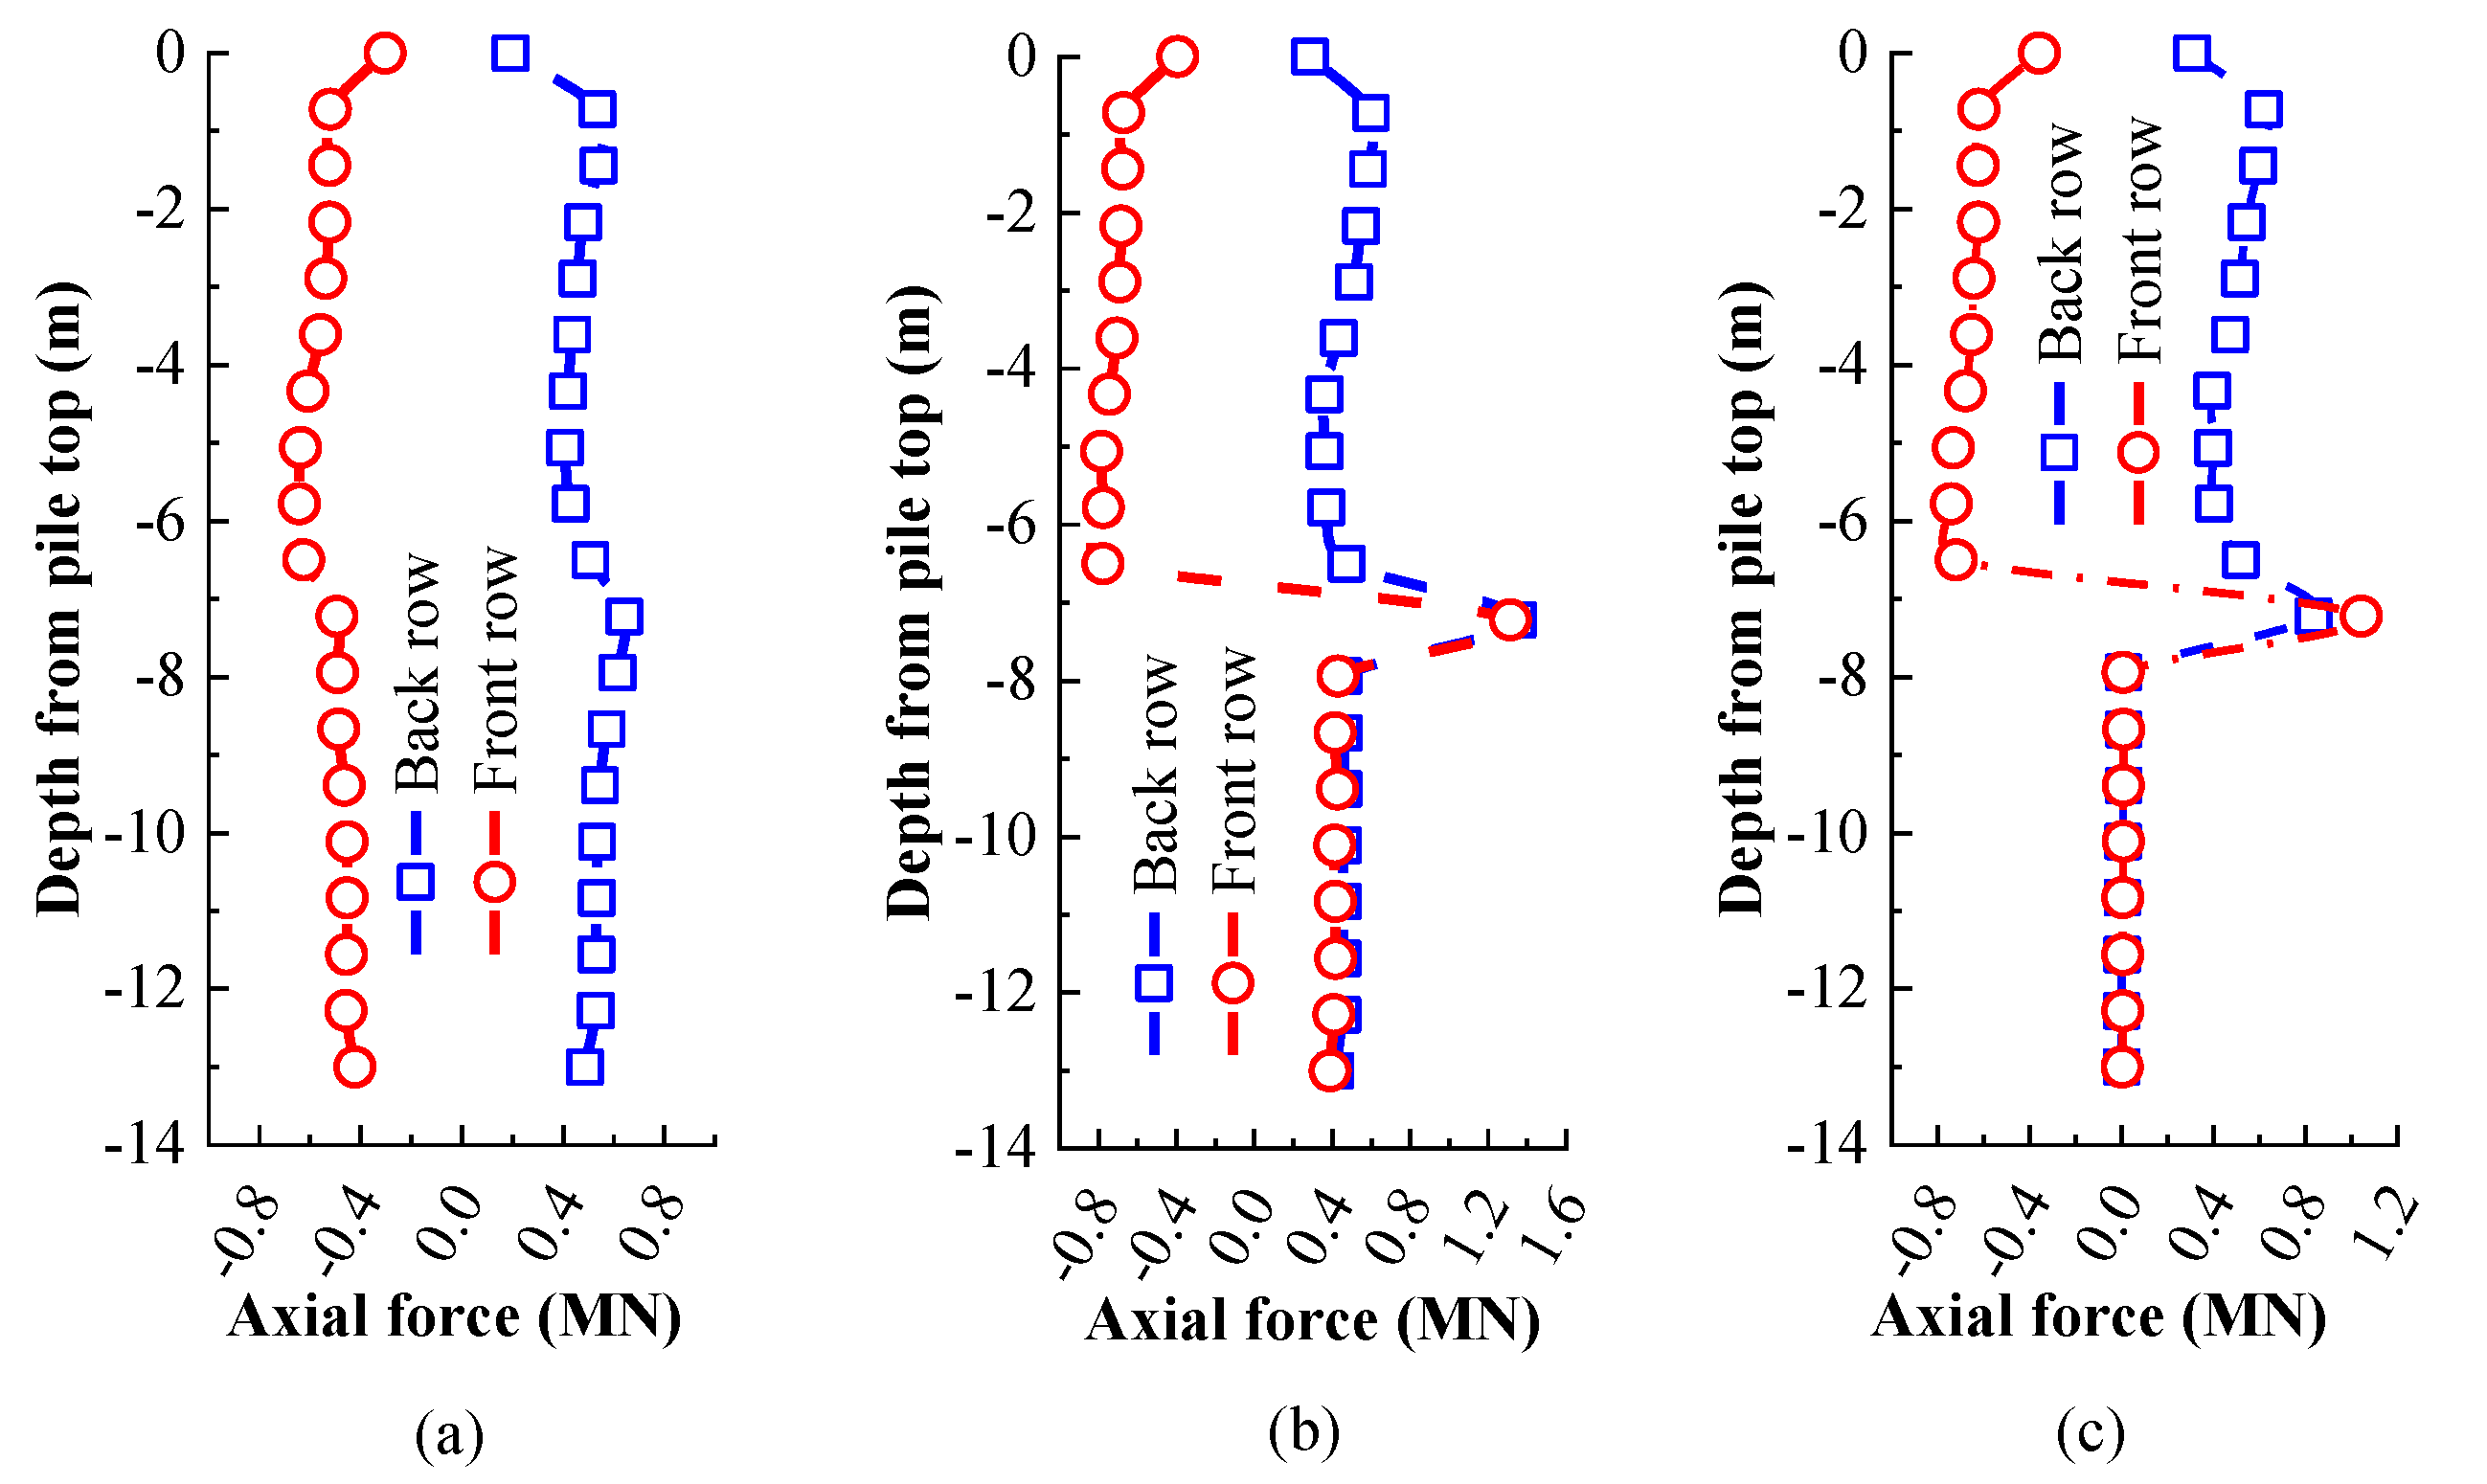
4.1.5. Axial Force Distribution for MPGs

Axial force distribution for MPGs with different pile spacing was depicted in Figure 11e. Firstly, for different pile spacing, the value of the axial force in back-row piles is always positive, whereas that in front-row piles remains negative (the direction of gravity is defined as the negative direction). The reason for this phenomenon is that the platform applies opposite reaction forces to the front and back row piles [20], i.e., the back row piles are subjected to a positive axial force, while the front row piles are subjected to a reverse axial force. Secondly, because of the moment balance of the platform, the axial force is inversely proportional to the pile spacing when the difference in the bending moment of the pile top is relatively small (Figure 11e). Thus, the axial forces of the front and back row piles for the MPGs with a pile spacing of 5D are the smallest. Finally, the axial force of back row piles changes more drastically with depth. The main reason is that the deflected MP would decompose the thrust into the shearing force and axial force. The larger the deflection of the pile, the more significant the change in axial force.

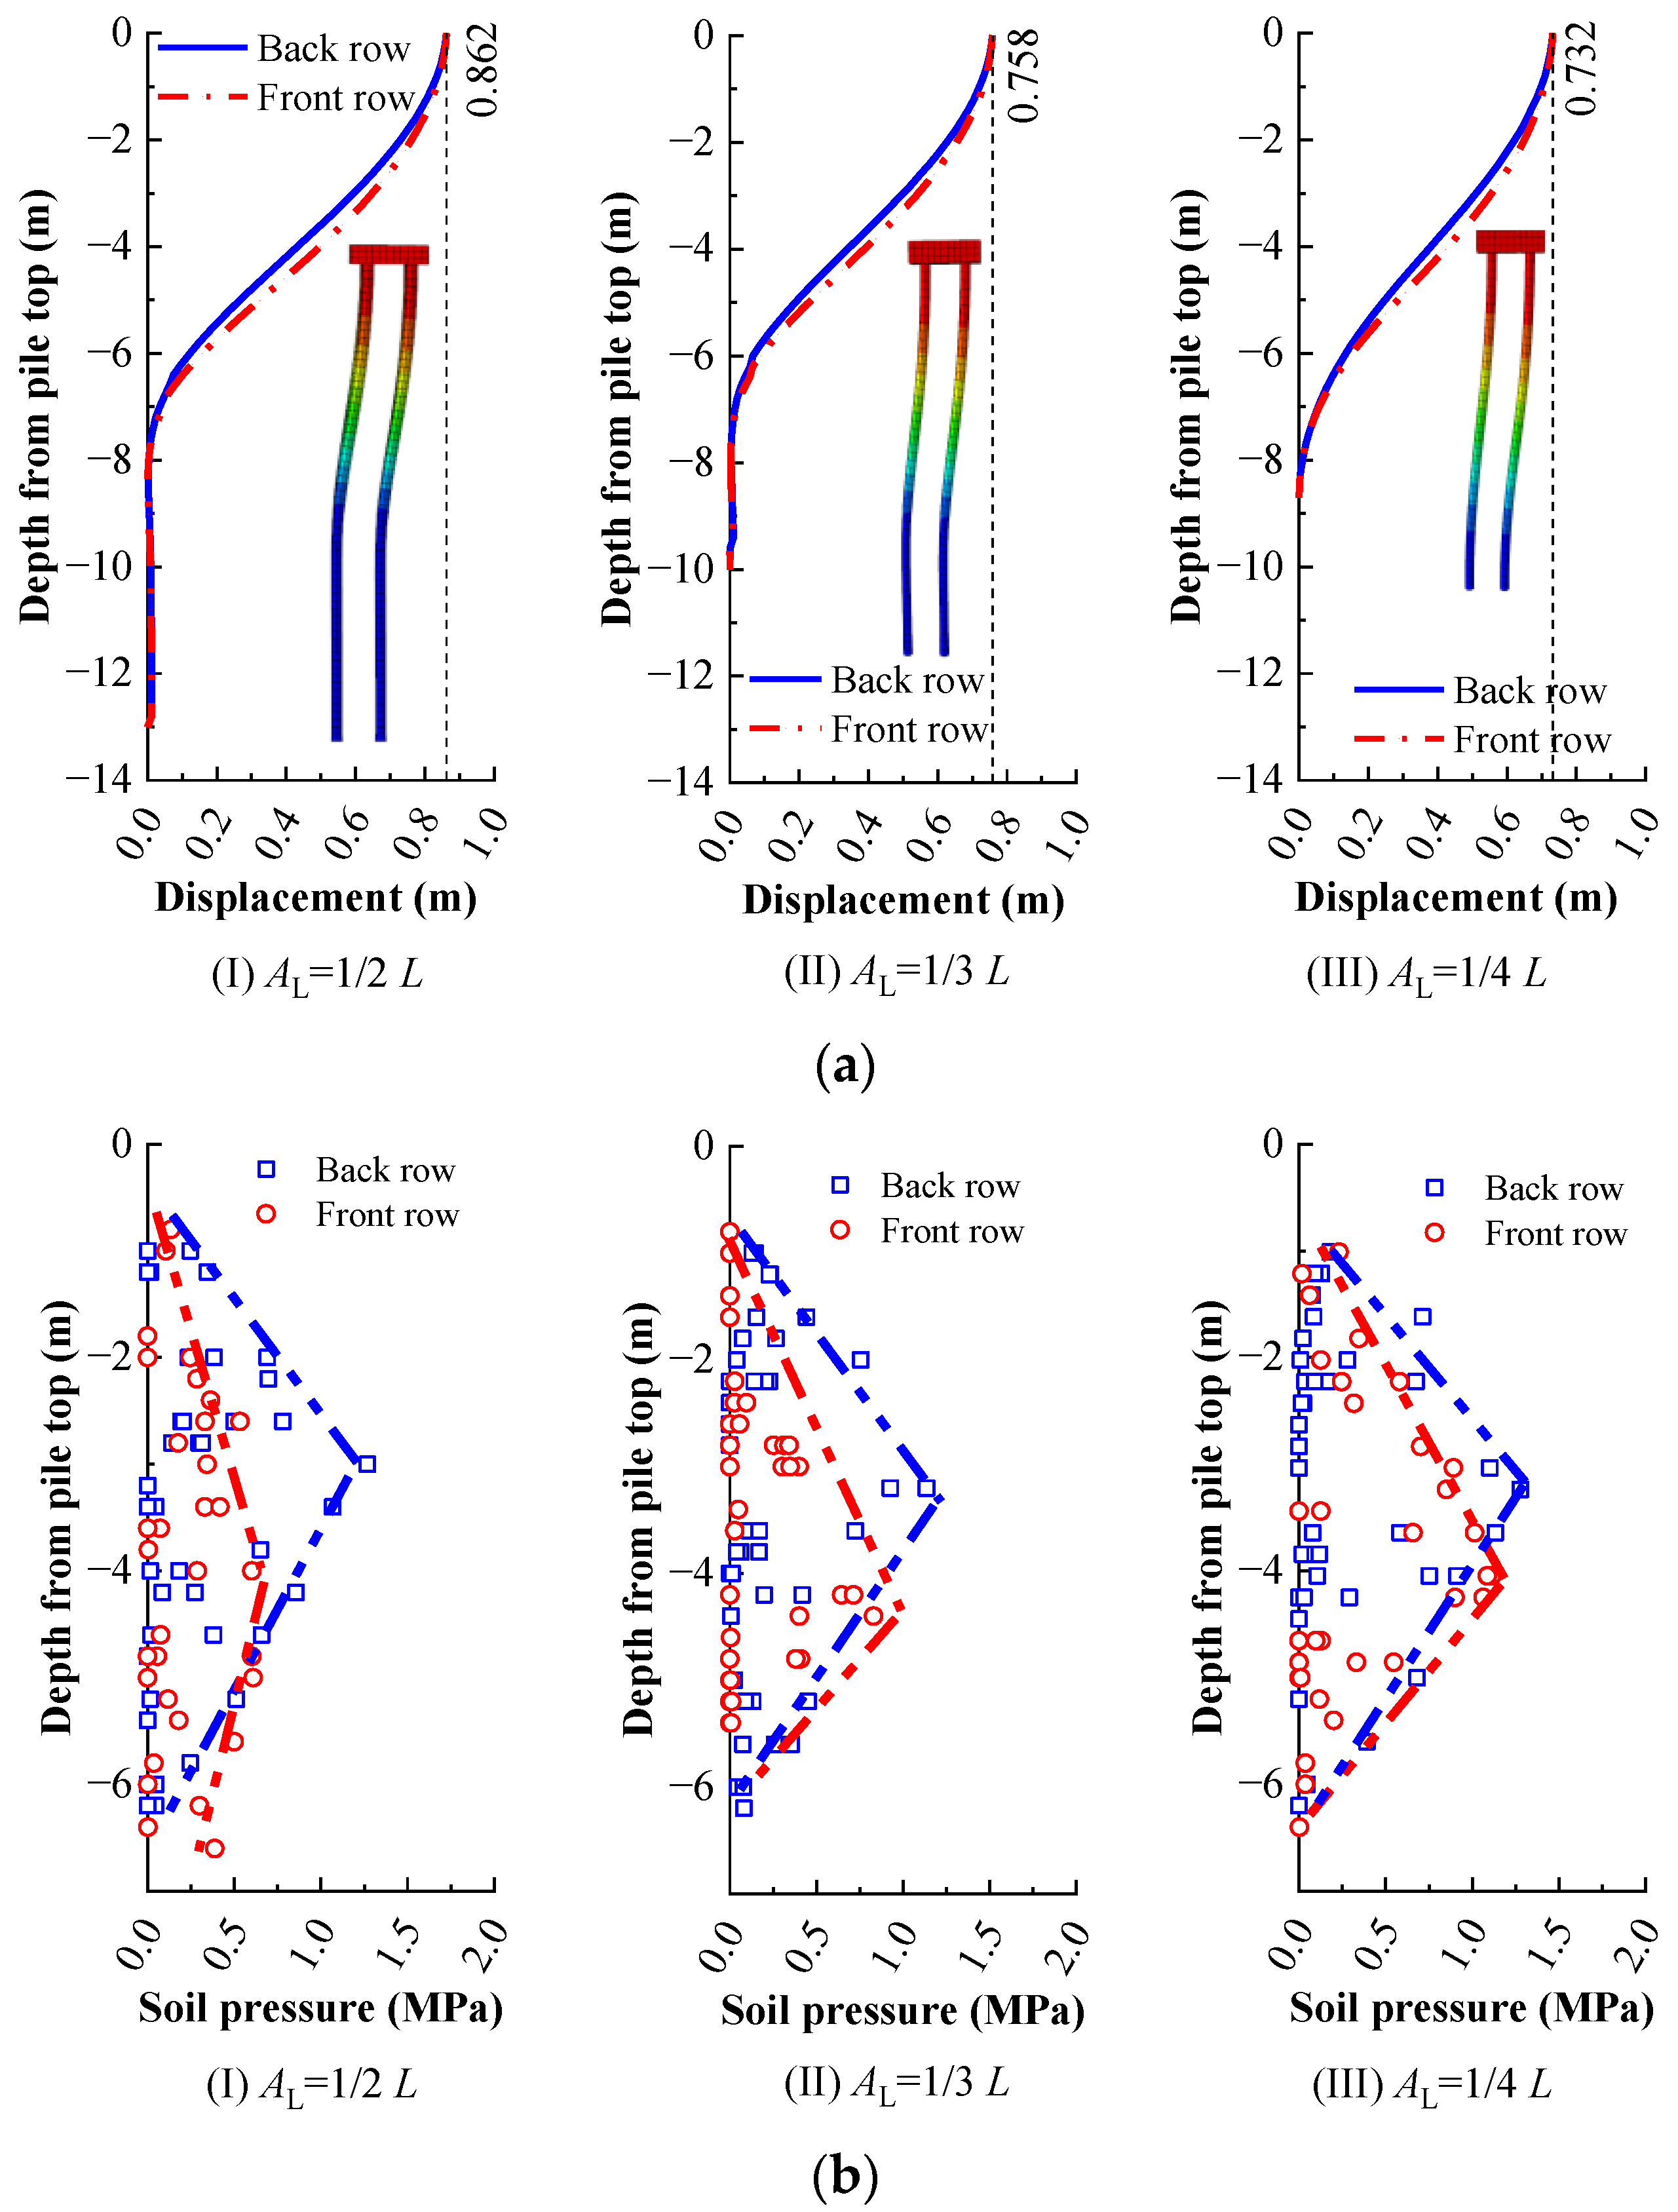
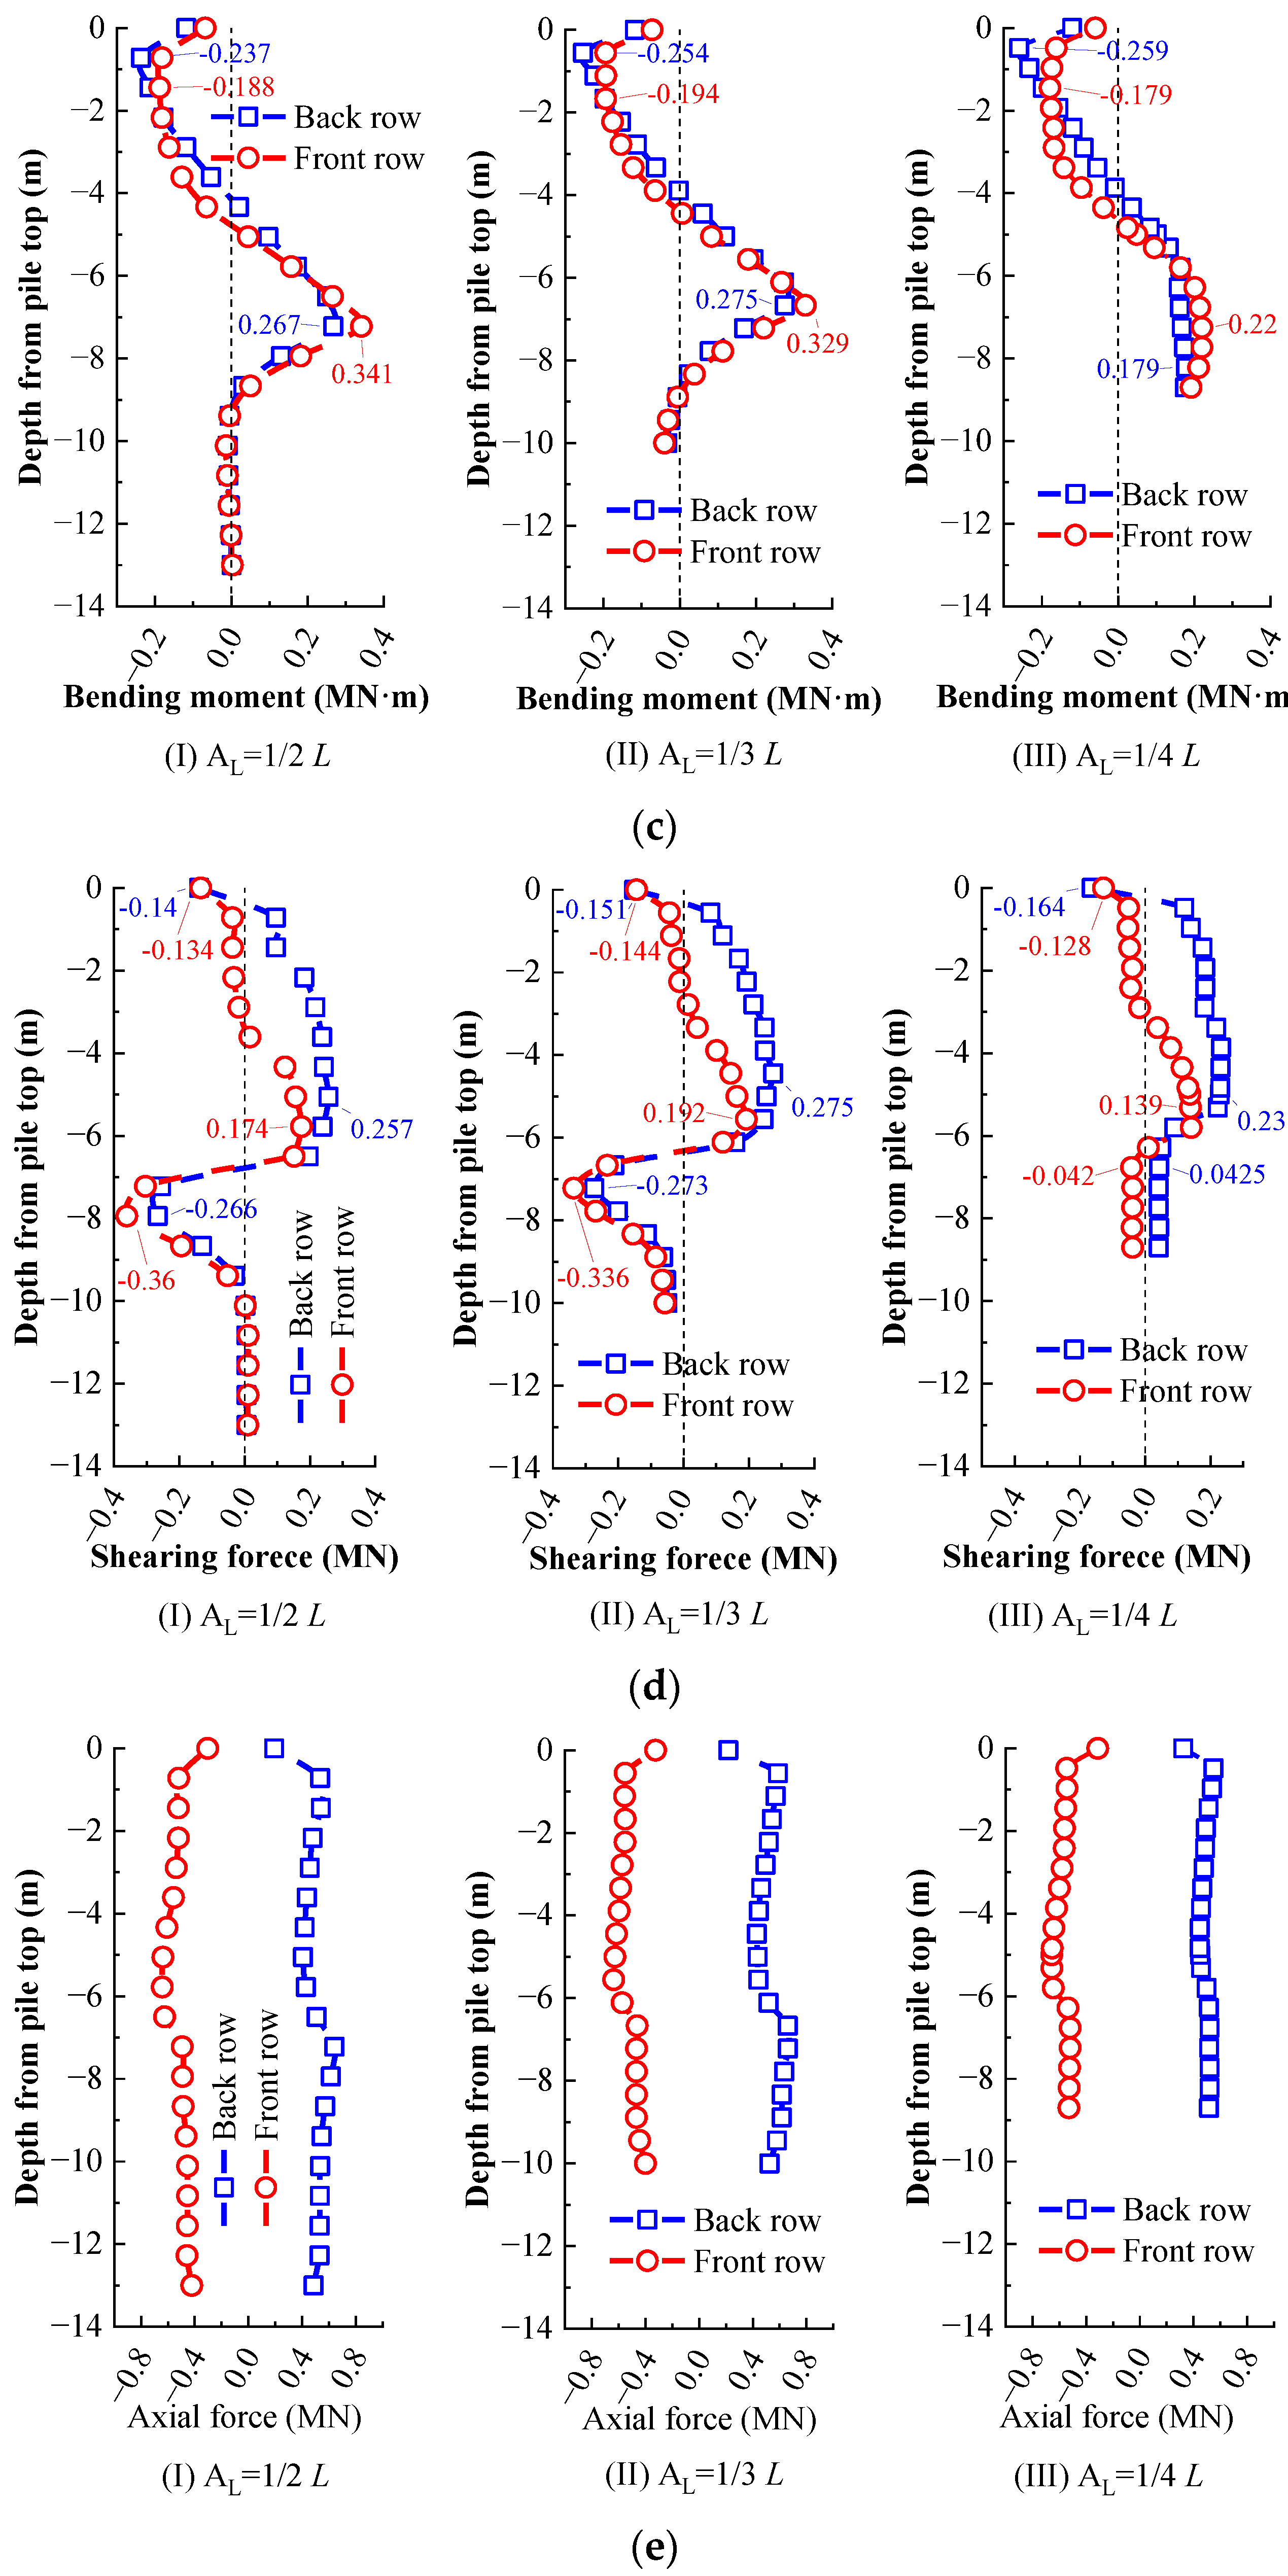
4.2. Performance of MPGs with Different Anchorage Lengths

Anchorage depth is also an important factor in the spatial arrangement of MPGs [42]. According to the design codes for CP (rigid pile), the anchorage length (AL) needs to be 1/4–1/3 of the pile length (L). Therefore, the study regarding the effect of the anchorage depth on the performance of the MPGs (with a given pile spacing of 4D) was carried out by the coupled numerical simulations, where the displacement and rotation of the bottom of the MPG are also not allowed. The deformation and internal force for AL of 1/2, 1/3, and 1/4 L, respectively, are presented in Figure 12.
Overall, the displacement of MPs with different AL are broadly similar (Figure 12a); the longer the anchorage length, the greater the displacement along the depth. The main reason is that there is bending deformation under the soil pressure accompanied by a tendency for the MP to pull out (tensile deformation); the longer the deformable length of the MP, the greater the displacement of the MP. The soil pressure behind MP is related to the deformation of the pile, mainly because the pile and soil will have a coordinated deformation accompanied by a stress release of the slope [20], so the greater the displacement of the pile, the smaller the extreme value of the soil pressure behind the pile.
The internal force distributions for the anchorage depth of 1/2 L and 1/3 L are basically similar, and the bending moment and shearing force approach to zero at a depth of −10 m (Figure 12c,d), indicating that the rigidly fixed end constraint at the bottom of the piles has almost no effect on the internal force distribution of the piles. Thus, the effective length of the MP under this condition is about 10 m, and the effective anchorage length is about 1/3 of the total length.
The shearing force and the bending moment relate, respectively, to the lateral displacement constraint and the rotation constraint, when the anchorage length is sufficient (AL ≥ 1/3 L), the anchorage action of the bedrock effectively limits the lateral displacement and rotation of the piles. With an insufficient anchorage length (AL = 1/4 L), the anchoring effect of the bedrock is not sufficient to balance the internal forces and bending moments of the piles. The fixed-end constraint at the base of the pile provides an additional restraining effect on the MPG so that the base of the pile still has a high-stress level.
The distribution of axial force for the front and back row piles in the MPGs with different anchorage lengths is similar but in the opposite direction. From the perspective of the moment balance of the platform, it can be deduced that the front and back rows of piles are subjected to axial forces in opposite directions, respectively. Thus, the distribution of the axial force is closely related to the bending moment, and for the area above the bedrock surface, there is little difference in axial force distribution due to the similar distribution of the bending moment. In contrast, the anchorage depth of 1/4 L is not sufficient to balance the pile bending moment, resulting in a significant difference in the axial force distribution at the anchorage depth of 1/4 L below the bedrock surface.

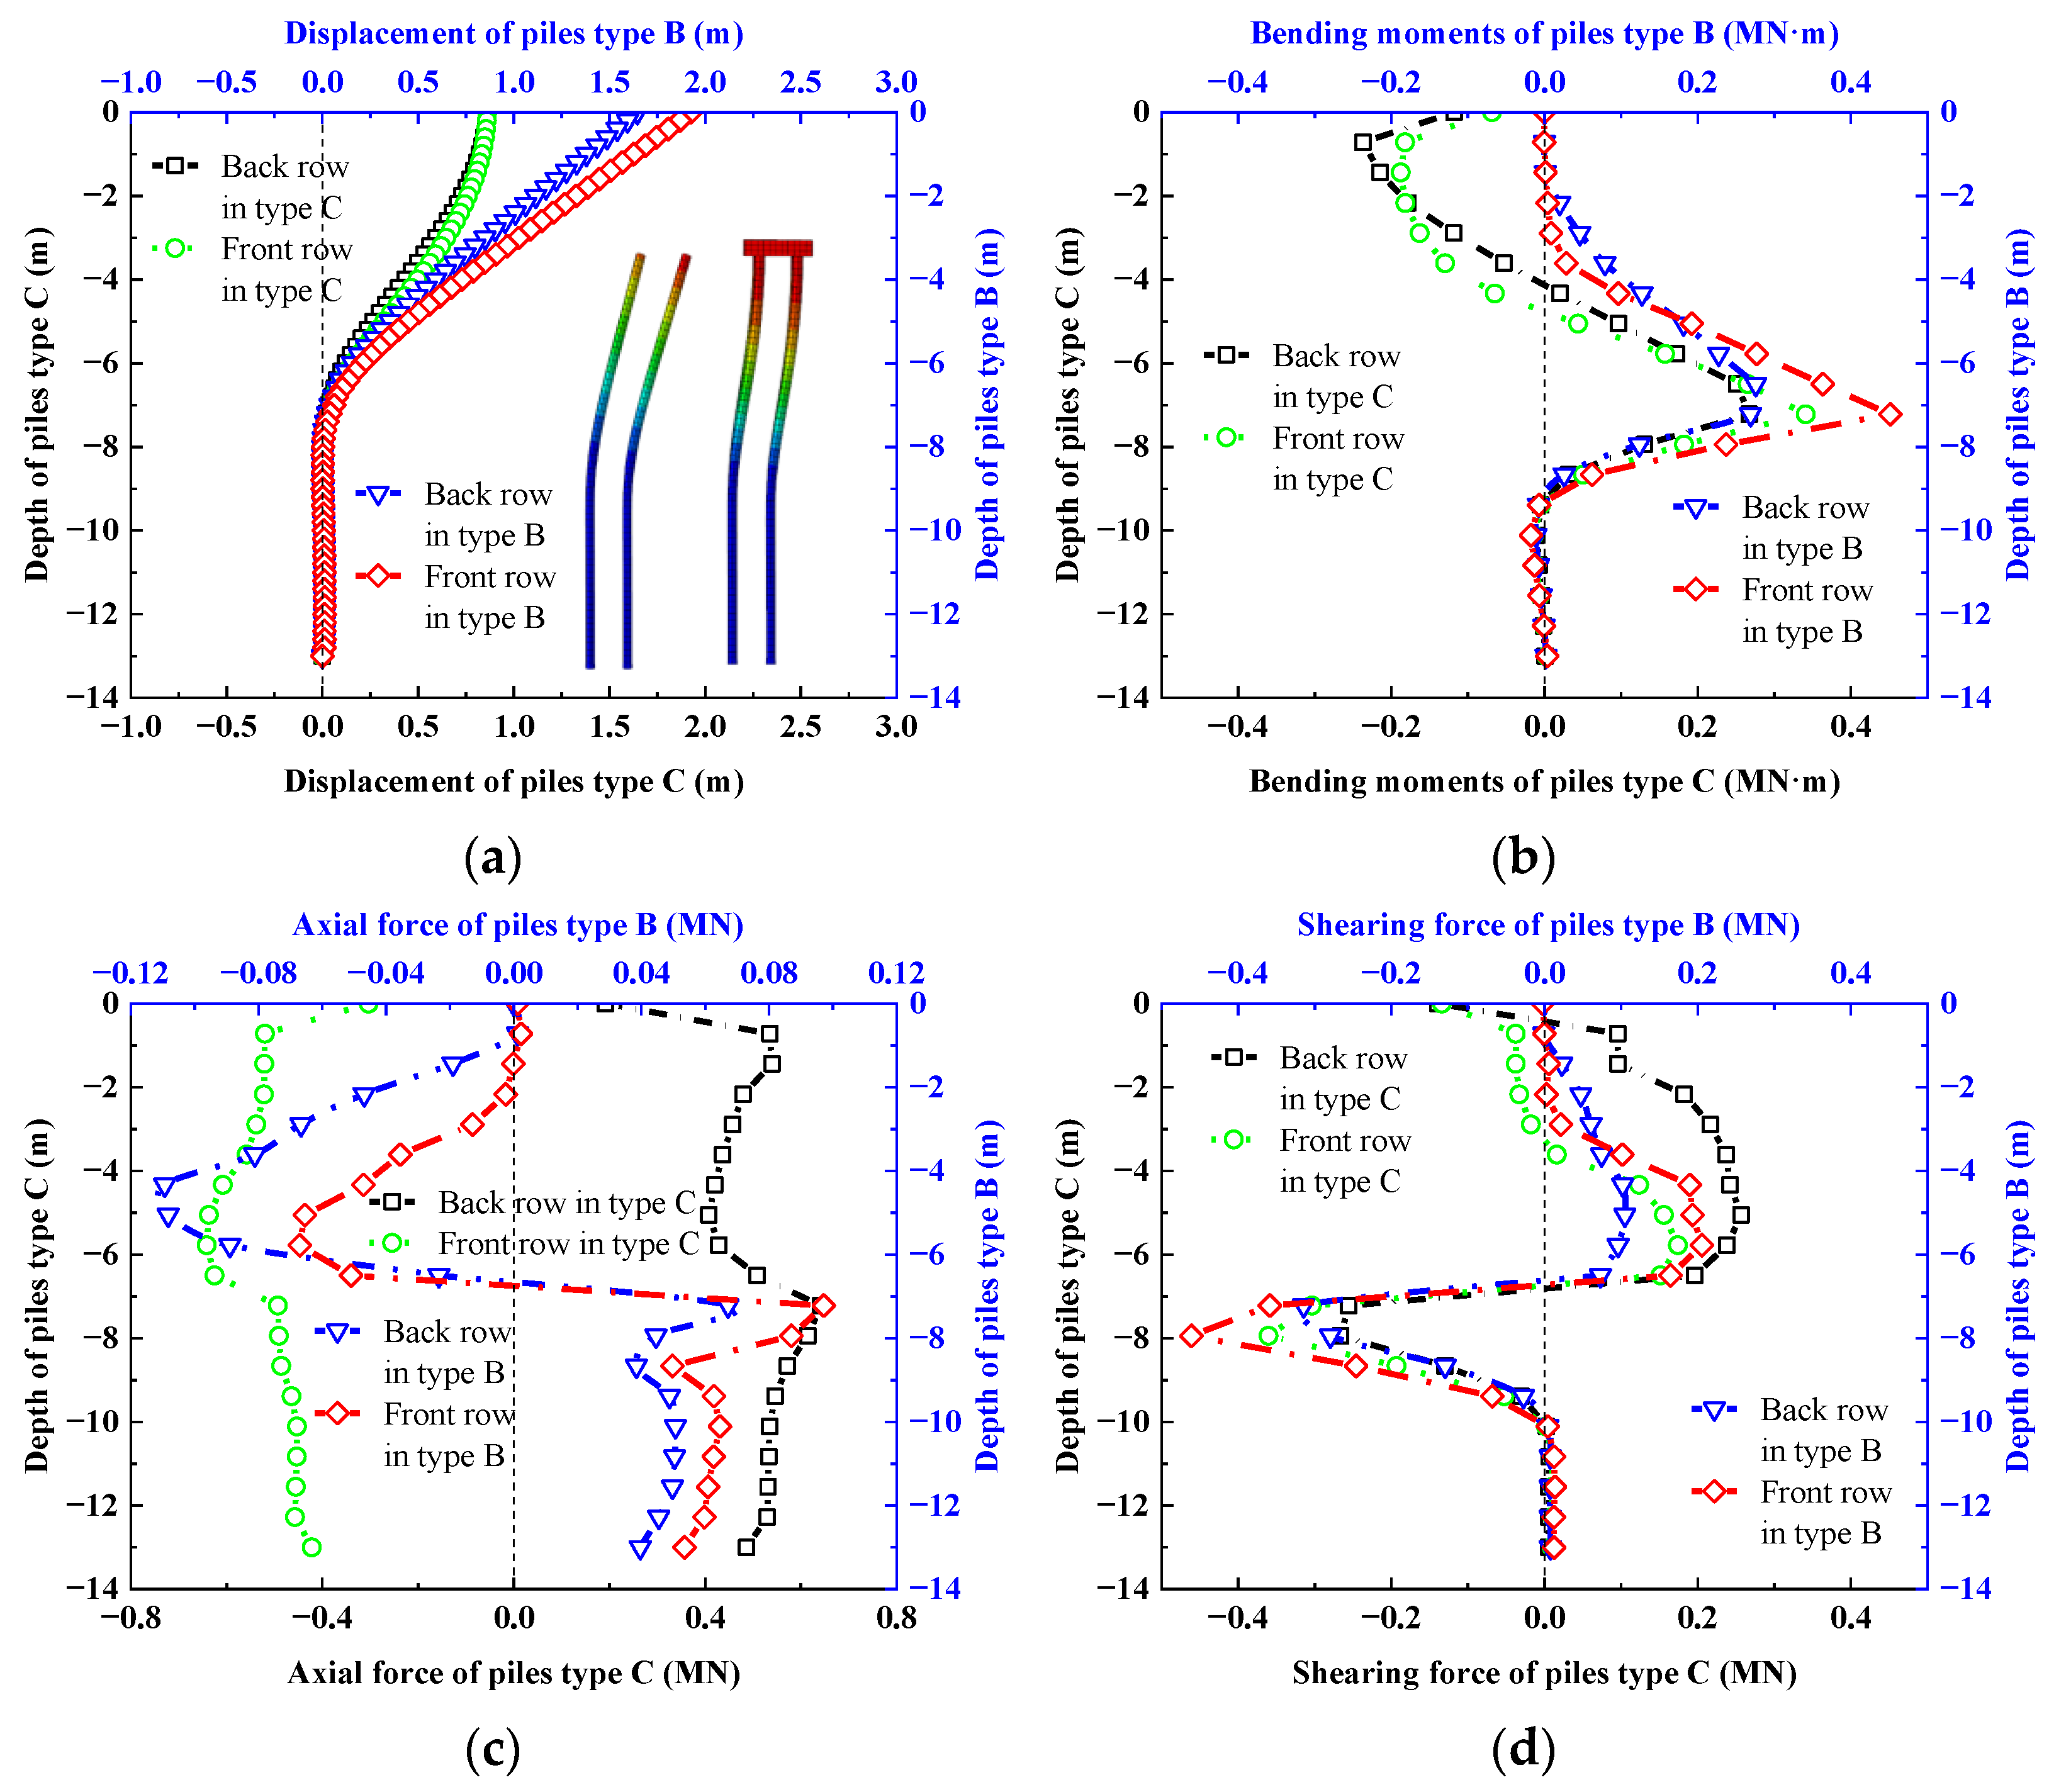
4.3. Performance of MPGs with Different Pile Bottom Constraints and Contact Mode

For the MPGs with a sufficient anchorage length (AL ≥ 1/3 L), the bottom constraints of the piles would not affect the distribution of bending moment and shearing force. However, the axial force distribution is influenced by the tangential frictional contact between the piles and the bedrock and is also associated with the bottom constraints of the piles. A comparative simulation of penalty value tangential friction versus rough tangential contact, and the pile’s bottom constraints as free versus fixed, are illustrated in Figure 13.
The type of tangential contact between the MPs and bedrock only has a noticeable effect on the axial force distribution along the piles below the bedrock surface, as does the type of constraint at the pile bottom. The main reason for the difference is that both the tangential friction of pile bedrock and the pile bottom constraint will restrain the vertical displacement of the pile. There is a significant stretching of the piles near the bedrock surface due to the flexural deformation under the soil pressure, followed by an increased first and then decreased distribution of axial force under the action of the rough friction, finally the axial force tends to a constant value under the vertical constraint of displacement at the pile bottom (Figure 13b).
The vertical constraint at the pile bottom also plays a non-negligible role in the axial force balance so that there will be a constant axial force along the piles near the pile bottom. Whereas for the free constraint at the pile bottom, there is no limitation on the vertical displacement for MP, the axial force of the MPs is only balanced by the rough friction between the pile and bedrock so that the axial force below the bedrock surface tends to zero (Figure 13c).

5. Discussions

5.1. Anti-Slip Mechanism of the MPG

As an anti-slip structure, apart from the bending and shear capacity of the MP, MPGs would usually form a pile–soil composite with a stronger bending and shear resistance. It is reasonable that the MP produces an obvious bending deformation during the reinforcement; the analysis of the stress and deformation of the MP is an essential part of the anti-slip mechanism of the MPGs. For the MPG without a platform, the difference in the pile top displacement between the front and back row piles results in the inability to form an effective pile–soil composite (Figure 14a), so its anti-slip mechanism is basically the same as that of CP. As for the MPGs with a platform, it is more likely to form a stable pile–soil composite, and the bending moments, thrusts (shearing forces), and axial forces applied to the front and back row piles can be transmitted and redistributed through the platform (Figure 14b–d), which is an important part of the anti-slip mechanism.
The platform plays a significant role in the formation of the pile–soil composite. The platform remains horizontal under the support of the front and rear rows of piles (Figure 15c). From the equilibrium of forces and bending moment of the platform, it can be seen that the platform would effectively restrain the rotation freedom at the pile top and apply axial pressure to the front row piles while the axial tension to the back row piles (Figure 15d,e). Considering the limitation on the pile’s top displacement, the platform can almost be considered as a simplified anchorage measure, i.e., the bi-directional anchorage between the pile top and the anchored section result in smaller deformation and internal force extremes.

5.2. Limitations and Further Works

Since the coupled numerical method is adopted to investigate the effect of the pile spacing on the performance of MPGs, where the size effect of discrete particles for modeling the loose deposit is inevitable to affect the numerical results. Thus, the geomaterial dimensions in the application process of MPGs cannot be ignored due to the small pile diameter, i.e., the optimal pile spacing of MPGs differs when the slope material contains different particle sizes.
The main objective of this paper is to investigate the performance of MPGs in the talus slope using a continuous–discontinuous numerical simulation; more attention has been paid to the performance of the MPGs rather than the behavior of the talus slope under large deformation. Thus, the macroscopic behavior of the slope (factor of safety and the slip characteristics) together with the pile–soil interaction were employed to validate the coupled numerical method. However, for the widespread application and dissemination of the MPGs, more sophisticated multi-scale numerical methods considering new theories need to be further developed. Further studies regarding DEM simulations, such as the effect of particle size on the deformation and stability of the talus slope under static or dynamic loading [43,44], and the quantitative relationship between contact parameters of discrete particles and properties of the geomaterials are the priorities for the next phase of research.

6. Conclusions

In this paper, a cross-scale analysis based on the coupled DEM-FEM numerical method is adopted to investigate the performance of the MPGs in stabilizing the talus slope and then validated with centrifuge model tests. The effects of critical parameters, such as the pile spacing, the anchorage length, and the constraint of pile bottom, on the anti-sliding performance of the MPGs are numerically revealed. The main conclusions are as follows:
(1)
The coupled numerical method can reproduce the results of the centrifuge model tests, indicating the applicability of the presented DEM-FEM coupling method in large deformation problems.
(2)
The forces and deformations of MPG with different pile spacing are essentially the same in the numerical simulations, i.e., the tensile S-shaped deformation and the opposite directional axial force in the front and back row piles within the anti-slip section. The MPG with a spacing of 4D, in particular, exhibits the best performance.
(3)
The effective anchorage length of the MPG needs to exceed 1/3 of the pile length. The end constraints of the pile bottom and the tangential pile–bedrock contact significantly affect the distribution of the internal forces in the piles, which cannot be ignored in the design of the MPG.
(4)
The anti-slip mechanism of the MPG with a platform is mainly attributed to the bidirectional anchoring effect of the bedrock and the platform, which allows the MPG to have a smaller displacement at the comparable stress level, contributing to a more integral pile–soil composite with a better anti-slip performance.

Author Contributions

Conceptualization, methodology, writing—review and editing, and validation, T.N. and Y.Z.; formal analysis, writing—original draft preparation, data curation, Z.P.; supervision, S.X. and H.L. All authors have read and agreed to the published version of the manuscript.

Funding

This research was funded by the National Natural Science Foundation of China (Grant Nos. U1765107, 51879036) and the LiaoNing Revitalization Talents Program (Grant No. XLYC2002036).

Informed Consent Statement

Informed consent was obtained from all subjects involved in the study. Written informed consent has been obtained from the patient(s) to publish this paper.

Data Availability Statement

All data are included in the manuscript.

Conflicts of Interest

The authors declare no conflict of interest.

References

  1. Li, X.Z.; Kong, J.M. Types and characteristics of typical landslides triggered by “5.12” Wenchuan Earthquake. J. Mt. Sci. 2011, 29, 598–607. (In Chinese) [Google Scholar]
  2. Zhi-liang, S.; Ling-wei, K.; Ai-guo, G.; Hai, T. Surface deformation and failure mechanisms of deposit slope under seismic excitation. Rock Soil Mech. 2015, 36, 3465–3472+3481. (In Chinese) [Google Scholar]
  3. Ding, P.P.; Yang, Z.Z.; Qiao, J.P.; Chen, X.Q.; Nie, Y.; Zhang, W.F. Fractal characteristic analysis on slope disasters along the KKH of China-Pakistan Economic Corridor. China Sci. 2018, 13, 1685–1689. (In Chinese) [Google Scholar]
  4. Kumar, J.S.; Nusari, M.S.; Purushotam, D.; Prasad, A.I.; Rajyaswori, S. Effectiveness of geocell wall, geogrid and micropile anchors for mitigation of unstable slopes. Geoenviron. Disasters 2021, 8, 11. [Google Scholar] [CrossRef]
  5. Jang, Y.-E.; Han, J.-T. Analysis of the shape effect on the axial performance of a waveform micropile by centrifuge model tests. Acta Geotech. 2018, 14, 505–518. [Google Scholar] [CrossRef]
  6. Guan, W.; Wu, H.; Wu, D.; Tang, L.; Wei, H. Study on Interaction Mechanism of Natural Gas Pipe-Landslide System Reinforced by Micropile Groups Based on Model Test. Geofluids 2022, 2022, 8436297. [Google Scholar] [CrossRef]
  7. Wang, R.H.; Zhou, H.Q.; Peng, G.Y. Discrete Element Simulation Analysis of Sudden Instability of Stacked Slope. J. Ordnance Equip. Eng. 2018, 39, 192–196. (In Chinese) [Google Scholar]
  8. Gupta, R.K.; Chawla, S. Finite element analysis of micropile reinforced subgrade in railway tracks. Lect. Notes Civ. Eng. 2020, 85, 751–761. [Google Scholar] [CrossRef]
  9. Ghorbani, A.; Hasanzadehshooiili, H.; Ghamari, E. 3D finite element analysis of seismic soil-micropile-structure interaction. In Advances in Civil Engineering and Building Materials; CRC Press: Boca Raton, FL, USA, 2012; pp. 265–269. [Google Scholar]
  10. Ghorbani, A.; Hasanzadehshooiili, H.; Ghamari, E.; Medzvieckas, J. Comprehensive three dimensional finite element analysis, parametric study and sensitivity analysis on the seismic performance of soil–micropile-superstructure interaction. Soil Dyn. Earthq. Eng. 2014, 58, 21–36. [Google Scholar] [CrossRef]
  11. Elaziz, A.Y.A.; El Naggar, M.H. Group behaviour of hollow-bar micropiles in cohesive soils. Can. Geotech. J. 2014, 51, 1139–1150. [Google Scholar] [CrossRef]
  12. Alnuaim, A.M.; El Naggar, M.H.; El Naggar, H. Numerical investigation of the performance of micropiled rafts in sand. Comput. Geotech. 2016, 77, 91–105. [Google Scholar] [CrossRef]
  13. Wang, Z.; Mei, G. Numerical Analysis of Seismic Performance of Embankment Supported by Micropiles. Mar. Georesour. Geotechnol. 2012, 30, 52–62. [Google Scholar] [CrossRef]
  14. Zeng, J.; Xiao, S. A Simplified Analytical Method for Stabilizing Micropile Groups in Slope Engineering. Int. J. Civ. Eng. 2020, 18, 199–214. [Google Scholar] [CrossRef]
  15. Wang, W.; Yin, Y.; Li, D.; Meng, M.; Luo, G.; Zhang, Z. Numerical Simulation Study of the Load Sharing of an Arched Micropile Group in the Tizicao High-Position Landslide, China. IOP Conf. Ser. Earth Environ. Sci. 2020, 570, 62001. [Google Scholar] [CrossRef]
  16. Sun, S.W.; Zhu, B.Z. Numerical simulation study of the ultimate resistance of micropiles in earth slope stabilization. J. Railw. Eng. Soc. 2018, 35, 1–5+83. (In Chinese) [Google Scholar]
  17. Hussain, Z.; Sharma, B.; Rahman, T. Micropile group behaviour subjected to lateral loading. Innov. Infrastruct. Solut. 2019, 4, 22. [Google Scholar] [CrossRef]
  18. Alnuaim, A.; El Naggar, M. Performance of micropiled rafts in clay: Numerical investigation. Comput. Geotech. 2018, 99, 42–54. [Google Scholar] [CrossRef]
  19. Hassan, S.; El Shamy, U. DEM simulations of the seismic response of granular slopes. Comput. Geotech. 2019, 112, 230–244. [Google Scholar] [CrossRef]
  20. Pei, Z.-W.; Zhang, Y.-J.; Nian, T.-K.; Song, X.-L.; Zhao, W. Performance investigation of micropile groups in stabilizing unstable talus slopes via centrifuge model tests. Can. Geotech. J. 2023, 60, 3. [Google Scholar] [CrossRef]
  21. Ma, Z.; Shirvan, K.; Wu, Y.; Su, G. A three-dimensional axial fuel relocation framework with discrete element method to support burnup extension. J. Nucl. Mater. 2020, 541, 152408. [Google Scholar] [CrossRef]
  22. Chen, X.; Elliott, J.A. On the scaling law of JKR contact model for coarse-grained cohesive particles. Chem. Eng. Sci. 2020, 227, 115906. [Google Scholar] [CrossRef]
  23. Li, D.; Nian, T.; Wu, H.; Wang, F.; Zheng, L. A predictive model for the geometry of landslide dams in V-shaped valleys. Bull. Eng. Geol. Environ. 2020, 79, 4595–4608. [Google Scholar] [CrossRef]
  24. Nian, T.; Li, D.; Liang, Q.; Wu, H.; Guo, X. Multi-phase flow simulation of landslide dam formation process based on extended coupled DEM-CFD method. Comput. Geotech. 2021, 140, 104438. [Google Scholar] [CrossRef]
  25. Jiang, M.; Murakami, A. Distinct element method analyses of idealized bonded-granulate cut slope. Granul. Matter 2012, 14, 393–410. [Google Scholar] [CrossRef]
  26. Liu, H.S.; Wang, G.L.; Bao, J.S. Report of Landslide of Beihou Mountain in Hanyuan County in Wenchuan 8.0 Magnitude Earthquake; Institute of Engineering Mechanics, China Earthquake Administration: Harbin, China, 2008. (In Chinese) [Google Scholar]
  27. Pissinatti, C.; Poncetti, B.L.; Buchaim, R.; Vanderlei, R.D. The influence of the reinforced concrete deformability in the design of slender columns. Eng. Struct. 2021, 245, 112882. [Google Scholar] [CrossRef]
  28. Nian, T.K.; Chen, G.Q.; Luan, M.T.; Yang, Q.; Zheng, D.F. Limit analysis of the stability of slopes reinforced with piles against landslide in nonhomogeneous and anisotropic soils. Can. Geotech. J. 2008, 45, 1092–1103. [Google Scholar] [CrossRef]
  29. Fang, K.; Tang, H.; Li, C.; Su, X.; An, P.; Sun, S. Centrifuge modelling of landslides and landslide hazard mitigation: A review. Geosci. Front. 2023, 14, 101493. [Google Scholar] [CrossRef]
  30. Chen, M.-L.; Lv, P.-F.; Zhang, S.-L.; Chen, X.-Z.; Zhou, J.-W. Time evolution and spatial accumulation of progressive failure for Xinhua slope in the Dagangshan reservoir, Southwest China. Landslides 2018, 15, 565–580. [Google Scholar] [CrossRef]
  31. Wu, H.; Nian, T.-K.; Shan, Z.-G.; Li, D.-Y.; Guo, X.-S.; Jiang, X.-G. Rapid prediction models for 3D geometry of landslide dam considering the damming process. J. Mt. Sci. 2023, 20, 928–942. [Google Scholar] [CrossRef]
  32. Zhou, J.; Wang, J.Q.; Zeng, Y.; Jia, M. Slope safety factor by methods of particle flow code strength reduction and gravity increase. Rock Soil Mech. 2009, 30, 1549–1554. (In Chinese) [Google Scholar] [CrossRef]
  33. Fang, K.; Miao, M.; Tang, H.; Jia, S.; Dong, A.; An, P.; Zhang, B. Insights into the deformation and failure characteristic of a slope due to excavation through multi-field monitoring: A model test. Acta Geotech. 2023, 18, 1001–1024. [Google Scholar] [CrossRef]
  34. Nian, T.-K.; Zhang, Y.-J.; Wu, H.; Chen, G.-Q.; Zheng, L. Runout simulation of seismic landslides using discontinuous deformation analysis (DDA) with state-dependent shear strength model. Can. Geotech. J. 2020, 57, 1183–1196. [Google Scholar] [CrossRef]
  35. Ng, C.W.W. The state-of-the-art centrifuge modelling of geotechnical problems at HKUST. J. Zhejiang Univ. A 2014, 15, 1300217. [Google Scholar] [CrossRef]
  36. Zhang, C.; Yin, Y.; Yan, H.; Zhu, S.; Li, B.; Hou, X.; Yang, Y. Centrifuge modeling of multi-row stabilizing piles reinforced reservoir landslide with different row spacings. Landslides 2022, 20, 559–577. [Google Scholar] [CrossRef]
  37. Zhang, H.; Lu, Y. Numerical method for retaining structures based on coupled finite difference method and discrete element method. Chin. J. Geotech. Eng. 2009, 31, 1402–1407. (In Chinese) [Google Scholar]
  38. Guo, P.H.; Zou, X.J. Bearing capacity of a single pile in sand under combined vertical force-horizontal force-torque load. Chin. J. Rock Mech. Eng. 2018, 37, 2593–2600. (In Chinese) [Google Scholar] [CrossRef]
  39. Nian, T.-K.; Jiang, J.-C.; Wang, F.-W.; Yang, Q.; Luan, M.-T. Seismic stability analysis of slope reinforced with a row of piles. Soil Dyn. Earthq. Eng. 2016, 84, 83–93. [Google Scholar] [CrossRef]
  40. Fang, K.; An, P.; Tang, H.; Tu, J.; Jia, S.; Miao, M.; Dong, A. Application of a multi-smartphone measurement system in slope model tests. Eng. Geol. 2021, 295, 106424. [Google Scholar] [CrossRef]
  41. Zheng, J.; Xie, M.; Cao, W.; Zhang, J. Analyzing stability of embankment considering failure mode of soil between piles. J. Huazhong Univ. Sci. Technol. Nat. Sci. Ed. 2012, 40, 99–102. (In Chinese) [Google Scholar]
  42. Xu, C.; Xue, L.; Cui, Y.; Guo, S.; Zhai, M.; Bu, F. A New Multi-Objective Comprehensive Optimization Model for Homogeneous Slope Reinforced by Anti-Slide Piles: Insights from Numerical Simulation. Lithosphere 2022, 2022, 6499724. [Google Scholar] [CrossRef]
  43. Chen, G.; Yang, J.; Liu, Y.; Kitahara, T.; Beer, M. An energy-frequency parameter for earthquake ground motion intensity measure. Earthq. Eng. Struct. Dyn. 2023, 52, 271–284. [Google Scholar] [CrossRef]
  44. Chen, G.; Beer, M.; Liu, Y. Modeling response spectrum compatible pulse-like ground motion. Mech. Syst. Signal Process. 2022, 177, 109177. [Google Scholar] [CrossRef]
Figure 1. Numerical simulation theory and process of the cross-scale analysis: (a) Numerical solution strategy for the coupled DEM-FEM method; (b) Simulation process of cross-scale analysis.
Sustainability 15 08154 g001
Figure 2. Schematic of the talus slope example: (a) Side view; (b) Top view.
Sustainability 15 08154 g002
Figure 3. The slope model is reinforced by the MPG in DEM-FEM coupling simulation: (a) Model of simulation; (b) MPG simulated by FEM; (c) Model of “Slide” based on the FEM; (d) Model of loose deposit; (e) Domain for DEM; (f) Bedrock (FEM).
Sustainability 15 08154 g003
Figure 4. Time–history curves of feature points based on GIM: (a) Time–history curves of displacement; (b) Time–history curves of velocity; (c) Time–history curves of acceleration. (U: displacement magnitude; V: velocity magnitude; A: acceleration magnitude; the subscripts 1, 2, and 3 represent the components in the x, y, and z directions, respectively).
Sustainability 15 08154 g004
Figure 5. Development of displacement for unreinforced slope based on the DEM: (a) Step-1, 0.5 s, Fs = 1.0; (b) Step-1, 5.0 s, Fs = 1.0; (c) Step-2, 5.0 s, Fs = 1; (d) Step-3, 5.0 s, Fs = 1; (e) Step-4, 5.0 s, Fs = 1.3; (f) Step-5, 5.0 s, Fs = 1.4.
Sustainability 15 08154 g005
Figure 6. Bending moment distribution of type A (CP) obtained by the centrifuge model test and numerical simulation (scaling law is 1:100).
Sustainability 15 08154 g006
Figure 7. Anchorage schematic of numerical and physical simulations: (a) Continuous anchoring action; (b) Discontinuous rigid anchoring action; (c) Continuous elastic anchoring action; (d) Discontinuous rigid anchoring action.
Sustainability 15 08154 g007aSustainability 15 08154 g007b
Figure 8. Comparison of bending moments, soil pressure of piles type B obtained by physical and numerical simulations: (a) Back row piles of type B; (b) Front row piles of type B; (c) Back row piles of type B; (d) Front row piles of type B.
Sustainability 15 08154 g008aSustainability 15 08154 g008b
Figure 9. Deformation contour of the talus slope reinforced by type B.
Sustainability 15 08154 g009
Figure 10. Comparison of bending moment, soil pressure of pile type C obtained by physical and numerical simulations: (a) Back row piles of type C; (b) Front row piles of type C; (c) Back row piles of type C; (d) Front row piles of type C.
Sustainability 15 08154 g010aSustainability 15 08154 g010b
Figure 11. Performance of the MPG under different pile spacing: (a) Displacement; (b) Soil pressure; (c) Bending moment; (d) Shearing force; (e) Axial force.
Sustainability 15 08154 g011aSustainability 15 08154 g011b
Figure 12. Performance of the MPG with different anchorage lengths: (a) Displacement; (b) Soil pressure; (c) Bending moment; (d) Shearing force; (e) Axial force.
Sustainability 15 08154 g012aSustainability 15 08154 g012b
Figure 13. Distribution of axial force under different tangential frictional properties of pile–bedrock and bottom constraint of piles: (a) Penalty, fixed; (b) Rough, fixed; (c) Rough, free.
Sustainability 15 08154 g013
Figure 14. Comparison of axial force and shearing force for the pile type B and type C: (a) Displacement; (b) Bending moment; (c) Axial force; (d) Shearing force.
Sustainability 15 08154 g014
Figure 15. Interaction between the MP and the platform: (a) Deformation of MPG; (b) Force analysis of MP with a deflection; (c) Force analysis of the platform; (d) Force on the back row piles subjected from the platform; (e) Force on the front row piles subjected from the platform.
Sustainability 15 08154 g015
Table 1. Layout and parameters of the piles.
Pile TypeConventional Pile (CP)Micropile Group (MPG)
Type AType BType C
SketchSustainability 15 08154 i001Sustainability 15 08154 i002Sustainability 15 08154 i003
Note: The spacing of MPG is 10 times the diameter of the MP, while the pile spacing in MPG is 4 times the diameter. The cross-sectional area of piles type A is equal to the area of the type pile and the soil between the piles.
Table 2. Physical and mechanical parameters of the numerical model.
ParameterLoose Deposit/SlidePileBedrock
Elasticity modulus E (GPa)0.23030
Poisson’s ratio μ0.350.20.2
Density ρ (kg/m3)190026003000
Type of elementPD3DC3D8R
Alpha damping α0.4-
Diameter/Mesh size (m)0.30.20.2
Notes: PD3D is a rigid cell with a single node, which represents a rigid homogeneous sphere with six degrees of freedom in translation and rotation. C3D8R is a linear hexahedral cell with eight nodes. α is the material property parameter of particles adopted to improve the computational stability of the particle contact system.
Table 3. Contact parameters between parts formed by DEM or FEM.
NameTypeFriction CoefficientStiffness (N/M)Shearing Force SlopeSurface Energy (J/m2)
P–PP11JKR0.541 × 1081 × 1086000
P–FP1BLINEAR0.41 × 108-
P–BP1FHERTZ01 × 108
Notes: P: particles (loose deposit and slide) formed by DEM; F: MPG and bedrock formed by FEM; B: box of model domain; the international system of units was used in Table 3.
Disclaimer/Publisher’s Note: The statements, opinions and data contained in all publications are solely those of the individual author(s) and contributor(s) and not of MDPI and/or the editor(s). MDPI and/or the editor(s) disclaim responsibility for any injury to people or property resulting from any ideas, methods, instructions or products referred to in the content.

