Abstract
Sustainable solutions involving geosynthetic-reinforced soil walls have been achieved in projects that use locally available backfill materials and a reduced volume of geosynthetic reinforcements. Different arrangements of reinforcements can be adopted to reduce the volume of geosynthetics. This paper reports the deformation measurements taken from four instrumented geosynthetic-reinforced soil walls constructed with different arrangements of reinforcement layers including different lengths and tensile properties. The deformation of walls with rigid reinforcements at lower elevations and more flexible at upper portions of the wall height was compared to walls with a uniform distribution of reinforcement layers. Similarly, the effect of the nonuniformity of reinforcement lengths along the wall height was also evaluated. Relatively short reinforcements (L/H < 0.7) used at deeper reinforced layers were observed to overload the upper reinforcement layers resulting in mobilized loads higher than expected, resulting in increases of approximately 80% in the wall’s deformation. In contrast, the use of rigid reinforcements at lower layers led to a reduction in facing displacements of 50% at lower instrumented layers and of 60% at upper instrumented layers. The distribution pattern of facing displacements, reinforcement-mobilized loads and strains along the wall height was significantly affected by the adoption of heterogeneous reinforced layers.
1. Introduction
Geosynthetic materials have contributed to reducing environmental impacts in geotechnical engineering [1]. In geosynthetic-reinforced soil walls (GRSW), more sustainable solutions and cost savings have been reached using locally available backfill materials and a reduced volume of geosynthetic materials. Although granular soils provide friction capacity, adequate interaction with geosynthetic reinforcements and high permeability [2,3,4,5] to GRSW structures, these may lead to economic and environmental impacts in regions in which this type of material is not available on site. In contrast, locally available soils, often classified as marginal, lead to significant cost savings in a GRRW, as well as generating more environmentally friendly work due to the transportation and disposal activities [6,7,8,9]. However, some issues involving pore pressure developments, reduced interaction with geosynthetic reinforcement and soil creep need specific attention in design analyses. On the other hand, designers can eventually account for high levels of apparent cohesion developed in this type of soil under unsaturated conditions. Several studies have reported on the fine-grained soils in the reinforced zone exhibiting adequate behavior when properly designed and constructed [10,11,12,13,14,15,16,17,18].
Designers can also count on the opportunity of further reducing costs and environmental impacts in a GRSW construction by optimizing the use of more than one geosynthetic-reinforcement-type or length. The use of classic active earth pressure theory is the most common methodology to calculate the reinforcement load in GRSW structures [2,4,5]. This approach applies the lateral earth pressure theory (e.g., Coulomb and Rankine) and the reinforcement vertical space to determine horizontal forces in each reinforcement layer. This procedure allows the designers to assign different reinforcement tensile strengths along the GRSW height. Most classical approaches assume a linear increase in the required tensile load with depth or a trapezoidal shape, which permits designers to opt for geosynthetic reinforcements with reduced tensile strength and stiffness at upper reinforced layers. However, studies in the literature have indicated that the load distribution along the wall height depends on many variables. According to [19], the reinforcement load distribution shape is a function of the combined effect of reinforcement and face stiffness (reinforcement strength and vertical spacing), wall height and wall bottom resistance (embedment). Studies have also shown that the factors that most influence reinforcing loads mobilized in the wall during its construction and operation are the differences in the load–strain–time properties of reinforcing materials [20]. The reinforcement load usually varies with depth due to soil strength parameters and surface surcharges. Therefore, to optimize the structure’s cost, the designer can work with different types of geosynthetic reinforcement and several strengths along the wall height [21]. Using numerical analyses, Ref. [22] found that the reinforcement vertical spacing, length (to wall height ratio (L/H) and stiffness are important parameters that influence the wall displacement response. Little reinforcement load and soil stress variation was observed for L/H ≥ 0.7 [23]. In fact, the ratio L/H = 0.7 is currently recommended as the minimum reinforcement length ratio by GRSW design guidelines worldwide [2,4,5]. Adopting L/H values lower than 0.7 can affect the distribution of loads in a GRSW structure. Comparing the load deformation behavior of a geosynthetic-reinforced structure constructed with very short and long homogeneous reinforcement layouts, ref. [24] found that limiting the length of the retained zone affects the internal stability of the wall and the wall deformation.
Although the use of different reinforcement lengths and stiffnesses along the wall height is a common practice in GRSW structures, most of the studies in the literature describe the effect of vertical spacing between reinforcements, and limited research has been conducted to observe the impact of using a nonuniform reinforcement length and stiffness. The use of different reinforcements along the wall height was found not to lead to significant differences in the distribution of the maximum reinforcement load in the range of the typical geosynthetic materials adopted in practice [25]. However, reinforcement layers with stiffness values representative of steel strip materials can mobilize significantly higher reinforcement loads affecting distribution. Different geosynthetics layouts in geosynthetic-reinforced soil models were evaluated by [26], which allowed the conclusion to be made that the reinforcement arrangement used in the wall can significantly affect its face displacements. In the study, the use of shorter reinforcements at lower reinforced layers resulted in a significant increase in the face displacements at the mid-height of the structure as compared to the use of homogeneous and longer reinforcements. It is worth mentioning that the studies reported herein that evaluate the heterogeneity of geosynthetic layouts in geosynthetic-reinforced soil walls are mostly based on numerical and laboratory models. The observation from full-scale field structures is then able to make a significant contribution to this topic.
In this article’s results, interpretations and analysis performed in four real estate worksite instrumented GRSWs constructed using locally available marginal soil were conducted to examine the short- and long-term deformation response of different nonuniform reinforcement arrangements inside a geosynthetic-reinforced structure. The term “nonuniform” is used generically to identify the use of more of one reinforcement type, and different reinforcement spacings and lengths inside the structure. The objective of this work is to report the short-term and long-term deformation response of walls constructed with heterogeneous arrangements of reinforcement lengths and stiffnesses, as well as to evaluate the influence of these on the distribution of facing displacements and loads mobilized by reinforcements based on a field-scale structure.
2. Experimental Program
2.1. Field Geosynthetic-Reinforced Soil Wall
Four sections of a geosynthetic-reinforced retaining wall (GRRW) were instrumented to monitor internal displacements. The monitored structure was constructed in São José dos Campos, State of São Paulo, Brazil (UTM 7.427.574,64S; 404.070,06E). Standard penetration tests indicated a foundation soil comprised of a clayey sand with 1.0 m thickness and a subsequent 5 m thick layer of an organic soft clay soil with penetration index (NSPT) lower than 5. Below this layer, a sandy clay material with NSPT of 11 was found to reach 15 m in depth. The water table was relatively shallow, occurring at 0.5 m from the surface. As ground improvement, a gravel layer of 4 m in thickness replaced the foundation soil avoiding significant GRRW settlements.
The field GRRW was constructed in 2016 involving a structure with 118 m of extension and maximum height of 5.6 m. Figure 1 provides an overall view of the GRRW. The wall was constructed with fourteen layers of geosynthetic reinforcements, including PET geogrids and PP woven geotextiles, at a spacing of Sv of 0.4 m and a target facing batter of 6° from the vertical (10V:1H). The wall facing was built using a welded wire form filled with selected crushed stones. The wall was designed to satisfy the Federal Highway Administration guidelines [2]. The end of construction of the entire wall (including instrumented sections) occurred after approximately 40 days (960 h), and the monitored period finalized after 10,944 h from the beginning of construction.
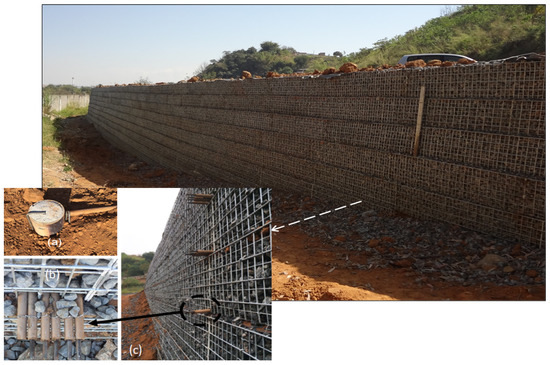
Figure 1.
Overall view of the instrumented GRSW during construction: (a) installation of the reference bar for relative internal displacements; (b) view of the end of the extensometers used for relative displacement measurements; (c) view of the instrumented layers.
For research purposes, four sections along the wall extension were constructed with different reinforcement lengths and geosynthetic materials. The same reinforcement spacing, wall height and facing element were used for the four walls. Figure 2 shows a cross-section of the walls. Wall 1 was constructed with a polyester (PET) geogrid 8.0 m in length. A geogrid with 50 kN/m (GG50) was selected for lower layers until reaching 2.4 m in height. For upper reinforcement layers, a PET geogrid with 40 kN/m (GG40) tensile load was used. Wall 2 was constructed with a PET geogrid with 40 kN/m tensile strength in all the reinforcement layers and 6.5 m in length. A PET geogrid of 40 kN/m tensile strength was used in Wall 3 until reaching 2.4 m in height, and a polypropylene (PP) woven geotextile with 50 kN/m (GT50) tensile strength for upper layers. Wall 4 was entirely reinforced with PP woven geotextile but using shorter reinforcements in lower layers. These four walls were instrumented for monitoring internal displacements, which allowed evaluation of the influence of length and stiffness of reinforcements on the performance of geosynthetic-reinforced retaining walls. The distance between each instrumented section was limited to 40 m to avoid the effect of lateral restraining from one section to the other.
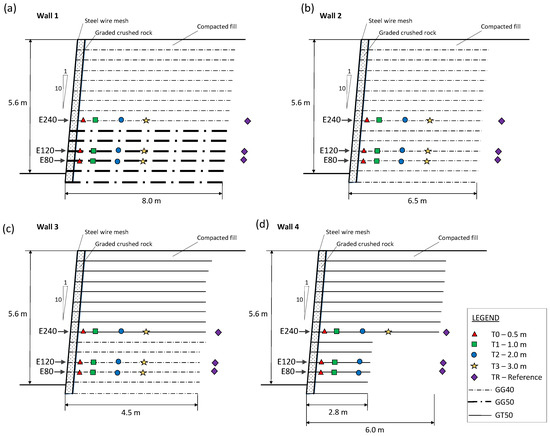
Figure 2.
Scheme of monitored sections: (a) Wall 1; (b) Wall 2; (c) Wall 3; (d) Wall 4; and detail of extensometer location.
2.2. Soil Properties and Compaction Process
The backfill was a local and residual lateritic sandy clay soil classified as MH and A-7-6 according to the Unified Soil Classification System and Highway Research Board, respectively. The use of locally available soil was motivated by the overall reduction in costs. The soil properties are summarized in Table 1. Proctor compaction tests were performed using standard effort according to ASTM D698 [27]. The shear strength of the backfill material was determined by consolidated drained triaxial compression tests according to ASTM D7181 [28] under confining pressures of 50, 100 and 150 kPa. Soil specimens with dimensions of 50 mm in diameter and 100 mm in height were molded at the target dry unit weight corresponding to 98% of compaction degree. Triaxial compression tests results are shown in Figure 3.

Table 1.
Properties of the fine-grained backfill soil.
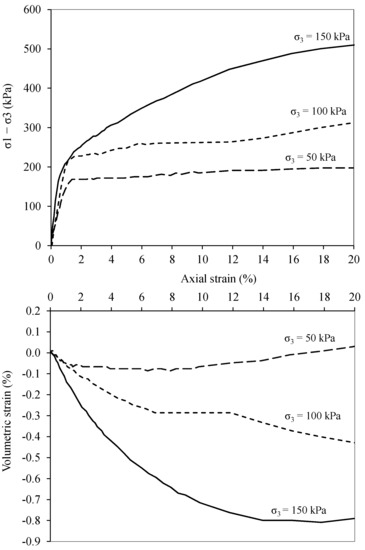
Figure 3.
Triaxial compression test results of backfill soil.
The backfill soil was compacted to a target 98% of standard Proctor density achieved using a single drum vibratory roller (DYNAPAC Padfoot drum) for areas located at a distance beyond 1.0 m from the face. The soil located at the first 1.0 m distance directly behind the wall facing was compacted to a target 95% using a vibrating hammer. This measure was taken to minimize construction-induced outward deformation and lateral stresses against the back of the facing. Caution was taken to not exceed 250 mm compacted layers. The measured moisture content of the soil was 21 ± 2%.
2.3. Geosynthetics
As previously mentioned, three geosynthetic reinforcements were used in the instrumented sections of Figure 2. Polyester biaxial woven geogrid with tensile strength of 50 kN/m (GG50) was used in lower layers of Wall 1. Other polyester woven biaxial geogrids with 40 kN/m of tensile strength (GG40) were adopted in Walls 1, 2 and 3. Polypropylene woven geotextiles with tensile strength of 50 kN/m (GT50) were used in the upper reinforced layers of Wall 3 and in the entirety of Wall 4. Table 2 shows the properties of geosynthetic reinforcement products. Although GT50 has higher tensile strength than GG40, its tensile stiffness is the lowest among the geosynthetics used.
Table 2.
Properties of geosynthetic reinforcements.
As one of the issues of this investigation regarding the long-term deformation of instrumented layers, creep tests were performed according to ASTM D5262 [30]. The tests involved the geosynthetic specimens being subjected to sustained loads of 5% and 10% of the ultimate tensile strength of each material. Results of in-isolation creep tests are shown in Figure 4.
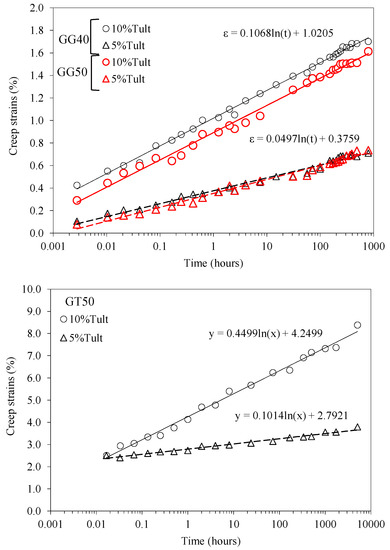
Figure 4.
Results of in-isolation creep tests of geosynthetics used in the GRRW.
2.4. Measurement of Internal Displacement
Instrumentation, based on mechanical extensometers (tell-tales), was used to monitor the wall during and after construction. The tell-tales were made with smooth-jacketed steel rods and were installed along the reinforcement length to monitor internal displacements. Figure 2 shows the instrumentation layout used to evaluate the performance of the wall. The tell-tale points were attached to the geosynthetics at distances of 0.5, 1.0, 2.0 and 3.0 m from the front of wall facing. The benchmark of the tell-tales was positioned outside the reinforced zone in order to allow relative measurements between these and rods located inside and outside the reinforced zone. Relative displacements were measured using a digital caliper with a resolution of 0.01 mm.
The tell-tale system precision and accuracy was tested by comparing relative rods’ displacements with positioning markers on the instrumented surfaces. This system allowed measurements with 3 mm in accuracy and 1 mm of precision. Internal horizontal displacements were measured in three rows at different heights of 0.8, 1.2 and 2.4 m from the base of the wall (sets E80, E120 and E240, respectively), as illustrated in Figure 2. Figure 1 shows images of internal displacement monitoring system used in the GRRW.
2.5. Methodology for Strains and Tensile Load Calculation
A specific methodology was adopted for determining strain’s levels and distributions along reinforcement length as the calculation using the relative displacements between extensometers measurement points is not precise. Sigmoidal charts fitting the raw data were plotted to provide a smooth representation of the displacement distribution along the entire reinforcement length. Thus, a sigmoidal curve fit was employed to analyze the strain’s distribution along the entire reinforcement, as shown by Zornberg and Arriaga [31]. The displacement tell-tale raw data were initially smoothed by fitting the data to a sigmoidal curve. The strain’s distribution along the reinforcement lengths was then computed by deriving the displacement function as:
where d is the extensometer displacement, x is the distance from the face to the measured point, and a, b and c are parameters defined by the fitting of sigmoidal curves to the raw data using the least squares technique.
It is interesting to compare registered maximum reinforcement loads with predicted ones using the AASHTO (2002) simplified method and the most recent version of the K-stiffness method [32]. The “registered” maximum reinforcement load in a geosynthetic layer is calculated as
where J is the secant stiffness value (taken from Figure 5), matching the time (t) since the beginning of construction, and the measured peak internal strain value in the layer (Ɛmax).
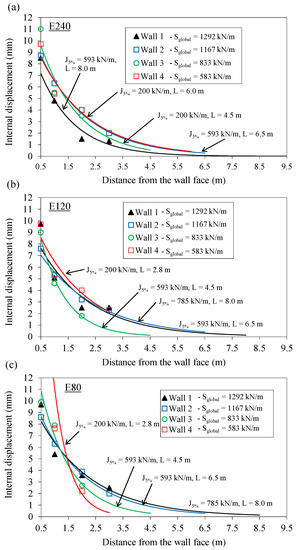
Figure 5.
Comparison of distribution of internal displacements along reinforcements of instrumented layers: (a) E240; (b) E120; (c) E80.
The accuracy of reinforcement loads’ estimation using J-values was already demonstrated by laboratory in-isolation constant-load tests, duration of loading and measured strain [33].
3. Results
3.1. Distribution of Displacements along Reinforcements
Figure 5 compares the distribution of internal displacements measured along the reinforcement length of the four geosynthetic-reinforced structures at each instrumented reinforcement layer (E240, E120, E80). Note that the distribution of displacement along the lengths is described using a simple exponential function for a better trend comparison. As displacement distributions tend to converge to a value at the end of the reinforcement length, an exponential fitting was considered adequate only for comparison purposes. It also allows the identification of eventual slippage by the displacement at the end of the anchorage length.
Walls 1 and 3 were constructed with nonuniform grouped geosynthetic stiffness over wall height with a uniform vertical spacing (Sv = 0.4 m) and Lr/H (reinforcement length/wall height) of 1.4 and 0.8, respectively. Walls 2 and 4 were uniform in terms of reinforcement stiffness and vertical spacing, but Wall 4 was specifically designed to have reduced lengths at lower portions, corresponding to an Lr/H of 0.5. As shown in Figure 5, uniform distribution of reinforcement stiffness along the wall height led to a similar shape of the distribution of displacements along the length considering all the instrumented layers (e.g., Wall 2 of Figure 5). Conversely, the nonuniformity of stiffnesses (Walls 1 and 3) and lengths (Wall 4) along the wall height was found to affect the distribution of displacements along reinforcement lengths. In such cases, the reduced length tends to increase the displacements close to the wall face. For these cases, the global stiffness was not the principal variable of influence on the values or distribution of lateral displacements for not considering the length in its calculation.
As expected, the excessive anchorage length eventually led to very small displacements to reinforcements embedded in the passive reinforced zone in all the instrumented layers of Walls 1, 2 and 3. Anchorage displacements were found to slightly increase with the reduction in reinforcement lengths reaching values of 0.5 mm. For Wall 4, in which the Lr/H was lower than 0.7, anchorage displacements were relatively high, reaching 3 mm (Wall 4 of Figure 5b) at the instrumented layer E120. Clearly, the use of very short reinforcements in lower layers caused additional anchorage displacements that were also affected by the smooth interface between the soil and woven geotextile. Note that larger anchorage displacements occurred at the deeper instrumented layer, which can be attributed to the accumulation of stresses due to compaction and higher self-weight earth pressures (Figure 5c). Higher stresses at lower depths also potentially affect the distribution of earth pressures. In addition, the combined effect of the length and stiffness of reinforcements appears to significantly influence the displacement behavior of the walls. For example, Wall 2 was composed with the GG40 in all reinforcement layers. A reinforcement length of 6.5 m was adopted for Wall 2. This arrangement led to a similar displacement distribution along the reinforced length to that of Wall 1 composed with more rigid reinforcement layers for the first seven reinforced layers. Both walls had a similar global stiffness. Displacements were higher in Wall 2 than in Wall 1. Note that both walls had an L/H greater than 0.7, which allows us to conclude that the length has a significant influence on internal displacements even with an L/H greater than 0.7. Comparing Wall 2 to Wall 3, which used longer reinforcements than Wall 3 but had a higher global stiffness, a different pattern of displacement distribution can be seen. In Wall 3, the shorter reinforcement led to higher displacements close to the face, while Wall 2 had higher levels of displacements towards the passive zone. This is evidence that the anchorage of Wall 3 was not sufficient to distribute loads along the entire length. This fact resulted in larger displacements towards the face. Wall 4 demonstrates a similar pattern to that of Wall 3 at the lower instrumented layer, in which the reinforcement length was 2.8 m (L/H smaller than 0.7). This lack of anchorage was found to increase the displacements at the upper longer layers. In this case, the reduced global stiffness also influenced the displacements.
3.2. Lateral Displacements of Walls Facing
Figure 6 compares the distribution of face displacements (normalized to height) along the walls’ elevation at the end of construction and after approximately one year of service (10,944 h). Walls 1 and 3 used nonuniform grouped reinforcements using two different stiffness values that increase in magnitude toward the base of the wall. Both walls have significant differences in global stiffness—Wall 1 has a global stiffness about 60% higher than Wall 3. Comparatively, Wall 2 was constructed with uniform reinforcement stiffness over the entire height. This wall has lower global stiffness than Wall 1 but greater than Wall 3. As regards reinforcement lengths, the three walls present uniformity of reinforcement lengths over the wall height and show length-to-height ratios (L/H) greater than 0.7. The results of Figure 5 indicate that the walls have enough interfacial strength between the soil and geosynthetics leading to a global or local stiffness dependency on wall behavior, excepting Wall 3 and Wall 4. It is worth noting that the vertical spacing of the walls were the same and were kept over the wall height.
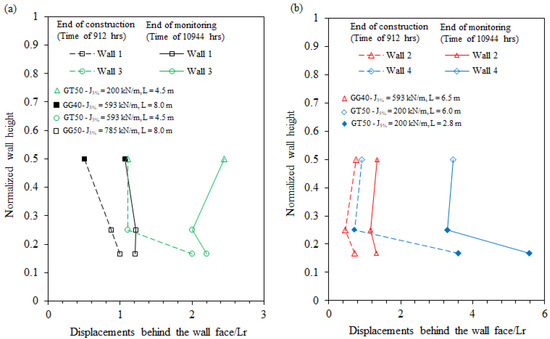
Figure 6.
Distribution of facing displacement along the wall elevation: (a) Comparison between Walls 1 and 3; (b) comparison between Walls 2 and 4.
The comparison of facing displacements measured in Walls 1 and 3 (Figure 6a) shows that placing less stiff reinforcement in the upper half of the wall led to greater displacements in this portion than expected. Lateral displacement within the lower half also increased because the placement of a stiffer reinforcement layer attracts more load to the stiffer region of the reinforced zone resulting in more displacements in this zone (Wall 1 of Figure 6a). Comparing the distributions of displacements along the heights of Walls 1 and 3, the overloading of the lower layers is more pronounced as the global stiffness of the structure becomes lower.
The measured face displacements in the upper portion of Wall 3 and for the entirety of Wall 4 show the significant influence of the geosynthetic polymer on creep deformation (Figure 6a). Compared to Walls 1 and 2, which used polyester geogrids over their entire height, and Wall 3 with the same geogrid at the lower part, the significant higher values of lateral displacements in the upper layers of Wall 3 and all over Wall 4 can be attributed to the use of a polypropylene woven geotextile that was more susceptible to creep.
Walls 1 and 2 were constructed using relatively long reinforcements (Lr/H > 1.0) and similar global stiffnesses. The comparison of the results demonstrates that using long reinforcements did not lead to significant benefits to wall performance. The shape of the distribution of displacements along the wall height is also affected by the difference in the stiffness values between the grouped reinforcement layers. For example, Wall 3 (Figure 6a) shows higher local lateral displacement in the upper instrumented layer than Wall 1. Using uniform reinforcement stiffness results in the uniform distribution of lateral displacements for a cohesive soil as can be noted in Wall 2 of Figure 6b. The results of Walls 2 and 3 show that the main difference is that one has a less stiff upper reinforcement layer than the other, the difference being in the displacement levels, but the shape of displacement distribution is maintained. However, the differences in the lateral displacements of the uniform Wall 2 in comparison to those of the nonuniform Wall 3 were generally small. Therefore, the scheme of reducing the reinforcement stiffness with height, already frequently used by designers, appears to be an interesting cost-effective configuration that prevents significantly larger horizontal wall displacement as compared to the uniform and stiffer scheme.
Placing shorter reinforcements (Lr/H lower than 0.7) in the lower half of the wall height (Wall 4) leads to excessive displacement in this region. Reductions in Lr/H between 1.4 and 0.8 did not significantly affect wall displacements. Therefore, the action of reducing the reinforcement length for every other layer seems to be an interesting strategy to control the required quantity of reinforcement with little impact on wall displacement. However, it was observed that an Lr/H of 0.5 (less than 0.7) must be carefully considered even using longer reinforcements in upper layers.
3.3. Reinforcement Strains
Figure 7 compares the progress of strains over time for all reinforced walls in each instrumented reinforcement layer. Figure 7a depicts the strains’ evolution from the beginning of construction, while Figure 7b presents only the post-construction strains plotted against log-time to observe the time-dependent behavior of reinforcements.
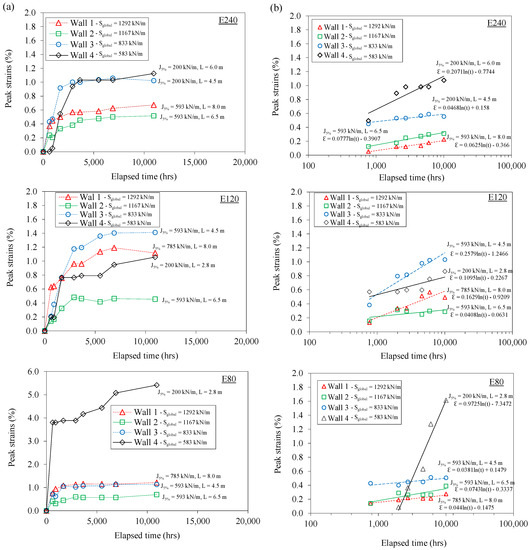
Figure 7.
Evolution of reinforcement peak strains: (a) during the construction process; (b) time-dependent strains.
As expected, most of the strains developed during the construction process as an effect of stresses due to compaction (Figure 7a). Considering the relatively low height of the structures, and consequent low levels of vertical earth pressures, compaction stresses were found to be a significant parcel of total stresses mainly in lower reinforced layers. In general, walls with a higher global stiffness resulted in a reduced level of strains.
As regards the effect of using grouped nonuniform reinforcement stiffness over the height, it is worth noting the uniformity of the peak strains of Wall 2 along the wall elevation as a result of the use of uniform reinforcements. In the case of grouped nonuniform reinforcement layers, lower layers were observed to have higher strains even when using a stiffer reinforcement in the lower portion of the wall. This is the case of the stiffer region of the reinforced zone attracting more load due to the increase in reinforcement stiffness. In addition, the effect of soil cohesion in the upper layer is more pronounced than in the lower layers due to the reduced vertical stresses.
The comparison between the uniform Wall 2 and the nonuniform Wall 3 allows us to conclude that the replacement of the upper region of the reinforcement layers by a less stiff geogrid (Wall 3) led to a significant increase in strains in all the instrumented layers, even those presenting very close values of global stiffness. In the case of Wall 4, the reduced length in the lower region of the wall led to excessive straining in the lower layers and a higher mobilization of loads in the upper reinforcement layers.
In Figure 7b, time-dependent strains are assessed plotting the cumulative strains versus log-time. The angular coefficient indicates how susceptible to a temporal effect the instrumented reinforcement layer is. The time-dependent strains are dependent on any variables, such as polymer type, level of stress, type of backfill, type of geosynthetic and environmental conditions. As the geometric and backfill conditions of the walls are the same, it is possible to verify the influence of the reinforcement type and its length.
From Figure 7b, in general, Wall 4 was observed to have the highest post-construction strain among all the instrumented structures. This is because of its reduced global stiffness and low reinforcement length and due to the use of polypropylene woven geotextiles, which also explain the excessive deformation at the E80-instrumented layer. In addition, the lack of interaction in the lowest instrumented layer overcharged the upper layers resulting in high rates of strains.
Differently from construction strains, time-dependent strains were strictly dependent on global stiffness. However, Wall 1 demonstrated unexpectedly high rates of strains over time even comprising the most globally rigid structure among the others studied. Again, the use of excessively long reinforcements does not contribute to the wall’s behavior.
An interesting aspect to discuss is the similarity of strain rates with time measured in the walls to those obtained through conventional in-isolation creep tests in the laboratory (Figure 4). For example, the instrumented layers in Wall 4 indicate values of angular coefficient between 0.1 and 0.2, which corresponds to strain rates at 5% and 10% of ultimate tensile strength in laboratory tests. Similar comparisons can be obtained for other instrumented walls. This is evidence that using conventional creep tests for predicting load and deformation is a consistent tool for design analyses, as recommended by previous researches [34,35]. However, minor differences in strain rates in comparison to laboratory results can be attributed to the high rigidity of the soil that led to reduced mobilized loads. It should also be observed that the trend of increasing strain rates with depth is only observed for uniform Wall 2. In terms of stiffness, nonuniform structures (Walls 1 and 3) demonstrate a similar trend of higher strain rates in the intermediate instrumented layer (E120). Explanations consider the trend of attracting the load to lower layers in addition to that comprising the transition zone of reinforcement stiffness. Note that this behavior did not occur for uniform structures even with shorter reinforcement in the lower layers (case of Wall 4).
3.4. Potential Failure Surface Location
The locations of peak strains in each instrumented reinforcement layer along the hall height are plotted in Figure 8. These plots indicate the location of a potential failure surface of the wall under service. Rankine’s failure surfaces are also plotted for comparison purposes.
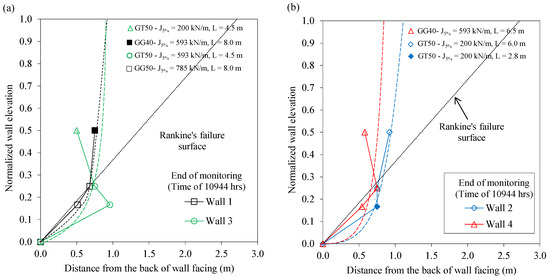
Figure 8.
Experimental potential failure surfaces: (a) comparison between Wall 1 and 3; (b) comparison between Wall 2 and 4.
In general, Figure 8 shows that the potential failure surface generally agreed with Rankine’s only at the first 1.2 m of elevation—about 25% of the total height. Up to this elevation, the failure surface was found to be nonlinear and closer to the face than linear Rankine’s failure, similar to those results obtained in others researches [9,11]. In design analyses, a close-to-face failure surface demands shorter reinforcement lengths. In turn, Figure 6 shows larger displacements during construction for shorter reinforcement lengths. Note that the described behavior was captured considering a service condition of the walls, in which the state of the stresses was relatively far from the failure condition. Under service, the reinforcement was not necessarily pulled out of the anchorage zone but partially strained due to a lack of interaction in some zones at the anchorage length.
In Figure 8a, using nonuniform reinforcement stiffness but uniform reinforcement lengths (Wall 3) along the wall height and an Lr/H of about 0.8 led to the nonuniform shape of the potential failure surface. This is probably a result of the concentration of compaction stresses in lower reinforcement layers—but it was relatively rigid, not allowing the relief of stresses. In upper layers, the reduced stiffness values of reinforcements led to the relief of compaction stresses due to straining. If structures with nonuniformity of reinforcement lengths but with uniform distribution of reinforcement stiffnesses are compared (Figure 8b)—the case of Walls 2 and 4—the potential failure surfaces were found to be less shallow than those in structures with higher global stiffnesses but that were still nonlinear. Clearly, global stiffness has more influence than reinforcement length or local stiffness. In addition, a greater uniformity of the shape of failure could be observed.
3.5. Mobilized Loads along the Wall Height
Figure 9 compares the loads mobilized by reinforcements to those calculated using AASTHO and K-stiffness for c-φ soils [12] methods in all the instrumented structures. Mobilized loads were calculated based on converting measured reinforcement strains to load using constant-rate-of-strain tests [33]. Load distributions along the wall height were calculated using the AASTHO method based on at-rest and active earth pressure coefficients—Jacky’s and Rankine’s formulations, respectively. A soil cohesion of 10 kPa and friction angle of 30° were considered for calculating lateral earth pressure distribution as described in Section 2 and Table 1.
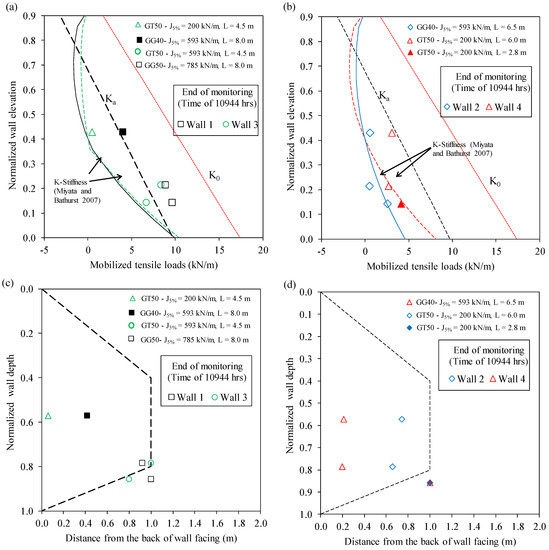
Figure 9.
Mobilized loads in instrumented layers of the four walls: (a) comparison between walls 1 and 3; (b) comparison between Walls 2 and 4; (c) load distribution for walls 1 and 3; (d) load distribution for walls 2 and 4.
Figure 9a depicts the comparison of load distributions along the heights of Walls 1 and 3. Both walls consisted of uniform reinforcement lengths along the heights but with nonuniformity of stiffness, in which more rigid reinforcements were used for the first half of the height from the base approximately. Walls 2 and 4 are compared in Figure 9b to show the uniformity of reinforcement stiffnesses along the height but the nonuniformity of lengths along wall heights (only in Wall 4).
Clearly, the nonuniformity of stiffness along wall height affected the distribution of loads. Using stiffer reinforcements at the lower layers led to coefficient values between Ka and K0 states for Walls 1 and 3 (Figure 9a). For shallower depth layers, the active state was found to be conditioned by reduced reinforcement stiffness mainly for reduced global stiffness structure. For a stiffer structure (Wall 1), the AASHTO method was found to be more consistent with experimental results, while the K-stiffness method seemed to underestimate load values. This is a behavior that can be attributed to conservatism of stiffness for this structure. For Wall 3, the K-stiffness method was observed to be more consistent and the AASHTO method was very conservative. It is worth noting that experimental points tend to be greater than those expected for both methodologies. The fact of using less stiff reinforcement layers in the upper region of the wall attracts more loads to lower and stiffer reinforcement layers. This phenomenon does not account for both methods. In the case of Walls 2 and 4 (Figure 9b), in which reinforcement stiffness is uniform, both methods led to a reasonable prediction of loads, with better results in the K-stiffness method. However, the reduced reinforcement length at lower layers of Wall 4 increased the loads in the upper layers, which is also not captured by either design method.
As regards the location of loads along heights (Figure 9c,d), the fact of using nonuniform reinforcement stiffnesses and lengths led to a disagreement with the K-stiffness method. However, a good agreement can be noted for the lower layers of Walls 1 and 3 in which the reinforcement stiffnesses are nonuniform along walls heights. Therefore, in terms of the location of loads, the nonuniformity of lengths more significantly affected the distribution than stiffnesses. The nonuniform distribution of loads along wall height due to the nonuniformity of stiffness and lengths significantly affected the location of maximum loads.
4. Conclusions
Four geosynthetic-reinforced soil walls were instrumented to allow the comparison of the deformation behavior of structures with heterogeneous arrangements of reinforcement length and stiffness. Walls varied in global stiffness, reinforcement stiffness (use of different stiffnesses along the wall height) and reinforcement lengths. Specifically, heterogeneity of length was adopted in one of the walls using shorter reinforcement at lower reinforced layers. Other walls had differences of reinforcement lengths over wall height. The walls were 5.6 m high constructed with the same total height and vertical spacing between reinforcements and had three instrumented layers to capture internal and facing displacements. The same cohesive fine-grained soil was adopted as backfill soil. Internal displacements measured using an extensometer allowed us to discuss the distribution of the estimated loads mobilized by reinforcements. The following conclusions can be drawn:
- The uniform distribution of reinforcement stiffness led to a more uniform distribution of displacements along the reinforcement length at different elevations and along the wall height than nonuniform structures.
- The levels of reinforcement stiffness adopted in this research were relatively high for the levels of loads mobilized by reinforcements, which leads to a more significant effect of reinforcement length than stiffness. However, some effects of the heterogeneity of reinforcement stiffness could be captured in this investigation.
- The shape of the distribution of displacements along the wall height is more affected by the reinforcement length than by the stiffness. The reduced anchorage length was found to lead to greater displacements toward the face, while longer reinforcements uniformly distributed the displacements along the length.
- In walls that used different types of reinforcement over the wall height, in which stiffer reinforcement layers were used at lower reinforced layers of the structure, displacements levels were smaller than in the case of uniform arrangements. This is attributed to the attraction of loads to stiffer reinforcement layers.
- The use of stiffer reinforcements at lower reinforced layers was found to reduce the facing displacements at upper portions of the wall. This is only for walls with a uniformity of reinforcement lengths with a length-to-height greater than 1.0. Reducing the length-to-height ratio to 0.8 resulted in increases in facing displacements in the first third of the wall height.
- The wall with a length-to-height ratio of 0.5 at lower portions but keeping this ratio greater than 1.0 at upper portions of the wall had significant increases in facing displacements, more substantially than in regions in which the length was reduced.
- The use of excessive anchorage length did not bring significant benefits to wall performance. Conversely, the use of very short reinforcements at lower reinforced layers can overcharge upper longer reinforcements in addition to increasing the facing displacements locally. The use of smooth interfaces (e.g., woven geotextile–soil) also contributes to the relief of loads overloading other reinforcement layers.
- Walls that used the length-to-height ratio greater than 0.7 had enough interfacial strength between the soil and geosynthetics leading to a global or local stiffness dependency on the wall behavior. However, some additional but smaller displacements were measured when reducing the length even when the L/H was greater than 0.7.
- Comparing the increase in strains with time observed in the instrumented walls to those obtained through laboratory conventional in-isolation creep tests, considering the same mobilized loads, the results show that using conventional creep tests for predicting load and deformation is a consistent tool for the design analyses of relatively low height structures for the reinforcements and configurations used in this research.
- The polypropylene geotextile had greater long-term deformation due to its susceptibility of creep. However, the use of the polyester geogrid at lower portions led to reduced long-term deformations.
- The load’s distribution along the wall height were nonlinear and closer to the face than those of linear Rankine’s failure surface, which could demand shorter reinforcement lengths. Using nonuniform reinforcement stiffness but uniform reinforcement lengths along the wall height and an Lr/H greater than 0.7 led to a bilinear distribution of loads along the wall height. In walls with a length-to-height lower than 0.8 a change in the load’s distribution was demonstrated.
- Using nonuniform grouped reinforcement layers resulted in local disagreement between the experimental and calculated mobilized loads using the AASTHO and K-stiffness method. In general, the K-stiffness method was more consistent and less conservative than the AASTHO method. As the nonuniformity attracts more loads to lower and stiffer reinforcement layers, this phenomenon is not computed in either design method. A similar conclusion can be derived for nonuniform structures in terms of reinforcement lengths.
Author Contributions
F.H.M.P. and J.M.H.G. contributed to the design and implementation of the research; F.H.M.P., J.M.H.G. and J.O.A.N. carried out the analysis of the results; F.H.M.P. wrote the manuscript with support from J.M.H.G.; J.O.A.N. designed and performed the experiments; J.O.A.N. performed the measurements; F.H.M.P. supervised the project. All authors have read and agreed to the published version of the manuscript.
Funding
This research received no external funding.
Informed Consent Statement
Not applicable.
Data Availability Statement
Data are available upon request.
Acknowledgments
The work reported herein was supported by grants to the first author by the National Council for Scientific and Technological Development (304403/2018-0). The authors are also grateful to the GeoSolucoes company for constructing and allowing the making of the field geosynthetic reinforced walls.
Conflicts of Interest
The authors declare no conflict of interest.
Notations
Basic SI units are given in parentheses.
| a | parameter of sigmoidal curves fitting (dimensionless) |
| b | parameter of sigmoidal curves fitting (dimensionless) |
| c | parameter of sigmoidal curves fitting (dimensionless) |
| c’ | Cohesion Intercept (kPa) |
| d | extensometer displacement (mm) |
| E120 | Internal horizontal displacements rows at 1.2 m |
| E240 | Internal horizontal displacements rows at 2.4 m |
| E80 | Internal horizontal displacements rows at 0.8 m |
| GG40 | PET geogrid with tensile load of 40 kN/m |
| GG50 | PET geogrid with tensile load of 50 kN/m |
| GRRW | Geosynthetic-reinforced retaining wall |
| GT50 | PP woven geotextile with tensile strength of 50 kN/m |
| H | wall height (m) |
| J | Secant reinforcement stiffness (kN/m) |
| Lr | reinforcement length (m) |
| Lrglobal | average of reinforcement lengths along the wall heights (m) |
| PET | Polyester |
| PP | Polypropylene |
| Sglobal | global wall reinforcement stiffness (kN/m) |
| Slocal | reinforcement stiffness (kN/m) |
| sv | vertical spacing between reinforcements (m) |
| t | Time (hour) |
| Tmax | maximum mobilized reinforcement loads (kN/m) |
| w | Optimum moisture content (dimensionless) |
| x | distance from the face to the measured point (mm) |
| ε | strain (dimensionless) |
| σ1 | Major principal stress (kPa) |
| σ3 | Minor principal stress (kPa) |
| σv | Vertical stress (kPa) |
| φ’ | Friction angle (°) |
References
- Giglio, C.; Vocaturo, G.S.; Palmieri, R. A Scientometric Study of LCA-Based Industrialization and Commercialization of Geosynthetics in Infrastructures. Appl. Sci. 2023, 13, 2328. [Google Scholar] [CrossRef]
- Berg, R.; Christopher, B.; Samtani, N. Design and Construction of Mechanically Stabilized Earth Walls and Reinforced Soil Slopes–Volume I; Technical Report FHWA-NHI-10-024; Federal High Way Administration (FHWA): Washington, DC, USA, 2009. [Google Scholar]
- AASHTO. AASHTO LRFD Bridge Design Specifications, 7th ed.; AASHTO: Washington, DC, USA, 2014. [Google Scholar]
- NCMA. Design Manual for Segmental Retaining Walls, 3rd ed.; The National Concrete Masonry Association: Herndon, VA, USA, 2010. [Google Scholar]
- British Standards Institution. BS 8006 Code of Practice for Strengthened; British Standards Institution: London, UK, 1995; ISBN 0580242161. [Google Scholar]
- Zornberg, J.G.; Mitchell, J.K. Reinforced Soil Structures with Poorly Draining Backfills. Part I: Reinforcement Interactions and Functions. Geosynth. Int. 1994, 1, 103–147. [Google Scholar] [CrossRef]
- Stulgis, R.P. Selecting Reinforced Fill Materials for MSE Retaining Walls. In Proceedings of the Geosynthetics Research and Development in Progress, Austin, TX, USA, 24–26 January 2005. [Google Scholar]
- Pathak, Y.P.; Alfaro, M.C. Wetting-Drying Behaviour of Geogrid-Reinforced Clay under Working Load Conditions. Geosynth. Int. 2010, 17, 144–156. [Google Scholar] [CrossRef]
- Portelinha, F.H.; Zornberg, J.G.; Pimentel, V. Field Performance of Retaining Walls Reinforced with Woven and Nonwoven Geotextiles. Geosynth. Int. 2014, 21, 270–284. [Google Scholar] [CrossRef]
- Tan, S.A.; Chew, S.H.; Ng, C.C.; Loh, S.L.; Karunaratne, G.P.; Delmas, P.; Loke, K.H. Large-Scale Drainage Behaviour of Composite Geotextile and Geogrid in Residual Soil. Geotext. Geomembr. 2001, 19, 163–176. [Google Scholar] [CrossRef]
- Benjamim, C.V.S.; Bueno, B.S.; Zornberg, J.G. Field Monitoring Evaluation of Geotextile-Reinforced Soil-Retaining Walls. Geosynth. Int. 2007, 14, 100–118. [Google Scholar] [CrossRef]
- Miyata, Y.; Bathurst, R.J. Development of the K-Stiffness Method for Geosynthetic Reinforced Soil Walls Constructed with c-π Soils. Can. Geotech. J. 2007, 44, 1391–1416. [Google Scholar] [CrossRef]
- Ahmadabadi, M.; Ghanbari, A. New Procedure for Active Earth Pressure Calculation in Retaining Walls with Reinforced Cohesive-Frictional Backfill. Geotext. Geomembr. 2009, 27, 456–463. [Google Scholar] [CrossRef]
- Raisinghani, D.V.; Viswanadham, B.V.S. Evaluation of Permeability Characteristics of a Geosynthetic-Reinforced Soil through Laboratory Tests. Geotext. Geomembr. 2010, 28, 579–588. [Google Scholar] [CrossRef]
- Noorzad, R.; Mirmoradi, S.H. Laboratory Evaluation of the Behavior of a Geotextile Reinforced Clay. Geotext. Geomembr. 2010, 28, 386–392. [Google Scholar] [CrossRef]
- Portelinha, F.H.M.; Bueno, B.S.; Zornberg, J.G. Performance of Nonwoven Geotextile-Reinforced Walls under Wetting Conditions: Laboratory and Field Investigations. Geosynth. Int. 2013, 20, 90–104. [Google Scholar] [CrossRef]
- Riccio, M.; Ehrlich, M.; Dias, D. Field Monitoring and Analyses of the Response of a Block-Faced Geogrid Wall Using Fine-Grained Tropical Soils. Geotext. Geomembr. 2014, 42, 127–138. [Google Scholar] [CrossRef]
- Balakrishnan, S.; Viswanadham, B.V.S. Centrifuge Model Studies on the Performance of Soil Walls Reinforced with Sand-Cushioned Geogrid Layers. Geotext. Geomembr. 2019, 47, 803–814. [Google Scholar] [CrossRef]
- Mirmoradi, S.H.; Ehrlich, M. Effects of Facing, Reinforcement Stiffness, Toe Resistance, and Height on Reinforced Walls. Geotext. Geomembr. 2017, 45, 67–76. [Google Scholar] [CrossRef]
- Bathurst, R.J.; Nernheim, A.; Walters, D.L.; Allen, T.M.; Burgess, P.; Saunders, D.D. Influence of Reinforcement Stiffness and Compaction on the Performance of Four Geosynthetic-Reinforced Soil Walls. Geosynth. Int. 2009, 16, 43–59. [Google Scholar] [CrossRef]
- Hatami, K.; Bathurst, R.J.; Di Pietro, P. Static Response of Reinforced Soil Retaining Walls with Nonuniform Reinforcement. Int. J. Geomech. 2001, 1, 477–506. [Google Scholar] [CrossRef]
- Rowe, R.K.; Ho, S.K. Continuous Panel Reinforced Soil Walls on Rigid Foundations. J. Geotech. Geoenviron. Eng. 1997, 123, 912–920. [Google Scholar] [CrossRef]
- Ho, S.K.; Rowe, R.K. Effect of Wall Geometry on the Behaviour of Reinforced Soil Walls. Geotext. Geomembr. 1996, 14, 521–541. [Google Scholar] [CrossRef]
- Kakrasul, J.I.; Han, J.; Rahmaninezhad, S.M. Load-Deformation Behavior of Geosynthetic-Reinforced Retaining Walls with Limited Fill Space Under Static Footing Loading. Transp. Infrastruct. Geotechnol. 2020, 7, 309–331. [Google Scholar] [CrossRef]
- Bathurst, R.J.; Hatami, K. Seismic Response Analysis of a Geosynthetic-Reinforced Soil Retaining Wall. Geosynth. Int. 1998, 5, 127–166. [Google Scholar] [CrossRef]
- Palmeira, E.M.; Lanz, D. Stresses and Deformations in Geotextile Reinforced Model Walls. Geotext. Geomembr. 1994, 13, 331–348. [Google Scholar] [CrossRef]
- ASTM D698; Standard Test Methods for Laboratory Compaction Characteristics of Soil Using Standard Effort (12,400 ft-lbf/ft3 (600 kN-m/m3)). ASTM International: West Conshohocken, PA, USA, 2012.
- ASTM D7181; Standard Test Method for Consolidated Drained Triaxial Compression Test for Soils. ASTM International: West Conshohocken, PA, USA, 2020.
- ASTM D6637-11; Standard Test Method for Determining Tensile Properties of Geogrids by the Single or Multi-Rib Tensile Method. ASTM International: West Conshohocken, PA, USA, 2011.
- ASTM D5262; Standard Test Method for Determining the Unconfined Tension Creep and Creep Rupture Behavior of Planar Geosynthetics Used for Reinforcement Purposes. ASTM International: West Conshohocken, PA, USA, 2021.
- Zornberg, J.G.; Arriaga, F. Strain Distribution within Geosynthetic-Reinforced Slopes. J. Geotech. Geoenviron. Eng. 2003, 129, 32–45. [Google Scholar] [CrossRef]
- Bathurst, R.J.; Miyata, Y.; Nernheim, A.; Allen, A.M. Refinement of K-Stiffness Method for Geosynthetic-Reinforced Soil Walls. Geosynth. Int. 2008, 15, 269–295. [Google Scholar] [CrossRef]
- Walters, D.L.; Allen, T.M.; Bathurst, R.J. Conversion of Geosynthetic Strain to Load Using Reinforcement Stiffness. Geosynth. Int. 2002, 9, 483–523. [Google Scholar] [CrossRef]
- Plácido, R.; Portelinha, F.H.M.; Futai, M.M. Field and Laboratory Time-Dependent Behaviors of Geotextiles in Reinforced Soil Walls. Geosynth. Int. 2018, 25, 215–229. [Google Scholar] [CrossRef]
- Allen, T.M.; Bathurst, R.J. Geosynthetic Reinforcement Stiffness Characterization for MSE Wall Design. Geosynth. Int. 2019, 26, 592–610. [Google Scholar] [CrossRef]


Disclaimer/Publisher’s Note: The statements, opinions and data contained in all publications are solely those of the individual author(s) and contributor(s) and not of MDPI and/or the editor(s). MDPI and/or the editor(s) disclaim responsibility for any injury to people or property resulting from any ideas, methods, instructions or products referred to in the content. |
© 2023 by the authors. Licensee MDPI, Basel, Switzerland. This article is an open access article distributed under the terms and conditions of the Creative Commons Attribution (CC BY) license (https://creativecommons.org/licenses/by/4.0/).