Abstract
Land use and land cover change are among the drivers of environmental change. The Suluh River Basin’s land use and land cover are modeled in this study using a land change modeler. To accomplish the goals of this study, Landsat images and ancillary data sources were utilized. In eCognition Developer 9.2 software, nearest neighbor fuzzy classification was used to classify Landsat images. With the IDRISI Selva 17.3 software, change detection and modeling were carried out. Both qualitative and quantitative analyses of the data were conducted. The results showed that, despite a drop in forest land of 97.2%, grazing land of 89.8%, plantation land of 89.1%, shrub-bush land of 1.5%, and water bodies of 84.8% from 1990 to 2002, bare land increased by 10.6%, built-up land by 29.4%, and cultivated land by 65.4%. The model projects, bare, built-up, and cultivated land will increase at the cost of water bodies, grazing, forest, shrub-bush, and plantation land between the years 2028 and 2048. Rainfall, slope, height, distance to rivers, distance to highways, distance from towns, and population density were the main determinants of LULC change in the study area. Therefore, in order to promote sustainable development, safeguard the river basin, and lessen the severity of the changes, appropriate management and timely action must be taken by policymakers and decision makers.
1. Introduction
Changes in land use and land cover (hereafter LULC) are a major global environmental problem [1,2,3]. In recent decades, rapid changes have been occurring as a result of many anthropogenic influences [4,5,6], the consequences of which have altered the interaction between the earth’s surfaces [7,8,9,10,11]. The study in [9] states that most of the changes are from vegetation cover to cultivated land. Differences have also been found in the magnitude and direction of LULC change worldwide. For instance, the study in [12] claims that the expansion of agriculture in Africa is a driving factor for LULC changes.
LULC change studies in Ethiopia show that most LULC changes are from natural forests to cultivated land [13,14,15,16,17,18,19,20] and are caused by anthropogenic factors [5,21,22,23,24,25]. Moreover, in a different part of Ethiopia, research was conducted on LULC modeling and predication by the authors in [26,27,28,29], who predicted that LULC will change from vegetation to cultivated land. In contrast, a few studies in a different part of Ethiopia indicated an improvement in vegetation cover [5,30,31] due to community afforestation and land rehabilitation activity. So, an empirical investigation of the issues of LULC at the local catchment level is needed.
Modeling of LULC change has grown rapidly to demonstrate the function of the LULC system [32]. Several studies, such as [33,34,35,36,37,38,39,40], have affirmed that, compared to other LULC modeling methods, the Land Change Model (hereafter LCM), based on integrated multilayer perceptron (hereafter MLP) with Markov chain (hereafter MC), is a strong model for the analysis and prediction of LULC change and provides valid results.
In the Suluh River Basin (hereafter SRB), population growth and a lack of alternative livelihood strategies have led to environmental degradation [41,42,43,44]. Due to the lack of available land, farmers have no choice but to: (1) acquire more land by expanding into steep and marginal areas in order to make up for the low yields from their current holdings; (2) change the type of crops grown on their former cropland or convert it to eucalyptus plantations; and (3) allow constant farming, excessive grazing, and the use of agricultural inputs. The studies in [41,42,43,44] conducted an analysis on LULC change in the Tekeze River Basin with different Spatio-temporal coverage and methodologies. However, there was no mention of modeling LULC change using LCM in the SRB. In this study, we use LCM to model and forecast LULC change in the SRB. We anticipate that the findings of this study will assist stakeholders and policymakers in land management and land use planning.
2. Materials and Methods
2.1. The Study Area: Suluh River Basin
The SRB is found in the northeastern part of Tigray, northern Ethiopia. The geographic location of the SRB extends from 39°24′59.06″ E to 39°26′22.73″ E latitude and 13°38′18.27″ N to 14°13′53.29″ N longitude (Figure 1). The total area covered by the SRB is about 930 km2 and its elevation varies from 1700 to 3298 m above sea level. The study watershed falls in four districts (Saesie Tsaeda Emba, Hawuzen, Kiltie Awlealo, and Degua Tembien) of the eastern and south-eastern zones of Tigray.
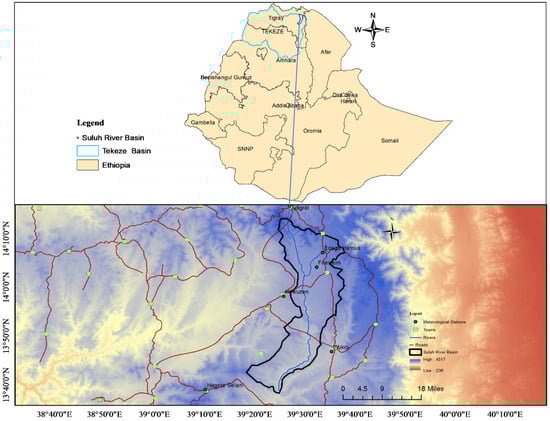
Figure 1.
Location map of the study area, Suluh River Basin in Tigray, northern Ethiopia.
The SRB is categorized as having a semi-arid climate. The warmest months are May and June, and the coldest months are December and January. The total annual rainfall and average temperature between 1988 and 2018 were about 420.4 mm and 17.5 °C, respectively (Figure 2). The rainfall season is between June and early September, and the rain is distributed mono-modally. Regarding the hydro-logical conditions, the drainage pattern of the SRB is dendrite [44]. Regarding the geology of the basin, trap basalt accounts for 2.8%, granite and shale account for 1.8%, metamorphic rock accounts for 28.9%, limestone accounts for 13.9%, and sandstone accounts for 52.7% [44]. The major soil types of the SRB area are haplic lixisols, which cover 41.4%, lithic leptosols, which cover 22.7%, Eutric leptosols, which cover 17.8%, Chromic Cambisols, which cover 15.6%, and Vertic Cambisols, which cover 2.5%. Regarding the major soil textures of the study area, sandy clay loam accounts for 41.4%, sandy loam accounts for 40.5%, and clay accounts for 18.2% [44].
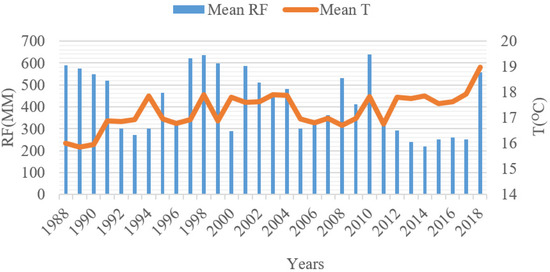
Figure 2.
Mean annual rainfall (RF) and Mean Temperature (T) of the Suluh River Basin for the period 1988–2018 (sources station data).
According to the Ethiopian population census of 2007, the population density of the SRB was 142 persons/km2 [45]. The main crops are cultivated in the highlands (barley, wheat, maize, teff, and pulses) and lowlands (Sorghum). Cultivation is carried out using the traditional ox-drawn plow. This area suffers from a livestock (cattle, sheep, goats, donkeys, and chickens) feed crisis, resulting from crop residue and vegetation biomass reduction [41,42,43]. Most of the areas are highly cultivated, which leads to overgrazing and deforestation. Building stone terraces, micro dams, exclosures, and community woodlots, as well as enforcing rules and regulations for grazing lands and reducing burning activities, are some of the major methods of land management in the SRB [43,44,46].
2.2. Sources and Analyses of Data for LULC Change Detection and Prediction
Data pre-processing, data post-processing, and LULC change modeling were all carried out in accordance with the overall workflow shown in Figure 3. Free satellite photos from the National Aeronautics and Space Administration (Landsat-5 TM of 1990, Landsat-7 ETM+ of 2002, and Landsat-8 OLI-TIRS of 2018) were utilized for the LULC change analysis and modeling of the research region (Table 1).
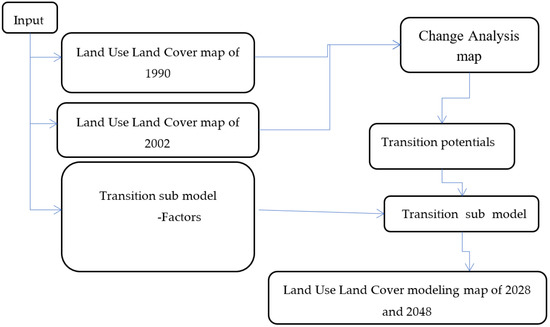
Figure 3.
Methodology Flow Chart for Land Change Modeler.

Table 1.
The characteristics of Landsat data.
The Landsat-7 ETM+ 2002 and Landsat-8 OLI–TIRS 2018, 30 m pixel, were resampled to a 15 m pixel size. The Digital Elevation Model (30 m) based on Aster imagery and ancillary data (topographic maps, field thematic layers (roads and towns), and village and district boundaries) were also utilized during the analysis. These datasets were acquired from the National Aeronautics and Space Administration (NASA) through their EOS Data Gateway Database. All data were projected using the Universal Transverse Mercator projection system, zone 37° N, and datum of the World Geodetic System 84 (WGS84). Intensive pre- and post-processing of images was also carried out in ERDAS imagine 2015 software.
In eCognition Developer 9.2, we used the nearest neighbor fuzzy (Equation (1)) classification. It is used in eCognition automatically by generating multidimensional membership functions [47,48,49,50,51,52,53,54]. Based on Table 2, we created eight LULC groups (cultivated, bar, built up, grazing, plantation, shrub-bush, water body, and forest land).
Table 2.
Land cover, Land use types and their descriptions.
Table 3.
Summary of error matrixes for the classified images of 1990 and 2002.
Xii = is the number of observations in rows i and column i (along the major diagonal), Xi+ = the marginal total of row i (right of the matrix), Xi + 1 are the marginal totals of column i (bottom of the matrix), and N is the total number of observations. K = kappa coefficient
LULC Modeling Using LCM
The LCM model predicts LULC changes from the thematic raster images with the same number of classes in the same sequential order [35,36,37,59,60,61,62,63,64,65,66]. The LCM is used to predict future LULC changes in the SRB for the next 30 years by following four steps.
The first is change analysis, hence the changes between two different periods (time 1 (1990) time 2 (2002)). LULC maps were calculated using the formula in [67] (Equation (4)):
where C = is the annual change rate of a given LULC type, f and are the final and initial area coverage of LULC type during the specific period, and T = year difference between the initial and final period.
The gain and loss (Equation (5)) were also calculated using LCM in IDIRISI selva 17.3 software.
where Is the percentage taken by j in LUCC in total ‘conversion loss’ of category row i Is the percentage taken by j in LULC change in total ‘conversion gain’ of category row i, pi,j and pj,i.
Modeling transition potential and determining driving forces is the second phase [68,69]. The characteristics found were to be biophysical (rainfall, slope, and elevation), socioeconomic (distance to rivers, distance to highways, distance to towns), and demographic (population density). Cramer’s V coefficient was utilized for model variable testing, selection, and transition. The transition sub-model was then updated to include all the variables. MLP neural networks were utilized to run the model and organize the transition sub-model. The training set and the testing set each received a random group of transition pixels that would appear between 1990 and 2002. The variables were derived via geographical and geo-statistical elaborations of a geographic information system and were formalized as follows (Equation (6))
Every variable associated with a neuron in the input layer was normalized using (Equation (7)):
In the hidden layer, the signal that is received by neuron j in the hidden layer for pixel k was calculated as follows (Equation (8)):
where netj(k,t) is the signal that is received by neuron j, and wi,j is the weight between the input layer I and the hidden layer j. The output layer has two neurons that correspond to two possible significant states (1 = transition, 2 = permanence of the pixel); neuron l generates a value that indicates the transition probability. Transition probabilities can be calculated using a sigmoidal function using Equation (9). (A sigmoidal function is used to represent the non-linearity of each node):
The third and fourth steps are change prediction and future scenarios. Change prediction is executed based on MC, using the historical rate of change and the transition potential maps [70]. MC analyses were run for this study to determine the amount of change using two LULC maps (1990 and 2002) along with the date specified (2018, 2028 and 2048). The steps determine how much land was expected to transition from the later date (2002) to the prediction date (2028 and 2048). An MC (Equation (10)) comprises s, a vector of the distribution of LULC classes at time t, and A(ፐ), a matrix of transition probabilities from land use u to land use u’ in a given time interval (ፐ)
Validating the model is the fifth stage. A comparison of the simulated and actual LULC maps from 2018 was made in this study as part of the validation process. While quantitative data were collected and analyzed using descriptive statistics, the qualitative material collected through direct observation, focus group discussions, and interviews was analyzed and interpreted using qualitative approaches (such as a percentage).
3. Results
3.1. LULC Change Analysis from 1990 to 2002
According to Table 4, the LULC change trend showed that from 1990 to 2002, the LULC in FL, GL, PL, SBL, and WB decreased by 97.2%, 89.8%, 89.1%, 1.5%, and 84.8%, respectively. However, the BL, BUL, and CL all increased by 10.6%, 29.4%, and 65.4%, respectively. Elder priest interviewees agreed that there was more vegetation cover in church woodlands in 1990 than there was in 2002. The panelists from the focus group agreed that there had been significant land fragmentations as a result of repeated land redistribution. The district office of agriculture and rural development was contacted for an interview; they stated that LULC change has been hampered due to the population density in the river basin.
Table 4.
LULC Change trends in from 1990 to 2048.
The gains and losses of key LULC alterations are depicted in Figure 4A. They include (1) an expansion of CL, (2) an increase in BL, and (3) an increase in BUL, as well as a drop in SBL, GL, PL, and WB. During 1990–2002, gain and loss in CL were 359.94 km2 and 33.03 km2, with a net gain of 326.91 km2. SBL lost 243.67 km2 and gained 5.33 km2, with a net loss of −238.34 km2. PL lost 1.96 km2 and gained 52 km2 with a net loss of 50.04 km2.
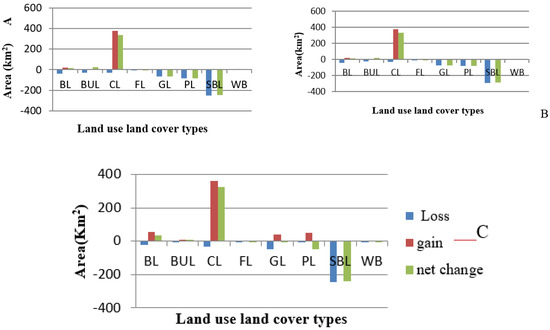
Figure 4.
The gains and losses of LULC types of SRB in 1990 (A), 2002 (B), and 2018 (C).
3.2. Transition Potential Modeling, Determining Driving Variables, LULC Transition Analysis and Validations
Population density (0.345), slope (0.25), elevation (0.18), rainfall (0.22), and the distance from the river (0.31), towns (0.27), and roads (0.17) were all found to have a substantial influence on LULC change in the research area using Cramer’s V values as given in Table 5. Kappa variations that compared the projected LULC map with the actual LULC map of the year 2018 resulted in a Kappa value = 0.97, Kno = 0.97, Kappa location = 0.99, and k standard = 0.96. As indicated in Figure 5 and Table 6, both kappa results confirm that the model is reliable for the SRB. Using a multilayer perceptron with an accuracy of over 70%, transitions were represented in a single transition sub-model once the predictor variables were chosen. The research area’s water body, forest, grazing, and shrub-bush land were found to have significantly decreased as a result of the significant increase in CL, BL, and BU, according to the transition probability matrix, which compares probabilities between two different times (Table 7, Table 8 and Table 9).
Table 5.
Cramer’s V values of explanatory variables.
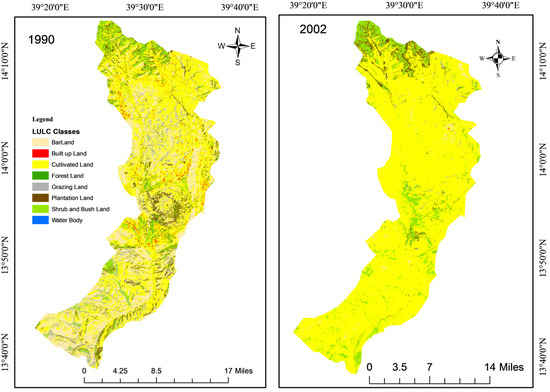
Figure 5.
Land use/cover map of study area for 1990 and 2002.
Table 6.
Area statistics of actual and predicted land use/land cover map of 2018.
Table 7.
Transition probability matrix of land use/land cover classes for the year 2018.
Table 8.
Transition probability matrix of land use/land covers classes for the year 2028.
Table 9.
Transition probability matrix of land use/land covers classes for the year 2028.
3.3. Future Scenario/Simulation
Based on real LULC maps, the model predicted LULC change for the years 2028 and 2048 (Figure 6). The Markov model also provides the transition probability matrix for the years 2028 and 2048 (Table 4). From the year 2018 to 2028, the trend of LULC change in the study area will show a decrease in FL, GL, SBL, and WB by 2%, 2%, 0.6%,3%, respectively (Table 4 and Figure 7), whereas BL, BUL, CL and PL areas will be increased by 0.6%, 1%, 0.6%,0.6%, respectively. As indicated in Figure 4B, during 2018–2028, gain and loss in CL were 374.31 km2 and 31.38 km2, with a net gain of 335.13 km2. SBL lost 289.29 km2 and gained 5.87 km2, with a net loss of −283.22 km2. PL lost 80.09 km2 and gained 3.02 km2, with a net loss of 77.07 km2.
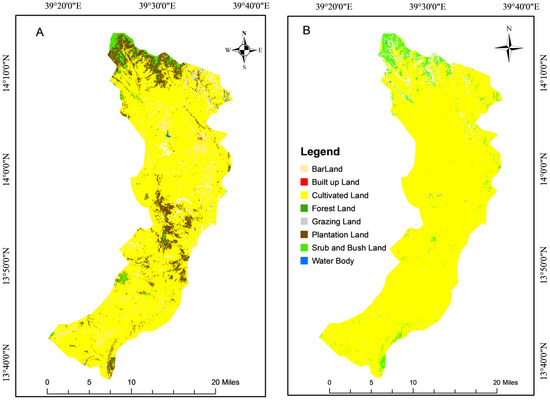
Figure 6.
The simulated (A) and the actual (B) land use/land cover of the SRB in 2018.
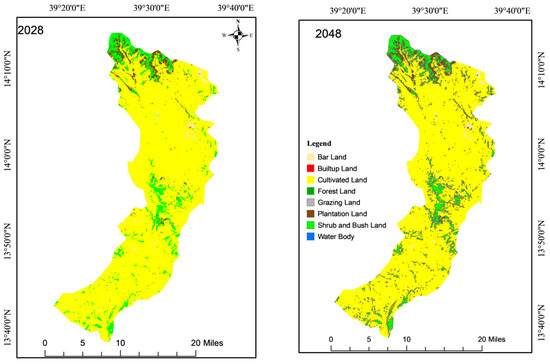
Figure 7.
The 2028 and 2048 land use/land cover of the SRB.
Table 4 shows that the LULC trends for bar land, built-up land, plantation land, and cultivated land will increase from 2018 to 2048 by 2.2%, 5.7%, 5%, and 5.7%, respectively. On the other hand, between 2018 and 2048, the FL, GL, SBL, and WB areas will grow by 2%, 7.7%, 9%, and 0.3%, respectively. According to Figure 4C, between 2018 and 2048, CL will acquire and lose 378.14 km2 and 31.7 km2, respectively, with a net gain of 338.56 km2. With a gain of 5.03 km2 and a loss of 249.84 km2, SBL will exhibit a net loss of −244.6 km2. PL lost 82.5 km2 overall, gaining 3.23 km2, and losing 85.73 km2. However, there was a net gain of 16.2 km2 in built-up land.
4. Discussion
The study’s results showed an increase in BUL, CL, and BL from 1990 to 2002, which will persist until 2048. The sharp decline in WB, FL, GL, PL, and SBL that was seen between 1990 and 2002 will last until 2048.The study’s findings are consistent with those of earlier research projects carried out in Ethiopia by the authors in [71] in the Birr and Upper Didesa watersheds of the Blue Nile basin, as well as those described in [72] for the Dera area in northwest Ethiopia. The findings of the study show that BUL, CL, and BL increase, which is consistent with other research findings in Africa [73] and Ethiopia [14,29], as well as studies in some parts of Europe, such as in Slovakia [74], Portugal Poland, and Czechia. Contrasting findings were indicated by [5,30,31,75], which confirmed increasing vegetation cover due to integrated watershed management in the Tekeze basin [76,77,78].
Different kinds of LULC change drivers have been discovered in various regions of Ethiopia. For instance, the studies in [5,16] indicated human drivers, the one in [14] identified population growth; the research in [78] showed land degradation, poverty, and food insecurity; the authors in [29] identified population, slope, livestock, and distances from various infrastructures; and the study in [29] also identified population pressure, income growth, and declining productivity. Ref. [79] found that slope, distance from the stream, distance from urban areas, and distance from roads also play an important role in land use change, as each provides residents with convent access to resources. In our study, the factors that affected LULC in the SRB included rainfall, slope, elevation, distance to rivers, distance to highways, distance to towns, and population density. Consideration of the drivers of LULC changes at the watershed level is of paramount importance for sustainably managing the environment in that watershed.
This study used LCM in the SRB to accomplish LULC modeling. This model is effective because it can simulate various types of land cover with adequate calibration and dynamic projection skills [80,81]. Various studies have also demonstrated that LCM is effective at predicting LULC change [82,83,84,85,86,87]. Therefore, the findings would be useful as inputs for planners and other stakeholders regarding LULC trends in the study area.
5. Conclusions and Recommendations
The current study was carried out to model and predict land use/land cover changes from 1990 to 2048 using LCM in the SRB, Ethiopia. Bar land, built-up land, and cultivated land will increase at the expense of water bodies, forests, shrub-bush, and plantation land in the years 2028 and 2048. Rainfall, slope, elevation, distance to rivers, distance to roads, distance towns, and population density were identified as the prominent LULC change drivers in the study area. This will increase the vulnerability of the watershed to soil erosion and soil macrofauna loss in the studied river basin in particular and the Tekeze basin in general. Therefore, suitable and timely management measures must be taken by policymakers and decision-makers to enable sustainable development and protect the river basin to reduce the severity of the changes.
Author Contributions
H.H.E. participated in proposing the study, managed all data collection, conducted all data analyses performed statistical analyses and interpretation results, and drafted the manuscript. A.S.M. as supervisors participated in guiding and reviewing the manuscript. E.B. was supervisor and participated in designing the field study and reviewed the manuscript. All authors have read and agreed to the published version of the manuscript.
Funding
This research was funded by Debre Tabor University, Ethiopia and Bahir Dar University, Ethiopia.
Institutional Review Board Statement
Not applicable.
Informed Consent Statement
Not applicable.
Data Availability Statement
Not applicable.
Acknowledgments
The authors would like to thank Bahir Dar University and Debre Tabor University in Ethiopia for their financial support. The authors greatly acknowledge farmers and the agricultural development agents of the Watershed for their interest to focus group discussions and for providing necessary information.
Conflicts of Interest
The authors declare no conflict of interest.
References
- Shafizadeh Moghadam, H.; Helbich, M. Spatiotemporal urbanization processes in the megacity of Mumbai, India: A Markov chains-cellular automata urban growth model. Appl. Geogr. 2013, 40, 140–149. [Google Scholar] [CrossRef]
- Meyfroidt, P.; Lambin, E.F.; Erb, K.-H.; Hertel, T.W. Globalization of land use: Distant drivers of land change and geographic displacement of land use. Curr. Opin. Environ. Sustain. 2013, 5, 438–444. [Google Scholar] [CrossRef]
- Wnęk, A.; Kudas, D.; Stych, P. National Level Land-Use Changes in Functional Urban Areas in Poland, Slovakia, and Czechia. Land 2021, 10, 39. [Google Scholar] [CrossRef]
- Houghton, R.A. The Worldwide Extent of Land-Use Change. Bioscience 1994, 44, 305–313. [Google Scholar] [CrossRef]
- Bewket, W. Land covers dynamics since the 1950s in Chemoga watershed, Blue Nile basin, Ethiopia. Mt. Res. Dev. 2002, 22, 263–269. [Google Scholar] [CrossRef]
- Bewket, W.; Abebe, S. Land-use and land-cover change and its environmental implications in a tropical highland watershed, Ethiopia. Int. J. Environ. Stud. 2013, 70, 126–139. [Google Scholar] [CrossRef]
- Fu, X.; Wang, X.; Yang, Y.J. Deriving suitability factors for CA-Markov land use simulation model based on local historical data. J. Environ. Manag. 2018, 206, 10–19. [Google Scholar] [CrossRef] [PubMed]
- Lambin, E.F.; Geist, H.J.; Lepers, E.; Meyer, W.B.; Turner, I.B.L.; Meyfroidt, P.; Alix-Garcia, J.; Wolff, H.; Bentley, J.W.; Innes, R.; et al. Dynamics of Land-Use and Land-Cover Change in Tropical Regions. Annu. Rev. Environ. Resour. 2003, 28, 205–241. [Google Scholar] [CrossRef]
- Kabat, P.; Claussen, M.; Dirmeyer, P.A.; Gash, J.H.; de Guenni, L.B.; Meybeck, M.; Hutjes, R.W.; Pielke, R.A., Sr.; Vorosmarty, C.J.; Lütkemeier, S. (Eds.) Vegetation, Water, Humans and the Climate: A New Perspective on an Internactive System; Springer Science & Business Media: Berlin/Heidelberg, Germany, 2004. [Google Scholar]
- Mahmood, R.; Pielke, R.A.; Hubbard, K.G.; Niyogi, D.; Bonan, G.; Lawrence, P.; McNider, R.; McAlpine, C.; Etter, A.; Gameda, S.; et al. Impacts of land use/land cover change on climate and future research priorities. Bull. Am. Meteorol. Soc. 2010, 91, 37–46. [Google Scholar] [CrossRef]
- Prasad, P.R.C.; Rajan, K.S.; Dutt, C.B.S.; Roy, P.S. A conceptual framework to analyse the land-use/land-cover changes and its impact on phytodiversity: A case study of North Andaman Islands, India. Biodivers. Conserv. 2010, 19, 3073–3087. [Google Scholar] [CrossRef]
- Wood, E.; Tappan, G.; Hadj, A. Understanding the drivers of agricultural land use change in south-central Senegal. J. Arid. Environ. 2004, 59, 565–582. [Google Scholar] [CrossRef]
- Rientjes, T.H.M.; Haile, A.T.; Kebede, E.; Mannaerts, C.M.M.; Habib, E.; Steenhuis, T.S. Changes in land cover, rainfall and stream flow in Upper Gilgel Abbay catchment, Blue Nile basin—Ethiopia. Hydrol. Earth Syst. Sci. 2011, 15, 1979–1989. [Google Scholar] [CrossRef]
- Tekle, K.; Hedlund, L. Land Cover Changes Between 1958 and 1986 in Kalu District, Southern Wello, Ethiopia. Mt. Res. Dev. 2000, 20, 42–51. [Google Scholar] [CrossRef]
- Tsegaye, D.; Moe, S.R.; Vedeld, P.; Aynekulu, E. Land-use/cover dynamics in Northern Afar rangelands, Ethiopia. Agric. Ecosyst. Environ. 2010, 139, 174–180. [Google Scholar] [CrossRef]
- Zeleke, G.; Hurni, H. Implications of Land Use and Land Cover Dynamics for Mountain Resource Degradation in the Northwestern Ethiopian Highlands. Mt. Res. Dev. 2001, 21, 184–191. [Google Scholar] [CrossRef]
- Tegene, B. Land-Cover/Land-Use Changes in the Derekolli Catchment of the South Welo Zone of Amhara Region, Ethiopia. East. Afr. Soc. Sci. Res. Rev. 2002, 18, 1–20. [Google Scholar] [CrossRef]
- Dessie, G.; Kleman, J. Pattern and Magnitude of Deforestation in the South Central Rift Valley Region of Ethiopia. Mt. Res. Dev. 2007, 27, 162–168. [Google Scholar] [CrossRef]
- Gidey, E.; Dikinya, O.; Sebego, R.; Segosebe, E.; Zenebe, A. Modeling the Spatio-temporal dynamics and evolution of land use and land cover (1984–2015) using remote sensing and GIS in Raya, Northern Ethiopia. Model. Earth Syst. Environ. 2017, 3, 1285–1301. [Google Scholar]
- Minale, A.S.; Gelaye, S. Vegetation vulnerability analysis by using GIS and remote sensing techniques: A case study of Sensawuha Watershed, Ethiopia. Geojournal 2019, 86, 475–488. [Google Scholar] [CrossRef]
- Gebreslassie, H. Land use-land cover dynamics of Huluka watershed, Central Rift Valley, Ethiopia. Int. Soil Water Conserv. Res. 2014, 2, 25–33. [Google Scholar] [CrossRef]
- Hamza, I.; Iyela, A. Land Use Pattern, Climate Change, and Its Implication for Food Security in Ethiopia: A Review. Ethiop. J. Environ. Stud. Manag. 2012, 5, 26–31. [Google Scholar] [CrossRef]
- Chiemela, S.N.; Noulekoun, F.; Zenebe, A.; Abadi, N.; Birhane, E. Transformation of degraded farmlands to agroforestry in Zongi Village, Ethiopia. Agrofor. Syst. 2017, 92, 1317–1328. [Google Scholar] [CrossRef]
- Hailemariam, S.N.; Soromessa, T.; Teketay, D. Land Use and Land Cover Change in the Bale Mountain Eco-Region of Ethiopia during 1985 to 2015. Land 2016, 5, 41. [Google Scholar] [CrossRef]
- Sewnet, A. Land Use/Cover Change at Infraz Watershed, Northwestren Ethiopia. J. Landsc. Ecol. 2015, 8, 69–83. [Google Scholar] [CrossRef]
- Demessie, E.T. Soil Hydrological Impacts and Climatic Controls of Land Use and Land Cover Changes in the Upper Blue Nile (Abay) Basin; CRC Press: Boca Raton, FL, USA, 2015. [Google Scholar]
- Yalew, S.G.; Mul, M.L.; Van Griensven, A.; Teferi, E.; Priess, J.; Schweitzer, C.; Van Der Zaag, P. Land-Use Change Modelling in the Upper Blue Nile Basin. Environments 2016, 3, 21. [Google Scholar] [CrossRef]
- Han, R. Land Use and Land Cover Mapping Using Fuzzy Logic. In Ecosystem Assessment and Fuzzy Systems Management; Springer: Cham, Switzerland, 2014; pp. 129–146. [Google Scholar]
- Gashaw, T.; Tulu, T.; Argaw, M. Erosion risk assessment for prioritization of conservation measures in Geleda watershed, Blue Nile basin, Ethiopia. Environ. Syst. Res. 2017, 6, 1. [Google Scholar] [CrossRef]
- Bantider, A.; Hurni, H.; Zeleke, G. Responses of rural households to the impacts of population and land-use changes along the Eastern Escarpment of Wello, Ethiopia. Nor. Geogr. Tidsskr.-Nor. J. Geogr. 2011, 65, 42–53. [Google Scholar] [CrossRef]
- Munro, R.N.; Deckers, J.; Haile, M.; Grove, A.; Poesen, J.; Nyssen, J. Soil landscapes, land cover change and erosion features of the Central Plateau region of Tigrai, Ethiopia: Photo-monitoring with an interval of 30 years. Catena 2008, 75, 55–64. [Google Scholar] [CrossRef]
- Nourqolipour, R.; Shariff, A.R.B.M.; Balasundram, S.K.; Ahmad, N.B.; Sood, A.M.; Buyong, T.; Amiri, F. A GIS-based model to analyze the spatial and temporal development of oil palm land use in Kuala Langat district, Malaysia. Environ. Earth Sci. 2014, 73, 1687–1700. [Google Scholar] [CrossRef]
- Wang, J.; Maduako, I.N. Spatio-temporal urban growth dynamics of Lagos Metropolitan Region of Nigeria based on Hybrid methods for LULC modeling and prediction. Eur. J. Remote Sens. 2018, 51, 251–265. [Google Scholar] [CrossRef]
- Kumar, K.S.; Bhaskar, P.U.; Padmakumari, K. Application of land change modeler for prediction of future land use land cover: A case study of Vijayawada City. Int. J. Adv. Technol. Eng. Sci. 2015, 3, 773–783. [Google Scholar]
- Megahed, Y.; Cabral, P.; Silva, J.; Caetano, M. Land Cover Mapping Analysis and Urban Growth Modelling Using Remote Sensing Techniques in Greater Cairo Region—Egypt. ISPRS Int. J. Geo-Inf. 2015, 4, 1750–1769. [Google Scholar] [CrossRef]
- Mas, J.-F.; Pérez-Vega, A.; Clarke, K.C. Assessing simulated land use/cover maps using similarity and fragmentation indices. Ecol. Complex. 2012, 11, 38–45. [Google Scholar] [CrossRef]
- Mishra, V.N.; Rai, P.; Mohan, K. Prediction of land use changes based on land change modeler (LCM) using remote sensing: A case study of Muzaffarpur (Bihar), India. J. Geogr. Inst. Jovan Cvijic SASA 2014, 64, 111–127. [Google Scholar] [CrossRef]
- Hasan, S.; Shi, W.; Zhu, X.; Abbas, S.; Khan, H.U.A. Future Simulation of Land Use Changes in Rapidly Urbanizing South China Based on Land Change Modeler and Remote Sensing Data. Sustainability 2020, 12, 4350. [Google Scholar] [CrossRef]
- Kamusoko, C.; Aniya, M.; Adi, B.; Manjoro, M. Rural sustainability under threat in Zimbabwe—Simulationof future land use/cover changes in the Bindura district based on the Markov-cellularautomatamodel. Appl. Geogr. 2009, 29, 435–447. [Google Scholar] [CrossRef]
- Ozturk, D. Urban Growth Simulation of Atakum (Samsun, Turkey) Using Cellular Automata-Markov Chain and Multi-Layer Perceptron-Markov Chain Models. Remote Sens. 2015, 7, 5918–5950. [Google Scholar] [CrossRef]
- Alemayehu, F.; Taha, N.; Nyssen, J.; Girma, A.; Zenebe, A.; Behailu, M.; Deckers, S.; Poesen, J. The impacts of watershed management on land use and land cover dynamics in Eastern Tigray (Ethiopia). Resour. Conserv. Recycl. 2009, 53, 192–198. [Google Scholar] [CrossRef]
- Aredehey, G.; Mezgebu, A.; Girma, A. Land-use land-cover classification analysis of Giba catchment using hyper temporal MODIS NDVI satellite images. Int. J. Remote Sens. 2018, 39, 810–821. [Google Scholar] [CrossRef]
- Hishe, S.; Bewket, W.; Nyssen, J.; Lyimo, J. Analysing past land use land cover change and CA-Markov-based future modelling in the Middle Suluh Valley, Northern Ethiopia. Geocarto Int. 2020, 35, 225–255. [Google Scholar] [CrossRef]
- Zenebe, A.; Vanmaercke, M.; Guyassa, E.; Verstraeten, G.; Poesen, J.; Nyssen, J. The Giba, Tanqwa and Tsaliet Rivers in the Headwaters of the Tekezze Basin. In Geo-Trekking in Ethiopia’s Tropical Mountains; Springer: Cham, Switzerland, 2019; pp. 215–230. [Google Scholar] [CrossRef]
- Population Census Commission; Summary and Statistical Report of the 2007 Population and Housing Census Results. Available online: http//www.csa.gov.et (accessed on 26 March 2022).
- Sembroni, A.; Molin, P.; Dramis, F.; Abebe, B. Geology of the Tekeze River basin (Northern Ethiopia). J. Maps 2017, 13, 621–631. [Google Scholar] [CrossRef]
- Foody, G.M. Status of land cover classification accuracy assessment. Remote Sens. Environ. 2002, 80, 185–201. [Google Scholar] [CrossRef]
- Groenemans, R.; Van Ranst, E.; Kerre, E. Fuzzy relational calculus in land evaluation. Geoderma 1997, 77, 283–298. [Google Scholar] [CrossRef]
- Kalantar, B.; Mansor, S.B.; Sameen, M.I.; Pradhan, B.; Shafri, H.Z.M. Drone-based land-cover mapping using a fuzzy unordered rule induction algorithm integrated into object-based image analysis. Int. J. Remote Sens. 2017, 38, 2535–2556. [Google Scholar] [CrossRef]
- Kumar, P.; Ravindranath, S.; Raj, K.G. Object oriented classification and feature extraction for parts of east delhi using hybrid approach. ISPRS-Int. Arch. Photogramm. Remote Sens. Spat. Inf. Sci. 2018, XLII-5, 749–754. [Google Scholar] [CrossRef]
- Salman, A.A.; Ali, A.E.; Mattar, H.E. Mapping land-use/land-cover of Khartoum using fuzzy classification. Emir. J. Eng. Res. 2008, 13, 43. [Google Scholar]
- Zhang, J.; Foody, G.M. A fuzzy classification of sub-urban land cover from remotely sensed imagery. Int. J. Remote Sens. 1998, 19, 2721–2738. [Google Scholar] [CrossRef]
- Zhou, W.; Troy, A.; Grove, M. Object-based Land Cover Classification and Change Analysis in the Baltimore Metropolitan Area Using Multitemporal High Resolution Remote Sensing Data. Sensors 2008, 8, 1613–1636. [Google Scholar] [CrossRef]
- Yan, G.; Mas, J.F.; Maathuis BH, P.; Xiangmin, Z.; Van Dijk, P.M. Comparison of pixel-based and object-oriented image classification approaches—A case study in a coal fire area, Wuda, Inner Mongolia, China. Int. J. Remote Sens. 2006, 27, 4039–4055. [Google Scholar] [CrossRef]
- Fleiss, J.L.; Levin, B.; Paik, M.C. Statistical Methods for Rates and Proportions; John Wiley & Sons, Inc.: Hoboken, NJ, USA, 2003. [Google Scholar]
- Foody, G.M. Harshness in image classification accuracy assessment. Int. J. Remote Sens. 2008, 29, 3137–3158. [Google Scholar] [CrossRef]
- Doxani, G.; Siachalou, S.; Tsakiri-Strati, M. An object-oriented approach to urban land cover change detection. Int. Arch. Photogramm. Remote Sens. Spat. Inf. Sci. 2008, 37, 1655–1660. [Google Scholar]
- Congalton, R.G.; Green, K. Assessing the Accuracy of Remotely Sensed Data: Principles and Practices; CRC Press: Boca Raton, FL, USA, 2019. [Google Scholar]
- Kumar, K.S.; Bhaskar, P.U.; Kumari, K.P. A novel approach for prediction of future environmental impacts of urban growth. Int. J. Civ. Eng. Technol. 2018, 9, 1208–1219. [Google Scholar]
- Mas, J.-F.; Kolb, M.; Paegelow, M.; Olmedo, M.T.C.; Houet, T. Inductive pattern-based land use/cover change models: A comparison of four software packages. Environ. Model. Softw. 2014, 51, 94–111. [Google Scholar] [CrossRef]
- Naghibi, F.; Delavar, M.R.; Pijanowski, B. Urban Growth Modeling Using Cellular Automata With Multitemporal Remote Sensing Images Calibrated By The Artificial Bee Colony Optimization Algorithm. Sensors 2016, 16, 2122. [Google Scholar] [CrossRef]
- Nguyen, T.A.; Le, P.M.T.; Pham, T.M.; Hoang, H.T.T.; Nguyen, M.Q.; Ta, H.Q.; Phung, H.T.M.; Le, H.T.T.; Hens, L. Toward a sustainable city of tomorrow: A hybrid Markov–Cellular Automata modeling for urban landscape evolution in the Hanoi city (Vietnam) during 1990–2030. Environ. Dev. Sustain. 2019, 21, 429–446. [Google Scholar] [CrossRef]
- Pérez-Vega, A.; Mas, J.F.; Ligmann-Zielinska, A. Comparing two approaches to land use/cover change modeling and their implications for the assessment of biodiversity loss in a deciduous tropical forest. Environ. Model. Softw. 2012, 29, 11–23. [Google Scholar]
- Ramachandra, T.V.; Bharath, H.A.; Vinay, S.; Joshi, N.V.; Kumar, U.; Rao, K.V. Modelling urban revolution in greater bangalore, India. In Proceedings of the 30th Annual In-House Symposium on Space Science and Technology, ISRO-IISc Space Technology Cell, Indian Institute of Science, Bangalore, India, 7–8 November 2013; pp. 7–8. [Google Scholar]
- Mishra, V.N.; Rai, P.K.; Prasad, R.; Punia, M.; Nistor, M.M. Prediction of spatio-temporal land use/land cover dynamics in rapidly developing Varanasi district of Uttar Pradesh, India, using geospatial approach: A comparison of hybrid models. Appl. Geomatics 2018, 10, 257–276. [Google Scholar] [CrossRef]
- Roy, H.G.; Fox, D.M.; Emsellem, K. Predicting Land Cover Change in a Mediterranean Catchment at Different Time Scales. In International Conference on Computational Science and Its Applications; Springer: Cham, Switzerland, 2014; pp. 315–330. [Google Scholar] [CrossRef]
- Dzieszko, P. Land-cover modelling using corine land cover data and multi-layer perceptron. Quaest. Geogr. 2014, 33, 5–22. [Google Scholar] [CrossRef]
- Gibson, L.; Münch, Z.; Palmer, A.; Mantel, S. Future land cover change scenarios in South African grasslands—Implications of altered biophysical drivers on land management. Heliyon 2018, 4, e00693. [Google Scholar] [CrossRef]
- Ansari, A.; Golabi, M.H. Prediction of spatial land use changes based on LCM in a GIS environment for Desert Wetlands—A case study: Meighan Wetland, Iran. Int. Soil Water Conserv. Res. 2018, 7, 64–70. [Google Scholar] [CrossRef]
- Pinto, N.; Cox, D.; Dicarlo, J.J. Why is Real-World Visual Object Recognition Hard? PLoS Comput. Biol. 2008, 4, e27. [Google Scholar] [CrossRef]
- Gibbs, H.K.; Ruesch, A.S.; Achard, F.; Clayton, M.K.; Holmgren, P.; Ramankutty, N.; Foley, J.A. Tropical forests were the primary sources of new agricultural land in the 1980s and 1990s. Proc. Natl. Acad. Sci. USA 2010, 107, 16732–16737. [Google Scholar] [CrossRef]
- Li, S.H.; Jin, B.X.; Wei, X.Y.; Jiang, Y.Y.; Wang, J.L. Using ca-markov model to model the spatiotemporal change of land use/cover in fuxian lake for decision support. ISPRS Ann. Photogramm. Remote Sens. Spat. Inf. Sci. 2015, 2, 163. [Google Scholar] [CrossRef]
- Wang, S.; Zheng, X.; Zang, X. Accuracy assessments of land use change simulation based on Markov-cellular automata model. Procedia Environ. Sci. 2012, 13, 1238–1245. [Google Scholar] [CrossRef]
- Gebrehiwot, S.G.; Bewket, W.; Gärdenäs, A.I.; Bishop, K. Forest cover change over four decades in the Blue Nile Basin, Ethiopia: Comparison of three watersheds. Reg. Environ. Chang. 2014, 14, 253–266. [Google Scholar] [CrossRef]
- Gashaw, T.; Bantider, A.; Mahari, A. Evaluations of Land Use/Land Cover Changes and Land Degradation in Dera District, Ethiopia: GIS and Remote Sensing Based Analysis. Int. J. Sci. Res. Environ. Sci. 2014, 2, 199–208. [Google Scholar] [CrossRef]
- Wubie, M.A.; Assen, M.; Nicolau, M.D. Patterns, causes and consequences of land use/cover dynamics in the Gumara watershed of lake Tana basin, Northwestern Ethiopia. Environ. Syst. Res. 2016, 5, 1. [Google Scholar] [CrossRef]
- Tarasovičová, Z.; Saksa, M.; Blažík, T.; Falťan, V. Changes in Agricultural Land Use in the Context of Ongoing Transformational Processes in Slovakia. Agriculture/Pol’nohospodárstvo 2013, 59, 49–64. [Google Scholar] [CrossRef]
- Gebrelibanos, T.; Assen, M. Land use/land cover dynamics and their driving forces in the Hirmi watershed and its adjacent agro-ecosystem, highlands of Northern Ethiopia. J. Land Use Sci. 2013, 10, 81–94. [Google Scholar] [CrossRef]
- Nega, E.; Heluf, G.; Degefe, T. Analysis of land use/land cover changes in western Ethiopian mixed crop-livestock systems: The case of Senbat watershed. J. Biodivers. Environ. Sci. (JBES) 2012, 2, 8–17. [Google Scholar]
- Nyssen, J.; Munro, N.; Haile, M.; Poesen, J.; Descheemaeker, K.; Haregeweyn, N.; Moeyersons, J.; Govers, G.; Deckers, J. Understanding the environmental changes in Tigray: A photographic record over 30 years. Tigray Livelihood Pap. 2007, 3, 82. [Google Scholar]
- Pender, J.; Gebremedhin, B.; Benin, S.; Ehui, S. Strategies for Sustainable Agricultural Development in the Ethiopian Highlands. Am. J. Agric. Econ. 2001, 83, 1231–1240. [Google Scholar] [CrossRef]
- Leta, M.K.; Demissie, T.A.; Tränckner, J. Modeling and Prediction of Land Use Land Cover Change Dynamics Based on Land Change Modeler (LCM) in Nashe Watershed, Upper Blue Nile Basin, Ethiopia. Sustainability 2021, 13, 3740. [Google Scholar] [CrossRef]
- Aburas, M.M.; Abdullah, S.H.; Ramli, M.F.; Ash’Aari, Z.H.; Ahamad, M.S.S. Simulating and monitoring future land-use trends using CA-Markov and LCM models. IOP Conf. Ser. Earth Environ. Sci. 2018, 169, 012050. [Google Scholar] [CrossRef]
- Brown, D.G.; Walker, R.; Manson, S.; Seto, K. Modeling Land Use and Land Cover Change. In Land Change Science: Observing, Monitoring and Understanding Trajectories of Change on the Earth’s Surface; Springer: Dordrecht, The Netherlands, 2004; pp. 395–409. ISBN 978-1-4020-2562-4. [Google Scholar]
- Ahmed, B.; Ahmed, R. Modeling Urban Land Cover Growth Dynamics Using Multi-Temporal Satellite Images: A Case Study of Dhaka, Bangladesh. ISPRS Int. J. Geo-Inf. 2012, 1, 3–31. [Google Scholar] [CrossRef]
- Al-Sharif, A.A.A.; Pradhan, B. Monitoring and predicting land use change in Tripoli Metropolitan City using an integrated Markov chain and cellular automata models in GIS. Arab. J. Geosci. 2013, 7, 4291–4301. [Google Scholar] [CrossRef]
- Goparaju, L.; Prasad, P.R.; Ahmad, F. Geospatial technology perspectives for mining vis-a-vis sustainable forest ecosystems. Present Environ. Sustain. Dev. 2017, 11, 219–238. [Google Scholar] [CrossRef]


Disclaimer/Publisher’s Note: The statements, opinions and data contained in all publications are solely those of the individual author(s) and contributor(s) and not of MDPI and/or the editor(s). MDPI and/or the editor(s) disclaim responsibility for any injury to people or property resulting from any ideas, methods, instructions or products referred to in the content. |
© 2023 by the authors. Licensee MDPI, Basel, Switzerland. This article is an open access article distributed under the terms and conditions of the Creative Commons Attribution (CC BY) license (https://creativecommons.org/licenses/by/4.0/).