Article

Experimental Study of MICP-Solidified Calcareous Sand Based on Ambient Temperature Variation in the South China Sea

1
School of Civil Engineering and Architecture, Hainan University, Haikou 570228, China
2
China Railway 20th Bureau Group First Engineering Co., Ltd., Suzhou 215151, China
*
Author to whom correspondence should be addressed.
Sustainability 2023, 15(10), 8245; https://doi.org/10.3390/su15108245
Submission received: 11 April 2023 / Revised: 10 May 2023 / Accepted: 17 May 2023 / Published: 18 May 2023

Abstract

:
With the continuous advancement of the construction of the Hainan Free Trade Port and Island Reef Project, deploying Microbial Induced Calcium Carbonate Precipitation (MICP technology) for related research on the temperature range in this area would be of great significance. MICP technology is an innovative and sustainable new soil reinforcement technology that uses the metabolic activity of specific bacteria to produce calcium carbonate precipitation (CaCO3) to connect loose soil. A few previous studies reporting on the applications of MICP technology in different temperature environments drew different conclusions. Therefore, this study involved MICP sand column reinforcement tests at ambient temperatures of 20 °C, room temperature, 30 °C, and 40 °C. The reinforcement effect was evaluated using indicators such as CaCO3 generation rate, Ca2+ conversion rate, bacterial adhesion rate, water absorption rate, and unconfined compressive strength, providing a reference basis for the future applications of MICP technology to island and reef engineering construction. The results showed that, with an increase of temperature from 20 °C to 40 °C, the CaCO3 production rate, Ca2+ conversion rate, and unconfined compressive strength showed a trend of first increasing and then decreasing; the UCS was 548 KPa at 20 °C and 2276.67 KPa at 30 °C; the water absorption rate at 20 °C was 25.32, which decreased continuously with increasing temperature, and reached 21.49 at 40 °C; and the bacterial adhesion rate also continued to rise in the range of 20 °C to 40 °C, from 10.91 to 28.44. The increase in temperature had an impact on the physiological state of bacterial cells. A scanning electron microscope test shows that CaCO3 crystal forms generated under different temperature environments were different, and the CaCO3 mineral deposits generated during MICP reinforcement at 30 °C were denser. Fewer gaps were present between adjacent sand particles, and the bond was tight, which served better as a bridge. The strength of the solidified sample was also higher. The annual average temperature of the South China Sea is about 30 °C. The findings of this experiment provide feasibility and sustainable development for MICP project reinforcement in the South China Sea.

1. Introduction

The promotion of the Hainan free trade port policy has attracted the attention of the state toward the construction and development of the South China Sea islands and reefs. Calcareous sand, which is widely distributed in the South China Sea, is mainly composed of coral debris, submarine limestone, and marine biological debris with a CaCO3 content of more than 50% [1,2]. Calcareous sand is not conducive to direct application in engineering because of the irregular shape, large porosity, low bearing capacity, and fragile engineering characteristics of the sand particles [3,4]. Common foundation-reinforcement methods, such as the replacement method, layered rolling method, pile foundation treatment method, and so forth, have defects such as high energy consumption, high cost, and unfriendliness to the environment. New reinforcement technologies are emerging, such as using microcapsules to repair concrete [5], using fiber Bragg grating (FBG) to intelligently 3D print clay [6], etc.
In recent years, microbial-induced calcium carbonate (CaCO3) precipitation (MICP) technology, as a new foundation treatment technology, has been widely used in sand reinforcement [7,8,9,10], rock crack repair [11,12,13,14], contaminated soil treatment [15,16,17,18], slope erosion resistance [19,20,21], and so on. It has the advantages of convenient construction, low cost, and environmental friendliness. In addition, the MICP reinforcement process will produce ammonia gas [22]. Studies have shown that the generation of gas can reduce soil saturation, change the deformation mechanism of shallow foundations, and reduce surface subsidence caused by soil liquefaction [23]. The main reinforcement mechanism of MICP is as follows. Sporosarcina pasteurii produces urease through its own metabolism and urease hydrolyzes the urea in the environment to produce ammonia gas and carbon dioxide. Ammonia gas is dissolved in water to produce ammonium ion and increases the pH of the solution, and the content of carbonate ion in the solution also increases. Carbonate ion combines with calcium ion in the environment to form carbonica crystals with cementation ability. The main chemical reactions involved are as follows [24,25,26]:
C O ( N H 2 ) 2 + 2 H 2 O H 2 C O 3 + 2 N H 3
H 2 C O 3 + 2 N H 3 2 N H 4 + + 2 O H
H 2 C O 3 H + + H C O 3
H C O 3 + 2 O H + H + C O 3 2 + 2 H 2 O
C O 3 2 + C a 2 + C a C O 3
Based on the temperature sensitivity of bacterial activity, Xiao et al. [27] proposed a single-phase MICP method for temperature control. The sample treated by this method had a high CaCO3 content and was roughly evenly distributed along the sample height, which greatly improved the strength of the sample and had obvious dilatancy. Zhao et al. [28] studied the amount of CaCO3 precipitation induced by MICP technology at two different stable temperatures (8, 15, and 25 °C and 10, 20, and 30 °C). When other conditions such as bacterial activity, concentration, and pH value were consistent, the amount of CaCO3 precipitation induced by microorganisms decreased with increasing temperature. Peng et al. [29] conducted an MICP aqueous solution test and a sand column test under three different temperature environments (10, 20, and 30 °C). The results showed that the bacterial activity decreased with an increase in temperature. The lower the ambient temperature, the higher the content of CaCO3 formed in the solidified sample, and the higher the compressive strength. The unconfined compressive strength of sand samples at 10 °C can reach 178.85–279.29 kPa, while the strength of sand samples at 20 °C is 84.26–185.77 kPa, and only 24.22–98.61 kPa at 30 °C.
Wang [30] used batch experiments and microfluidic chip experiments to examine the effects of temperature on bacterial density and activity and the MICP process at different temperatures (4–50 °C). The results showed that different types of CaCO3 precipitates with different sizes and quantities were produced due to temperature changes. Lv et al. [31] investigated the effect of temperature on CaCO3 precipitates. The results showed that the CaCO3 precipitates had strong environmental dependence, and the size of CaCO3 crystals increased with an increase in temperature. Deng et al. [32] explored the microbial remediation of fractured sandstone at different temperatures. The results showed that the remediation effect of Sporosarcina pasteurii significantly improved with an increase in temperature and had the best effect when the temperature reached 33 °C. The repair effect gradually weakened with increasing in temperature. Liyang [33] found that the better ambient temperature range for MICP reinforcement was 20–40 °C. The lower the temperature, the higher the strength of the sample, and the CaCO3 formation rate was about uniform. The higher the temperature, the lower the strength of the sample; however, more CaCO3 was generated.
Jin et al. [34] examined the factors affecting the cementation effect of MICP technology involving Sporosarcina pasteurii. The results showed that the cementation effect was the best when the curing temperature was 30 °C. However, Keykha et al. [35] conducted MICP-solidified sand column tests at temperatures of 30 °C, 40 °C, and 50 °C. The sand column solidified at 40 °C was found to have higher unconfined compressive strength. The results of the two studies were different. Hence, conducting MICP tests at different ambient temperatures was necessary.
China mainly carries out island and reef engineering construction in the South China Sea, and the temperature variation range in the South China Sea is between 20 °C and 40 °C [36,37], as shown in Figure 1. Therefore, exploring the use of MICP technology in this temperature range would be of great significance. One-dimensional sand column reinforcement tests were carried out at room temperature, 20 °C, 30 °C, and 40 °C to examine the influence of MICP technology on reinforcing calcareous sand in the South China Sea at varying temperatures. The sand column test examined the variations in CaCO3 formation rate, calcium ion utilization rate, Sporosarcina pasteurii adhesion rate, sand water absorption rate, and unconfined compressive strength with temperature.

2. Materials and Methods
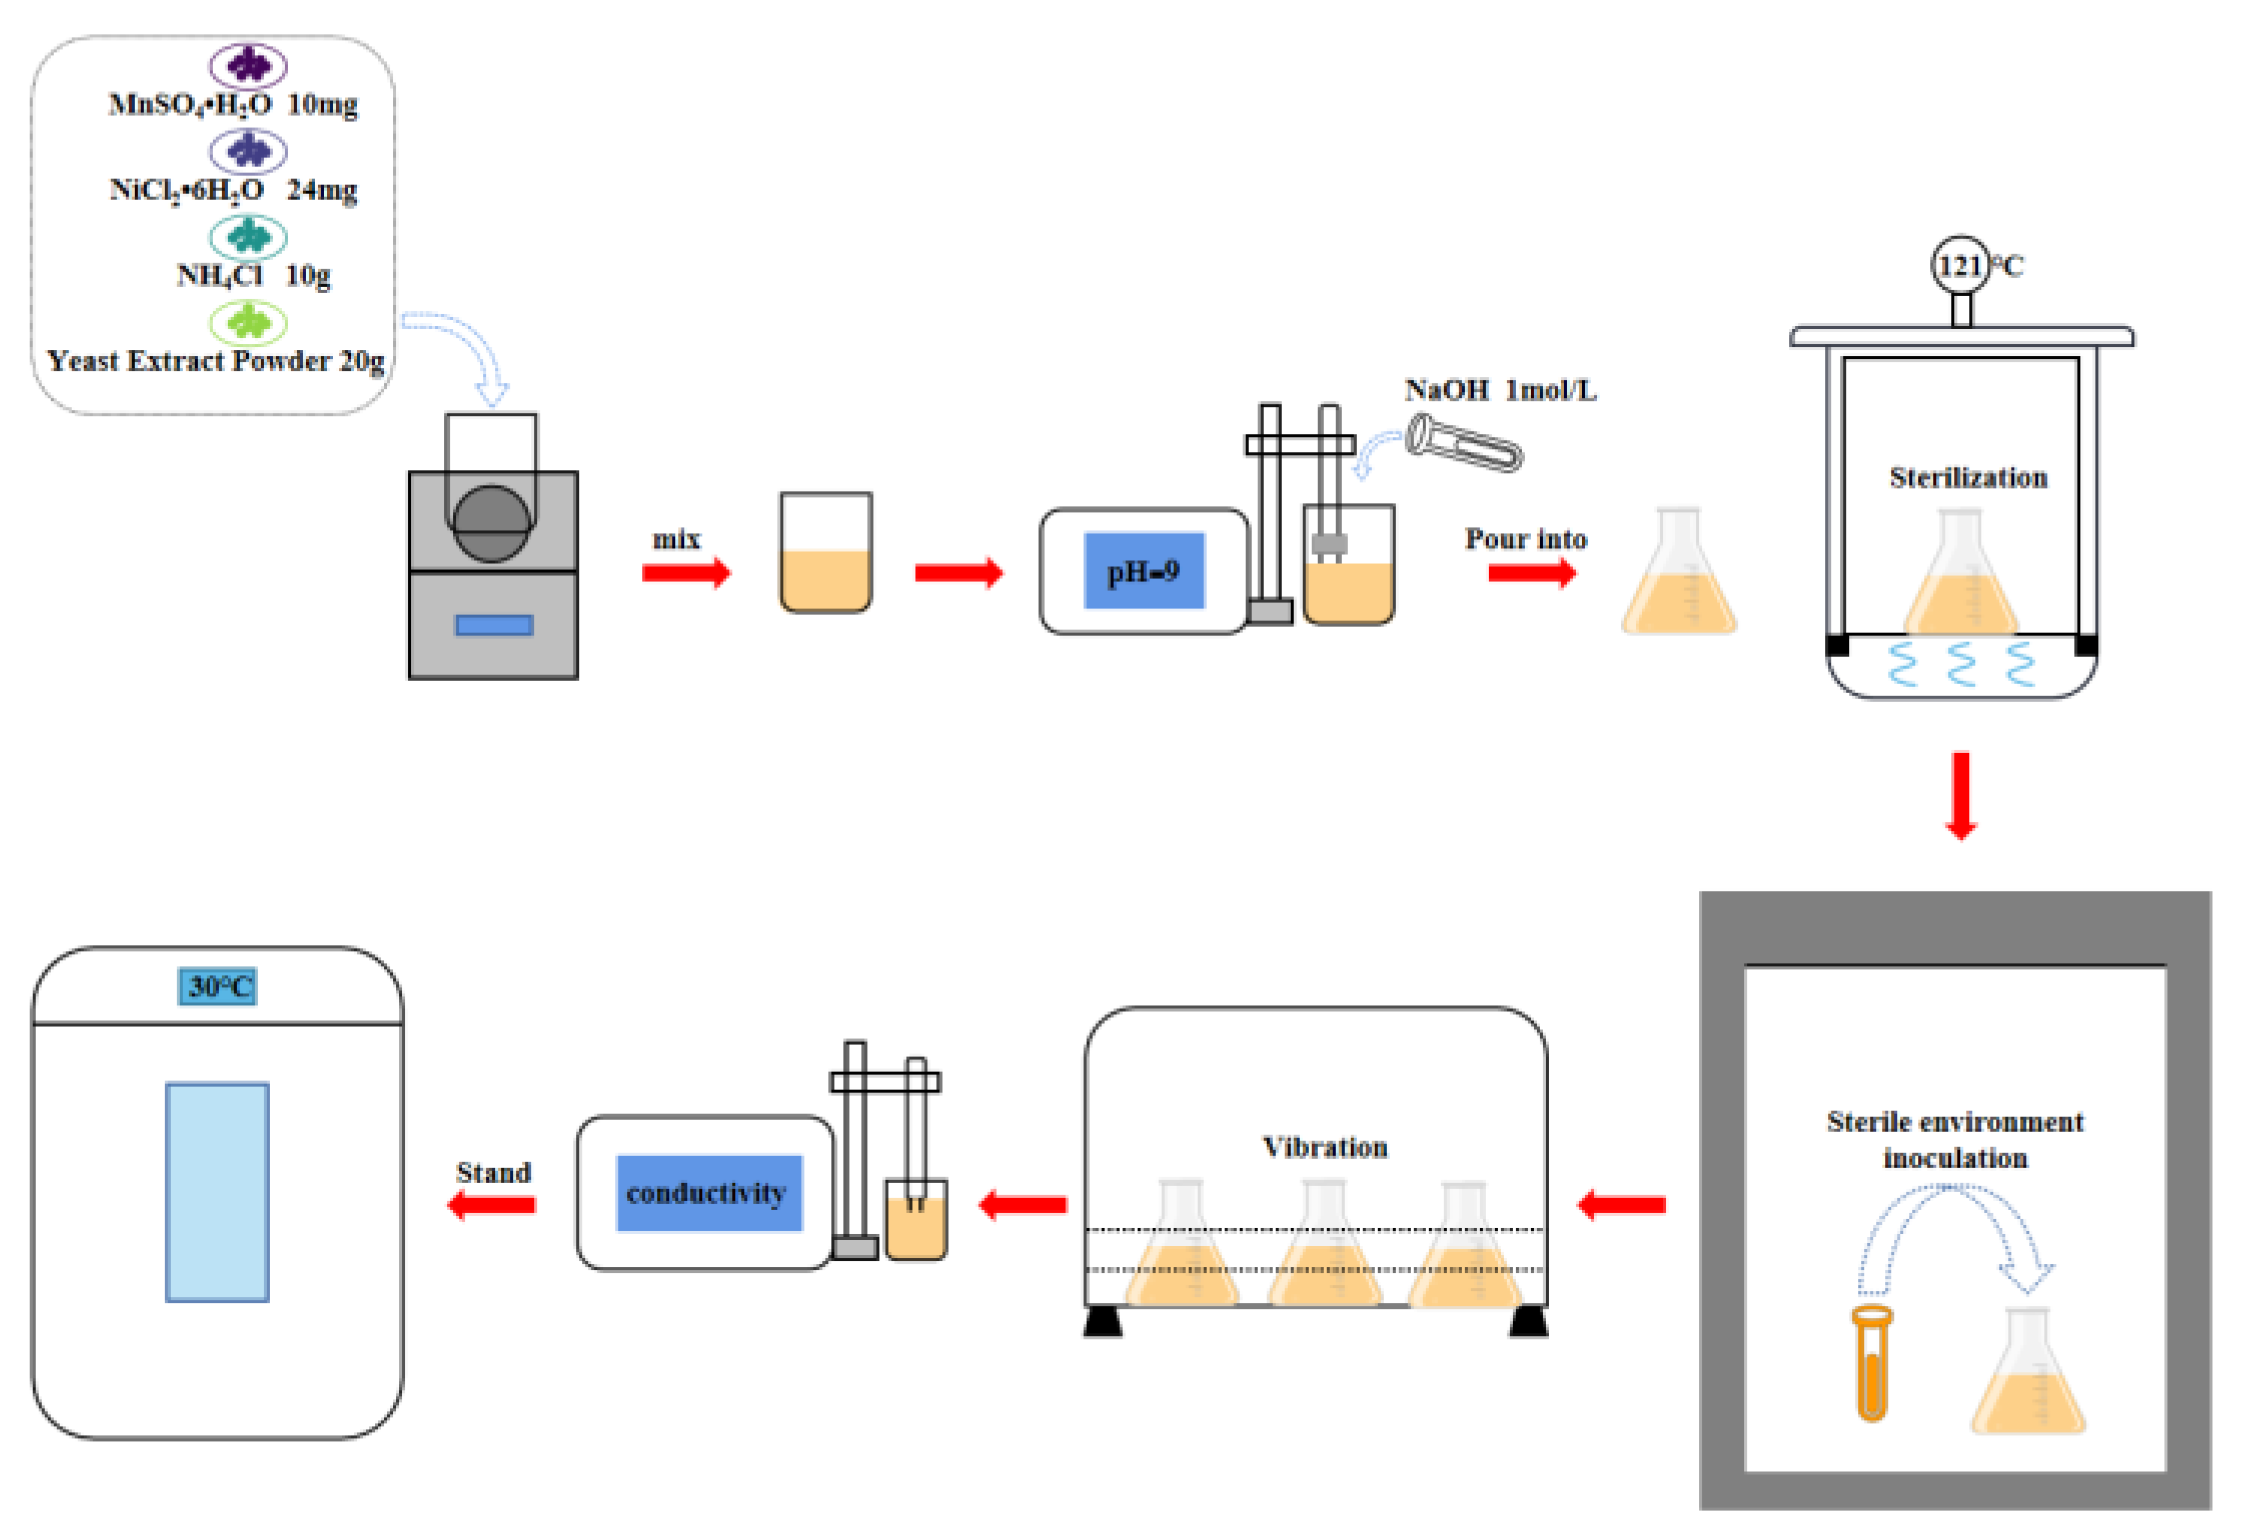
2.1. Experiments

The strain used in the test was Sporosarcina pasteurii (purchased from the China General Microorganism Culture Collection Management Center), with rod cells of about 1–3 µm in size. The bacteria are widely present in nature, nontoxic, and harmless to the human body. They can withstand high-temperature and high-alkali conditions. As a high-yield urease strain, the Sporosarcina pasteurii strain can produce a large amount of urease during its metabolism to promote urea hydrolysis, and the reaction process is environmentally friendly. It is the most commonly used strain in the field of geotechnical engineering by MICP technology [38].
Referring to the relevant research results [39,40,41], the medium parameters used in this experiment are shown in Table 1. The solid medium was used for the long-term preservation of strains, and the liquid medium was used for activation and expansion.
The preserved strains need to be activated before they can be used for expansion after the bacterial activity is stimulated. The test steps are as follows: (1) Based on the proportion of each component in Table 1, the liquid medium was configured, filled into a conical flask, and placed in a high-pressure steam sterilizer at 121 °C for 30 min. (2) After sterilization, the surface of the conical bottle was disinfected with alcohol, and the conical bottle was immediately put into the ultra-clean bench and cooled to room temperature. (3) The bacterial liquid preserved at low temperature was taken out and inoculated into the liquid medium proportionally in the ultra-clean bench after cooling to room temperature. (4) The liquid medium was put into a 30 °C constant-temperature oscillation box and cultured at 190 rpm for 36 h [42]. Figure 2 shows the test flow chart, and Figure 3 shows the required chemical reagent diagram.
The cementation solution used in this experiment was a mixture of urea and calcium chloride with a volume of 1:1, and the concentration of the two in the cementation solution was 1 mol/L. Urea provided a nitrogen source and energy for bacterial metabolism, and calcium chloride provided a calcium source for the MICP process. The dissolution of urea in water was an endothermic reaction and that of calcium chloride in water was an exothermic reaction. Hence, the solution needed to be configured separately until it reached room temperature before mixing.
In this experiment, the calcareous sand of the South China Sea islands was selected as the test sand, which mainly comprised coral debris and marine biological debris. The sand particle size was less than 1 mm. After drying and spraying gold, the sand was tested by scanning electron microscopy. The sand particles were dried and ground into a fine glass plate groove, and a smooth and flat sample with an area of 15  ×  15 mm was made and tested in an X-ray diffractometer. Figure 4 shows the SEM test diagram of the test calcareous sand, and Figure 5 shows the XRD test diagram of the test calcareous sand.

2.2. Test Method

Whiffin [43] found a linear relationship between the amount of urea hydrolysis in the solution and the conductivity. Bacteria uses urease produced by its own metabolism to promote urea hydrolysis. The higher the bacterial activity, the more the urease produced, and the higher the conductivity of the solution. Therefore, the bacterial activity can be detected using a conductivity meter. In this experiment, 2 mL of the bacterial solution to be tested was added to 18 mL (1.5 mol/L) of urea solution and mixed evenly. The conductivity of the mixed solution was measured using a conductivity meter for 1–6 min, and the actual conductivity change rate [mS/(cm ∙ min)] was used to characterize the activity of the bacteria.
U = C × 11.11 ( R 2 = 0.9988 )
U AR = C 6 C 1 5 × 10 × 11.11
U A = C 6 C 1 5 × 10
where U is the amount of urea hydrolyzed (mM); C is the conductivity change value (mS/cm); UAR is the actual urea hydrolysis rate (mM urea/min); C6 and C1 are the conductivity values after 6 min and 1 min, respectively; and UA is the urease activity [mS/(cm ∙ min)]. The urease activity range of this experiment was 0.9–1.2 [mS/(cm ∙ min)].
In the process of cultivating bacteria, the bacteria showed a turbid state after some growth, and the absorbance of the bacterial solution at a wavelength of 600 nm was good. The concentration of the microbial liquid was positively correlated with its own turbidity. The bacterial liquid was approximately turbid, and the absorbance was greater. Therefore, the concentration of the microbial solution can be characterized by measuring the absorbance (OD600) of the bacterial solution at the wavelength of 600 nm by ultraviolet visible spectrophotometer. Whiffin [43] found that, when the measured value of OD600 was between 0.2 and 0.8, it was closest to the linear correlation with the concentration of the bacterial solution. Therefore, the bacterial solution must be diluted to achieve the measured value between 0.2 and 0.8. Then, the measured value was multiplied by the dilution multiple to obtain the actual OD value of the bacterial solution.
The common method to determine the CaCO3 formation rate in the MICP test was to measure the quality difference before and after pickling by cleaning the reinforced sand with hydrochloric acid and then drying it [43]. As the calcareous sand of the South China Sea island was selected as the test sand, the sand sample originally had a high content of CaCO3. Therefore, this test used the weighing method to calculate the CaCO3 formation rate [44]. The specific steps were as follows: (1) The sample was weighed before curing and recorded as M1. (2) The samples were soaked in deionized water for 24 h after MICP reinforcement to remove the soluble salt in the samples. (3) After soaking, the samples were taken out and dried in a constant-temperature drying oven at 60 °C for 24 h. (4) The mass of the sample after drying was recorded as M2. (5) The CaCO3 formation rate was calculated as follows:
M = M 2 M 1 M 1 × 100 %
In this experiment, calcium chloride was used as the calcium source in the MICP reinforcement process, which reflected the utilization efficiency of bacteria on the cementitious liquid through the Ca2+ conversion rate. The specific steps were as follows: (1) Theoretically, the total amount of Ca2+ in calcium chloride added to the cementing liquid was the amount that should be generated, which was recorded as A1. (2) The actual amount of CaCO3 generated from the solidified sand sample was calculated using the steps and formula described and recorded as A2. (3) The Ca2+ conversion rate was calculated as follows:
A = A 2 A 1 × 100 %
In this experiment, the artificial grouting method was used to reinforce the sample with MICP, that is, the bacterial liquid and cementing liquid were artificially grouted from the top of the sample. Although the reaction rate and the number of bacteria and samples during MICP reinforcement could not be directly measured, the actual number of bacteria remaining in the sample could be judged by the ability of bacteria to adhere to the sample. The specific steps were as follows: (1) The OD600 value of the bacteria to be used was measured using an ultraviolet spectrophotometer, which was recorded as C1. (2) The bacterial liquid was grouted from the top of the sample, and the bacterial liquid flowing out from the bottom was collected. The OD600 value was measured and recorded as C0. (3) The bacterial attachment rate was calculated as follows:
C = C 1 C 0 C 1 × 100 %
Water absorption can indirectly reflect the number and size of pores inside the sample and the reinforcement effect of the sample from the side. The specific steps were as follows: (1) The reinforced samples were immersed in deionized water for 24 h. (2) The soaked samples were placed in a constant-temperature oven at 60 °C for 24 h and weighed, which was recorded as W1. (3) The dried sample was placed in a saturated water cylinder for 24 h to fully absorb water to ensure that the liquid level of the water cylinder was 25 mm higher than the top of the sample. (4) After 24 h, the saturated water cylinder sample was taken out. The surface moisture was quickly dried with filter paper and weighed, which was recorded as W2. (5) The water absorption was calculated as follows:
W = W 2 W 1 W 1 × 100 %
Unconfined compressive strength refers to the ultimate strength of the specimen when it is destroyed under the condition of only axial pressure and no lateral pressure. It is an important index of geotechnical mechanical strength. The specific steps were as follows: (1) The samples after reinforcement were immersed in deionized water for 24 h and dried in a constant-temperature oven at 60 °C for 24 h. (2) The unconfined compression instrument was started, and the axial loading rate of the instrument was set to 2 mm/min. (3) The upper and lower pressure plates of the instrument were wiped to check whether the two ends of the sample were flat so as to avoid the influence of the uneven contact surface on the experimental results. (4) The sample was placed on the base of the pressure plate so that the upper pressure plate dropped slowly until it contacted the top of the sample quickly.
The MICP sand column reinforcement tests were carried out at ambient temperatures of 20 °C, room temperature, 30 °C, and 40 °C. The reinforcement effect was evaluated using indicators such as CaCO3 formation rate, Ca2+ conversion rate, bacterial adhesion rate, water absorption rate, and unconfined compressive strength. It provided a reference for the future application of MICP technology in island and reef engineering construction. The specific test scheme is shown in Table 2. The range of “room temperature ” is 25 °C.

3. Results

3.1. CaCO3 Formation Rate

Figure 6 shows the formation rate of CaCO3 in the sample in different temperature environments. The formation rate of CaCO3 in the sample increased first and then decreased with increasing temperature. At low temperatures (20 °C to room temperature), the increase in temperature had a more obvious effect on the formation rate of CaCO3, and the formation rate of CaCO3 increased by 7.51%. When the ambient temperature increased from room temperature to 30 °C, the formation rate increased by only 2.72%, and the maximum formation rate was 14.15% at 30 °C. When the ambient temperature was further increased (30–40 °C), the formation rate of CaCO3 in the sample decreased by 3.37%; therefore, 30 °C was the most suitable temperature for the formation of CaCO3.

3.2. Ca2+ Conversion Rate

Figure 7 shows the schematic diagram of the Ca2+ conversion rate in different temperature environments. The Ca2+ conversion rate was consistent with the CaCO3 formation rate, and the relationship with temperature changes also first increased and then decreased. In the range of 20–30 °C, the conversion rate of Ca2+ increased with an increase in temperature and reached the maximum conversion rate of 31.71% at 30 °C. When the ambient temperature increased from 30 °C to 40 °C, the conversion rate of Ca2+ decreased to 24.16%.

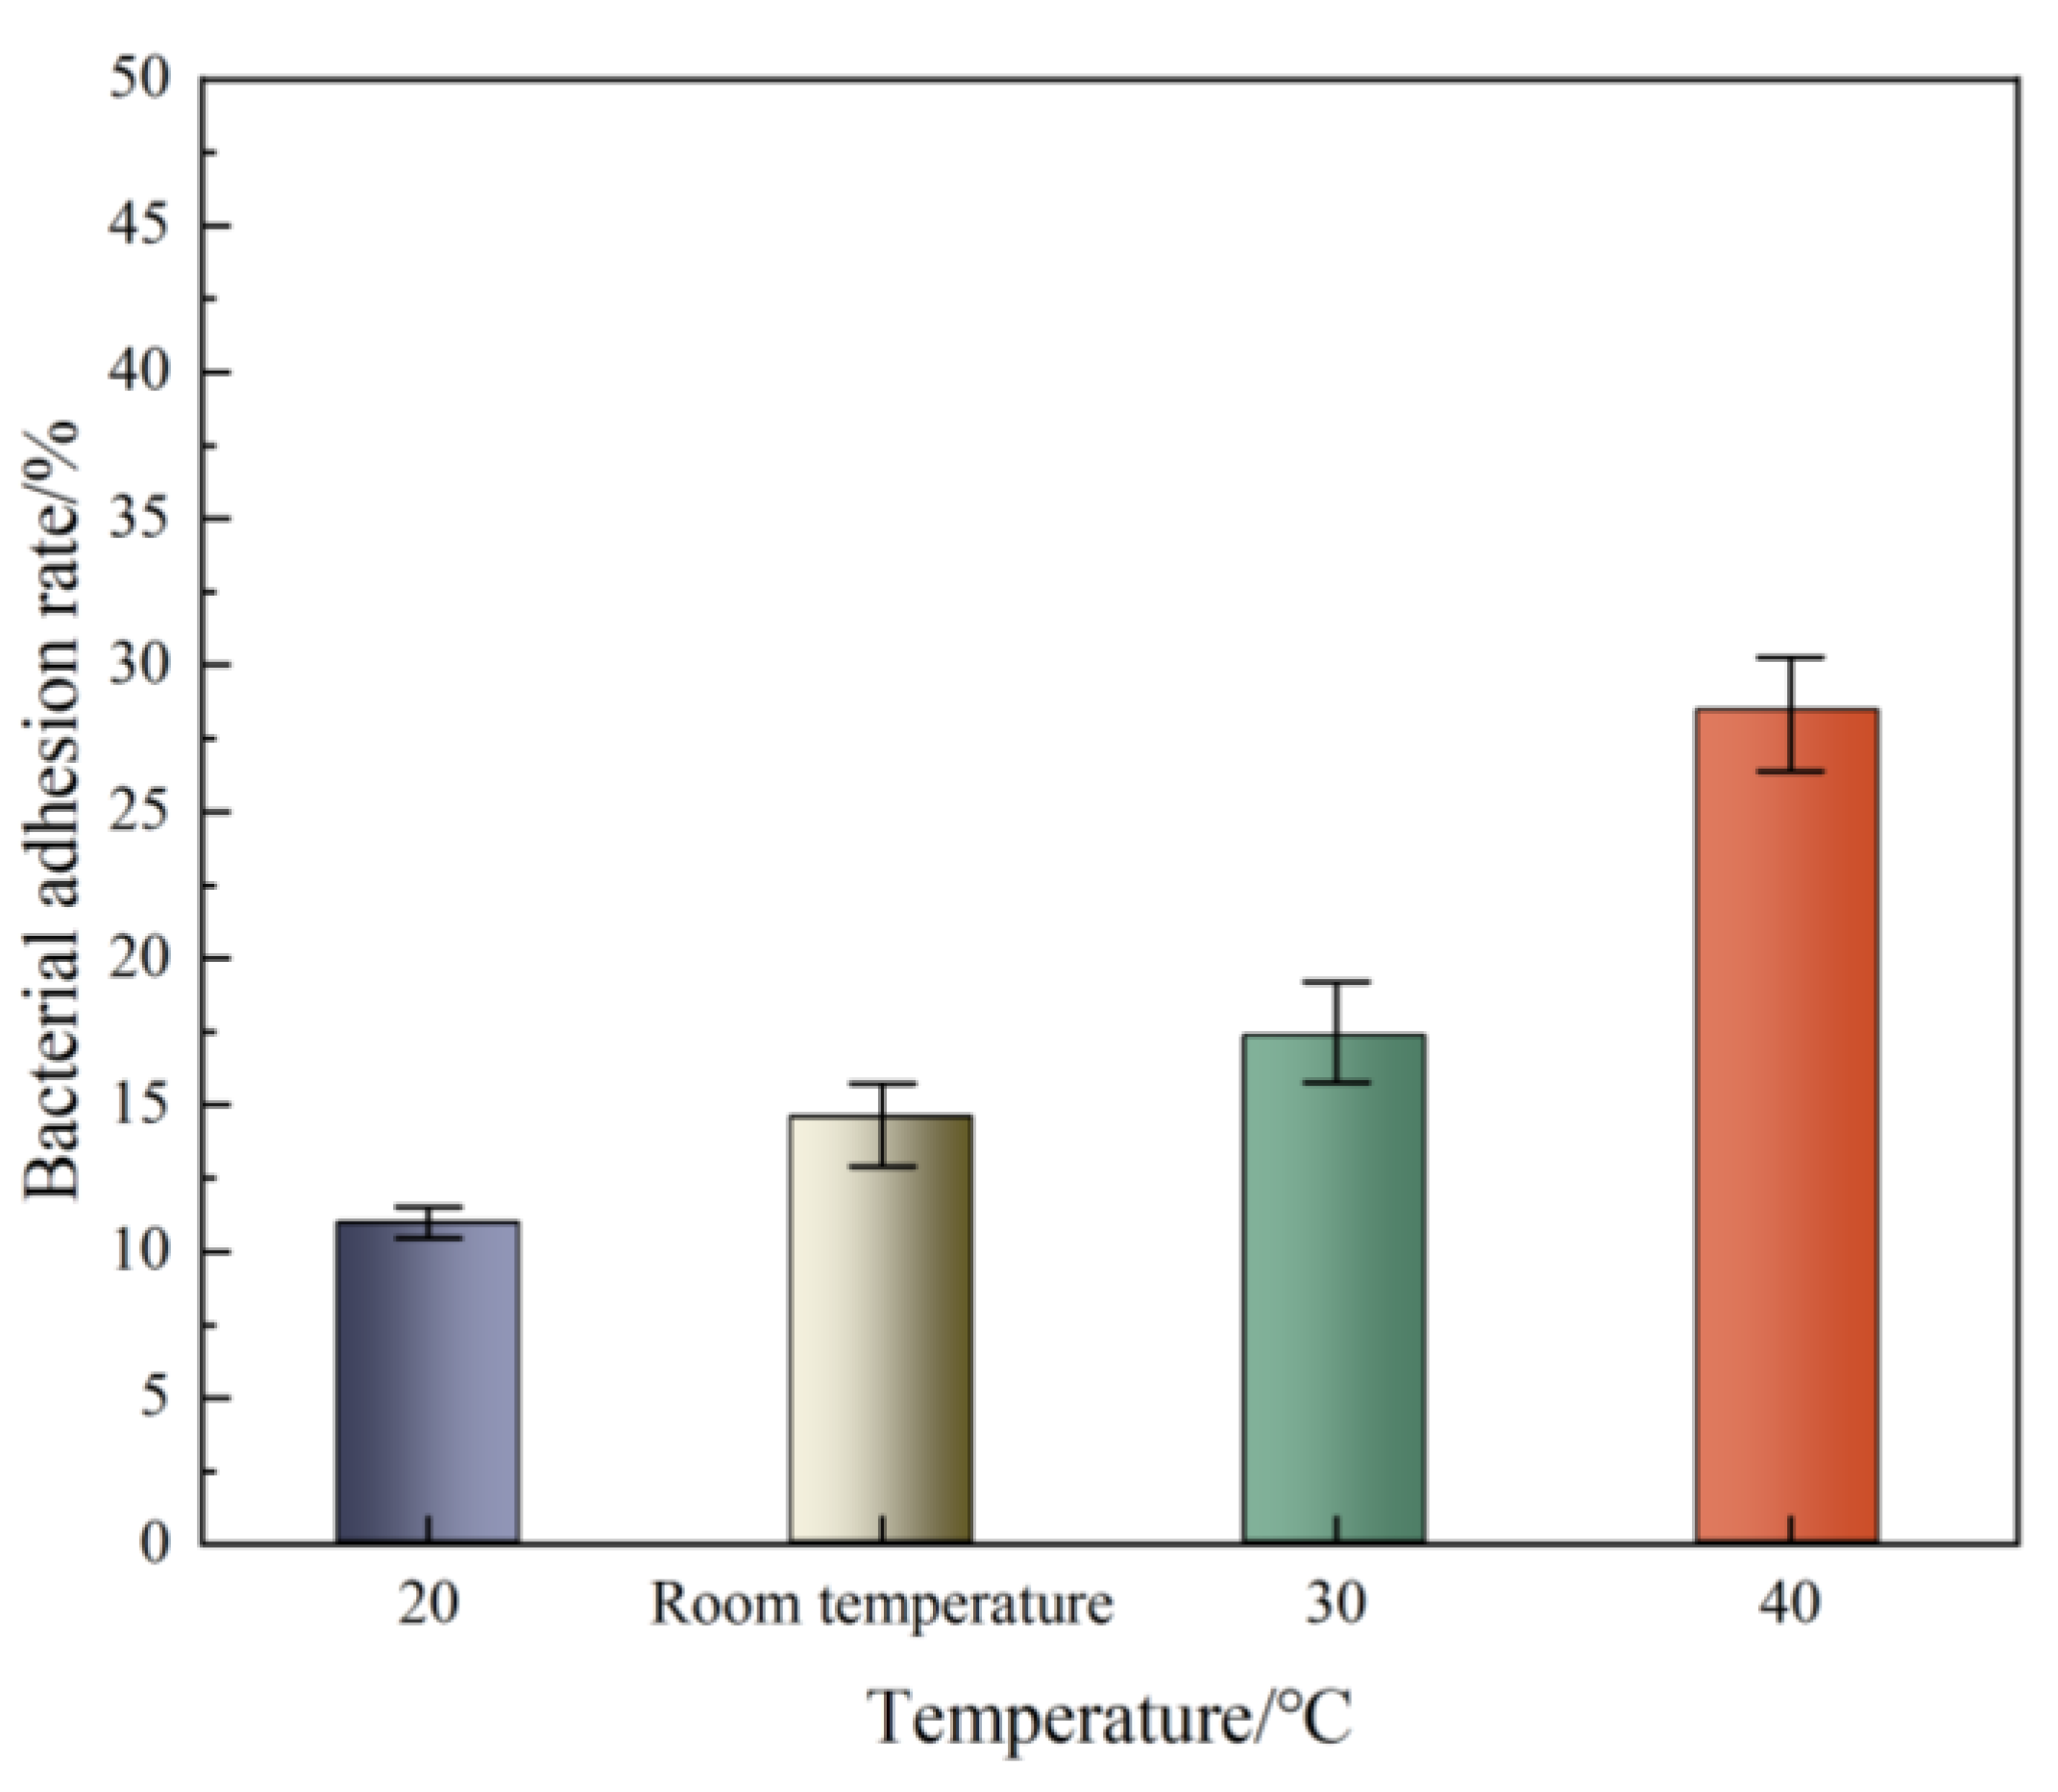
3.3. Bacterial Adhesion Rate

Figure 8 is a schematic diagram of the bacterial attachment rate in different temperature environments. The bacterial attachment rate also increased with an increase in temperature. When the ambient temperature increased from 20 °C to room temperature, the adhesion rate increased by 3.63%. When the ambient temperature increased from room temperature to 30 °C, the adhesion rate increased by 2.77%. When the ambient temperature increased from 30 °C to 40 °C, the adhesion rate increased by 11.13%. The findings in Figure 6 showed that the bacterial attachment rate increased and the CaCO3 production rate decreased at 40 °C. Therefore, it was inferred that the increase in temperature affected the physiological state of bacterial cells.

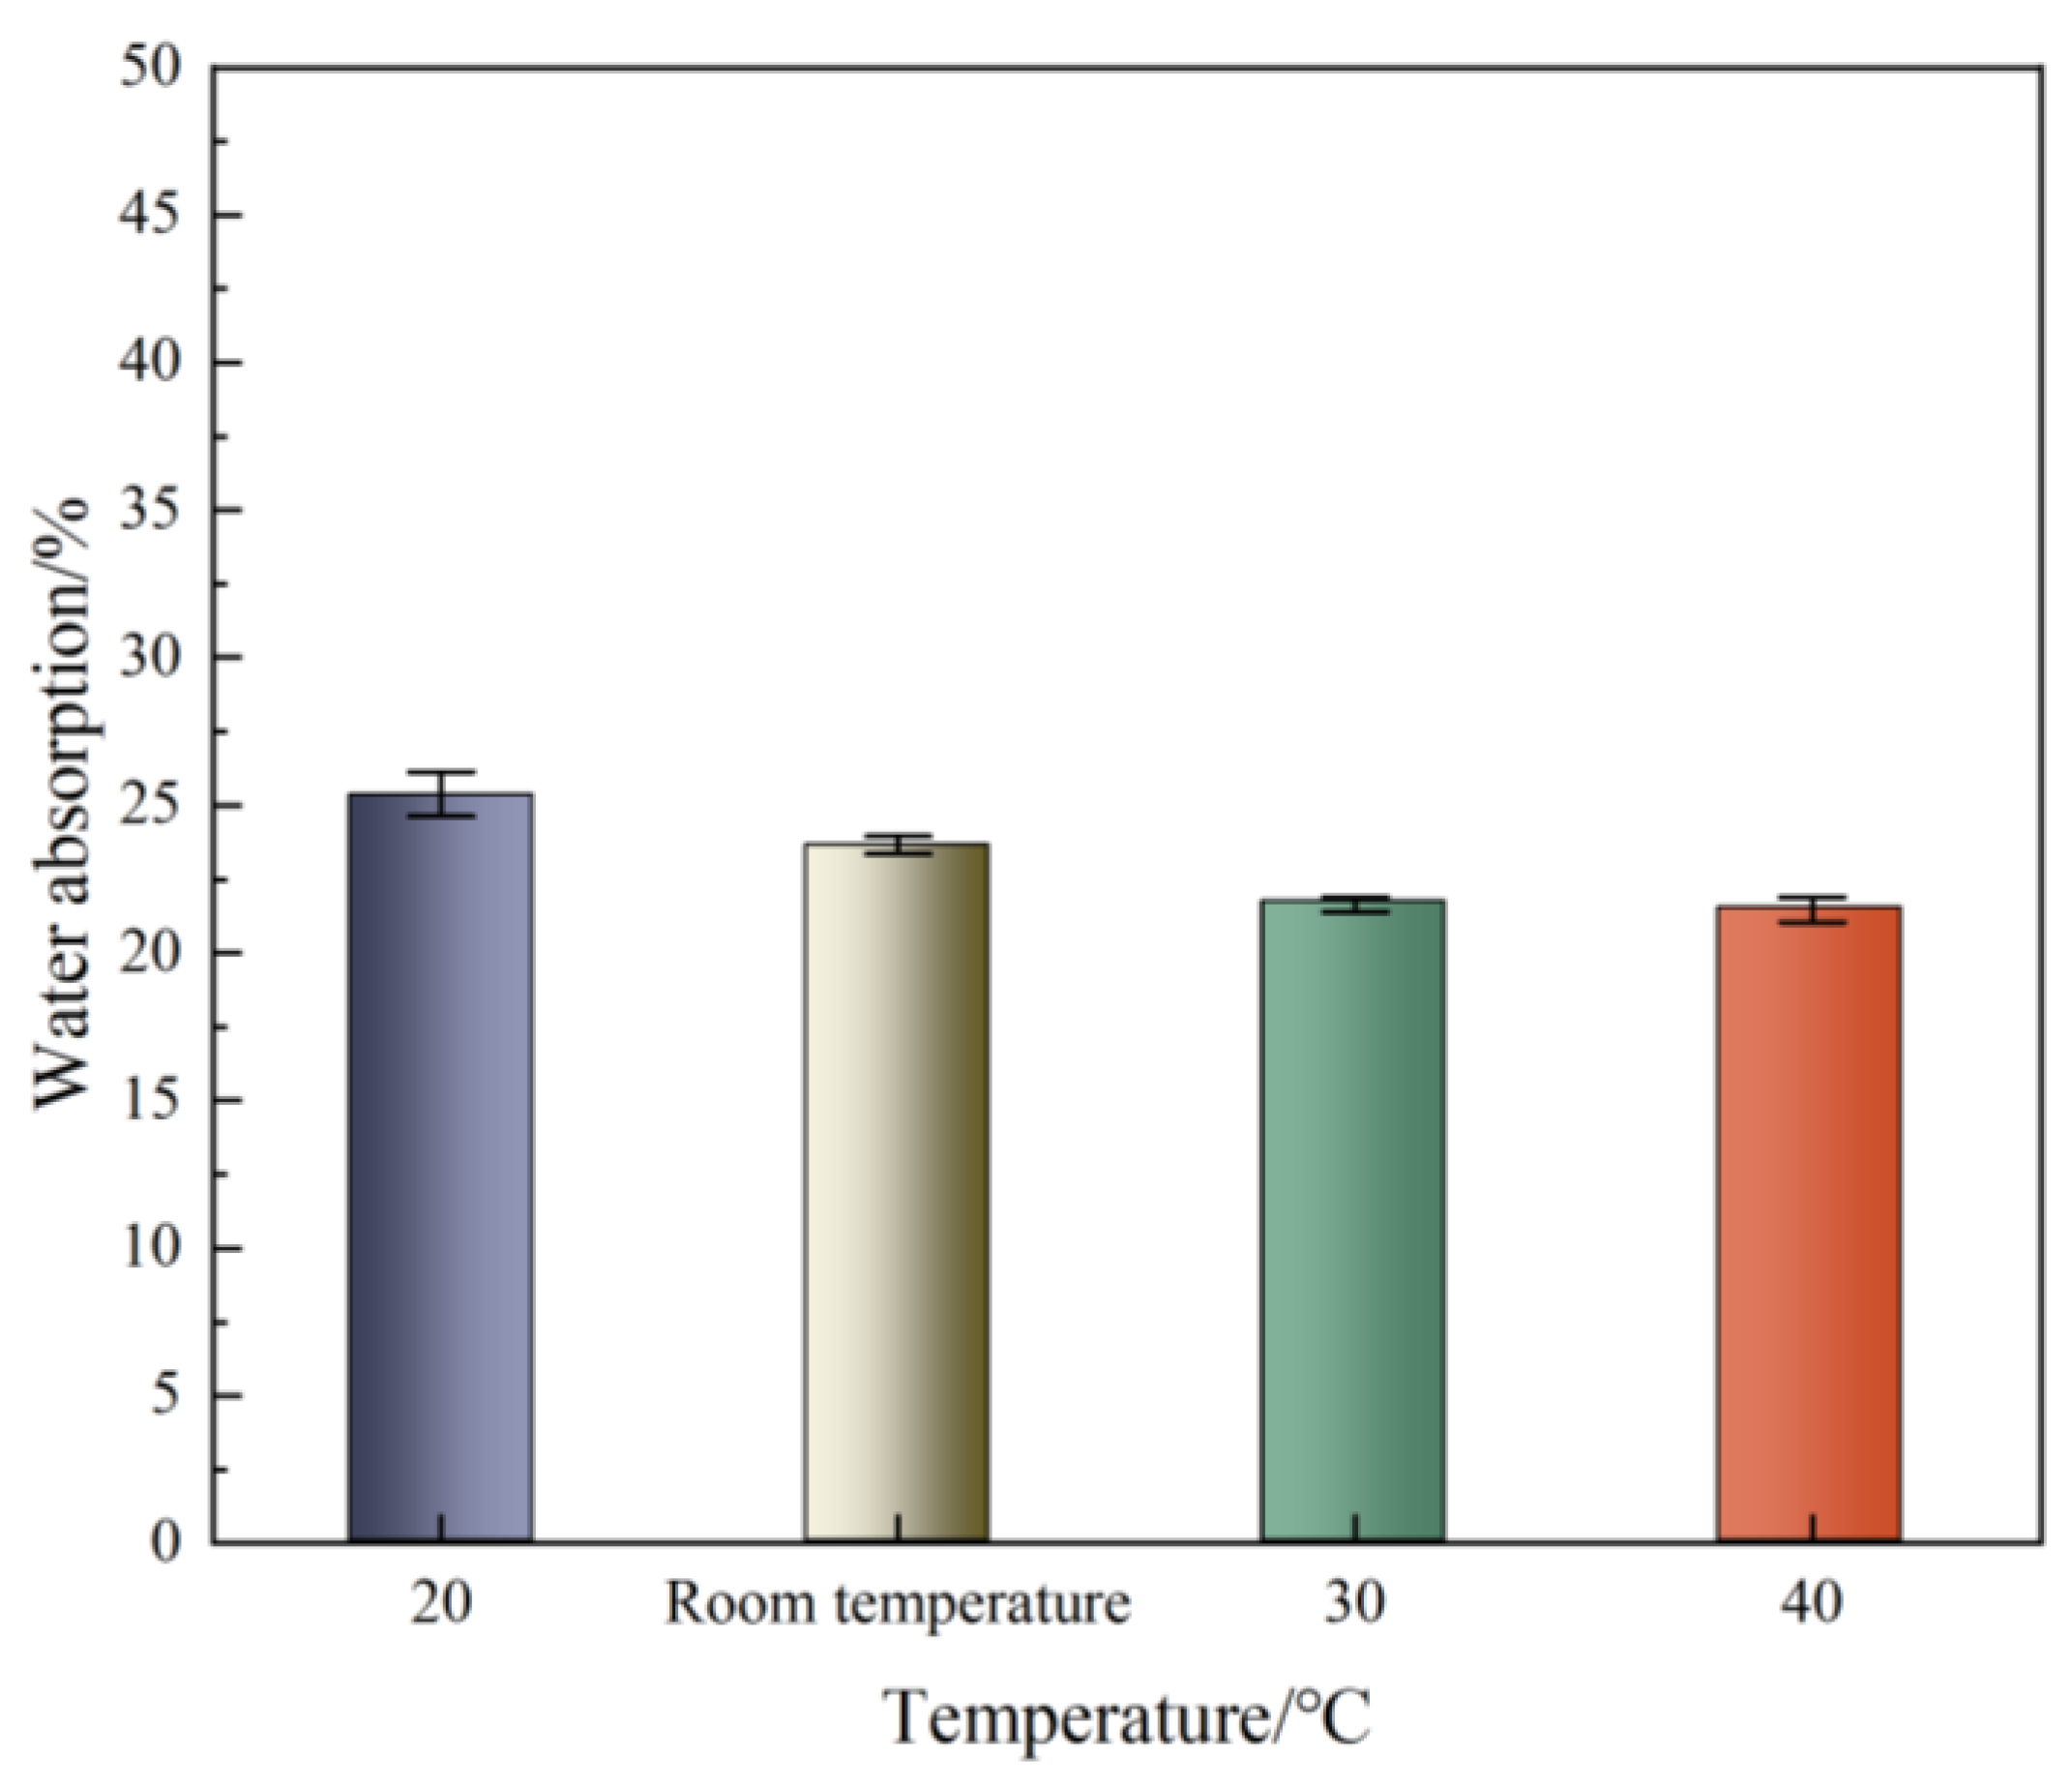
3.4. Water Absorption

Figure 9 shows a schematic diagram of water absorption of samples at different temperatures. The water absorption of the cured sample gradually decreased with increasing temperature. When the ambient temperature increased from 20 °C to room temperature, the water absorption decreased by 1.69%. When the ambient temperature increased from room temperature to 30 °C, the water absorption decreased by 1.91%. When the ambient temperature increased from 30 °C to 40 °C, the water absorption decreased by only 0.23%. At this time, the increase in ambient temperature had little effect on the water absorption of the cured sample. The findings in Figure 6 showed that the formation rate of CaCO3 in the sample decreased at 40 °C and the water absorption rate was almost the same. Therefore, it was inferred that the CaCO3 crystal forms formed at different temperatures were not the same.

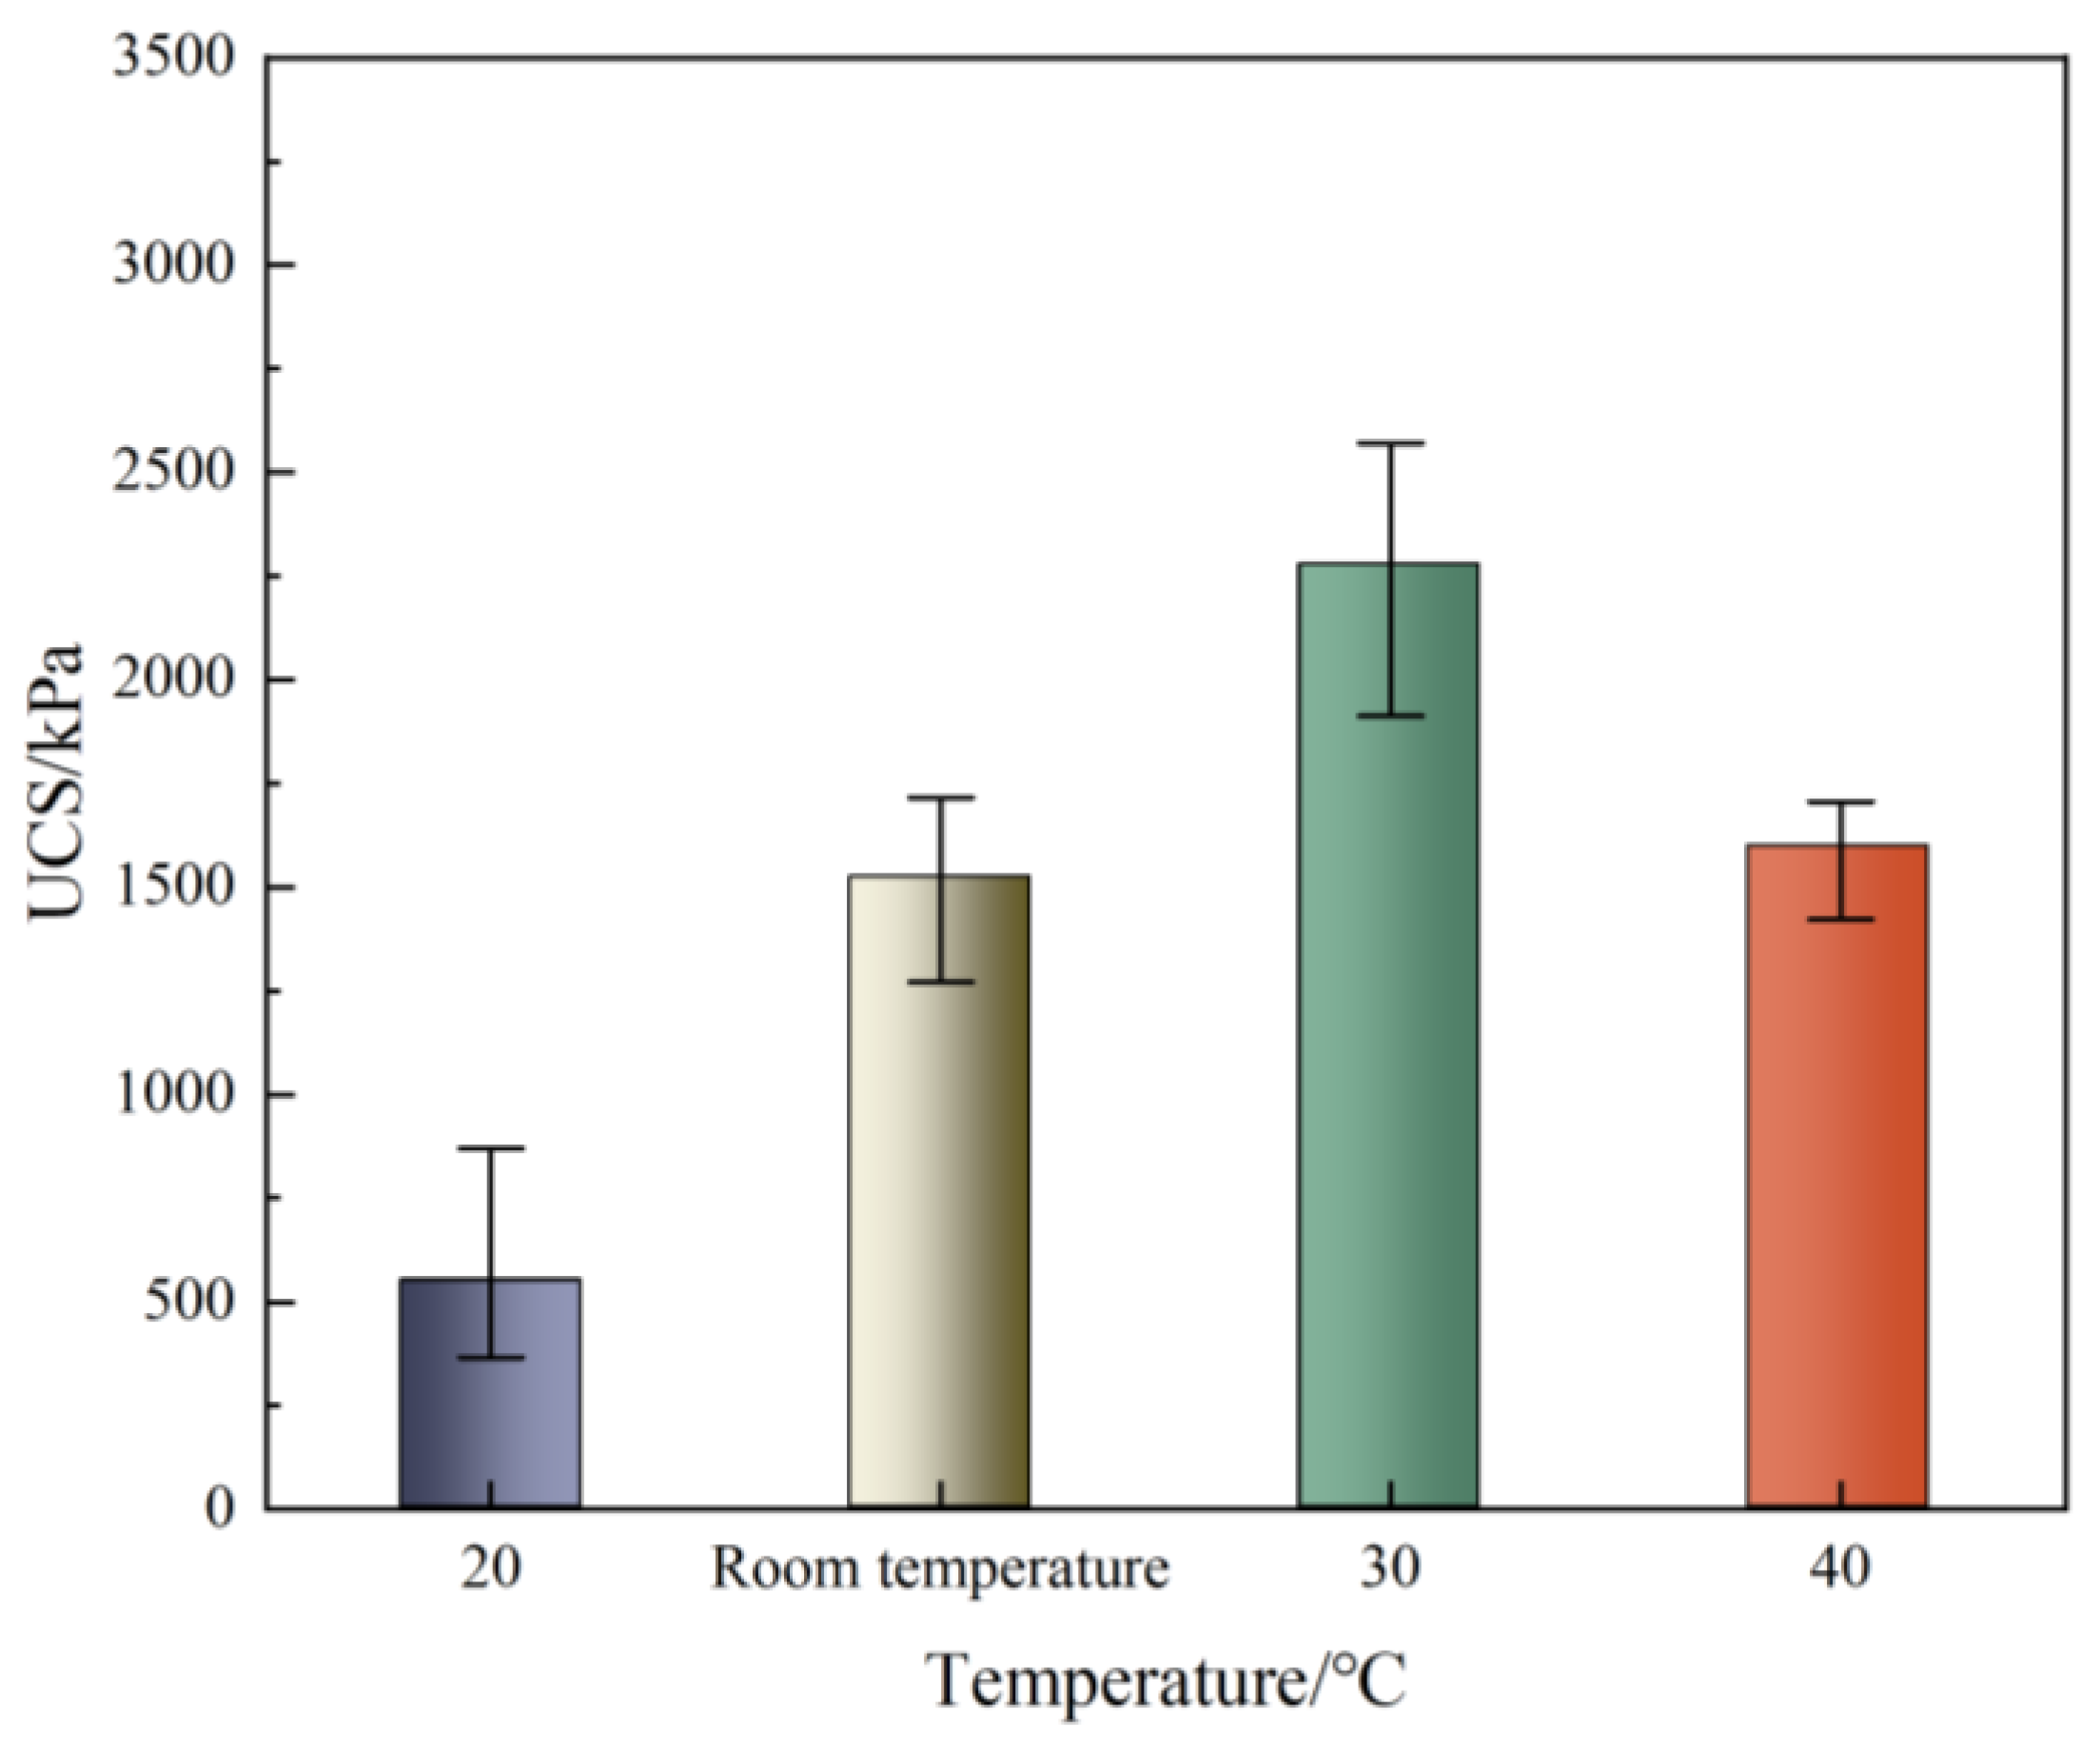
3.5. Unconfined Compressive Strength

Figure 10 shows a schematic diagram of the unconfined compressive strength of the sample in different temperature environments. The unconfined compressive strength was positively correlated with the formation rate of CaCO3. The higher the formation rate, the higher the strength of the solidified sample. In the temperature range of 20–30 °C, the unconfined compressive strength of the sample increased with an increase in the ambient temperature and reached the maximum strength value of 2276.67 kPa at 30 °C, which was 415.45% at 20 °C and 149.58% at room temperature. In the temperature range of 30–40 °C, the unconfined compressive strength decreased with increasing temperature and the strength decreased from 2276.67 kPa to 1598 kPa, which was a reduction of 29.81%.

3.6. Effect of Temperature on Test Index

Effect of temperature on test index is presented in Table 3.

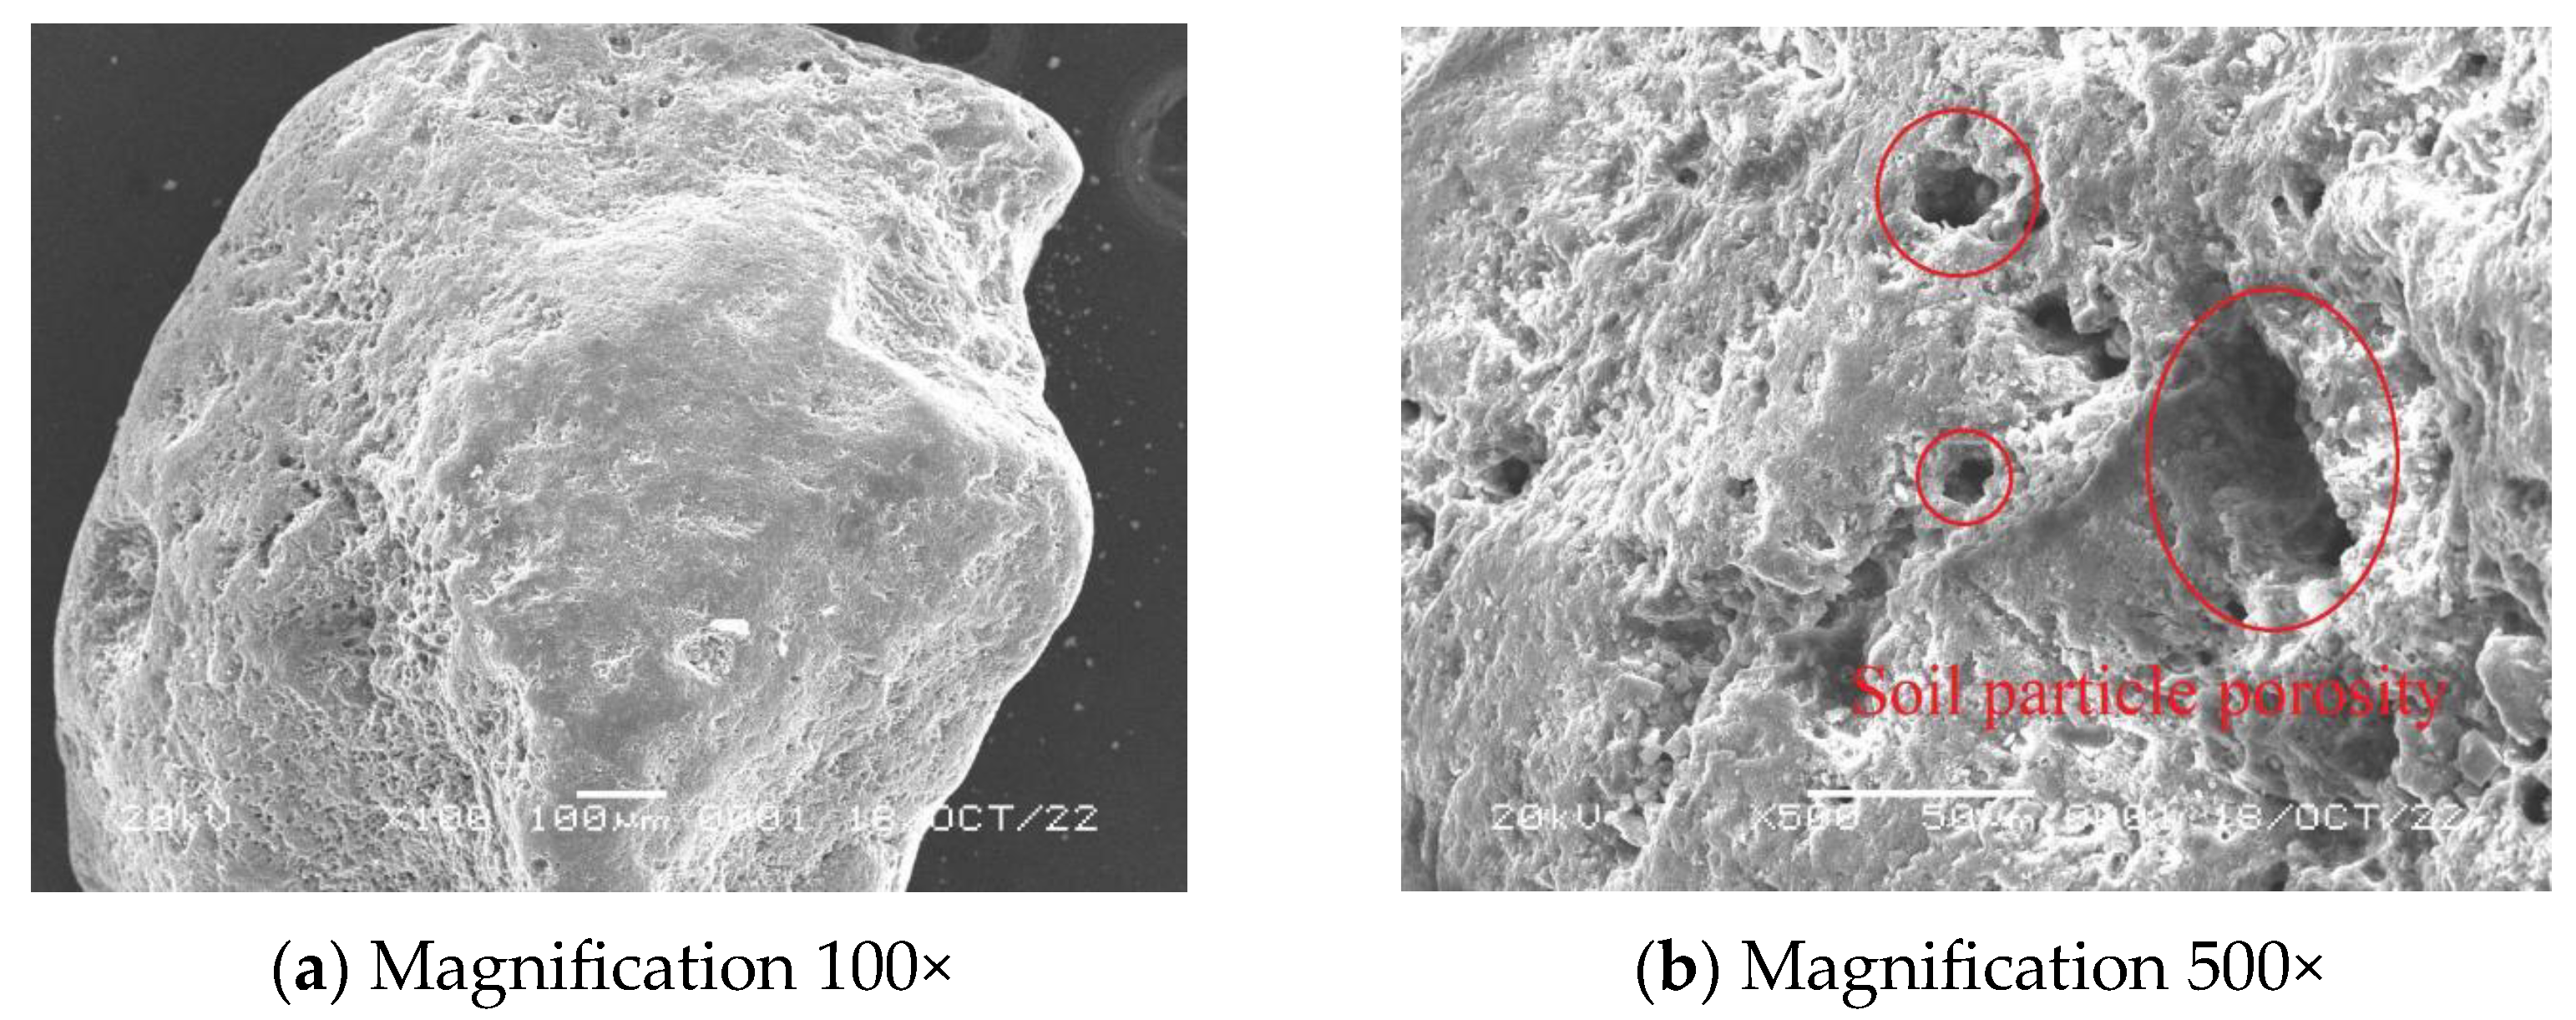
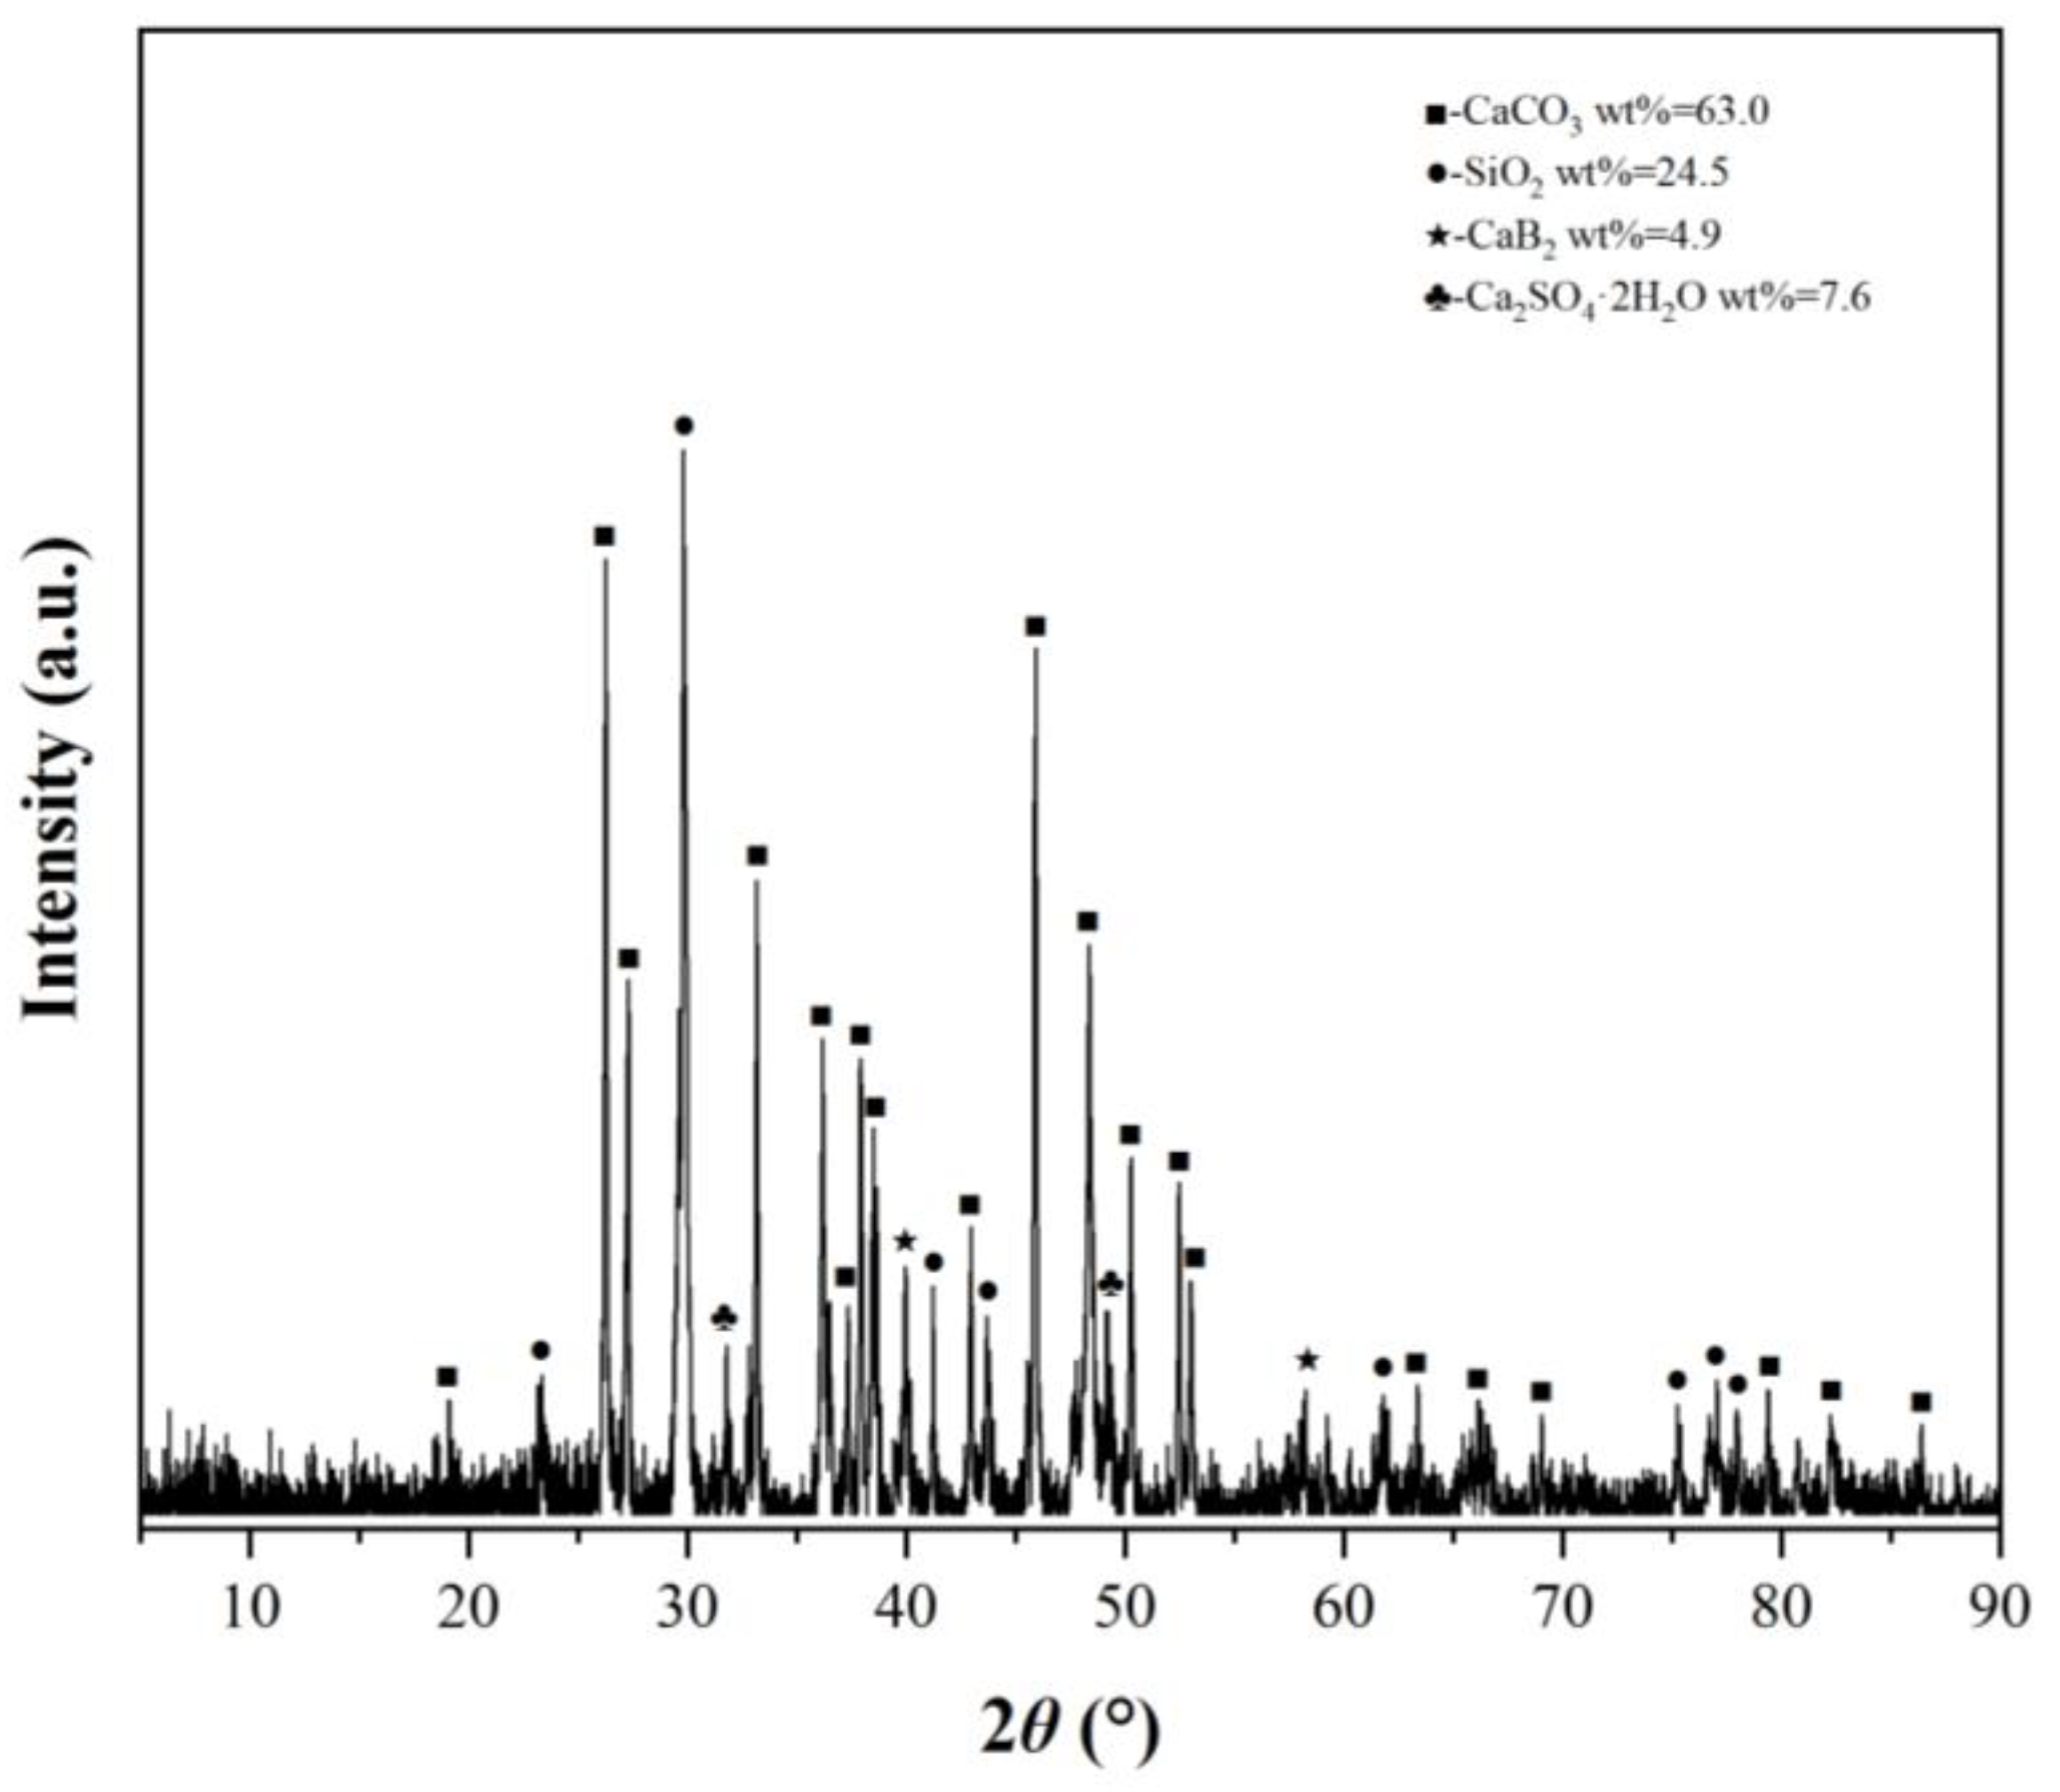
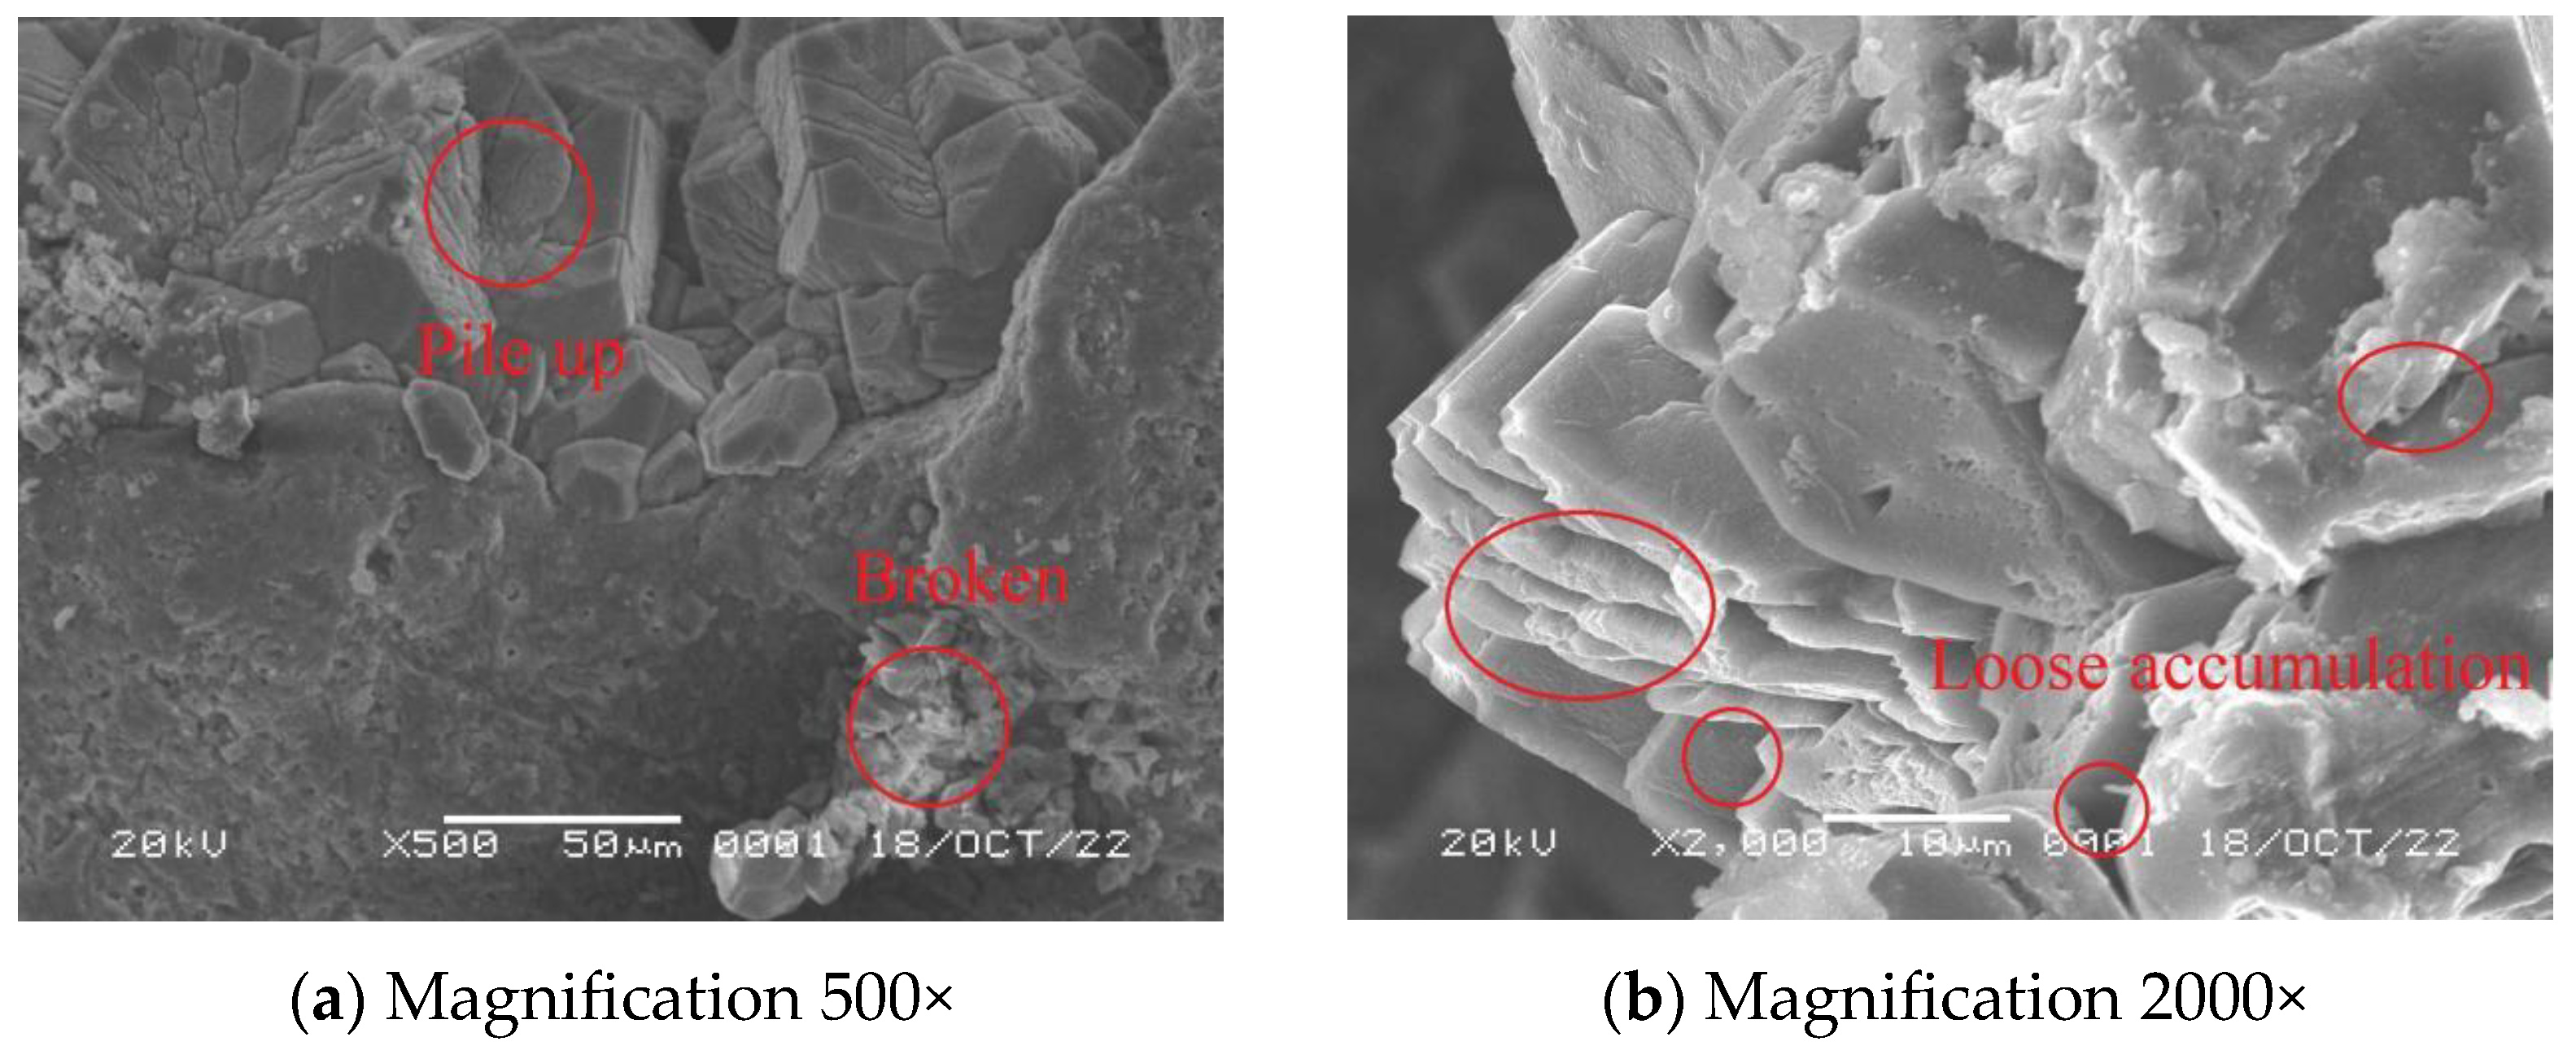
3.7. Scanning Electron Microscope Experiments

The effect of MICP reinforcement at different ambient temperatures was examined using scanning electron microscopy. Figure 11 shows the SEM images of each group of samples after crushing.
The CaCO3 minerals formed at 20 °C were mostly granular, with small crystal size and no fixed morphology. They were scattered on the surface of calcareous sand particles, with few bonding points between sand particles and poor bonding effect. The amount of CaCO3 produced was significantly less than that in other groups. The CaCO3 minerals formed at 30 °C were mostly cubic, and the crystal size was large. Compared with the CaCO3 formed at room temperature, the accumulation of CaCO3 was denser, the gap between adjacent sand particles was less, and the bonding was tight. It played a better bridging role, and the strength of the cured sample was also higher.

4. Conclusions

This study carried out the MICP sand column reinforcement tests at different ambient temperatures (20 °C, Room temperature, 30 °C, and 40 °C). Combined with a series of indicators such as CaCO3 generation rate, Ca2+ conversion rate, water absorption rate, and unconfined compressive strength of the solidified samples, the effect of ambient temperature on the effect of MICP was explored in this study. The main conclusions were as follows:
(1)
The CaCO3 formation rate, Ca2+ conversion rate, and unconfined compressive strength increased first and then decreased with increasing temperature, the UCS is 548 KPa at 20 °C and 2276.67 KPa at 30 °C, and the reinforcement effect was the best at 30 °C.
(2)
The adhesion rate of bacteria increased continuously with increasing temperature, from 10.91 at 20 °C to 28.44 at 40 °C, and an increase in temperature would affect the physiological state of bacterial cells.
(3)
The water absorption rate showed a continuous downward trend with increasing in temperature, from 25.32 at 20 °C to 21.49 at 40 °C, and the CaCO3 crystals formed at different temperatures were not the same.
(4)
When MICP reinforcement was carried out at 30 °C, the accumulation of CaCO3 was denser, the gap between adjacent sand particles was less, and the bonding was tight, which played a bridging role; the strength of the solidified sample was also higher.

Author Contributions

Conceptualization, J.H.; methodology, Y.Z.; software, H.X.; validation, Y.Y.; formal analysis, Y.Z.; investigation, H.X.; resources, K.W.; data curation, Y.Y.; writing—original draft preparation, Y.Z.; writing—review and editing, Y.Z.; visualization, Y.Y.; supervision, J.H.; project administration, J.H.; funding acquisition, K.W. and K.W. All authors have read and agreed to the published version of the manuscript.

Funding

This study was funded by the National Natural Science Foundation of China (51968019), the Hainan Provincial Natural Science Foundation Innovation Research Team Project (522CXTD511), the High Technology Direction Project of the Key Research & Development Science and Technology of Hainan Province, China (ZDYF2021GXJS020).

Institutional Review Board Statement

Not applicable.

Informed Consent Statement

Not applicable.

Data Availability Statement

Not applicable.

Acknowledgments

The authors thank the Sanya Branch of China Railway 20th Bureau Group Co., 381 Ltd. (HD-KYH-2022405) for conducting research on safety construction guarantee technology for 382 shallow soil-covered long-distance-pipe curtain freezing tunnel and super deep foundation pit in 383 a coastal environment.

Conflicts of Interest

The authors declare no conflict of interest.

References

  1. Jafarian, Y.; Javdanian, H. Dynamic Properties of Calcareous Sand from the Persian Gulf in Comparison with Siliceous Sands Database. Int. J. Civ. Eng. 2019, 18, 245–249. [Google Scholar] [CrossRef]
  2. Liu, L.; Yao, X.; Ji, Z.; Gao, H.; Wang, Z.; Shen, Z. Cyclic Behavior of Calcareous Sand from the South China Sea. J. Mar. Sci. Eng. 2021, 9, 1014. [Google Scholar] [CrossRef]
  3. Yang, S.; Shen, X.; Liu, H.; Ge, H.; Rui, X. Gradation affects basic mechanical characteristics of Chinese calcareous sand as airport subgrade of reefs. Mar. Georesour. Geotechnol. 2020, 38, 706–715. [Google Scholar] [CrossRef]
  4. Wang, X.; Liu, J.-Q.; Cui, J.; Wang, X.-Z.; Shen, J.-H.; Zhu, C.-Q. Particle breakage characteristics of a foundation filling material on island-reefs in the South China Sea. Constr. Build. Mater. 2021, 306, 124690. [Google Scholar] [CrossRef]
  5. Han, K.; Ju, J.W.; Lv, L.-Y.; Yan, Z.; Chen, X.; Jin, Y. Damage-healing analysis of microencapsulated self-healing concrete subjected to tensile loading using a 2D micromechanical model. Int. J. Damage Mech. 2023, 32, 579–599. [Google Scholar] [CrossRef]
  6. Hong, C.; Wang, X.; Han, K.; Su, D.; Chen, Z. Performance investigation of 3D printed clay soil using fiber Bragg grating technology. Acta Geotech. 2022, 17, 453–462. [Google Scholar] [CrossRef]
  7. e Portugal, C.R.M.; Fonyo, C.; Machado, C.C.; Meganck, R.; Jarvis, T. Microbiologically Induced Calcite Precipitation biocementation, green alternative for roads–is this the breakthrough? A critical review. J. Clean. Prod. 2020, 262, 121372. [Google Scholar] [CrossRef]
  8. Liu, B.; Zhu, C.; Tang, C.S. Seawater based MICP cements two/one-phase cemented sand blocks. Eng. Geol. 2020, 264, 105389. [Google Scholar] [CrossRef]
  9. Lin, H.; Suleiman, M.T.; Brown, D.G. Investigation of pore-scale CaCO3 distributions and their effects on stiffness and permeability of sands treated by microbially induced carbonate precipitation (MICP). Soils Found. 2020, 60, 944–961. [Google Scholar] [CrossRef]
  10. Zhang, H.N.; Jia, C.Q.; Wang, G.H.; Su, F.; Sun, Y.S.; Fan, C.Y. Physical-mechanical properties of microbially induced calcite precipitation-treated loess and treatment mechanism. J. Mt. Sci 2022, 19, 2952–2967. [Google Scholar] [CrossRef]
  11. Liu, X.; Gao, X.; Pan, C. Experimental study on shear strength of cracks in MICP solidified soil sites. Chin. Civ. Eng. J. 2022, 55, 88–94. [Google Scholar]
  12. Yue, J.; Li, J.; Liu, D.; Wang, S.; Xing, X.; Chen, Y. Experimental study on the inhibitory effect of MICP technology on the cracking of site soil. J. Disas. Prev. Mitig. Eng. 2021, 41, 455–462. [Google Scholar]
  13. Liu, S.; Yu, J.; Zeng, W.; Peng, X.; Cai, Y.; Tu, B. Study on the effect of microbial induced calcium carbonate precipitation on repairing cracks in composite soil. Chin. J. Rock Mech. Eng. 2020, 39, 191–204. [Google Scholar]
  14. Liu, D. Experimental Study on Site Soil Restoration Based on Microbial Mineralization Technology. Master’s Thesis, Henan University, Henan, China, 2020. [Google Scholar]
  15. Xu, Y.; Qian, C.; Lu, Z. Study on the remediation of lead ion pollution by microbial mineralization. Chem. Ind. J. 2012, 26, 14–17. [Google Scholar]
  16. Xu, Y.; Qian, C.; Lu, Z. Microbial mineralization for remediation of heavy metal contaminated soil. Chin. J. Environ. Eng. 2013, 7, 2763–2768. [Google Scholar]
  17. Kumari, D.; Pan, X.; Lee, D.J.; Achal, V. Immobilization of cadmium in soil by microbially induced carbonate precipitation with Exiguobacterium undae at low temperature. Int. Biodeterior. Biodegrad. 2014, 94, 98–102. [Google Scholar] [CrossRef]
  18. Kang, C.H.; Han, S.H.; Shin, Y.J.; Oh, S.J.; So, J.S. Bioremediation of Cd by Microbially Induced Calcite Precipitation. Appl. Biochem. Biotechnol. 2014, 172, 1929–1937. [Google Scholar] [CrossRef]
  19. Liu, S.; Liu, J.; Zhou, C.; Wang, Y.; Chen, Q.; Zhong, Q. Soil and water conservation model test of MICP surface mineralized lattice fill in slope vegetation restoration. Chin. J. Geotech. Eng. 2022, 44, 29–34. [Google Scholar]
  20. Duan, J.; Wang, H.; Yao, J.; Wang, X.; Zhao, X.; Bai, X.; Tian, K. Experimental study on microbial mineralization reinforcement and erosion resistance of loess slope. Bull. Soil Water Conserv. 2022, 42, 33–40. [Google Scholar]
  21. Li, Y. Experimental Study on MICP Reinforcement of Sandy Slope Soil. Master’s Thesis, Zhejiang University, Zhejiang, China, 2022. [Google Scholar]
  22. Cheng, L.; Shahin, M.A.; Chu, J. Soil bio-cementation using a new one-phase low-pH injection method. Acta Geotech. 2019, 14, 615–626. [Google Scholar] [CrossRef]
  23. Zeybek, A.; Madabhushi, S. Influence of air injection on the liquefaction-induced deformation mechanisms beneath shallow foundations. Soil Dyn. Earthq. Eng. 2017, 97, 266–276. [Google Scholar] [CrossRef]
  24. Liu, H.; Xiao, P.; Xiao, Y.; Chu, J. State-of-the-art review of biogeotechnology and its engineering applications. J. Civ. Environ. Eng. 2019, 41, 1–14. [Google Scholar]
  25. Stocks-Fischer, S.; Galinat, J.K.; Bang, S. Microbiological precipitation of CaCO3. Soil Biol. Biochem. 1999, 31, 1563–1571. [Google Scholar] [CrossRef]
  26. Muynck, W.D.; Belie, N.D.; Verstraete, W. Microbial carbonate precipitation in construction materials: A review. Ecol. Eng. 2010, 36, 118–136. [Google Scholar] [CrossRef]
  27. Xiao, Y.; Wang, Y.; Wang, S.; Evanset, T.M.; Stuedlein, A.W.; Chu, K.; Zhao, C.; Wu, H.; Liu, H. Homogeneity and mechanical behaviors of sands improved by a temperature-controlled one-phase MICP method. Acta Geotech. 2021, 16, 1417–1427. [Google Scholar] [CrossRef]
  28. Zhao, X.; Feng, Q.; Li, J.; Peng, J. Study on Microbial Induced Calcium Carbonate Production at Different Temperatures. Ind. Constr. 2019, 49, 88–92. [Google Scholar]
  29. Peng, J.; Feng, Q.; Sun, Y. Effect of temperature on sand reinforced by microbial induced calcium carbonate deposition. Chin. J. Geotech. Eng. 2018, 40, 1048–1055. [Google Scholar]
  30. Wang, Y.; Wang, Y.; Soga, K.; DeJong, J.T.; Kabla, A.J. Microscale investigations of temperature-dependent microbially induced carbonate precipitation (MICP) in the temperature range 4–50 °C. Acta Geotech. 2022, 18, 2239–2261. [Google Scholar] [CrossRef]
  31. Lv, C.; Tang, C.S.; Zhu, C.; Li, W.Q.; Chen, T.Y.; Zhao, L.; Pan, X.H. Environmental Dependence of Microbially Induced Calcium Carbonate Crystal Precipitations: Experimental Evidence and Insights. J. Geotech. Geoenviron. Eng. 2022, 148, 7. [Google Scholar] [CrossRef]
  32. Deng, J.; Deng, H.; Zhang, Y.; Luo, Y. Experimental Study on Microbial-Induced Calcium Carbonate Precipitation Repairing Fractured Rock under Different Temperatures. Sustainability 2022, 14, 11770. [Google Scholar] [CrossRef]
  33. Yin, L.; Tang, C.; Xie, J.; Lv, C.; Jiang, N.; Shi, B. Factors affecting the improvement of geotechnical material properties by microbial mineralization. Rock Soil Mech. 2019, 40, 2525–2546. [Google Scholar]
  34. Jin, C.; Liu, H.; Guo, M.; Wang, Y.; Zhu, J. Experimental study on tailings cementation by MICP technique with immersion curing. PLoS ONE 2022, 17, e0272281. [Google Scholar] [CrossRef]
  35. Keykha, A. Environmental Factors Affecting the Compressive Strength of Microbiologically Induced Calcite Precipitation-Treated Soil. Geomicrobiol. J. 2017, 34, 10. [Google Scholar] [CrossRef]
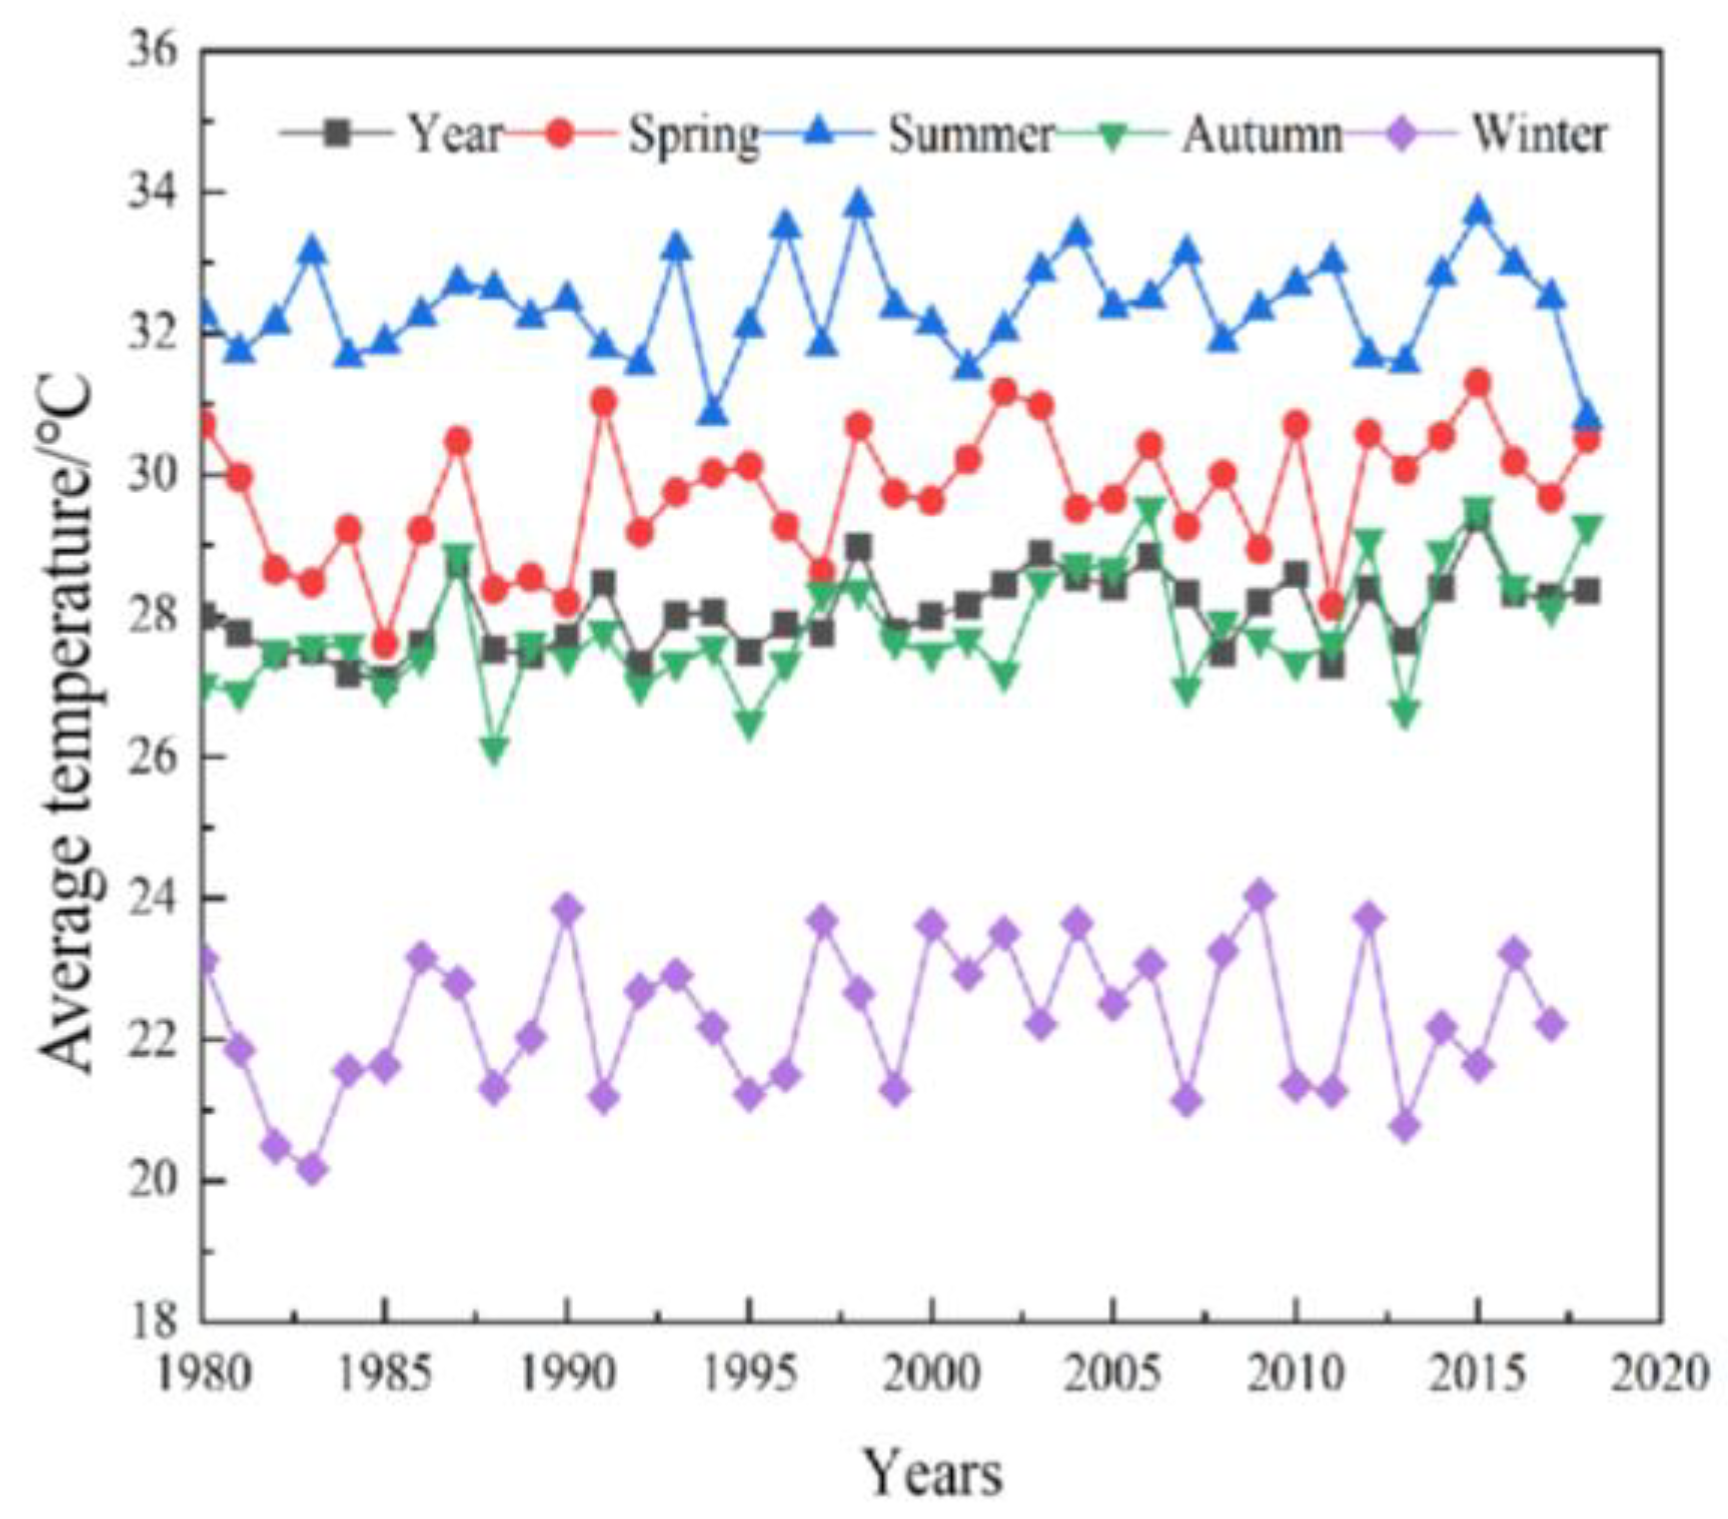
  36. Jia, C.; Zhang, Y. Spatial and temporal characteristics of satellite remote sensing sea surface temperature changes in the coral reef area of the South China Sea for 34 years. Acta Oceanol. Sin. 2018, 40, 112–120. [Google Scholar]
  37. Yang, Q.; Yi, X.; Shi, C. 0 cm ground temperature variation characteristics and related meteorological elements in Hainan Island. Meteorol. Sci. Technol. 2021, 49, 388–398. [Google Scholar]
  38. Chu, J.; Ivanov, V.M.; Stabnikov, V.; Li, B. Microbial method for construction of an aquaculture pond in sand. Geotechnique 2013, 10, 871–875. [Google Scholar] [CrossRef]
  39. Chu, J.; Stabnikov, V.; Ivanov, V. Microbially Induced Calcium Carbonate Precipitation on Surface or in the Bulk of Soil. Geomicrobiol. J. 2012, 29, 6. [Google Scholar] [CrossRef]
  40. Chen, H. Study on the Influence of Gradation on the Compression and Shear Properties of MICP Reinforced Sand. Master′s Thesis, Chongqing University, Chongqing, China, 2019. [Google Scholar]
  41. Xu, W.; Zheng, J.; Chu, J.; Zhang, R.; Cui, M.; Lai, H.; Zeng, C. New method for using N-(N-butyl)-thiophosphoric triamide to improve the effect of microbial induced carbonate precipitation. Constr. Build. Mater. 2021, 313, 125490. [Google Scholar] [CrossRef]
  42. Zhou, Y.; Hu, J.; Wu, Y.; Zeng, H.; Zeng, D.; Wang, Z. Experimental Study on the Preparation of a Highly Active Bacterial Suspension for MICP in the South China Sea. Sustainability 2022, 14, 9748. [Google Scholar] [CrossRef]
  43. Whiffin, V.S. Microbial CaCO3 Precipitation for the Production of Biocement. Ph.D Thesis, Murdoch University, Perth, Australia, 2004. [Google Scholar]
  44. Li, H.; Tang, D.; Yin, L.; Liu, B.; Lv, C.; Wang, D.; Pan, X.; Wang, H.; Shi, B. Experimental study on improving mechanical properties and erosion resistance of calcareous sand by MICP-FR synergistic effect. Chin. J. Geotech. Eng. 2021, 43, 1941–1949. [Google Scholar]
Figure 1. Average temperature changes in Hainan Island from 1980 to 2018.
Sustainability 15 08245 g001
Figure 2. Experimental flow chart.
Sustainability 15 08245 g002
Figure 3. Chemical reagent diagram.
Sustainability 15 08245 g003
Figure 4. SEM test diagram of calcareous sand.
Sustainability 15 08245 g004
Figure 5. XRD test diagram of calcareous sand.
Sustainability 15 08245 g005
Figure 6. CaCO3 generation rate in samples in different temperature environments.
Sustainability 15 08245 g006
Figure 7. Ca2+ conversion rate.
Sustainability 15 08245 g007
Figure 8. Bacterial adhesion rate.
Sustainability 15 08245 g008
Figure 9. Water absorption.
Sustainability 15 08245 g009
Figure 10. Unconfined compressive strength.
Sustainability 15 08245 g010
Figure 11. SEM images. (a,b) Unconsolidated calcareous sand; (c,d) Calcareous sand reinforced at 20 °C; (e,f) Calcareous sand reinforced at 30 °C.
Sustainability 15 08245 g011aSustainability 15 08245 g011b
Table 1. Culture medium formula.
ComponentContent/L
Manganese sulphate10 mg
Nickel chloride24 mg
Ammonium chloride10 g
Yeast extract20 g
Agar powder15 g (added when configuring the solid medium)
Table 2. Experimental scheme.
SchemeSoil Sample Temperature (°C)Bacterial Liquid Temperature (°C)Cementation Liquid Temperature (°C)
20202020
Room temperatureRoom temperatureRoom temperatureRoom temperature
30303030
40404040
Table 3. Effect of temperature on test index.
Temperature (°C)20Room Temperature3040
CaCO3 formation rate3.9211.4314.1510.78
Ca2+ conversion rate8.6125.6431.7124.16
Bacterial adhesion rate10.9114.5417.3128.44
Water absorption25.3223.6321.7221.49
UCS/kPa54815222276.671598
Disclaimer/Publisher’s Note: The statements, opinions and data contained in all publications are solely those of the individual author(s) and contributor(s) and not of MDPI and/or the editor(s). MDPI and/or the editor(s) disclaim responsibility for any injury to people or property resulting from any ideas, methods, instructions or products referred to in the content.

