Abstract
Slopy agricultural lands are more susceptible to soil erosion and hence are priority sites for the application of protective soil management practices. A conservation agriculture field experiment was established at a 6% field slope in 2011 at the ICAR-IISWC Research Farm, Dehradun, Uttarakhand, which is situated in the Northwestern Himalayan Region, India. The objective of this study was to experimentally determine the long-term effects of tillage practices on runoff and soil erosion. The tillage practices opted for were conventional tillage (CT), minimum tillage (MT), and zero tillage (ZT). Event-based runoff and soil loss were monitored during three monsoon seasons (June to September) from 2018 to 2020. Results showed lower runoff and soil loss in the ZT plot than in CT and MT plots. CT produced 1.51 and 2.53 times higher runoff than MT and ZT, respectively. Moreover, this increased runoff generated 1.84 and 5.10 times higher soil erosion in CT than in MT and ZT, respectively. The extreme rainfall events being less than 10% generated 54.93%, 57.35%, and 63.43% of the total runoff volume which resulted in 82.08%, 85.49%, and 91.00% of the total soil loss in CT, MT, and ZT plots, respectively. For the same amount of rainfall, the reduction in soil loss was 39% and 68% in the CT and ZT plots, respectively, at the highest growth stage in comparison to the initial crop growth stage. The values of runoff reduction benefit (RRB) and sediment reduction benefit (SRB) showed a reduction in runoff (63.53%) and soil loss (80.39%) in the CT. Results concluded that conservation tillage reduced runoff and soil loss significantly even in extreme rainfall events.
1. Introduction
Surface soil is in danger of to pervasive soil degradation. Soil degradation, caused by mining, fire, overgrazing, and faulty agricultural practices [1], undermines soil’s ability to meet the needs of future generations for ecosystem services. The growing world population against the backdrop of climate change creates more pressure on soil and other natural resources [2]. Moreover, the conversion of forest land into cropland, especially in hilly terrains, results in severe soil erosion, reduces land productivity, and reduces food production [3].
The Himalayan mountain ecosystems, providing a habitat for over 60 million people, are highly fragile. These communities rely on agriculture on hilly slopes for their livelihood [4]. However, the Himalayan Region of India (HRI) is susceptible to significant soil erosion due to its delicate geology, steep terrain, and heavy rainfall [5,6]. This erosion poses a considerable threat to hill-slope farming, resulting in an estimated loss of 13.4 million tonnes of food grain, equivalent to USD 1.85 billion [6]. Preventing soil erosion has emerged as a major challenge impacting agricultural practices in these hilly regions [7,8,9]. Studies have quantified the role of soil and water conservation technologies, such as trenching, terracing, peripheral bund, contour bund, and check dams, in the reduction of runoff and soil erosion [10,11,12,13]. These technologies control damaging surface runoff, reduce soil loss, and improve crop yield. A large amount of land is also being recovered by adopting these technologies. Most of the farmers of the HRI are subsistence land holders with very low incomes [14,15], and may not be able to afford the construction cost of these technologies. Therefore, HRI farmers are following intensive tillage practices which lead to more runoff and soil erosion and consequent soil degradation. Hence, there is a need for a strategy that can manage damaging surface runoff, improve land productivity, increase cost-effectiveness, and stop further degradation of natural resources. In this context, conservation agriculture (CA) is being recommended worldwide to increase the resiliency of agricultural production systems. CA comprising minimum soil disturbance, crop residue management, and crop diversification provides climate-resilient and carbon-smart systems by improving soil biological, chemical, and physical properties.
The effect of vegetation cover, trenching, afforestation, and biological geotextiles on runoff and soil erosion have been examined [16]. However, there is little information on the effect of different tillage practices (CT—conventional tillage, MT—minimum tillage, and ZT—zero tillage) on runoff and soil erosion on the sloping agricultural fields under the maize–wheat crop rotation system in sub-tropical climatic conditions, where the agro-fragile ecosystem of the Himalayan mountains plays a vital role. The hypothesis was that the use of conservation tillage would reduce runoff and soil loss, even during severe rainfall events. Therefore, the main aim was to examine the impact of conservation tillage on surface runoff and soil erosion over three years and compare it with intensive tillage, as well as to investigate the transition from conventional to conservation agriculture. The research finding will bridge the gap in understanding the prolonged effects of shifting from conventional to conservation tillage on runoff and soil erosion in HRI.
2. Materials and Methods
2.1. Description of the Experimental Site
The conservation agriculture field experiment was established at a 6% field slope in 2011 at the ICAR-IISWC Research Farm, Dehradun, Uttarakhand, which is situated in the Northwestern Himalayan Region, India (Figure 1). The latitude, longitude, and altitude of the field plots are 30°20′40″ N, 77°52′12″ E, and 516 m above MSL, respectively. The present study was conducted in 2018, 2019, and 2020 after the full establishment of the experiment (7–9 years). From the beginning of the experiment, the cultivation of monsoonal maize and winter wheat has been followed. The subtropical climatic condition with strong monsoonal influence prevails on the study site. The mean daily minimum and maximum temperatures are 4 °C and 36 °C, respectively. The average annual rainfall of the experimental site is 1615 mm. Most of the rainfall (80%) is received from July to September due to southwest monsoonal influence. The rest of the rainfall amount is received during the winter season (December to February) through western disturbance. Evaporation data was recorded from an open pan evaporimeter and the values varied from 1.2 to 7.4 mm day−1. All weather data were collected during the study period from the meteorological station of ICAR-IISWC, Dehradun, which is situated near the experimental plots. The soil type of the experimental site is classified as fine mixed hyperthermic Typic Udorthents. The type of soil is entisol and is derived from deep, heavy-textured alluvium. As per the World Reference Base (WRB) for soil resources, it qualifies as fluvisol. Its color ranges from yellowish-brown to dark yellowish-brown, with a granular structure and few gravel and coarse rock fragments (<2%).
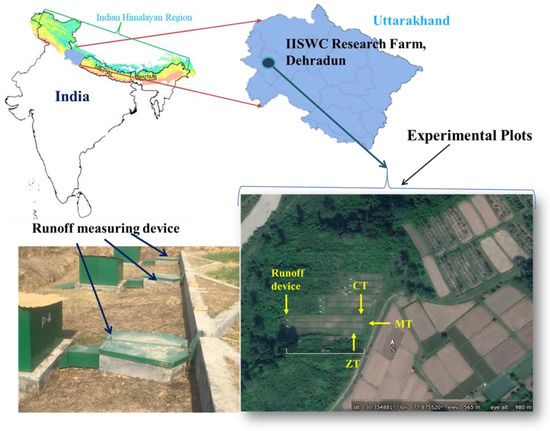
Figure 1.
Experimental plots with runoff and soil loss measurement setup. Two-stage multi-slot divisor with runoff collection tanks.
2.2. Treatment Details and Agronomic Practices
The field experiment was conducted for three years from 2018 to 2020 with the same setup and the same agronomical practices under three different tillage systems, zero tillage (ZT), minimum tillage (MT), and conventional tillage (CT), in a maize–wheat crop rotation system. Table 1 provides an overview of the agronomical activities conducted during the experimentation period. A visual representation of the different development stages of the maize crop is shown in Figure 2. A detailed comparison of the crop’s development stages under various treatments is presented in the supplementary file (Supplement Figures S7–S9). Each tillage treatment had an area of 450 m2 (75 m length and 6 m width) at a slope of 6%. A bund of 35 cm height was constructed from three sides to separate each tillage treatment. A permanent brick masonry structure was constructed at the runoff collection side to avoid any splash effect, seepage, and overturning runoff from the field. The local farming practices were adopted in the CT plot. CT is defined as the thoroughly mechanical manipulation of soil, whereas MT is the minimum disturbance of soil for seedbed preparation. Tractor-drawn tyne cultivators were used for seedbed preparation, and the seed was broadcast manually. Maize seeds were manually sown in rows whereas a crop planter was used for sowing wheat seeds. In the ZT plot, a crop planter was used for the direct sowing of both crops. Since the stubble of the maize crop is fed to animals (farmers’ practice), only 25 cm of stubble was retained in the plots. In 9 years of the experiment, an approximate average residue of 6.94, 5.09, and 5.58 t ha−1 yr−1 was applied to the ZT, CT, and MT plots, respectively.

Table 1.
Crop management practices under different tillage during the investigation period from 2018 to 2020.
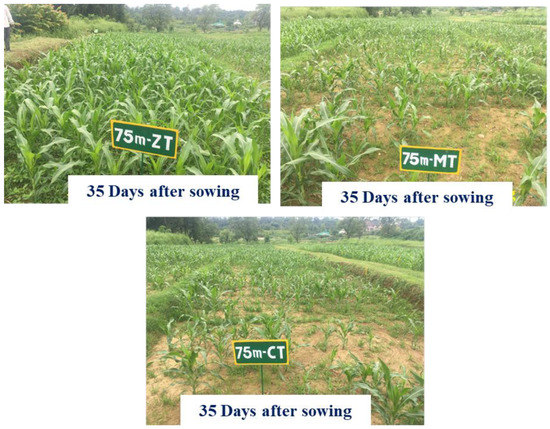
Figure 2.
Pictorial view of different tillage treatments.
2.3. Collection and Analysis of Soil Properties
During the investigation period, triplicate soil samples were collected from each treatment at a depth of 0–10 cm to analyze soil organic carbon (SOC) and particle size distribution (PSD). The method described in [17,18] was used to estimate PSD and SOC. In addition, the textural class of soil was defined according to the USDA system. Soil infiltration rate was measured using a hood infiltrometer, while saturated hydraulic conductivity was estimated by the method described in [19]. The bulk density (BD) of the soil was determined using the core method, which involves collecting samples in a stainless-steel core with a 5 cm internal diameter and 5 cm height. The collected soil samples were then oven-dried at 105 °C for 24 h to obtain their dry weight. The bulk density was calculated by dividing the dry soil weight with the volume of the core [20].
2.4. Measurement and Analysis of Rainfall, Runoff, and Soil Loss
The present study was performed under natural rainfall conditions. Two automatic tipping bucket rain gauges were installed into the ICAR-IISWC experimental premises. One of them was installed adjacent to the experimental plot from where the event-wise breakpoint rainfall data for the three-year duration were collected for evaluating the relationship among rainfall, soil erosion, and runoff. The event-wise rainfall amount, duration, maximum rainfall intensity of different time intervals (5, 10, 15, and 30 min), and the cumulative rainfall during previous days (3, 5, and 7 days) were calculated and analyzed. Moreover, three extreme storm events from 2018, 2019, and 2020 were characterized from the breakpoint data to understand the erosive nature of the storm. In addition to this, the event-wise rainfall erosivity was also calculated by adopting the procedure of [21]. Rainfall erosivity is the product of the kinetic energy (E) of the storm and the 30 min maximum rainfall intensity (I30). Rainfall erosivity was calculated using Equations (1)–(3).
The Rainfall Erosivity Factor (R) was calculated using the following formula:
where:
R = E * I30max
R (MJ mm ha−1 h−1) is the Rainfall Erosivity index;
I30max (mm h−1) is the maximum 30 min intensity in the erosive event;
E (MJ ha−1) is the total storm kinetic energy.
The Energy Index (E) was calculated using the following formula:
where:
E = Σ (e * P)
E is the Energy Index for each storm event;
Σ represents the summation or addition of all the individual values;
e is unit rainfall energy;
P is the rainfall depth in millimeters for each storm event.
The e was calculated using the following formula:
where:
e = 0.119 + 0.0873log10 I
e (MJ mm ha−1) is unit rainfall energy;
I is the intensity of rainfall (mm h−1).
In this study, the event-wise R factor (MJ mm ha−1 h−1) was estimated by calculating event-wise E and multiplying it by I30max. In addition, the unit rainfall energy (e) was calculated using Equation (3) using the 1 min precipitation data. Moreover, if I > 76 mm/h then the e was considered as 0.283, and if I ≤ 76 mm/h then Equation (3) was used to calculate the e value. This index is used to quantify the erosive power of rainfall and assess its potential impact on soil erosion.
Runoff data was measured after each rainfall event from each plot at 08.00 a.m. (local time) using two-stage multi-slot divisors, i.e., 5 × 7 = 35 slots. The first multi-slot divisor had 7 slots, whereas the second had 5 slots (Supplemental Figure S10). The divisors were installed in such a way that only one slot’s runoff was allowed to pass in the second divisor. Moreover, the second divisor was connected to the runoff collection chambers. Based on the designed rainfall, two collection chambers were constructed to accommodate the expected discharge. The capacity of the first collection chamber was 1.00 × 1.00 × 1.17 m3, whereas the second chamber’s capacity was 0.60 × 0.60 × 0.70 m3. Both collection chambers were connected in series. The second chamber received runoff only after the first chamber was filled. In most cases, only the first chamber received runoff. The utmost precaution was taken during the installation of the multi-slot divisors so that no external water was coming into the chambers. A drainage channel was provided to safely discharge the runoff from the collection chambers and experimental plots. Each tank’s collected runoff from each experimental plot was thoroughly stirred, and a 1 L runoff sample was collected in a bottle from each collection tank to measure sediment concentration. Whatman 42 filter paper with a pore size of 2.5 μm was used to filter the resultant suspension. The sediment in the filter paper was placed in the oven-drier for 24 h at 105 °C. When the moisture present in the filter paper evaporated, the dried samples were weighed to obtain the dry sediment weight for each erosive event. The runoff volume was multiplied by the unit sediment concentration (g L−1) to determine the soil loss data from each plot at each erosive runoff event.
To analyze the effect of different tillage practices (CT, MT, and ZT) on runoff and soil erosion, the following two indices were used: (1) Runoff Reduction Benefit (RRB) and (2) Sediment Reduction Benefit (SRB). RRB refers to the runoff reduction in MT and ZT in comparison to the CT plot. The SRB refers to the sediment reduction in MT and ZT plots in comparison to the CT plot. CT plot was considered a control plot. The indices of each runoff event were calculated as follows:
where Rct, Rmt, and Rzt are the runoff amount (mm) from the conventional tillage, minimum tillage, and conservation tillage plots, respectively, and Sct, Smt, and Szt are the soil loss from the conventional tillage, minimum tillage, and conservation tillage plots, respectively.
RRBmt (%) = {(Rct − Rmt)/Rct} × 100, If (Rct − Rmt) > 0, otherwise, {(Rct − Rmt)/Rmt)} × 100
RRBzt (%) = {(Rct − Rzt)/Rct} ×100, If (Rct − Rzt) > 0, otherwise, {(Rct − Rzt)/Rzt} × 100
SRBmt (%) = {(Sct − Smt)/Sct] ×100, If (Sct − Smt) > 0, otherwise, {(Sct − Smt)/Smt} × 100
SRBzt (%) = {(Sct − Szt)/Sct} ×100}, If (Sct − Szt) > 0, otherwise, {(Sct − Szt)/Szt} × 100
Equations (4) and (5) were used to calculate the runoff reduction benefit in MT and ZT plots, respectively. Equations (6) and (7) were used to calculate the sediment reduction benefit in MT and ZT plots, respectively. This provided the mitigation percentage of runoff and soil loss under MT and ZT plots compared with the CT plot.
2.5. Statistical Analysis
Before applying statistical analysis, testing for the normality of data was carried out with SPSS software using the Shapiro–Wilk test. One-way analysis of variance was applied to test the statistical differences in bulk density, soil organic carbon, particle size distribution, aggregate mean weight diameter, and saturated hydraulic conductivity among different tillage practices. Comparison among different treatment means of BD, SOC PSD, and AMWD was performed by Fisher’s LSD (least significant difference test) at p ≤ 0.0552.
3. Results and Discussion
3.1. Soil Properties
The soil of the experimental site was determined to be fine mixed hyper-thermic and was classified as sandy loam [22]. The textural composition of the CT plot was 40% sand, 32% silt, and 27% clay, whereas the ZT plot comprised 39% sand, 35% silt, and 24% clay.
Results of analysis for undisturbed soil samples, depicted in Figure 3A–D, showed that significantly (p ≤ 0.05) higher soil organic carbon was recorded in the ZT plot than in the CT and MT plots (Figure 3A). The ZT plot exhibited 21.12% and 14.66% higher soil organic carbon (SOC) than the CT and MT plots. The increased value of SOC in ZT was also observed in previous studies [23,24,25]. The higher SOC content in conservation tillage practices may be attributed to crop residue retention and subsequent stratification of SOC [26]. The highest aggregate mean weight diameter (AMWD), saturated soil hydraulic conductivity (Ks), and lowest bulk density (BD) values were found in the conservation tillage (ZT) (Figure 3B–D). As a result of crop residue and subsequent stratification [27,28], no-tillage influenced the degree of compaction and increased soil macro porosity, resulting in greater soil aggregation and higher Ks. Moreover, a greater amount of SOC in conservation tillage than in conventional tillage practices was also reflected through significantly (p ≤ 0.05) lower bulk density in ZT.
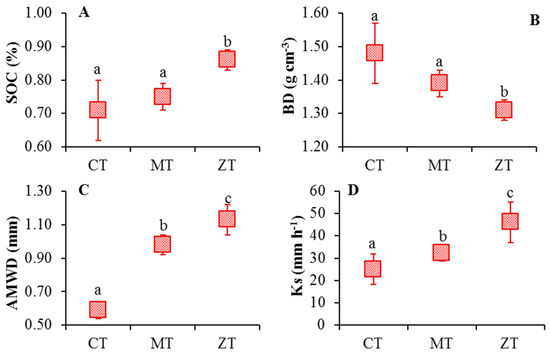
Figure 3.
Soil properties under different tillage treatments. (A) Soil organic carbon, (B) bulk density, (C) aggregate mean weight diameter, and (D) saturated hydraulic conductivity. Treatments are conventional tillage (CT), minimum tillage (MT), and zero tillage (ZT). Non-identical small letters (a, b and c) denoted statistically significant differences (p < 0.05) among the different tillage treatments.
3.2. Rainfall Characteristics
During experimentation (monsoon periods), a total of 130 rainfall events were recorded, of which 53, 39, and 38 events occurred in 2018, 2019, and 2020, respectively. The amount of rainfall observed was 1455.4, 1354.1, and 865.2 mm in 2018, 2019, and 2020, respectively, during the monsoon period (Table 2). Based on the daily rainfall amount, rainfall is classified into five groups as mentioned in the supplement Table S4. Compared with 2018, lower rainfall was observed in 2019 and 2020. Rainfall during 2019 and 2020 was 6.96% and 40.55% lower than 2018. Three extreme storm events from 2018, 2019, and 2020 were characterized and erosivity was determined using the breakpoint data. In 2018, three very heavy rainfall events of above 100 mm, i.e., 110.4 (dated 11 July 2018), 131.3 (dated 6 August 2018), and 145.5 mm (dated 13 August 2018) were recorded. In 2019 and 2020, only one rainfall event (very heavy rainfall) exceeded 100 mm, i.e., 126 (dated 5 September 2019) and 143.10 mm (dated 16 August 2020). In 2019, 10 rainfall events (heavy rainfall) of more than 50 mm were recorded, whereas, in 2020, only two rainfall events of more than 50 mm were observed (Table 2).
Table 2.
Rainfall characteristics during the investigation period from 2018 to 2020 (monsoon season: June to September).
3.3. Effect of Tillage on Surface Runoff
Out of 130 rainfall events observed during the three-year monitoring period, 85 events including 35, 29, and 21 in 2018, 2019, and 2020, respectively, resulted in runoff generation (Table 2). In 2018, the runoff amount varied from 0.98 mm to 87.0 mm in the CT plot, from 0.83 mm to 70.1 mm in the MT plot, and from 0.60 mm to 51.6 mm in the ZT plot (Figure 4A). In 2019, the amount of runoff ranged from 2.26 mm to 89.4 mm in the CT plot, from 1.7 mm to 83.1 mm in the MT plot, and from 0.50 mm to 74.3 mm in the ZT plot (Figure 4B). In 2020, the amount of runoff varied from 1.7 mm to 70.2 mm in the CT plot, from 1.6 mm to 63.2 mm in the MT plot, and 0.85 mm to 46.5 mm in the ZT plot (Figure 4C). The total runoff amount in the CT, MT, and ZT treatments were 631.8, 537.8, and 270.9 mm in 2018 (Figure 4A); 697.9, 624.7, and 401.6 mm in 2019 (Figure 4B); and 14.8, 207.5, and 124.0 mm in 2020 (Figure 4C), respectively.
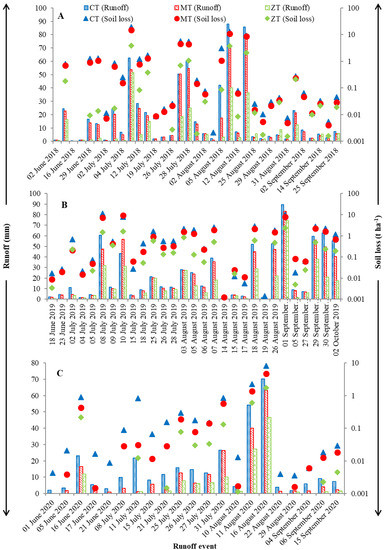
Figure 4.
Runoff and soil loss from each runoff event under different tillage treatments from 2018 to 2020. (A) represents the runoff and soil loss during 2018, (B) represents the runoff and soil loss during 2019, and (C) represents the runoff and soil loss during 2020. Treatments are conventional tillage (CT), minimum tillage (MT), and zero tillage (ZT).
A significant correlation was observed between rainfall and runoff for all treatments (Supplement Figure S1). Among all treatments, ZT showed a significantly higher correlation between rainfall and runoff (R2 = 0.95, p < 0.001), whereas CT (R2 = 0.89, p < 0.001) and MT (R2 = 0.91, p < 0.001) also showed a significant correlation between rainfall and runoff. The amount of runoff from each rainfall event was a result of the intricate interaction between rainfall intensity and rainfall erosivity [29].
Overall, the highest runoff was observed in conventional tillage than in conservation tillage. In 2018, CT produced 1.17 and 2.33 times higher runoff than MT and ZT. The CT plot produced 1.11 and 1.73 times higher runoff in 2019, whereas it produced 1.51 and 2.53 times higher runoff than the MT and ZT plots in 2020, respectively (Figure 4A–C). The reduction in runoff and sediment yield may be attributed to better soil aggregation, higher soil organic carbon, lower bulk density, greater surface roughness, and improved infiltration rate under the ZT and MT plots. Similar findings were reported by others [30,31,32], indicating the role of residues in protecting the soil surface from erosive agents and enhanced soil organic carbon leading to a higher infiltration rate in reduced tillage. The literature shows the similar effects of conservation agriculture on runoff and soil loss, with reduced tillage generating ~30% less runoff than conventional tillage because of surface residue and minimum soil disturbance [33]. Runoff reduction by about 34–45% under no-tillage was also reported from long-term conservation agriculture on sloping land [34].
At the beginning of the monsoon season (mid-June), the differences between the runoff amount among all the tillage treatments (CT, MT, and ZT) were very minimal. The differences widened the withdrawal of the monsoon season (August and September) approaches. These phenomena can be elaborated by the surface storage and higher infiltration rate under conventional tillage due to its increased surface roughness just after tillage during the seedbed preparation (mid-June), whereas, the in conservation plot, residue cover, better soil aggregation, higher soil organic carbon, and greater infiltration rate resulted in the reduction of surface runoff. Moreover, increased surface roughness due to tillage in the conventional plot is time-variant and tends to decrease as rainy seasons progress and the withdrawal of the monsoon season approaches. Similar effects in conservation and conventional tillage in olive orchards has been reported [35]. Increased surface roughness due to cloddy surface just after seedbed preparation in the conventional plot, favoring rainfall infiltration and reducing surface runoff, has been reported [35]. However, this state was not perpetual and, as rainfall occurred, the crusting and sealing of the soil surface set in, resulting to higher runoff [36,37]. The authors of [38] experimented on conventional and conservation tillage practices and reached similar results.
3.4. Effect of Tillage on Soil Loss
3.4.1. Effect of Tillage on Soil Loss
The measured soil loss from the different tillage (CT, MT, and ZT) plots for each runoff event in 2018 to 2020 is presented in Figure 4A–C. The soil loss ranged from 0.0012 to 19.26 t ha−1 in the CT, from 0.0013 to 14.61 t ha−1 in the MT, and from 0.0026 to 3.80 t ha−1 in the ZT during 2018 (Figure 4A). During 2019, the soil loss varied from 0.001 to 11.15 t ha−1 in the CT, from 0.0027 to 7.29 t ha−1 in the MT, and from 0.0033 to 2.32 t ha−1 in the ZT plot (Figure 4B). Soil loss ranged from 0.0031 to 8.14 t ha−1 in the CT, from 0.0016 to 4.67 t ha−1 in the MT, and from 0.0014 to 1.72 t ha−1 in the ZT during 2020 (Figure 4C). The total soil loss was 63.45, 50.53, and 12.44 t ha−1 in 2018, 51.26, 40.24, and 10.49 t ha−1 in 2019, and 14.05, 7.59, and 2.83 t ha−1 in 2020 from CT, MT, and ZT treatments, respectively (Figure 4).
Similar to the correlation between rainfall and runoff, the correlation between rainfall and soil loss was also significantly higher for ZT (R2 = 0.92, p < 0.001) followed by CT (R2 = 0.60, p < 0.001) and MT (R2 = 0.52, p < 0.01), as shown in Supplement Figure S2. Larger amounts of runoff usually triggered increased soil loss across all tillage treatments. A significant correlation was observed between runoff and soil loss in all tillage treatments (Supplement Figure S3). The highest R2 values (0.81 to 0.91) were observed in ZT, whereas the lowest were found in the CT plot (0.59–0.80). In the CT plot, surface roughness due to cloddy surface just after seedbed preparation initially favored rainfall infiltration resulting in runoff reduction; however, this state was not perpetual and, as the rainy season progressed, the crusting and sealing of soil surface began. This transitory surface was the main reason behind the high variability in runoff. In addition, conventional tillage practices typically involve ploughing—thus, disruption of the natural soil structure—which often lead to increased soil erosion and runoff during heavy rainfall events. In contrast, conservation tillage practices, such as no-till or reduced tillage, promote the retention of organic matter, improved soil health, and water infiltration, thus reducing the risk of erosion and runoff. The presence of a plant canopy can also influence the dynamics between rainfall and soil by reducing the quantity of water that directly comes into contact with the soil surface, enhancing soil infiltration, and facilitating water retention. Understanding the complex interplay between rainfall, soil, and the plant canopy under different tillage practices is critical for managing the impacts of agricultural practices on the environment as well as for achieving sustainable agricultural production systems. A similar conclusion was also drawn by [35].
Overall, the highest soil loss was observed in conventional tillage than in conservation tillage (Figure 4A–C). In 2018, CT produced 1.25 and 5.10 times higher soil loss than MT and ZT. A similar trend was observed in 2019 and 2020. It was observed that the CT plot produced 1.27 and 4.88 times higher soil loss in 2019, whereas the soil loss from the CT plot was 1.84 and 4.96 times higher than from the MT and ZT plots in 2020, respectively. Improved soil aggregation, higher levels of soil organic carbon, lower bulk density, greater soil roughness, and enhanced infiltration rate, as well as reduced erosive runoff, are possible factors contributing to the lower soil loss observed in ZT. In addition, the higher plant canopy cover in ZT (Supplement Figures S1–S3) than CT and the improved soil quality were points of advantage. Better crop canopies and residues play a major role in enhancing infiltration and reducing runoff by increasing the surface barrier and intercepting raindrops, thereby limiting the detachment and transport of soil particles [36]. Similar observations were made by other studies [28,33,36]. Similar to our results, Ref. [38] also found up to 60% less soil loss in conservation tillage than in conventional tillage in more than 120 runoff experiments worldwide (~20 countries).
The event-based analysis of soil loss indicates a minimal soil loss from the majority of the runoff events. In 2018, the five largest runoff events generated 54.93, 57.35, and 63.43% of the total runoff and 82.08, 85.49, and 91.00% of the total soil loss from the CT, MT, and ZT plots, respectively (Supplement Figure S3). Almost similar trends were also observed during 2019 and 2020. Out of a total of 85 erosive events in the CT plot, the soils loss due to the 5 biggest events exceeded 10 t ha−1. From the MT plot, only two events generated soil loss exceeding 10 t ha−1, whereas in the ZT plot, no erosive events producing soil loss greater than 10 t ha−1 were recorded. Therefore, it can be stated that soil erosion is prominent in extreme events, but conservation tillage seems to be a suitable protection method.
Even though the differences among runoff amounts from all tillage treatments (CT, MT, and ZT) were very minimal at the beginning of the monsoon season (mid-June), the soil erosion rate was more in CT than in ZT (Figure 4A–C). A rainfall amount of ≥20 mm generated a greater amount of soil erosion in CT than in MT and ZT at the initial crop growth stage (4A). A similar trend was also observed in 2020. However, for similar amounts of rainfall, a different trend was observed in 2019 (Figure 4B). During 2019, there were few small rainfall events after seedbed preparation (less than 10 mm) that settled the disturbed soil surface in the conventional plot. Moreover, as the crop growth progressed, the severity of soil erosion declined across tillage treatments (Figure 4A–C). For a similar amount of rainfall, a 39% reduction in soil loss was recorded at the highest growth stage of the crop in the CT treatment as compared to the initial growth stage. In MT, an intermediate result was found, whereas in ZT, a 68% reduction was observed from the initial to the highest growth stage of the crop for the same rainfall amount. These findings can be attributed to the intensive manipulation of soil for seedbed preparation in conventional tillage that breaks down the soil surface and increases the availability of the erosive material. On such soil surfaces, initial parcels of rainfall largely meet the soil infiltration, but even a small amount of runoff carried a high sediment amount [26]. In addition, residue cover, better soil aggregation, higher soil organic carbon, and greater infiltration rates lead to non-erosive runoff [28,39,40]. The crop canopy at the initial stage was less, but at later stages, it covered almost all the soil surface (Figure 2 and the Supplement file Figures S1–S3). The same amount of rainfall did not generate the same quantity of soil erosion across the crop growth stages. The differences in crop canopy among tillage treatments created difference in amounts of soil erosion (Supplement file Figures S1–S3). A lower soil erosion in conservation tillage than in conventional tillage has been reported [41], and it was found that better residue management created a surface barrier and reduced the impact of a raindrop.
The impact of different tillage treatments on soil loss was also quantified, as shown in Figure 5A–C. In 2018, soil loss from 85% of the total number of erosive events did not surpass 5.54, 4.43, and 0.70 t ha−1 in CT, MT, and ZT, respectively. In 2019, the corresponding soil loss rate was 2.81, 2.17, and 0.85 t ha−1, whereas, in 2020, erosion for only 15% of all events exceeded 0.90, 0.57, and 0.21 t ha−1 in CT, MT, and ZT, respectively. A similar conclusion was reached by [26] after conducting experiments to evaluate the effect of different tillage techniques on soil loss.
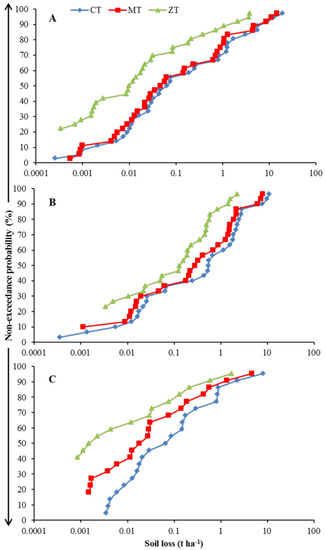
Figure 5.
Cumulative probability of soil losses during (A) 2018, (B) 2019 and (C) 2020 for different tillage treatments. Treatments are conventional tillage (CT), minimum tillage (MT), and zero tillage (ZT).
3.4.2. Effect of Rainfall Erosivity on Soil Loss
The total rainfall erosivity of all erosive storms was 5977.43, 5305, and 3169.42 MJ mm ha−1 h−1 during 2018, 2019, and 2020, respectively (Table 2). The total rainfall erosivity in 2018 was 12% and 88% higher than in 2019 and 2020 (Table 2). This resulted in higher runoff and soil loss. The soil loss from CT during 2018 was 123% and 453% higher than 2019 and 2020, respectively (Figure 4A–C). Similar trends were also found in the MT plot, suggesting a major role of rainfall erosivity in producing greater soil erosion in conventional tillage than in conservation tillage. In the ZT plot, 118% and 5.10% lower soil loss was observed in 2019 and 2020, respectively, than 2018. These differences were partly due to the 40% lower rainfall recorded in 2020, and also because of three extreme and intense rainfall events in 2018. During 2018 and 2019, the intercultural operation was performed by locally made equipment (khurpa) whereas, in 2020, no intercultural operation, only weedicide, was used (Table 2).
A wide range of soil erosion data with high variability observed during the measurement period may be attributed to variability in rainfall events and the capriciousness of soil cover. The present study showed that a similar magnitude of rainfall events generated more soil erosion when it occurred in the early crop growth stage (less canopy cover) than at the peak growth stage. The event-based comparison of rainfall erosivity and soil loss from CT, MT, and ZT is depicted in Figure 6A–C. On average, the soil loss from ZT plots was 0.42 times of the soil loss from the CT plot. This may be due to the combined effect of crop canopy, residue, and surface barrier [41,42,43].
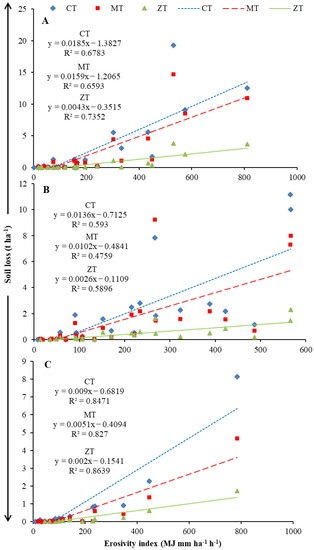
Figure 6.
Impact of storms with similar rainfall erosivity on soil loss during (A) 2018, (B) 2019, and (C) 2020 for different tillage treatments. Treatments are conventional tillage (CT), minimum tillage (MT), and zero tillage (ZT).
Nine largest rainfall events, three events from each year, were chosen from among 130 rainfall events (Supplement Figures S4–S6). Rainfall events of 110.4 mm (on 11 July 2018 when the soil surface was partially uncovered and loose) having rainfall erosivity of 810 MJ mm ha−1 h−1 (Table 2) and maximum 5-min intensity of 120.77 mm h−1 (Supplement Table S1) generating a considerable amount of runoff from CT (62.48 mm), MT (53.95 mm) and ZT (51.68 mm) plots (Figure S4). The soil losses measured from this particular event were 19.26, 14.67 and 3.80 t ha−1 in the CT, MT, and ZT plots, respectively (Figure 4A). It was observed that for runoff reduction to 0.82 times the soil loss reduced to 0.16times in ZT than in the CT. The proportionately higher reduction in soil loss in comparison to the runoff may be attributed to the exposed soil surface in the CT plot due to mechanical disturbance. Long-duration rainfall created a soil surface saturation resulting to greater runoff in all of the tillage plots. Supplement Figure S10b represents a rainfall event of 131.3 mm (on 6 August 2018 at the middle crop growth stage) for which higher runoff but lower soil loss was recorded than the previous event of 110.4 mm. The high antecedent soil moisture of the previous three days rainfall (cumulative rainfall 180.40 mm) resulted in higher runoff whereas the greater crop canopy (Supplement Figures S7–S9) reduced the impact of high rainfall erosivity resulting in lower soil losses. The soil losses were 12.55 in CT, 10.96 in MT and 3.67 t ha−1 in ZT. A rainfall event of 145.5 mm having rainfall erosivity of 539.86 MJ mm ha−1 h−1 with maximum 5-min intensity of 42.30 mm h−1, observed at peak crop growth stage (13 August 2018) generated 85.84 mm, 78.57 mm and 36.47 mm of runoff in the CT, MT and ZT plot (Figure S10c). The soil losses from CT, MT and ZT plots were 9.10, 8.52 and 2.07 t ha−1, respectively. Despite the high amount of runoff generated from all the tillage plots, soil losses were observed about 0.5 times of the soil loss under similar rainfall during the Initial crop growth stage. Similar results were observed in 2019 and 2020, except for the rainfall during the initial stage of crop growth. A small amount of rainfall (<10 mm) after a few days of sowing in 2019 helped settling of the soil and reduced the impact of medium rainfall. Lower rainfall by 40% during 2020 than in 2018 was the main reason behind lower soil loss from all the tillage plots. Rainfall events with infrequent, extraordinary, but high rainfall erosivity played a major role in sediment yield generation (cf. Figure 4B,C and Supplement Tables S2 and S3).
Climate change is predicted to increase the occurrence of infrequent but high-intensity rainfall which is likely to increase soil erosion and runoff [29]. A study conducted on the climate change projection for the Indian Himalayan region reported a considerable change in the rainfall distribution pattern with the annual rainfall amount remaining almost unchanged [44]. Infrequent but high intensity rainfall events forecasted in the Indian Himalayan region [45] may produce higher soil loss. Three extreme (>100 mm) rainfall events were recorded in 2018, whereas in 2019 and 2020 only one extreme rainfall was documented.
3.5. Evaluation of Conservation Tillage on Runoff and Soil Loss Reduction
Evaluation of conservation tillage in comparison to conventional tillage for runoff and soil loss reduction is presented in Figure 7 and Figure 8. During the measurement period, it was observed that soil loss and runoff reduced in conservation tillage as compared to convention tillage. The reduction in runoff was 17.71 and 63.53% whereas, the reduction is soil loss were 26.37 and 80.39% in the MT and ZT plots as compared to CT in 2018. Similar trends were also observed in 2019 and 2020. The highest runoff reduction benefit (RRB) of 77.02% and sediment reduction benefit (SRB) of 89.74% was observed in the ZT plot in 2020. All three tillage treatments, CT, MT and ZT, produced different crop canopy and surface morphology over time. The continuous tilling of the CT plot and the mechanical manipulation of soil during seedbed preparation resulted in a loose, rough, and cloddy surface. Over time, as rainfall occurred, runoff generated hydrostatic pressure that smoothened the soil surface, sealed the pores, and caused crust formation [46,47]. These phenomena caused the reduction of infiltration rate and weakened the soil resistance against detachment which led to greater runoff and soil erosion. Conversely, in the ZT plot, no mechanical manipulations of soil for 7 to 9 years led to a well-developed surface morphology. The improved soil hydraulic and physical properties resulted in less runoff and soil erosion. The overall improved behavior of the ZT plot greatly affected soil loss. Similar observations were also made by other authors [28,36]. Moreover, the lack of soil disturbance due to mechanical manipulation may not be the sole contributor to the reduction in runoff and soil erosion in untilled plots, the effect of crop canopy, residue and improved soil and surface conditions also need to be considered. Field morphology, vegetation, and slope are deeply connected to runoff and sediment yield and they continuously manipulate each other [40]. Similar observations were also recorded in previous studies [31,35,41,48,49].
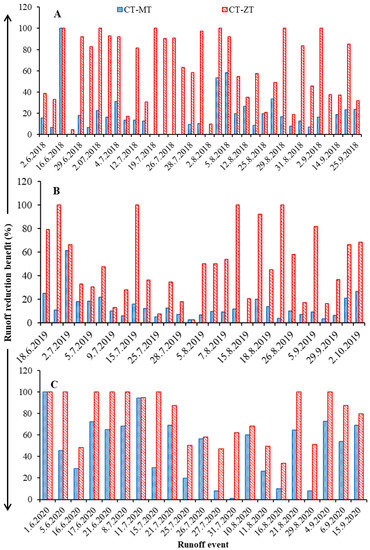
Figure 7.
Runoff Reduction Benefit (RRB) at each runoff event during (A) 2018, (B) 2019 and (C) 2020. Treatments are conventional tillage (CT), minimum tillage (MT), and zero tillage (ZT). In CT-MT and CT-ZT, CT has been used as control.
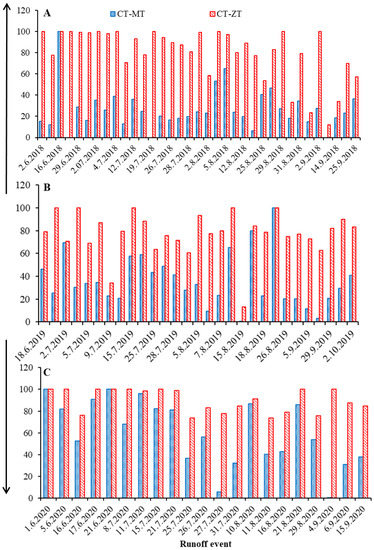
Figure 8.
Sediment Reduction Benefit (SRB) at each runoff event during (A) 2018, (B) 2019 and (C) 2020. Treatments are conventional tillage (CT), minimum tillage (MT), and zero tillage (ZT). In CT-MT and CT-ZT, CT has been used as control whereas, for MT- ZT, MT has been used as control.
The sediment reduction benefit (Figure 8) under ZT was always greater than the runoff reduction benefit (Figure 7) over the entire investigation period. This indicated the greater conservation effect of ZT on soil erosion than runoff. There is local depression for some time to store runoff and sediment due to tillage under CT; however, this local phenomenon is not stable and soon vanishes by the action of precipitation resulting in more soil erosion. This was not the case in the ZT plot, as no-tillage activity had been done for the last seven to nine years that provided more stable and consolidated soil aggregation and surface morphology. Residue on the surface would have also added to surface roughness and infiltration under ZT. Reporting similar results, ref. [50] advocated for conservation tillage as more promising for reducing soil erosion than runoff.
Several studies have investigated the processes of surface runoff and soil loss under different tillage practices. Significantly lower soil erosion under conservation tillage compared to conventional tillage in sloping croplands has been reported [51]. Conservation tillage practices reduced soil erosion and runoff by up to 90% compared to conventional tillage in sloping agricultural fields in Australia [52]. It is not always true that extreme precipitation or high erosivity results in greater runoff and soil loss. The present study corroborates the intricate interaction among rainfall intensity, rainfall erosivity, soil conditions, antecedent rainfall, and the crop canopy that governs runoff and soil erosion considerably. The results confirm our hypothesis that conservation tillage reduces runoff and soil loss even in extreme rainfall events. Therefore, this technique seems to be an appropriate protection measure that may be beneficial to the farmers.
4. Conclusions
The long-term effect of conservation tillage practice on runoff and soil erosion under the slopy cropland of the Indian Himalayan Region was investigated. Conservation tillage was found to be effective in reducing runoff and soil loss in comparison to conventional tillage. The reduction in runoff and soil loss under the conservation tillage were 63.53% and 80.39% in comparison to the conventional tillage plot. The runoff recorded under the convention tillage was 1.51 and 2.53 times higher than MT and ZT, respectively, whereas the soil loss under CT was 1.84 and 5.10 times higher than in MT and ZT, respectively. Proportionally higher soil loss from CT may be attributed to higher soil disturbance and, as a result, higher availability of erodible material. The top 10% (five largest) runoff events generated 54.93, 57.35, and 63.43% of the total runoff volume, resulting in 82.08, 85.49, and 91.00% of the total soil loss from the CT, MT, and ZT plots, respectively. The effect of crop canopy on reducing erosion was lucid, as lesser soil loss was recorded with the progress of crop growth. For the same amount of rainfall, a 39% and 68% reduction in soil loss was recorded at the highest growth stage of crops in the CT and ZT plots, respectively, as compared to the initial crop growth stage. The proportionally higher reduction in soil loss than the runoff under conventional tillage in comparison to the CT indicated the additional role of crop stems, roots, and litterfall, as well as undisturbed soil, and improved soil conditions, in reducing soil loss. Reduced soil disturbance, maintaining crop residue, and practicing supportive soil conservation measures may be effective in reducing soil erosion in the fragile agroecosystem of the Indian Himalayan Region.
Supplementary Materials
The following supporting information can be downloaded at: https://www.mdpi.com/article/10.3390/su15108285/s1. Figure S1: Relation between rainfall and runoff for different tillage treatments from 2018 to 2020. A represents the relation between rainfall and runoff during 2018, B represents the relation between rainfall and runoff during 2019 and C represents the relation between rainfall and runoff during 2020. Treatments are Conventional tillage (CT), Minimum tillage (MT) and Zero tillage (ZT); Figure S2: Relation between rainfall and soil loss for different tillage treatments from 2018 to 2020. A represents the relation between rainfall and soil loss during 2018, B represents the relation between rainfall and soil loss during 2019 and C represents the relation between rainfall and soil loss during 2020. Treatments are Conventional tillage (CT), Minimum tillage (MT) and Zero tillage (ZT); Figure S3: Relation between runoff and soil loss for different tillage treatments from 2018 to 2020. A represents the relation between runoff and soil loss during 2018, B represents the relation between runoff and soil loss during 2019 and C represents the relation between runoff and soil loss during 2020. Treatments are Conventional tillage (CT), Minimum tillage (MT) and Zero tillage (ZT). Figure S4: Characteristics of three extreme rainfall events during 2018; Figure S5: Characteristics of three extreme rainfall events during 2019; Figure S6: Characteristics of three extreme rainfall events during 2020; Figure S7: Plat growth after 10 days from the date of showing under different tillage practices; Figure S8: Plant growth after 35 days from the date of showing under different tillage practices; Figure S9: Plat growth after 55 days from the date of showing under different tillage practices; and Figure S10: Two-stage multi-slots divisor with runoff collection tanks; Table S1: Rainfall characteristics during the investigation period of 2018 (monsoon season: June to September); Table S2: Rainfall characteristics during the investigation period of 2019 (monsoon season: June to September); Table S3: Rainfall characteristics during the investigation period of 2020 (monsoon season: June to September); and Table S4: Rainfall events classification as per Indian Metrologic Department (IMD).
Author Contributions
Conceptualization, data curation, methodology, investigation, writing—original draft, D.S.; validation, visualization, project administration, supervision, A.K.M., S.P. and N.S.; writing—review and editing, A.K.D., C.S.P.O. and V.P.S.; Formal analysis, S.M., D.Y., P.R.O., G.K., D.R.S., L.C. and S.K. Supervision, visualization, writing—review and editing, M.G.M.; software, S.B. All authors have read and agreed to the published version of the manuscript.
Funding
Work is not supported by an external funding agency.
Institutional Review Board Statement
Not applicable.
Informed Consent Statement
Not applicable.
Data Availability Statement
The data used during the study are available from the first author by request.
Acknowledgments
We thank the Indian Council for Agriculture and Research and ICAR-Indian Institute of soil and Water conservation for help and support for this study.
Conflicts of Interest
The authors declare that they have no known competing financial interests or personal relationships that could have appeared to influence the work reported in this paper.
References
- Bhattacharyya, R.; Ghosh, B.N.; Mishra, P.K.; Mandal, B.; Rao, C.S.; Sarkar, D.; Das, K.; Anil, K.S.; Lalitha, M.; Hati, K.M.; et al. Soil degradation in India: Challenges and potential solutions. Sustainability 2015, 7, 3528–3570. [Google Scholar] [CrossRef]
- Singh, D.; Goyal, V.C. Planning of agricultural inputs in Ur watershed to maximize net benefit under limited resources. Indian J. Agric. Sci. 2018, 88, 326–332. [Google Scholar] [CrossRef]
- Sun, D.; Yang, H.; Guan, D.; Yang, M.; Wu, J.; Yuan, F.; Jin, C.; Wang, A.; Zhang, Y. The effects of land use change on soil infiltration capacity in China: A meta-analysis. Sci. Total Environ. 2018, 626, 1394–1401. [Google Scholar] [CrossRef] [PubMed]
- Tewari, V.P.; Verma, R.K.; von Gadow, K. Climate change effects in the Western Himalayan ecosystems of India: Evidence and strategies. For. Ecosyst. 2017, 4, 13. [Google Scholar] [CrossRef]
- Mandal, D.; Chandrakala, M.; Alam, N.M.; Roy, T.; Mandal, U. Assessment of soil quality and productivity in different phases of soil erosion with the focus on land degradation neutrality in tropical humid region of India. Catena 2021, 204, 105440. [Google Scholar] [CrossRef]
- Sharda, V.N.; Dogra, P. Assessment of Productivity and Monetary Losses Due to Water Erosion in Rainfed Crops Across Different States of India for Prioritization and Conservation Planning. Agric. Res. 2013, 2, 382–392. [Google Scholar] [CrossRef]
- Das, A.; Lyngdoh, D.; Ghosh, P.K.; Lal, R.; Layek, J.; Idapuganti, R.G. Tillage and cropping sequence effect on physico-chemical and biological properties of soil in Eastern Himalayas, India. Soil Tillage Res. 2018, 180, 182–193. [Google Scholar] [CrossRef]
- Kagabo, D.M.; Stroosnijder, L.; Visser, S.M.; Moore, D. Soil erosion, soil fertility and crop yield on slow-forming terraces in the highlands of Buberuka, Rwanda. Soil Tillage Res. 2013, 128, 23–29. [Google Scholar] [CrossRef]
- Yadav, G.S.; Das, A.; Babu, S.; Mohapatra, K.P.; Lal, R.; Rajkhowa, D. Potential of conservation tillage and altered land configuration to improve soil properties, carbon sequestration and productivity of maize based cropping system in eastern Himalayas, India. Int. Soil Water Conserv. Res. 2021, 9, 279–290. [Google Scholar] [CrossRef]
- Narain, P.; Singh, R.K.; Sindhwal, N.S.; Joshie, P. Agroforestry for soil and water conservation in the western Himalayan Valley Region of India: 1. Runoff, soil and nutrient losses. Agrofor. Syst. 1997, 39, 175–189. [Google Scholar] [CrossRef]
- Sharda, V.N.; Sena, D.R.; Shrimali, S.S.; Khola, O.P.S. Effects of an intercrop-based conservation bench terrace system on resource conservation and crop yields in a sub-humid climate in India. Trans. ASABE 2013, 56, 1411–1425. [Google Scholar] [CrossRef]
- Singh, G.; Choadhary, G.R.; Ram, B.; Limba, N.K. Effects of rainwater harvesting on herbage diversity and productivity in degraded Aravalli hills in western India. J. For. Res. 2011, 22, 329–340. [Google Scholar] [CrossRef]
- Wolka, K.; Mulder, J.; Biazin, B. Effects of soil and water conservation techniques on crop yield, runoff and soil loss in Sub-Saharan Africa: A review. Agric. Water Manag. 2018, 207, 67–79. [Google Scholar] [CrossRef]
- Ogra, M.V.; Badola, R. Gender and climate change in the Indian Himalayas: Global threats, local vulnerabilities, and livelihood diversification at the Nanda Devi Biosphere Reserve. Earth Syst. Dyn. 2015, 6, 505–523. [Google Scholar] [CrossRef]
- Rahut, D.B.; Micevska Scharf, M. Livelihood diversification strategies in the Himalayas. Aust. J. Agric. Resour. Econ. 2012, 56, 558–582. [Google Scholar] [CrossRef]
- Jat, H.S.; Choudhary, M.; Datta, A.; Yadav, A.K.; Meena, M.D.; Devi, R.; Gathala, M.K.; Jat, M.L.; McDonald, A.; Sharma, P.C. Temporal changes in soil microbial properties and nutrient dynamics under climate smart agriculture practices. Soil Tillage Res. 2020, 199, 104595. [Google Scholar] [CrossRef]
- Piper, C.S. Soil and Plant Analysis, 4th ed.; Inter Science Publishers: New York, NY, USA, 1966. [Google Scholar]
- Walkley, A.; Black, I.A. An examination of the Degtjareff method for determining soil organic matter, and a proposed modification of the chromic acid titration method. Soil Sci. 1934, 37, 29–38. [Google Scholar] [CrossRef]
- Schwärzel, K.; Punzel, J.X. Hood Infiltrometer-A New Type of Tension Infiltrometer. Soil Sci. Soc. Am. J. 1934, 71, 1438–1447. [Google Scholar] [CrossRef]
- Blake, G.R.; Hartge, K.H. Bulk density. In Methods of Soil Analysis, Part I; Klute, A., Ed.; ASA Monograph No. 9; Lewis Publishers: Madison, WI, USA, 1986; pp. 363–376. [Google Scholar]
- Zhao, Y.; Peth, S.; Krümmelbein, J.; Horn, R.; Wang, Z.; Steffens, M.; Hoffmann, C.; Peng, X. Spatial variability of soil properties affected by grazing intensity in Inner Mongolia grassland. Ecol. Model. 2007, 205, 241–254. [Google Scholar] [CrossRef]
- Singh, D.; Mishra, A.K.; Patra, S.; Mariappan, S.; Singh, N. Near-saturated soil hydraulic conductivity and pore characteristics as influenced by conventional and conservation tillage practices in North-West Himalayan region, India. Int. Soil Water Conserv. Res. 2021, 9, 249–259. [Google Scholar] [CrossRef]
- Yadav, D.; Vishwakarma, A.K.; Sharma, N.K.; Biswas, A.K.; Ojasvi, P.R.; Kumar, D.; Kumawat, A.; Singh, D. Sustaining the properties of black soil in Central India through crop residue management in a conservation—Agriculture—Based soybean—Wheat system. Land Degrad. Dev. 2021, 32, 2906–2921. [Google Scholar] [CrossRef]
- Palm, C.; Blanco-Canqui, H.; DeClerck, F.; Gatere, L.; Grace, P. Conservation agriculture and ecosystem services: An overview. Agric. Ecosyst. Environ. 2014, 187, 87–105. [Google Scholar] [CrossRef]
- Patra, S.; Julich, S.; Feger, K.H.; Jat, M.L.; Sharma, P.C.; Schwärzel, K. Effect of conservation agriculture on stratification of soil organic matter under cereal-based cropping systems. Arch. Agron. Soil Sci. 2019, 65, 2013–2028. [Google Scholar] [CrossRef]
- Bhattacharyya, R.; Tuti, M.D.; Kundu, S.; Bisht, J.K.; Bhatt, J.C. Conservation Tillage Impacts on Soil Aggregation and Carbon Pools in a Sandy Clay Loam Soil of the Indian Himalayas. Soil Sci. Soc. Am. J. 2012, 76, 617–627. [Google Scholar] [CrossRef]
- Castellini, M.; Fornaro, F.; Garofalo, P.; Giglio, L.; Rinaldi, M.; Ventrella, D.; Vitti, C.; Vonella, A.V. Effects of no-tillage and conventional tillage on physical and hydraulic properties of fine textured soils under winter wheat. Water 2019, 11, 484. [Google Scholar] [CrossRef]
- Martínez, E.; Fuentes, J.P.; Silva, P.; Valle, S.; Acevedo, E. Soil physical properties and wheat root growth as affected by no-tillage and conventional tillage systems in a Mediterranean environment of Chile. Soil Tillage Res. 2008, 99, 232–244. [Google Scholar] [CrossRef]
- Madarász, B.; Jakab, G.; Szalai, Z.; Juhos, K.; Kotroczó, Z.; Tóth, A.; Ladányi, M. Long-term effects of conservation tillage on soil erosion in Central Europe: A random forest-based approach. Soil Tillage Res. 2021, 209, 104959. [Google Scholar] [CrossRef]
- Lal, R.; Reicosky, D.C.; Hanson, J.D. Evolution of the plow over 10,000 years and the rationale for no-till farming. Soil Tillage Res. 2007, 93, 1–12. [Google Scholar] [CrossRef]
- Lin, J.; Zhu, G.; Wei, J.; Jiang, F.; Wang, M.K.; Huang, Y. Mulching effects on erosion from steep slopes and sediment particle size distributions of gully colluvial deposits. Catena 2018, 160, 57–67. [Google Scholar] [CrossRef]
- Ma, B.; Liu, G.; Ma, F.; Li, Z.; Wu, F. Effects of crop-slope interaction on slope runoff and erosion in the Loess Plateau. Acta Agric. Scand. Sect. B Soil Plant Sci. 2019, 69, 12–25. [Google Scholar] [CrossRef]
- McGregor, K.C.; Bengtson, R.L.; Mutchler, C.K. Effects of incorporating straw residues on interrill soil erosion. Trans. Am. Soc. Agric. Eng. 1988, 31, 82–85. [Google Scholar] [CrossRef]
- Klik, A.; Rosner, J. Long-term experience with conservation tillage practices in Austria: Impacts on soil erosion processes. Soil Tillage Res. 2020, 203, 104669. [Google Scholar] [CrossRef]
- Carretta, L.; Tarolli, P.; Cardinali, A.; Nasta, P.; Romano, N.; Masin, R. Evaluation of runoff and soil erosion under conventional tillage and no-till management: A case study in northeast Italy. Catena 2021, 197, 104972. [Google Scholar] [CrossRef]
- Gómez, J.A.; Sobrinho, T.A.; Giráldez, J.V.; Fereres, E. Soil management effects on runoff, erosion and soil properties in an olive grove of Southern Spain. Soil Tillage Res. 2009, 102, 5–13. [Google Scholar] [CrossRef]
- Kurothe, R.S.; Kumar, G.; Singh, R.; Singh, H.B.; Tiwari, S.P.; Vishwakarma, A.K.; Sena, D.R.; Pande, V.C. Effect of tillage and cropping systems on runoff, soil loss and crop yields under semiarid rainfed agriculture in India. Soil Tillage Res. 2014, 140, 126–134. [Google Scholar] [CrossRef]
- Knapen, A.; Poesen, J. Enhancing the soil’s erosion resistance during concentrated runoff by reducing tillage disturbance. Adv. Geoecol. 2006, 39, 290–300. [Google Scholar]
- Tarolli, P.; Cavalli, M.; Masin, R. High-resolution morphologic characterization of conservation agriculture. Catena 2019, 172, 846–856. [Google Scholar] [CrossRef]
- Zhao, J.; Liu, Z.; Gao, F.; Wang, Y.; Lai, H.; Pan, X.; Yang, D.; Li, X. A 2-year study on the effects of tillage and straw management on the soil quality and peanut yield in a wheat–peanut rotation system. J. Soils Sediments 2021, 21, 1698–1712. [Google Scholar] [CrossRef]
- Xiong, M.; Sun, R.; Chen, L. Effects of soil conservation techniques on water erosion control: A global analysis. Sci. Total Environ. 2018, 645, 753–760. [Google Scholar] [CrossRef]
- Tang, J.L.; Cheng, X.Q.; Zhu, B.; Gao, M.R.; Wang, T.; Zhang, X.F.; Zhao, P.; You, X. Rainfall and tillage impacts on soil erosion of sloping cropland with subtropical monsoon climate—A case study in hilly purple soil area, China. J. Mt. Sci. 2015, 12, 134–144. [Google Scholar] [CrossRef]
- Mhazo, N.; Chivenge, P.; Chaplot, V. Tillage impact on soil erosion by water: Discrepancies due to climate and soil characteristics. Agric. Ecosyst. Environ. 2016, 230, 231–241. [Google Scholar] [CrossRef]
- Skaalsveen, K.; Ingram, J.; Clarke, L.E. The effect of no-till farming on the soil functions of water purification and retention in north-western Europe: A literature review. Soil Tillage Res. 2019, 189, 98–109. [Google Scholar] [CrossRef]
- Song, L.; Boithias, L.; Sengtaheuanghoung, O.; Oeurng, C.; Valentin, C.; Souksavath, B.; Sounyafong, P.; De Rouw, A.; Soulileuth, B.; Silvera, N.; et al. Understory limits surface runoff and soil loss in teak tree plantations of Northern Lao PDR. Water 2020, 12, 2327. [Google Scholar] [CrossRef]
- Dimri, A.P.; Allen, S.; Huggel, C.; Mal, S.; Ballesteros-Cánovas, J.A.; Rohrer, M.; Shukla, A.; Tiwari, P.; Maharana, P.; Bolch, T.; et al. Climate change, cryosphere and impacts in the Indian Himalayan Region. Curr. Sci. 2021, 120, 774–790. [Google Scholar] [CrossRef]
- Gupta, A.; Dimri, A.P.; Thayyen, R.; Jain, S.; Jain, S. Meteorological trends over Satluj River Basin in Indian Himalaya under climate change scenarios. J. Earth Syst. Sci. 2020, 129, 161. [Google Scholar] [CrossRef]
- Chalise, D.; Kumar, L.; Sharma, R.; Kristiansen, P. Assessing the impacts of tillage and mulch on soil erosion and corn yield. Agronomy 2020, 10, 63. [Google Scholar] [CrossRef]
- Singh, D.; Mishra, A.K.; Patra, S.; Mariappan, S.; Singh, N.; Kar, S.K. Spatial variability of soil hydraulic and physical properties in erosive sloping agricultural fields. Water Sci. Eng. 2022, 16, 57–66. [Google Scholar] [CrossRef]
- Zhang, G.S.; Chan, K.Y.; Oates, A.; Heenan, D.P.; Huang, G.B. Relationship between soil structure and runoff/soil loss after 24 years of conservation tillage. Soil Tillage Res. 2007, 92, 122–128. [Google Scholar] [CrossRef]
- Singh, D.; Patra, S.; Mishra, A.K.; Mariappan, S.; Singh, N. Temporal variation of saturated and near-saturated soil hydraulic conductivity and water-conducting macroporosity in a maize-wheat rotation under conventional and conservation tillage practices. Land Degrad. Dev. 2022, 33, 2208–2219. [Google Scholar] [CrossRef]
- Webster, R. Analysis of variance, inference, multiple comparisons and sampling effects in soil research. Eur. J. Soil Sci. 2007, 58, 74–82. [Google Scholar] [CrossRef]


Disclaimer/Publisher’s Note: The statements, opinions and data contained in all publications are solely those of the individual author(s) and contributor(s) and not of MDPI and/or the editor(s). MDPI and/or the editor(s) disclaim responsibility for any injury to people or property resulting from any ideas, methods, instructions or products referred to in the content. |
© 2023 by the authors. Licensee MDPI, Basel, Switzerland. This article is an open access article distributed under the terms and conditions of the Creative Commons Attribution (CC BY) license (https://creativecommons.org/licenses/by/4.0/).