Abstract
Major function-oriented zone (MFOZ) planning is an important blueprint for the spatial development and protection of the Chinese national territory. The “Three Zone Space” (TZS) perspective, including agricultural space, ecological space, and urban space, is an important principle and method for the transformation and diffusion of MFOZ planning to implement territory planning from the central government to local branches. More than ten years have passed since the release of the MFOZ plan in 2010 in China, but there is still a lack of comprehensive and systematic analysis of the dynamic characteristics of the TZS under the impact of MFOZ planning. Therefore, based on high-resolution remote sensing land use data from 2010 to 2020, this paper systematically analyzes the changing characteristics of the TZS on the national scale by reasonably determining TZS areas in China. The main results are as follows: in 2020, the proportions of ecological space, agricultural space, and urban space in China were 78.635%, 20.083%, and 1.282%, respectively. The TZS areas reflected the spatial pattern of MFOZs in China. From 2010 to 2020, the spatial heterogeneity of the TZS changes was significant. In China, agricultural space and ecological space as a whole showed a decreasing trend, with dynamic degrees of −0.05% and −0.04%, respectively, while urban space showed a significant expansion trend, with a dynamic degree of 4.69%. The temporal change processes of the TZS in the periods of 2010–2015 and 2015–2020 were noticeably different. The agricultural space first showed an increasing trend and then a decreasing trend. The ecological space showed a decreasing trend in the two periods, while the urban space showed a significant expansion trend in the two periods. From 2010 to 2020, the urban spatial structure of the optimized development zones tended to be stable, and the ecological space reduction in the key ecological function zones has gradually been curbed, but the agricultural space in the main agricultural production zones has shown a slight decline. On the whole, the dynamic changes in the TZS from 2010 to 2020 in China are basically in line with the governance objectives of territorial space. The reasonable allocation and development of the “three zone space” is of great significance for protecting the natural and ecological environment.
1. Introduction
Territorial space is the backdrop to human survival and development, as well as an important resource guarantee for each country to promote the sustainable development of human society and comprehensive national power [1,2,3,4]. A series of problems, such as resource and food security, climate change, and rapid urbanization, have made it a practical need for countries around the world to study how to use national land space on a larger spatial and temporal scale to rationally solve resource and environmental problems [5,6]. Since the 1970s, China has experienced rapid social and economic development and accelerated urbanization and industrialization under the impetus of “Reform and Open Policy” and accession to the World Trade Organization. However, due to the lack of proper top-level design, the inefficient waste and exploitation of spatial attributes are common in territorial spatial development and utilization in China [7,8]. To effectively instruct the pattern and direction of territorial space development, Fan et al. used the method of comprehensive regionalization to prospectively propose the first basic pattern of territorial spatial protection and utilization in China, which was released by the State Council in 2010 as a plan for major function-oriented zones [9]. In 2015, as the development goal of “Beautiful China” was incorporated into the 13th Five-Year Plan, major function-oriented zone planning further became an important basis for the grand blueprint of “Beautiful China” [10].
Since 2010, based on major function-oriented zone planning, a large number of studies have been conducted on a wide range of scientific issues in various spatial dimensions, such as municipal [11,12], provincial [13,14], watershed [15,16], and national dimensions [7,17], including methods for refining [18] and optimizing [19] MFOZ planning, changing land use structure [20], assessing ecological environmental protection [21], designing an ecological compensation system [22], and evaluating government performance [23]. Among them, the conversion from MFOZs to grassroots land space and the implementation of MFOZs are important elements in current territory planning research [24]. MFOZ planning primarily takes the county as the basic spatial unit for the division of the main functions. At the level of counties (districts) and townships, the primary focus is no longer on the “main function”, as this is downscaled to more specific and clear territorial functions, such as functional zoning, land use type zoning, and land use planning [24]. “Three Zone Space” (TZS) and “Three Zones and Three Lines” (TZTLs) are important land use classification methods for territory planning and are also important methods for reinforcing the connection between MFOZ planning and territory planning. They are of great significance for protecting the natural and ecological environment. The “three living spaces” refer to production spaces, living spaces, and ecological spaces. Correspondingly, the “three zones” space in the “three zones and three lines” refers to agricultural space, ecological space, and urban space. Compared with the TZS method, the TZTL method is more complex in terms of regional functional features and is also more difficult to determine, so this method requires more detailed land use data [25]. Therefore, it is more appropriate to use the TZS method as the spatial classification method for analysis on large and medium scales [26].
It has been more than ten years since the release of the major function-oriented zone plan. A comprehensive and systematic analysis of the evolving characteristics of TZS under MFOZ planning is important for an in-depth understanding of China’s territorial spatial structure, and it could also provide an important reference for optimizing the territory planning scheme and improving the level of territorial spatial governance in the future. Long-term series of high-accuracy remote sensing data of land use/land cover are crucial for monitoring changes in large-scale land spatial patterns. Based on high-accuracy land use remote sensing data from 2010, 2015, and 2020, in our research, according to the corresponding geographical functional characteristics, nationwide agricultural space, ecological space, and urban space were determined. The spatial and temporal evolving patterns of the “Three Zone Space” under the influence of MFOZ planning from 2010 to 2020 were systematically analyzed.
2. Data and Methods
2.1. Land Use Dataset
The land use datasets used in our study mainly included Landsat TM data, Landsat 8 OLI data, and GF-1 data from 2010, 2015, and 2020. Multi-period land use remote sensing monitoring datasets (https://www.resdc.cn/, accessed on 13 May 2023) were obtained based on spatial data processing software such as ArcGIS and ENVI, using the human–computer interaction interpretation method on the basis of geological knowledge.
The dataset was built according to consistent interpretation standards, thus ensuring the accuracy of remote sensing manual interpretation. The quality and accuracy of the data were evaluated by acquiring a large number of land-type samples in the forms of camera photos and high-resolution remote sensing images during zoned and grouped field trips nationwide. The final accuracy evaluation results showed that the comprehensive evaluation accuracy of first-level classes was over 93% and that of second-level classes was over 90% [27,28]. The land use types classified in our dataset mainly included 6 first-level classes, including cropland, woodland, grassland, water bodies, built-up land, and unused land, and 25 second-level classes [29].
2.2. National Zoning Data of the Main Functional Areas
The data on major function-oriented zones (MFOZs) used in our research were obtained from National Main Functional Area Planning, issued by the State Council, and the Main Functional Area Zoning Plan of China (V1.0) [9]. According to the development mode, the MFOZs were divided into optimized development zones, key development zones, restricted development zones, and prohibited development zones. Moreover, the restricted development zones were divided into main agricultural production zones and key ecological function zones. Optimized development zones are areas with high comprehensive strength, large economic scale, sound urban and rural construction systems, close internal economic ties, and strong innovation capability in terms of science and technology; they include Bohai Rim, Yangtze River Delta, the Pearl River Delta Region, etc. Key development zones are usually areas with a strong economic basis, initial urban and rural construction systems, and the ability to induce surrounding areas to develop; they include 18 regions, among which are the middle reaches of the Yangtze River, south and central Hebei Province, and the Central China Economic District. Restricted development zones are major agricultural production areas and key ecological function areas where large-scale and high-intensity urban construction is restricted. Prohibited development zones are strict ecological protection zones where industrial and urban development is prohibited [13]. Since prohibited development zones are functional zones superimposed on the first three types of functional zones and their area is relatively small, they were not considered in our paper. Considering that there are no substantial differences in the definitions of national and provincial functional areas, these were combined and analyzed as a whole in this paper (Figure 1).
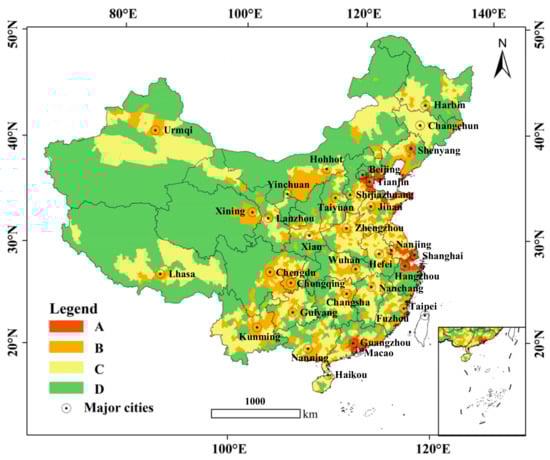
Figure 1.
Distribution of MFOZs in China (A: optimized development zones; B: key development zones; C: main agricultural production zones; D: key ecological function zones).
2.3. Classification System of the “Three Zone Space”
Our research considered the physical connotation of the “Three Zone Space” (TZS) and the leading functions using second-level class land use data. Urban space refers to land space whose main function is production and urban living, with further functions being urban construction and urban economic development. Ecological space refers to a territory with natural attributes whose main function is to provide ecological services or ecological products. Agricultural space refers to a territory whose main function is agricultural production, with further functions being rural life functions [24,25,30]. In this research, we performed the classification of TZS based on land use data (Table 1). Urban built-up and other construction land types were classified as urban space. Woodland, grassland, water bodies, and unused land were classified as ecological space. Cropland and rural settlements were classified as agricultural space.

Table 1.
Classification of the “Three Zone Space” based on land use data.
2.4. “Three Zone Space” Dynamic Degree
Dynamic degree is a concept commonly used in research on land use change [31,32,33]. It is used in our paper to reflect the characteristics of the area evolution and spatial change in urban space, ecological space, and agricultural space in a certain time period. Dynamic degree refers to the change rate of a specific space type in a period of time and can be used to indicate the evolution speed and magnitude of different geographical functional spaces in a certain period of time.
where is the dynamic degree of a space type in a specific time period, is the area of the space type at the beginning of the time period, is the area of the space type at the end of the time period, and is the length of the time period.
This paper calculated the TZS dynamic degrees of the MFOZs (each county/district) in 2010–2015 and 2015–2020. At the same time, the difference between the dynamic degrees of 2015–2020 and those of 2010–2015 was calculated in order to analyze the dynamic evolving characteristics of TZS during different time periods.
3. Results
3.1. Analysis of “Three Zone Space” Patterns in China in 2020
In 2020, the area proportions of ecological space, agricultural space, and urban space in China were 78.635%, 20.083%, and 1.282%, respectively (Table 2). In terms of spatial distribution (Figure 2), ecological space was mainly and extensively distributed in the central and western regions of China. Agricultural space displayed an aggregated distribution in the Northeast Plain, the North China Plain, the Middle and Lower Yangtze River Plain, and the Sichuan Basin. Urban space was mainly distributed in the eastern regions of China, sporadically embedded in agricultural space. The aggregation of urban space was significant in the Beijing–Tianjin–Hebei Region, the Yangtze River Delta, and the Pearl River Delta.
Table 2.
“Three Zone Space” area percentages in each MFOZ in China in 2020 (%).
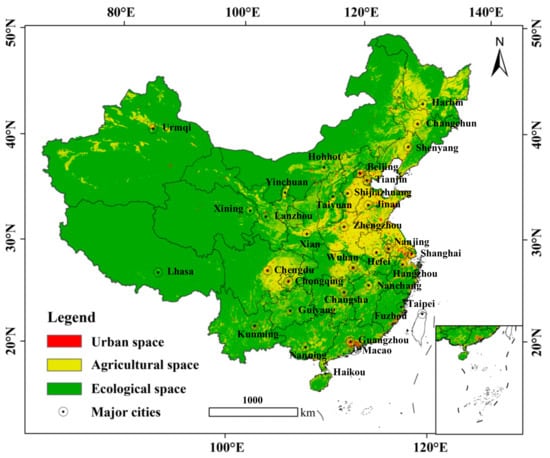
Figure 2.
“Three Zone Space” distribution in MFOZs in China in 2020.
Regarding the distribution of TZS in different MFOZs (Table 2), ecological space was mainly distributed in the key ecological function zones and main agricultural production zones, and ecological space in the key ecological function zones accounted for the highest proportion, 53.782%. Agricultural space was mainly distributed in the main agricultural production zones and key ecological function zones, and the agricultural space in the main agricultural production zones accounted for the highest proportion, 8.836%. Moreover, urban space was mainly distributed in the key development zones, with a proportion of 0.515%.
In 2020, the proportional structure of the areas of TZS in each county (district) in China significantly varied (Figure 3). In counties whose main function was optimal development or key development, the areas of urban space accounted for high proportions, with averages of 18.90% and 7.93%, respectively. In contrast, there were many counties with a low proportion of urban space, and there was more room for urban space expansion in these counties. In districts and counties with agricultural production as the main function, agricultural space accounted for 51.86% on average. In districts and counties whose main function was ecology, ecological space accounted for 77.41% on average. Figure 3 shows that the urbanization rate was generally low in districts and counties whose main function was agricultural production or ecology, and the differences in the distribution among the districts and counties were small.
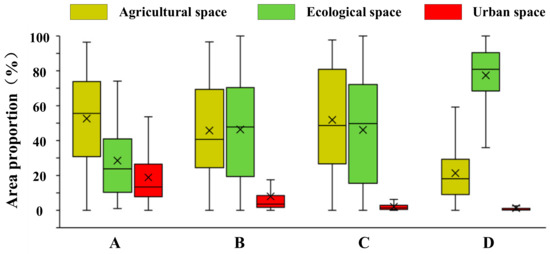
Figure 3.
Box plot of the “Three Zone Space” area proportion by county (district) in MFOZs in 2020 (A: optimized development zones; B: key development zones; C: main agricultural production zones; D: key ecological function zones). (The upper horizontal line, middle horizontal line, lower horizontal line, and × in the box represent the upper quartile, median, lower quartile, and mean of the area proportion, respectively).
3.2. Spatial and Temporal Evolution Characteristics of the “Three Zone Space” from 2010 to 2020
Regarding the spatial changes in the TZS in 2010–2020 (Table 3), agricultural space slightly decreased, with a net decrease of 9550.07 km2 and a dynamic degree of −0.05%. There was also a decrease in ecological space, which showed a decrease of 29,180.35 km2 and a dynamic degree of −0.04%. Meanwhile, the urban space area showed a significant increase, with a net increase of 38,749.14 km2 and a dynamic degree of 4.69%. The increase in agricultural space mainly occurred in Northeast China and Xinjiang region and was mainly due to the reclamation of forests and grasslands (in Northeast China) and the reclamation of unused land (in Xinjiang region). The increase in agricultural space was also relatively concentrated in the area west of Lanzhou in Gansu Province, while the decrease in agricultural space was widely distributed in East China, Central China, and South China. The increase in ecological space mainly took place in the provinces of Jilin and Hubei, while the decrease in ecological space was concentrated in Xinjiang and North China. The conversion of agricultural space and ecological space occurred in the provinces of Xinjiang, Hubei, and Heilongjiang in Northeast China. In China, from 2010 to 2020, urban space was dominated by expansion, and the phenomenon was significant in the regions surrounding provincial capitals such as Tianjin, Changchun, Shenyang, Urumqi, Wuhan, Chongqing, and Changsha. This expansion was greatly based on encroachment on surrounding agricultural space and ecological space (Figure 4).
Table 3.
National “Three Zone Space” change statistics for the period of 2010–2020.
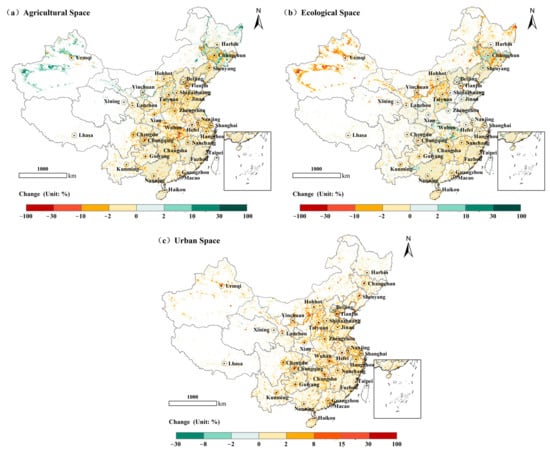
Figure 4.
Spatial changes in the “Three Zone Space” in MFOZs from 2010 to 2020 (changes in area shares in a 10 km grid).
Regarding the changes in the TZS during the two periods (Figure 5), 2010–2015 and 2015–2020, agricultural space increased in the first period and then decreased, and the net increase in the agricultural space area in 2010–2015 was 1921.29 km2, with a dynamic degree of 0.02%. The net decrease in agricultural space in 2015–2020 was 11,471.36 km2, with a dynamic degree of −0.12%. The overall increase in agricultural space in 2010–2020 mainly occurred in Xinjiang and Northeast China in 2010–2015. Ecological space showed a trend of decrease in both time periods (2010–2015 and 2015–2020). Ecological space decreased on a large spatial scale in the earliest period considered. From 2010 to 2015, ecological space greatly decreased in Xinjiang, Northeast China, and North China. Urban space showed a significant expansion trend in both time periods. Areas mainly expanded in the first period (2010–2015) compared with the second period (2015–2020), and local areas, such as those surrounding Taiyuan in Shanxi Province, expanded more in the latest period than in the earliest period considered.
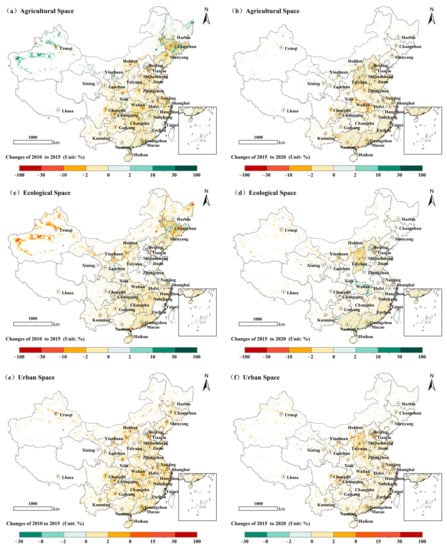
Figure 5.
Changes in the “Three Zone Space” in MFOZs during the time periods of 2010–2015 and 2015–2020 (change in proportions of areas in a 10 km grid).
3.3. Dynamic Evolution of the “Three Zone Space” in Each MFOZ from 2010 to 2020
In terms of the dynamic changes in the TZS in each type of MFOZ (Table 4), the urban spatial structure of the optimized development zones tended to be generally stable. The expansion rates of urban space in the key development zones, main agricultural production zones, and key ecological function zones were significant. The expansion rates of urban space in the key development zones, main agricultural production zones, and key ecological function zones were significantly higher than those of agricultural space and ecological space. The expansion of urban space mainly occurred in the main agricultural production zones and key ecological function zones, with dynamic degrees of 6.19% and 6.14%, respectively. Regarding the two periods of 2010–2015 and 2015–2020, the rate of urban space expansion was significantly higher in the first period than in the second period. In 2010–2015, the dynamic degree of urban space expansion in the agricultural production zones and key ecological zones reached peak values, 8.09% and 7.80%, respectively. In 2010–2020, the agricultural space in the optimized development zones and key development zones noticeably decreased, with dynamic degrees of −0.30% and −0.21%, respectively. In contrast, agricultural space increased in the key ecological function zones, with a dynamic degree of 0.08%. Based on the spatial changes during the two time periods, agricultural space first increased and then reduced. Ecological space in all types of MFOZs decreased; the ecological space area in the optimized development zones decreased at a relatively large rate, with a dynamic degree of −0.27%. Comparing the two time periods, the dynamic degree of ecological space in the key ecological function zones was −0.04% in the first period and 0% in the second period, which showed that the change in ecological space in the key ecological function zones gradually tended to be stable.
Table 4.
“Three Zone Space” dynamic degrees (%) in 2010–2020.
4. Discussion and Conclusions
Based on remote sensing monitoring data on land use in China from 2010, 2015, and 2020, this paper has systematically analyzed the characteristics of area proportion and spatial distribution and the spatiotemporal dynamics of the TZS in China by reasonably determining agricultural space, ecological space, and urban space, with the aid of National Main Functional Area Planning. The main conclusions are as follows:
(1) In 2020, the proportions of ecological space, agricultural space, and urban space in China were 78.635%, 20.083%, and 1.282%, respectively. The areas of TZS reflected the spatial patterns of the MFOZs in China. In the key ecological function zones, ecological space covered most of the area (53.782%). In the main agricultural production zones, agricultural space accounted for 8.836% of the total area, while urban space was mainly distributed in the key development areas, accounting for 0.515%.
(2) From 2010 to 2020, in China, agricultural space and ecological space as a whole showed a decreasing trend, with dynamic degrees of −0.05% and −0.04%, respectively, while urban space showed a significant expansion trend, with a dynamic degree of 4.69%. The spatial heterogeneity of the TZS changes was noticeable. The changes in Tibet, Qinghai, and other regions in China were relatively small. The increase in agricultural space in Xinjiang and Northeast China was relatively significant. Ecological space increased in the provinces of Jilin and Hubei, while the expansion of urban space in the areas surrounding the capital cities, such as Tianjin, Changchun, Shenyang, Urumqi, Wuhan, Chongqing, Changsha, and other cities, was the most significant.
(3) The temporal change processes of the TZS in the periods of 2010–2015 and 2015–2020 were noticeably different. Agricultural space first showed an increasing trend and then a decreasing trend. In Xinjiang and Northeast China, it significantly increased from 2010 to 2015. Ecological space showed a decreasing trend in the two periods, and the spatial reduction in the earliest period was significantly higher than that in the latest period considered, especially in Xinjiang, Northeast China, and North China, while urban space showed a significant expansion trend in the two periods. The spatial expansion of urban space in most areas in the earliest stage was greater than that in the latest stage; however, the magnitude of expansion in some areas, such as Taiyuan in Shanxi Province, was greater than that in the earliest stage.
(4) On the whole, from 2010 to 2020, the urban spatial structure of the optimized development zones tended to be stable, while the urban spatial expansion speed of the key development zones, the main agricultural production zones, and the key ecological function zones was significant. In particular, from 2010 to 2020, the main agricultural production zones and key ecological function zones had the highest expansion rate of urban space, with dynamic degrees of 6.19% and 6.14%, respectively. In contrast, from 2010 to 2020, agricultural space most significantly decreased in the optimized development zones and the key development zones but increased in the key ecological function zones. Agricultural space in the main agricultural production zones first increased and then slightly decreased in the two periods, while ecological space in the key ecological function zones decreased in the first period and then gradually became stable.
MFOZs reflect the basic pattern of land space in China and also provide a basis for relevant land space governance. Optimized development zones are usually the most economically developed and populated areas in China. However, because of the over-transformation of the natural ecosystems in the optimized development zones due to human activities, this poses a great risk to sustainability. Therefore, controlling the designation of construction land and promoting the conservation of ecological space in optimized development zones are important objectives in the territorial spatial governance of optimized development zones. Key development zones are usually areas with environmental carrying capacity above the average level in China. Making full use of resource endowments, promoting environmental services, strengthening urban construction, and absorbing the labor of the main agricultural production zones and the key ecological function zones are important goals for the territorial spatial governance of the key development zones. The main agricultural production zones and the key ecological function zones are restricted development zones with weak resource-carrying capacity, but they have extremely important purposes to guarantee food security and ecological safety in China.
Insisting on giving priority to arable land protection and ecological protection is an important goal in land space governance. According to the dynamic changes in the TZS in MFOZs from 2010 to 2020, the governance of land space is in line with the above objectives in China. The expansion of urban space in optimized open areas is small and gradually slowing down. Ecological space was initially encroached on in the earliest period considered, but it eventually increased. The proportion of agricultural space in the main agricultural production zones and that of ecological space in the key ecological function zones have been gradually stabilizing, which altogether indicates that MFOZ planning has achieved a good outcome in China and provides intentional ideas for addressing the issues surrounding uncertainty and the sustainable development of rural areas and agricultural industries.
Author Contributions
Conceptualization, X.X. and R.N.; data curation, Z.S. and X.D.; formal analysis, R.N. and Z.S.; writing—original draft preparation, R.N.; writing—review and editing, X.X. All authors have read and agreed to the published version of the manuscript.
Funding
This research was funded by the National Key Research and Development Program of China (No.2021YFD1500101), the National Natural Science Foundation of China (No.41971389), and the Major Special Project of High Resolution Earth Observation System (Civil Part) (No.00-Y30B01-9001-22/23-CY-08).
Institutional Review Board Statement
Not applicable.
Informed Consent Statement
Not applicable.
Data Availability Statement
The land use datasets originate from remote sensing monitoring datasets. This can be queried at the following link: https://www.resdc.cn/ (accessed on 13 May 2023).
Conflicts of Interest
The authors declare no conflict of interest.
References
- Liu, H.; Gao, X.L.; Liu, S.H. The foreign territory development patterns and its inspirations. World Reg. Stud. 2008, 17, 38–46+37. [Google Scholar]
- Lovell, S.T. Multifunctional urban agriculture for sustainable land use planning in the United States. Sustainability 2010, 2, 2499–2522. [Google Scholar] [CrossRef]
- Fan, J.; Zhou, K.; Chen, D. Innovation and practice of economic geography for optimizing spatial development pattern in construction of ecological civilization. Econ. Geogr. 2013, 33, 1–8. [Google Scholar]
- Lambin, E.F.; Meyfroidt, P. Global land use change, economic globalization, and the looming land scarcity. Proc. Natl. Acad. Sci. USA 2011, 108, 3465–3472. [Google Scholar] [CrossRef] [PubMed]
- Kramer, D.B.; Hartter, J.; Boag, A.E.; Jain, M.; Stevens, K.; Nichoals, K.A.; McConnell, W.J.; Liu, J.G. Top 40 questions in coupled human and natural systems (CHANS) research. Ecol. Soc. 2017, 22, 44. [Google Scholar] [CrossRef]
- Liu, H.; Fan, J.; Li, Y. “America 2050” strategic spatial planning and its inspiration to China. Geogr. Res. 2013, 32, 90–98. [Google Scholar]
- Liu, J.Y.; Liu, W.C.; Kuang, W.H.; Ning, J. Remote sensing-based analysis of the spatiotemporal characteristics of built-up area across China based on the plan for major function-oriented zones. Acta Geogr. Sin. 2016, 71, 355–369. [Google Scholar]
- Song, R.; Hu, Y.C. Comprehensive zoning of land consolidation potential in cities of China and optimization pathways. J. Geo-Inf. Sci. 2020, 22, 1522–1531. [Google Scholar]
- Fan, J. Draft of major function oriented zoning of China. Acta Geogr. Sin. 2015, 70, 186–201. [Google Scholar]
- Chen, M.X.; Liang, L.W.; Wang, Z.B.; Zhang, W.Z.; Yu, J.H.; Liang, Y. Geographical thinking on the relationship between beautiful China and land spatial planning. Acta Geogr. Sin. 2019, 74, 2467–2481. [Google Scholar]
- Liu, J.H.; Zheng, X.Q. City-level main functional division based on improved ecological footprint model. Trans. Chin. Soc. Agric. Eng. 2013, 29, 226–236. [Google Scholar]
- Mao, J.X.; Li, Y.L.; Lu, X.X.; Liu, X.Y. Strategic transmission path of main functional areas in Nanning Territory Spatial Master Plan. Planners 2021, 37, 30–37. [Google Scholar]
- Yu, C.J.; Wang, Q. A study on the spatiotemporal pattern changes of “Agricultural-living & Non-agricultural production-ecological” in different major function-oriented zones of Fujian Province. J. Fujian Norm. Univ. (Nat. Sci. Ed.) 2019, 35, 90–99. [Google Scholar]
- Wen, S.F.; Shan, B.Q.; Ma, J.; Deng, W. Surface water environmental carrying capacity in water-deficient areas: A case study on Jingjinji and the five Northwestern Provinces and Autonomous Regions in China. Strateg. Study CAE 2017, 19, 88–96. [Google Scholar]
- Tian, L.L.; Zeng, J.X.; Dong, Y.; Liu, H.T.; Luo, J. Research on the synergistic development between economic zone and major function oriented distribution of Hanjiang basin. J. Cent. China Norm. Univ. (Nat. Sci.) 2016, 50, 435–442. [Google Scholar]
- Wu, D.; Zou, C.X.; Lin, N.F.; Xu, M.J. Characteristic analysis of ecological status in the Yangtze River Economic Belt based on the plan for major function-oriented zones. Resour. Environ. Yangtze Basin 2018, 27, 1676–1682. [Google Scholar]
- Chen, Z.Q. Regional Comparative Assessment of Biodiversity Conservation Effectiveness in National Key Ecological Function Areas; Jilin University: Jilin, China, 2021. [Google Scholar]
- Xie, Y.Q.; Zhang, T.; Zeng, P. Research on subdivision method of main functional area in provincial territorial planning. City Plan. Rev. 2021, 45, 9–15. [Google Scholar]
- Luo, Y.; Jiang, G.X.; Chen, S.J.; Liu, Q. Exploration of territorial planning based on “double evaluations” and optimization of main functional area. City Plan. Rev. 2022, 46, 7–17+52. [Google Scholar]
- Xu, J.; Pan, H.Y.; Huang, P. Carbon emission and ecological compensation of main functional areas in Sichuan Province based on LUCC. Chin. J. Eco-Agric. 2019, 27, 142–152. [Google Scholar]
- Yang, Y.; Liu, D.; Xu, M.J.; Sun, J.; Zhang, K.; Chou, J. Research on environmental policies of functional zones under the new pattern of land spatial development and protection. Environ. Prot. 2021, 49, 20–26. [Google Scholar]
- Wang, W.W.; Ye, J.; Zhang, L.G.; Wei, C.; Zhang, H.W.; Liu, H.H. Research on ecological compensation from the perspective of main functional area: A case study of Hubei Province. Acta Ecol. Sin. 2020, 40, 7816–7825. [Google Scholar]
- Wang, C.S.; Zhu, S.S.; Fan, J.; Liu, H. Key indicators and their data requirements for supervision and evaluation of MFOZ planning. Prog. Geogr. 2012, 31, 1678–1684. [Google Scholar]
- Fan, J.; Zhou, K. Theoretical thinking and approach exploration on deepening the implementation of major function zoning strategy with “three-zones and three-lines”. China Land Sci. 2021, 35, 1–9. [Google Scholar]
- Wang, Y.; Liu, X.L.; Wei, X.H.; Yu, H.W. A preliminary exploration of the methodology and practice of regional spatial planning: From “three basic spaces” to “three-zones and three-lines. Urban Plan. Forum 2018, 4, 65–74. [Google Scholar]
- Wei, W.; Yin, L.; Xie, B.; Bo, L.M. Spatial-temporal evolution characteristics and mechanism of “three-function space” in the Yellow River Basin under the background of territorial spatial planning. Econ. Geogr. 2022, 42, 44–55+86. [Google Scholar]
- Kuang, W.H.; Zhang, S.W.; Du, G.M.; Yan, C.Z.; Wu, S.X.; Li, R.D.; Lu, D.S.; Pan, T.; Ning, J.; Guo, C.Q.; et al. Remotely sensed mapping and analysis of spatio-temporal patterns of land use change across China in 2015–2020. Acta Geogr. Sin. 2022, 77, 1056–1071. [Google Scholar]
- Liu, J.Y.; Kuang, W.H.; Zhang, Z.X.; Xu, X.L. Spatiotemporal characteristics, patterns and causes of land use changes in China since the late 1980s. Acta Geogr. Sin. 2014, 69, 3–14. [Google Scholar] [CrossRef]
- Liu, J.Y.; Zhang, Z.X.; Zhuang, D.F.; Wang, Y.M.; Zhou, W.C.; Zhang, S.W.; Li, R.D.; Jiang, N.; Wu, S.X. A study on the spatial-temporal dynamic changes of land-use and driving forces analyses of China in the 1990s. Geogr. Res. 2003, 22, 1–12. [Google Scholar]
- Wang, Y.F.; Guo, R.; Fan, J. Evolution analysis of China’s spatial development structure and pattern optimization of major functional zones. Bull. Chin. Acad. Sci. 2020, 35, 855–866. [Google Scholar]
- Han, H.R.; Yang, C.F.; Song, J.P. The spatial-temporal characteristic of land use change in Beijing and its driving mechanism. Econ. Geogr. 2015, 35, 148–154+197. [Google Scholar]
- Liu, J.Y.; Ning, J.; Kuang, W.H.; Xu, X.L.; Zhang, S.W.; Yan, C.; Li, R.; Wu, S.; Du, G.; Chi, W.; et al. Spatial-temporal patterns and characteristics of land-use change in China during 2010-2015. Acta Geogr. Sin. 2018, 73, 789–802. [Google Scholar]
- Wang, X.L.; Bao, Y.H. Exploration of land use dynamic change research methods. Prog. Geogr. 1999, 18, 81–87. [Google Scholar]


Disclaimer/Publisher’s Note: The statements, opinions and data contained in all publications are solely those of the individual author(s) and contributor(s) and not of MDPI and/or the editor(s). MDPI and/or the editor(s) disclaim responsibility for any injury to people or property resulting from any ideas, methods, instructions or products referred to in the content. |
© 2023 by the authors. Licensee MDPI, Basel, Switzerland. This article is an open access article distributed under the terms and conditions of the Creative Commons Attribution (CC BY) license (https://creativecommons.org/licenses/by/4.0/).