Article

Designing an Ecological Network in Yichang Central City in China Based on Habitat Quality Assessment

1
School of Landscape Architecture, Northeast Forestry University, Harbin 150040, China
2
Key Laboratory of Heilongjiang Province Cold Landscape Plant Germplasm Resources Development and Landscape Ecological Restoration, Harbin 150040, China
*
Author to whom correspondence should be addressed.
Sustainability 2023, 15(10), 8313; https://doi.org/10.3390/su15108313
Submission received: 21 April 2023 / Revised: 10 May 2023 / Accepted: 16 May 2023 / Published: 19 May 2023
(This article belongs to the Section Sustainability, Biodiversity and Conservation)

Abstract

:
Habitat fragmentation seriously threatens urban biodiversity conservation and ecosystem integrity. Constructing an ecological network and improving the connection level between habitat patches can effectively alleviate the general ecological environmental problems of rapid urban development. In this paper, three focal animal species were selected in the central urban area of Yichang City in China. Based on the habitat quality assessment results of the InVEST model, the ecological network of the three focal species was designed by combining morphological spatial pattern analysis and least-cost path models, and a multi-species comprehensive ecological network of the study area was designed. The consensus identified 31 ecological sources, 64 ecological corridors and 151 ecological nodes. The results can provide support for biodiversity conservation and green space planning in the study area, and also provide a reference for the construction and optimization of ecological networks for biodiversity conservation in urbanized areas.

1. Introduction

Increasing urban development worldwide and the subsequent decrease of biodiversity has caused widespread concern [1,2]. In urban areas, habitat loss and fragmentation are often considered as the main threat to biodiversity and one of the causes of the current species extinction crisis [3,4]. Habitat loss directly leads to species decline [5], while habitat fragmentation leads to changes in environmental conditions within the habitat that do not meet the needs of species for habitat and movement space. The changes can intercept species’ normal dispersal, migration, and colony building behaviors, forcing them to live in habitats that may not be sufficient to sustain populations, reducing or eliminating their potential to achieve genetic variation, and leading to increased mortality and a decrease in species numbers [6]. Numerous studies have shown that constructing ecological networks can cascade fragmented habitats through ecological corridors, restore connectivity between patches of islanded habitats, reduce habitat fragmentation [7], protect landscape integrity and ensure the transmission of ecological functions, and is one of the most important tools for biodiversity conservation in cities [8,9].
Several methods have been applied to ecological network research both in China and internationally. In general, there are two technical paths of existing ecological network planning methods from different dimensions: one is based on the principle of structural optimization; the other is based on the identification of functions [10]. The design method based on the principle of spatial structure optimization identifies ecological sources and ecological corridors based on landscape pattern analysis [11], landscape morphology analysis [12,13], and network analysis [14], which focuses more on the spatial distribution and pattern of ecological networks and less on the ecological service functions and values of ecological spaces. The design method of identifying function-first spaces includes spatially based focal species conservation suitability assessment [15,16], landscape ecological performance [17], and ecosystem service values [18,19,20], but most approaches neglect the structural nature of landscape ecosystems [10]. In this study, based on the availability of data, we aim to combine these two technical paths organically, to increase the scientific and rational nature of ecological network planning. For example, morphological spatial pattern analysis (MSPA) and landscape connectivity evaluation help guide ecological source site identification from structural attributes, and ecological network structure analysis based on complex networks is also evaluated from a spatial structural perspective. Comprehensive evaluation of ecosystem services with the habitat quality assessment module of the Integrated Valuation of Ecosystem Services and Trade-offs (InVEST) model can quantitatively assess habitat quality [21,22,23,24], providing source site identification based on functional attributes and resistance surface information of the least-cost path (LCP) model. Habitat quality reflects the ability of an area to provide species survival conditions, and habitat quality assessment has been used to guide the construction of urban green space, becoming a popular research topic in recent years [25]. The model evaluation method is an important method for habitat quality assessment, among which the InVEST-HQ model is considered one of the most mature habitat quality assessment models because of its visual image presentation, intuitive clarity and easy interpretation [26,27]. Targeting the conservation of focal species is one of the patterns of network construction that identifies functional priority patches [10]. The focal species approach to biodiversity conservation was proposed by Lambeck in 1997 [28]. Multiple focal species characterise different aspects of the habitat in which all species are found, and these species are considered as a focal community [29]. By restoring, protecting and managing the habitat needed for this focal community, the aim is to conserve most species, and indeed biodiversity as a whole. Based on this, this paper explores the ecological network design method based on habitat quality evaluation, and integrates the optimization of ecological network spatial structure and function.
Yichang City in China’s Hubei Province is famous for its hydropower and is an important node city of the Yangtze River Economic Belt. The city is located in a fragile ecological zone in the central canyons and mountains of China, with a prominent ecological status. The rapid development of urbanization in Yichang has led to a series of urban problems such as increased habitat fragmentation, reduced biodiversity, and ecological damage. At present, the protection and optimization of ecological networks in Yichang are still imperfect, and there is a lack of accurate identification and scientific assessment of important patches and corridors, which is not conducive to the conservation of urban biodiversity and habitats, and also to the function of ecosystem services of urban green infrastructure. Thus, this study aims to design a potential ecological network that provides habitats and migration paths for species in the central city of Yichang based on the focal species approach, the InVEST model, the MSPA and the LCP model, the integrated spatial morphological and functional attributes, and using ecological spaces such as woodland, grassland, wetland, cropland, and urban green space as the basis. The aim is to provide a scientific basis for urban ecological construction and biodiversity conservation in Yichang.

2. Study Area and Data Sources

2.1. Overview of the Study Area

Yichang is located at the junction of the middle and upper reaches of the Yangtze River, in the transition zone between the Qinba Mountains and the Wuling Mountains to the Jianghan Plain. The city has a complex topography and a wide range of heights, with an average altitude difference of nearly 1000 m, and a humid subtropical monsoon climate.
The study area is the central urban area of Yichang City, Hubei Province (Figure 1), covering the administrative districts of Wujiagang District, Xiling District, Xiaoting District, Dianjun District, Sanxia Dam region, Xiaoxita Street, Sandouping Town, Taipingxi Town, Yaqueling Town, Anfusi Town, Gujiadian Town, Letianxi Town, Longquan Town, Baiyang Town, Gaobazhou Town and Honghuatao Town, with a total area of about 2832 km2.

2.2. Data Sources

Data sources used in this paper include land use data, DEM data, NDVI data, nighttime lighting data, and road data of the central urban area of Yichang in 2020 (Table 1).

3. Research Methodology

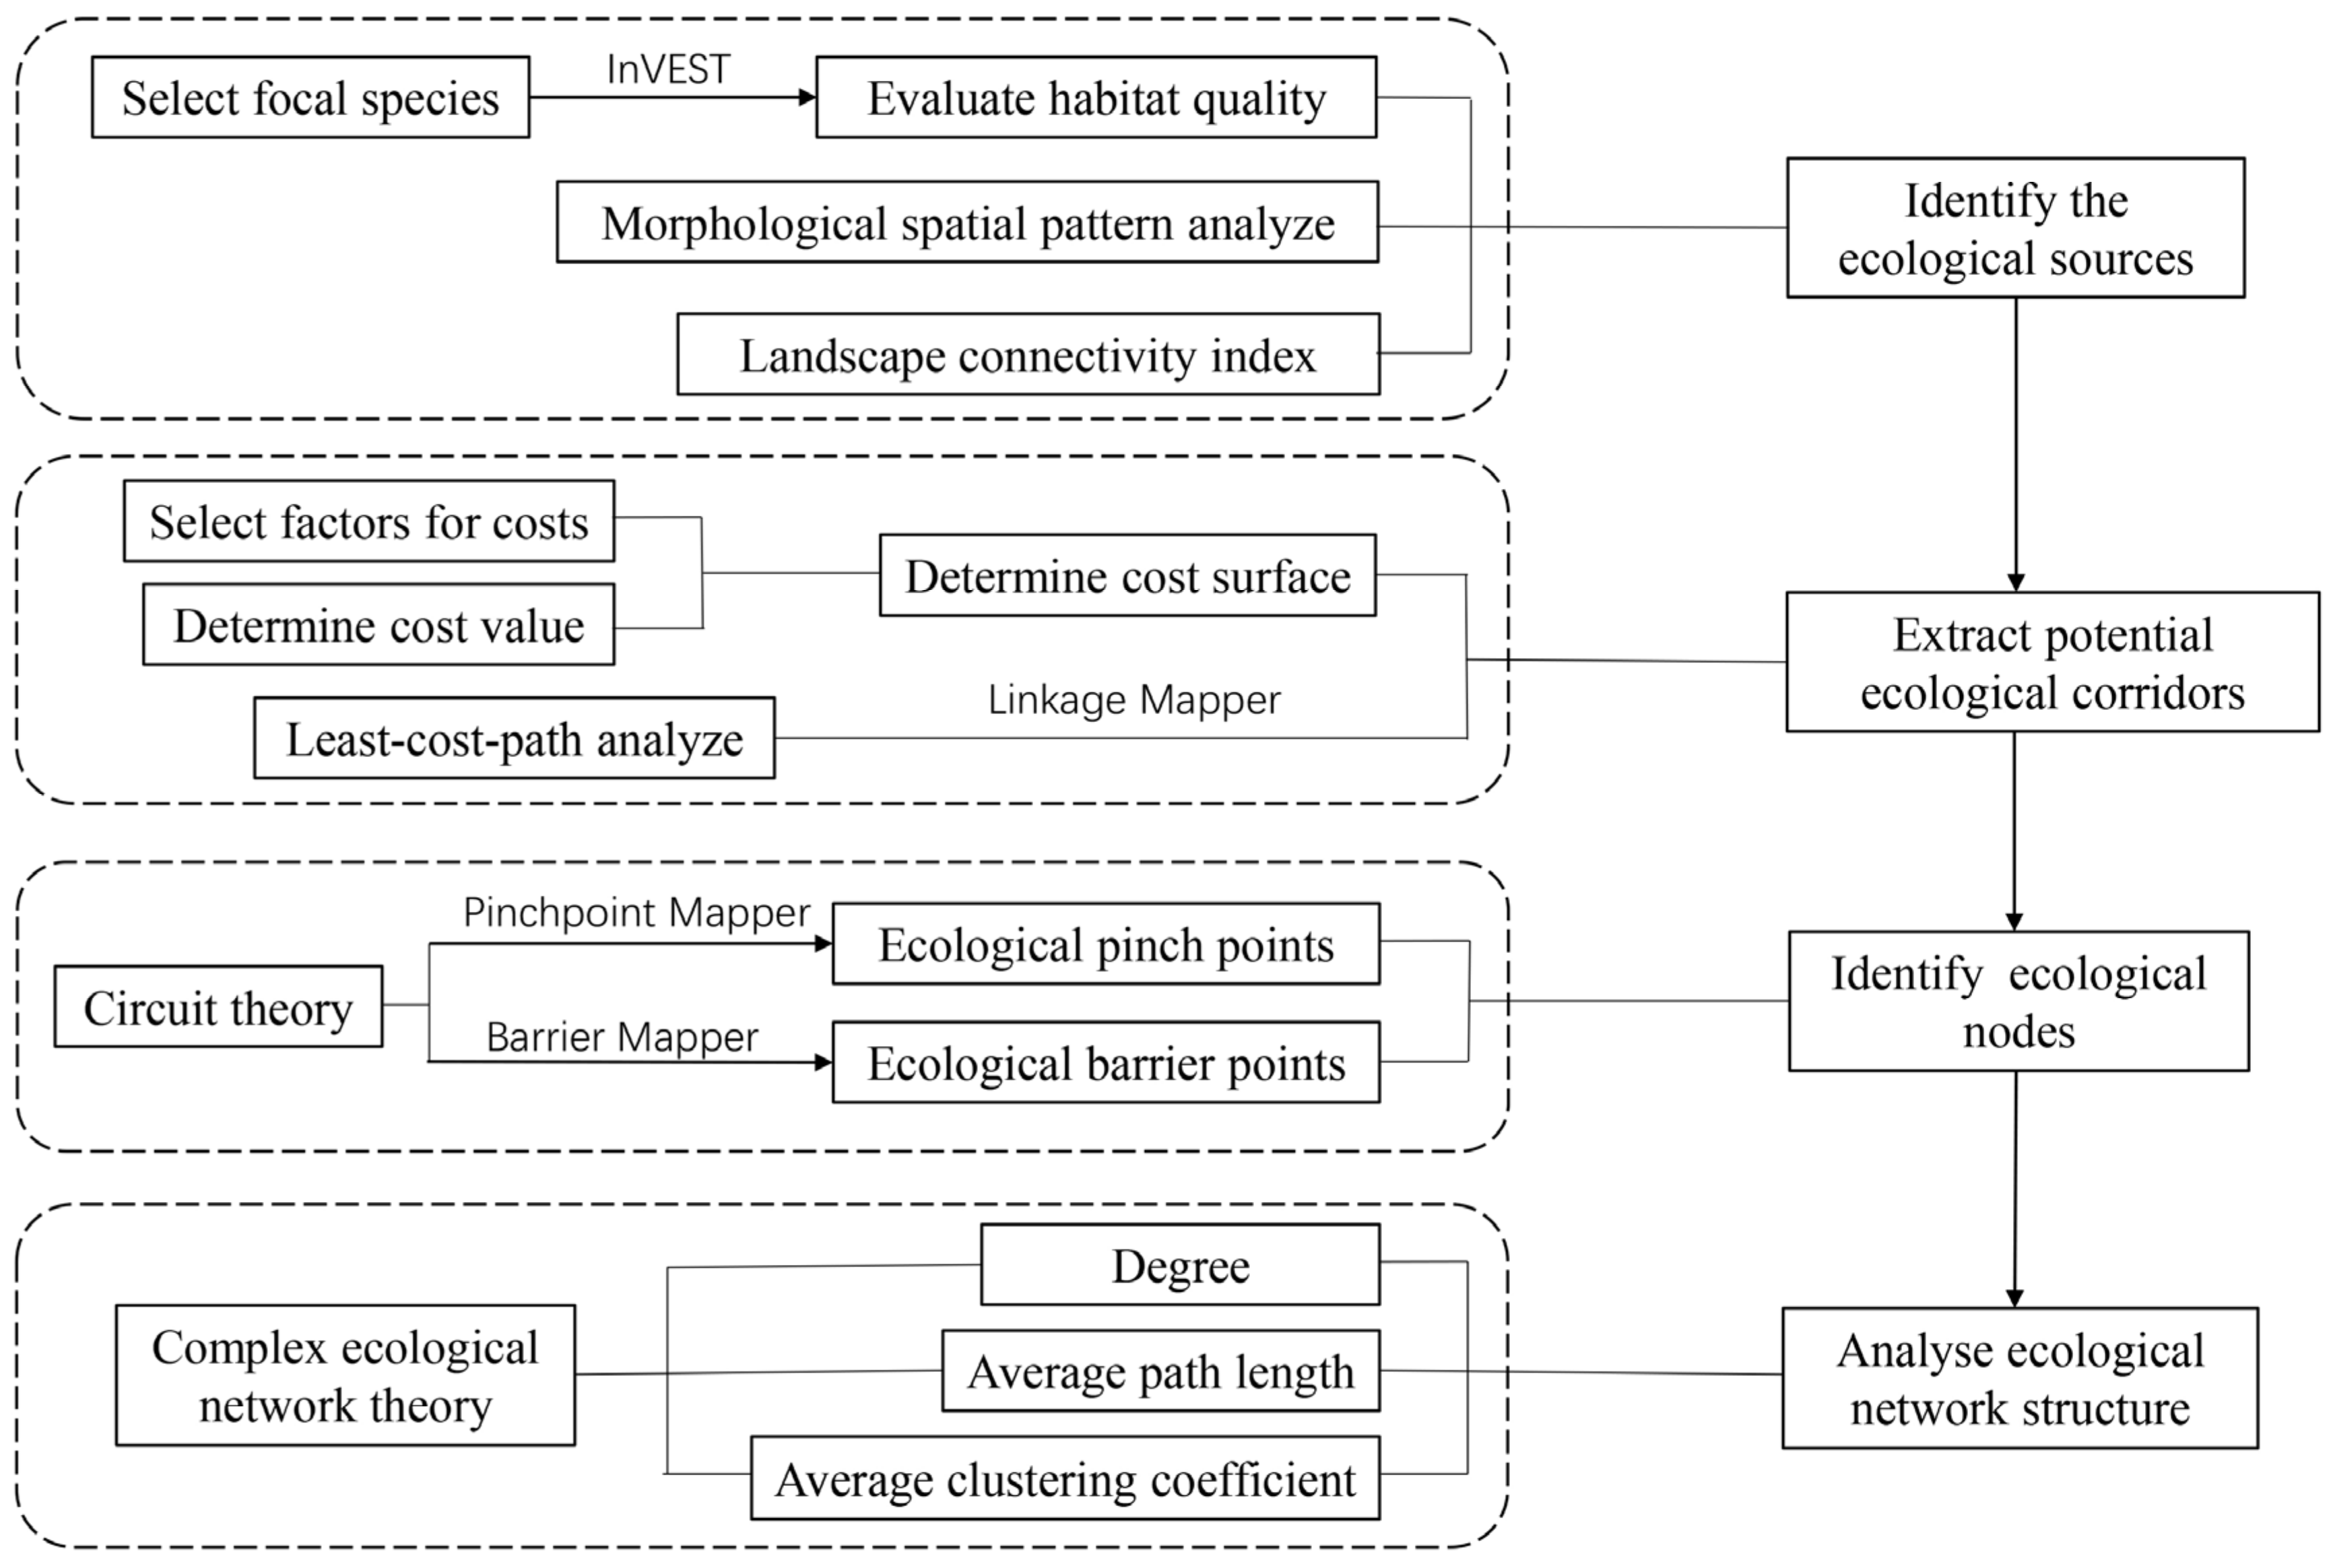
The research method consists of four parts: screening of ecological source sites and comprehensive resistance surface construction, comprehensive identification of ecological corridors, comprehensive identification of ecological nodes, and ecological network structure analysis. The specific research framework is shown in Figure 2.

3.1. Focal Species Selection

Monitoring and managing each species in biodiversity conservation studies is unrealistic, so it is necessary to consider specific species as targets and analyze landscapes using their habitat requirements as the criteria [30]. The focal species approach is an efficient and feasible approach in situations where there is a relative lack of ecological data and where species and habitats are under threat and regional landscape ecological management plans need to be developed as soon as possible [30,31]. Based on the focal species theory and the research in related literature [28,32,33,34,35], this paper focuses on the following factors to select focal species: (1) representing different habitat types in the study area; (2) being widely distributed in the study area and facing the threat of urbanization; (3) being able to attract public attention; and (4) being biologically representative and typical.
According to the above selection criteria, after expert consultation and review of relevant literature, three species were selected as focal species for the design of ecological networks in this study: yellow-bellied tit (Parus venustulus), black-spotted side-pleated frog (Pelophylax nigromaculatus), and grass hare (Lepus capensis) (Table 2). These species are widely distributed and threatened in the study area, representing the main habitat types in the central urban area of Yichang. They are not only culturally and educationally significant, but also popular among the public [36,37,38,39].

3.2. Habitat Quality Assessment Based on the InVEST Model

The InVEST model allows a quantitative assessment of habitat quality through its habitat quality module. The core of this method is to calculate the degree of habitat degradation by calculating the negative impact of threat sources on the habitat, and then calculating the habitat quality in relation to the habitat suitability [43]. To run the habitat quality module, data such as land use data, threat sources, sensitivity to threat sources and other parameters are needed to calculate the habitat quality index. The formula of the InVEST model is as follows.
Q xj = H j 1 D xy Z D xy Z + k z ,
D xj = r = 1 R y = 1 Y r W r r = 1 R W r r y i rxy β x S jr ,
In Equations (1) and (2) ,   Q xj is the habitat quality H j is each land use type assigned a habitat score from 0 to 1 (1 = highest habitat suitability, 0 = no habitat). z = 2.5 and k are scaling parameters (or constants). The k constant is 0.5. r is the land use type threat, with r = 1,2,… n; R is the index of all the modeled degradation sources; y is the index of all grid cells on r ’s raster map; Y r indicates the set of grid cells on r ’s raster map; W r are the weight parameters; β x is the accessibility factor.
i rxy = 1 d xy d r   max   ( Linear   decay ) ,
i rxy = exp 2.99 d r   max d xy   ( Exponential   decay ) ,
In Equations (3) and (4) ,   d xy is the linear distance between grid cells x and y . d r   max is the maximum effective distance of threat r ’s reach in space.
Since the environmental conditions of cultivated and construction land are vulnerable to anthropogenic disturbance, such as anthropogenic tillage disturbance, anthropogenic predation, extensive use of pesticides and fertilizers, and environmental pollution of farmland can affect the species and numbers of amphibians and other animals, and endanger their survival and reproduction [44,45,46,47], water fields, dryland, urban construction land, rural settlements, and other construction land were defined as threat sources. With reference to the recommended values of the InVEST model manual, relevant literature [23,37,48,49,50], habitat requirements of focal species [36,40,41,42] and the results of expert consultation, the impact range and weights of threat sources (Table S1 in Supplementary Information), the sensitivity parameters of habitat types to threats and habitat suitability parameters (Table S2 in Supplementary Information) were determined.

3.3. Ecological Source Site Identification Based on MSPA and Landscape Connectivity Index

Morphological spatial pattern analysis(MSPA)is an image processing method based on mathematical morphological principles to identify, measure, and segment the spatial pattern of raster images [51]. This can show the role of connectivity at the level of spatial structure and precisely identify the type and structure of the landscape [52,53]. Based on the Euclidean distance threshold between raster cells, the binary raster image can be segmented into seven elements: core, edge, islet, bridge, perforation, branch, and loop. Landscape connectivity evaluation can intuitively reflect the strength of connectivity between various patches. We use the Patch Importance Index (dPC) to screen ecological sources, where dPC represents the importance of the elements. The larger the dPC value, the more important the elements are. The equations were as follows.
PC = i = 1 n j = 1 n P ij * × a i × a j A L 2 ,
dPC = 100 × PC PC remove PC ,
In Equations (5) and (6) ,   PC is the possible connectivity index, 0 < PC < 1; n is the total number of patches. a i and a j are the patches i and patches j the area of the patch. P ij * is the number of species in patch i and patch j the maximum of the product of all path probabilities between patch i and patch j . A L is the total area of the landscape. dPC is the patch importance index.   PC remove is the index of possible connectivity of the remaining patches after removing a patch.
Based on the Guidos Toolbox software platform, this study used the habitat quality evaluation results to generate binary images with high quality habitats (0.8~1) as foreground elements and medium to low quality habitats (0~0.79) as background elements. It used the eight-neighborhood analysis method to identify seven types of landscape elements based on MSPA for the study area. Considering the landscape structure and patch area comprehensively, for the core area patches for yellow-bellied tits and grass hares with habitat area larger than 200 ha and black-spotted side-pleated frogs with habitat area larger than 100 ha, landscape connectivity analysis was conducted using Conefor2.6 software. The natural breakpoint method was used to classify the dPC values into seven levels, and the three levels with high dPC values were extracted as ecological source sites. According to the dispersal ability of different species, the patch connectivity distance thresholds for the yellow-bellied tit, black-spotted side-pleated frog, and grass hare were set to 15 km, 1500 m, and 3000 m, respectively [54,55,56,57].

3.4. Resistance Surface Construction Based on Hierarchical Analysis

Landscape resistance indicates the ease of species migration between different landscape units. The spatial distribution of resistance values in all patches of the landscape constitutes the landscape resistance consumption surface [58]. According to the relevant literature [59,60] and the actual situation of the study area, six factors were selected as resistance factors: habitat quality, normalized difference vegetation index, elevation, slope, night lighting, and roads. Considering the influence of the same land use type on the landscape resistance value under different development and construction intensity, the night lighting data can better characterize the intensity of human activities and spatial distribution [61], and thus night lighting data was selected as one of the resistance factors.
Hierarchical analysis (AHP) is a better method to determine the weights of the influencing factors [48]. In this study, the cost surface was used as the target layer and the resistance categories (ecological resistance factor and social resistance factor) as the scheme layer, and the resistance factors were compared two by two and assigned importance scores to construct the judgment matrix of the resistance factors. The judgment matrix was tested for consistency to determine the weights of each resistance factor. ArcGIS was used to standardize the resistance values into five levels, and the six resistance factors were weighted and superimposed to obtain the comprehensive resistance surface of each species. The consistency test equation is as follows.
CR = CI RI ,
CI = γ max n n 1 ,
In Equations (7) and (8) ,   CR is the stochastic consistency ratio of the judgment matrix. CI is the general consistency index of the judgment matrix. RI is the average stochastic consistency index of the judgment matrix, whose value depends on the size of the two-comparison matrix. γ max is the maximum eigenvalue; and n is the number of evaluation factors.

3.5. Simulation of Ecological Corridors Based on Least-Cost Paths

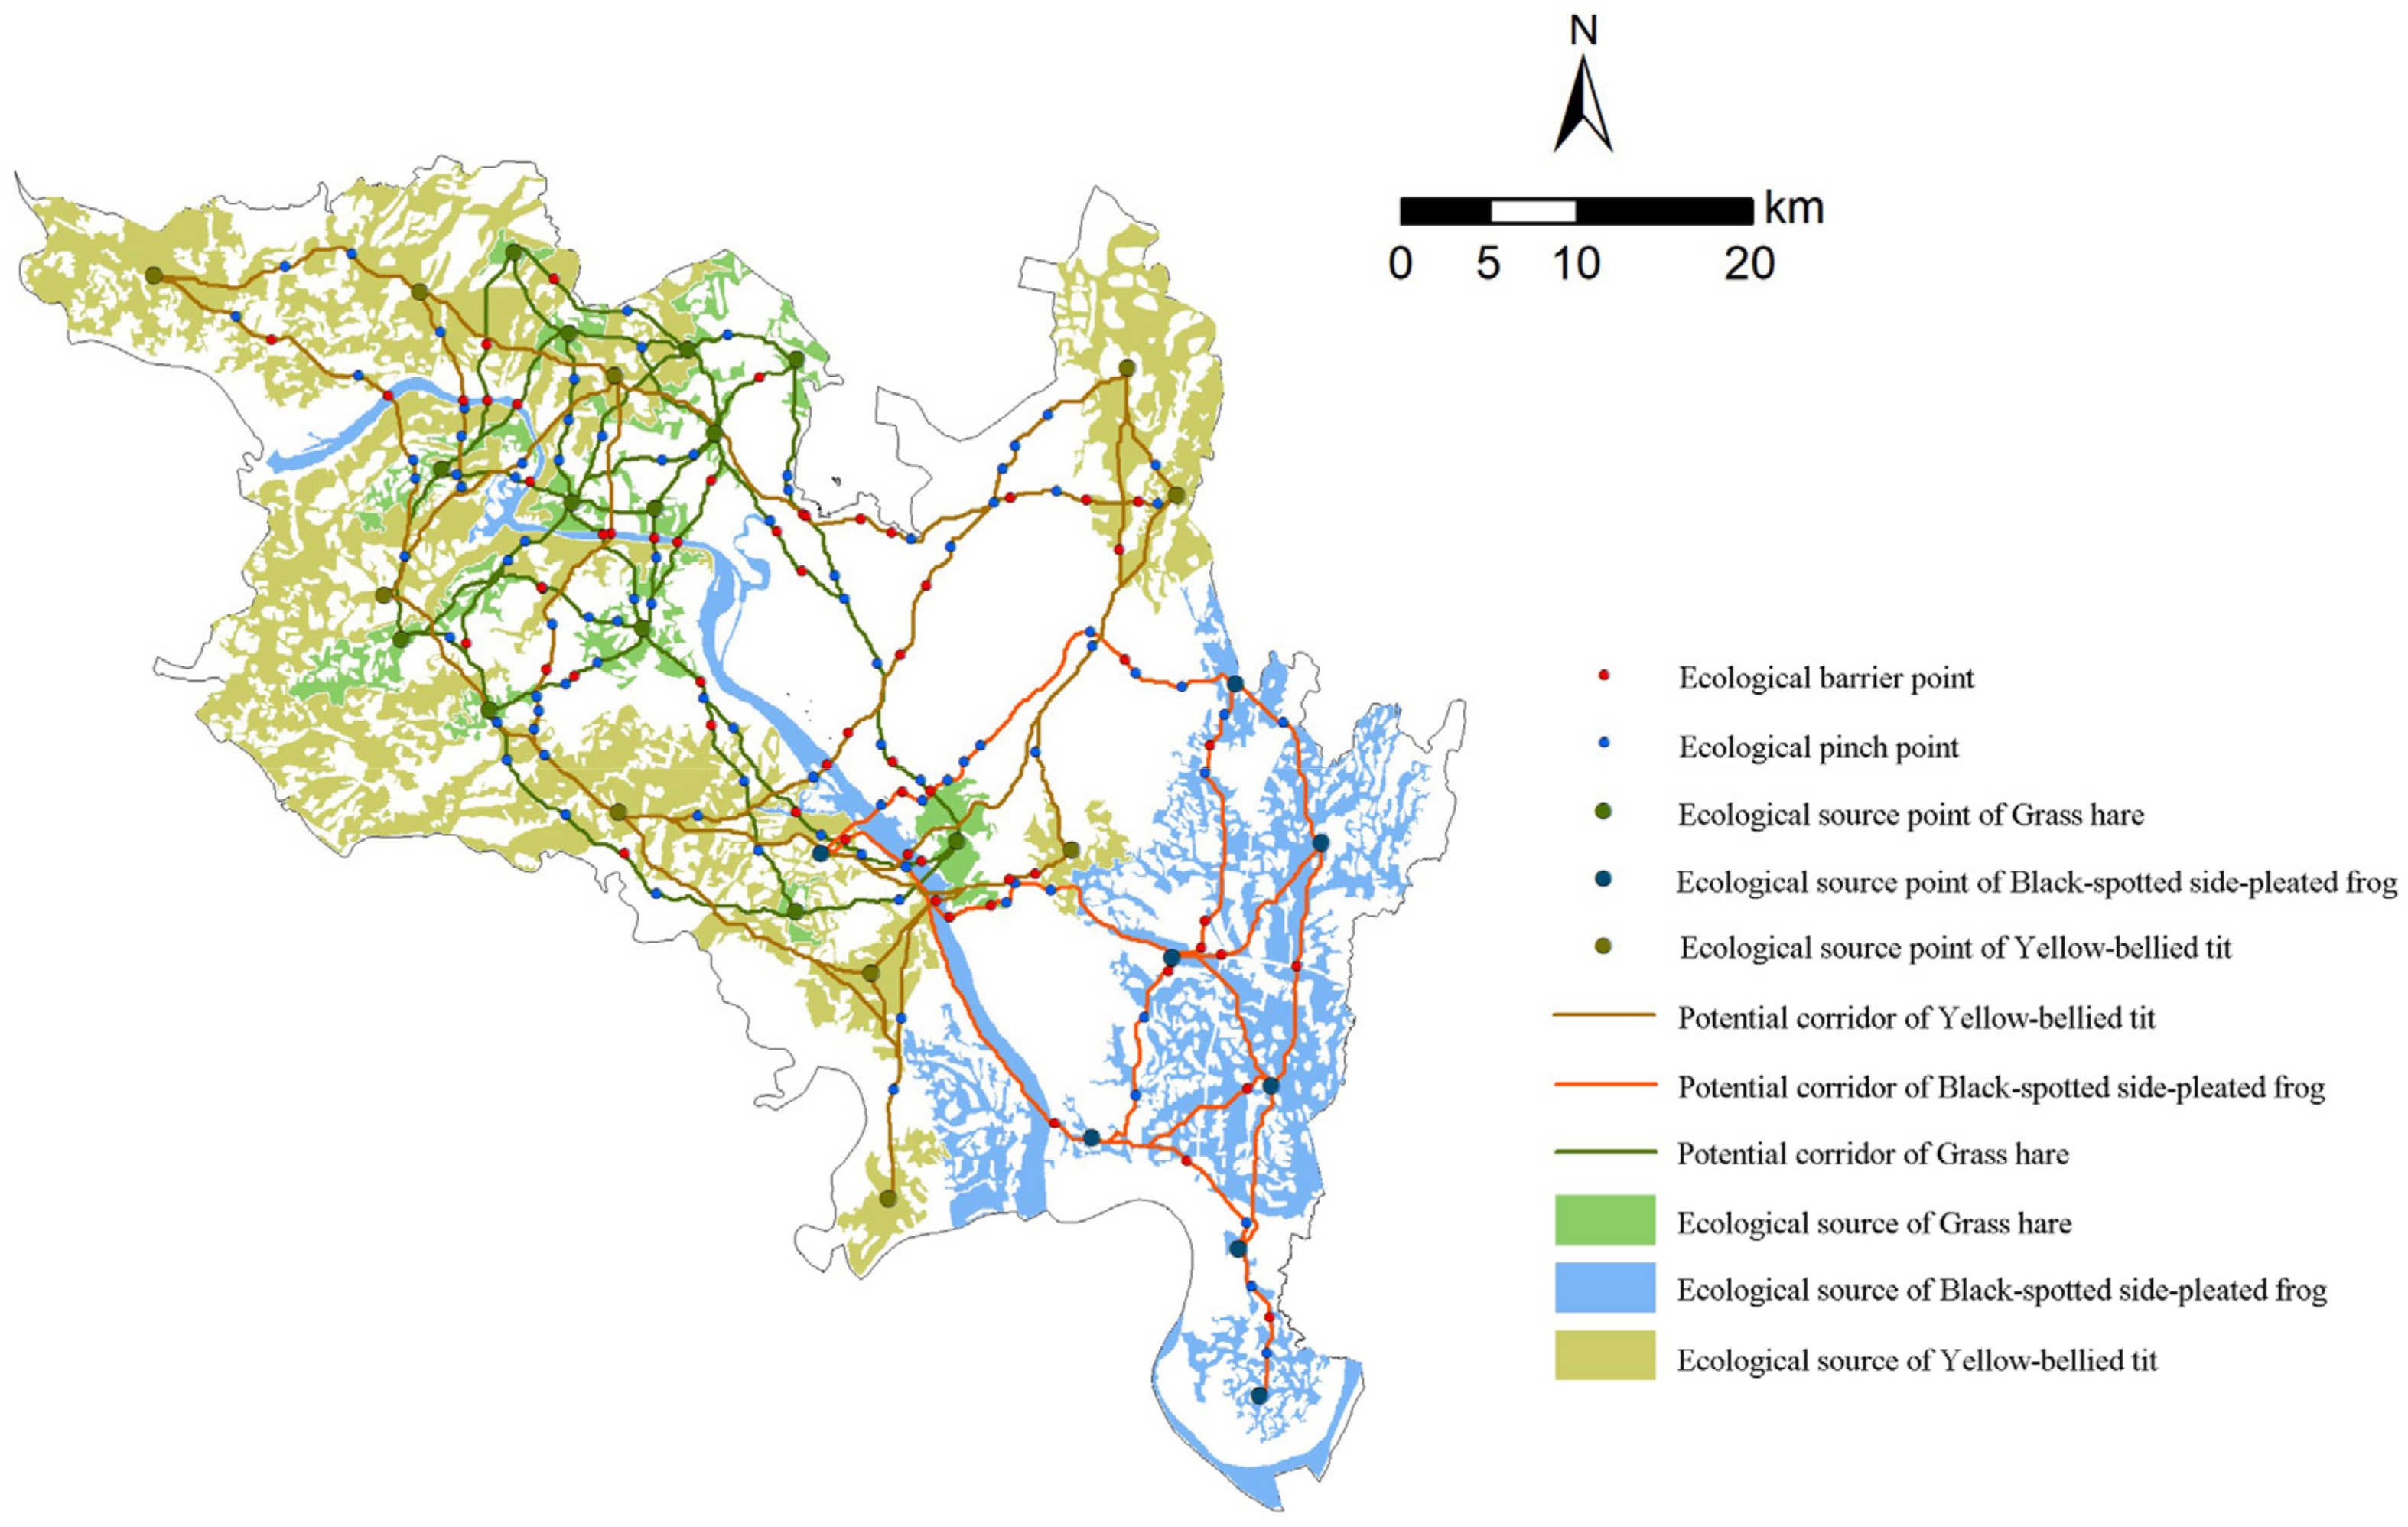
The least-cost pathway (LCP) model identifies the least-consumption pathway between sources and targets, simulates the optimal pathway for species migration dispersal, and is a common method for designing ecological networks [62]. The Linkage Mapper tool was used in ArcGIS platform to import integrated resistance surfaces and ecological source sites to identify the least-cost paths for species migration dispersal and obtain the least-cost distance corridors, i.e., potential ecological corridors.

3.6. Ecological Node Identification Based on Circuit Theory

Circuit theory draws on the physics of electrons traveling randomly in a circuit to model the migratory movement of biological flows through a heterogeneous landscape [63]. Pinchpoints are locations in ecological corridors with high current density, representing a higher probability of species passage. The Pinchpoint Mapper module in the Linkage Mapper plugin was used to select the “all to one” mode for iterative operations. The current density was divided into seven categories according to the natural breakpoint method, and the highest category was extracted as the ecological pinchpoint. Barrier points represent the areas with high resistance to species movement between sources. The Barrier Mapper tool was used to calculate the model without checking the improvement score relative to the minimum cost path percentage, and the model was set to the “Maximum” calculation mode, and the iteration radius was set to 200 m [61]. Ecological pinch points and barrier points are ecological nodes that play a key role in the ecological processes between patches in the ecological corridor.

3.7. Analysis of Ecological Network Structure Based on Complex Networks

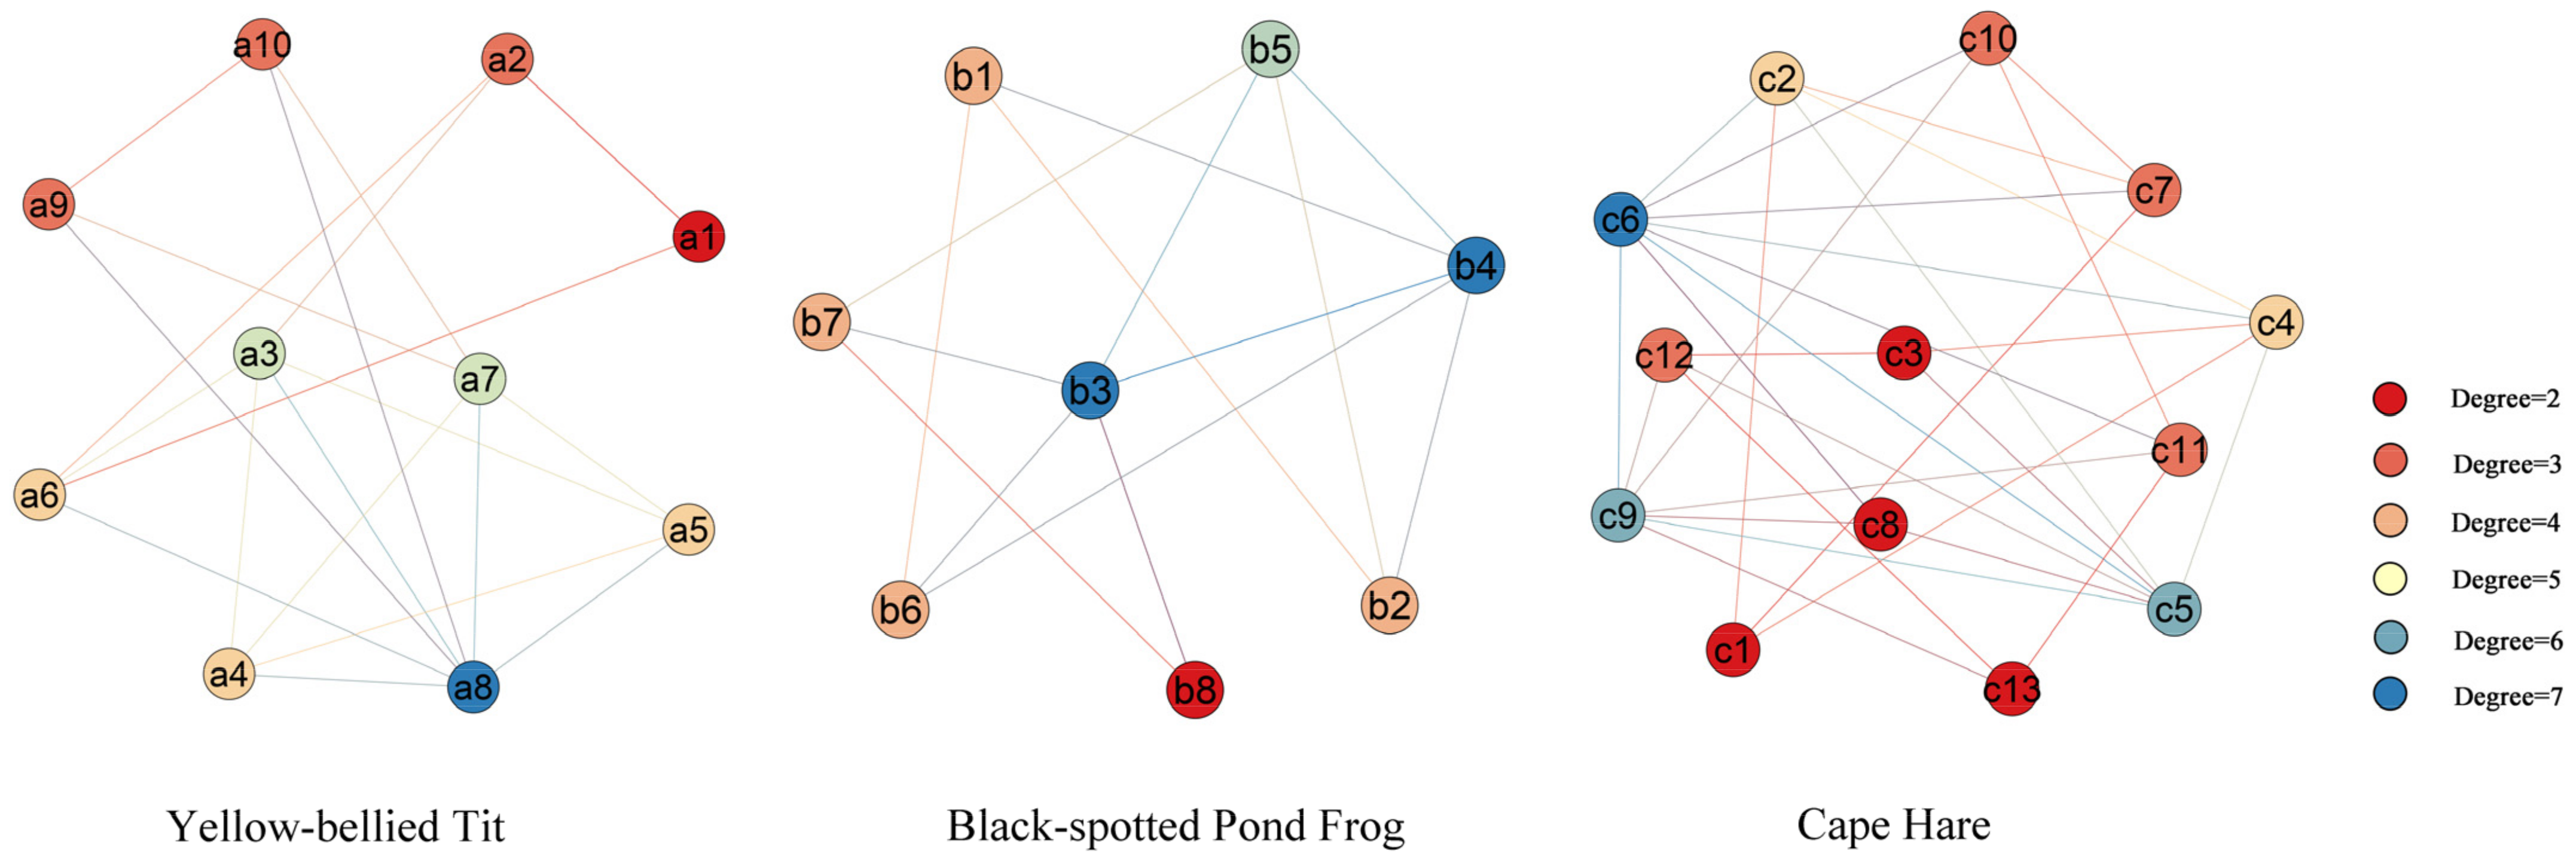
The ecological network is coupled with the complex network for analysis, and the ecological source points and ecological corridor numbers of the ecological network are substituted into the nodes and edges in the complex network by Gephi software to construct the network. The degree, average path length and clustering coefficient are calculated to explore the characteristic laws of the ecological network.
Degree refers to the number of edges connected to a node in a network. In an ecological network, the degree of the corresponding node represents the number of potential ecological corridors connected to that ecological node, and the greater the degree of the ecological node, the higher its importance in the ecological network is proved [64]. The formula is as follows.
k i = j N A ij ,
In Equation (9), A ij is the correlation matrix of network indicators, when node i is correlated with node j , A ij = 1, otherwise A ij = 0.
The average path length is the average number of other ecological nodes spaced on the shortest path between any two ecological nodes, reflecting the association relationship between network nodes and the closeness of the network, and representing the accessibility of the entire ecological network energy flow [64]. The formula is as follows.
L = 1 N N 1 i j d ij ,
In Equation (10), d ij is the shortest path through nodes i and j . The clustering coefficient is the ratio of the actual number of edge connections existing between neighboring nodes of a node in the network to the number of edge connections existing in theory. It represents the clustering characteristics of ecological nodes in the ecological network and reflects the degree of connection between the nodes and their neighbors. When the average clustering coefficient is larger, the more frequent the connections between the nodes and the more even and dispersed the distribution of ecological nodes in the network [65].
C i = E i k i k i 1 / 2 ,
In Equation (11), C i is the the clustering coefficient of node i . E i is the actual number of edge connections between adjacent nodes of node i ,   k i k i 1 / 2 is the theoretical number of edge connections between adjacent nodes of node i .

4. Results and Analysis

4.1. Habitat Quality Assessment

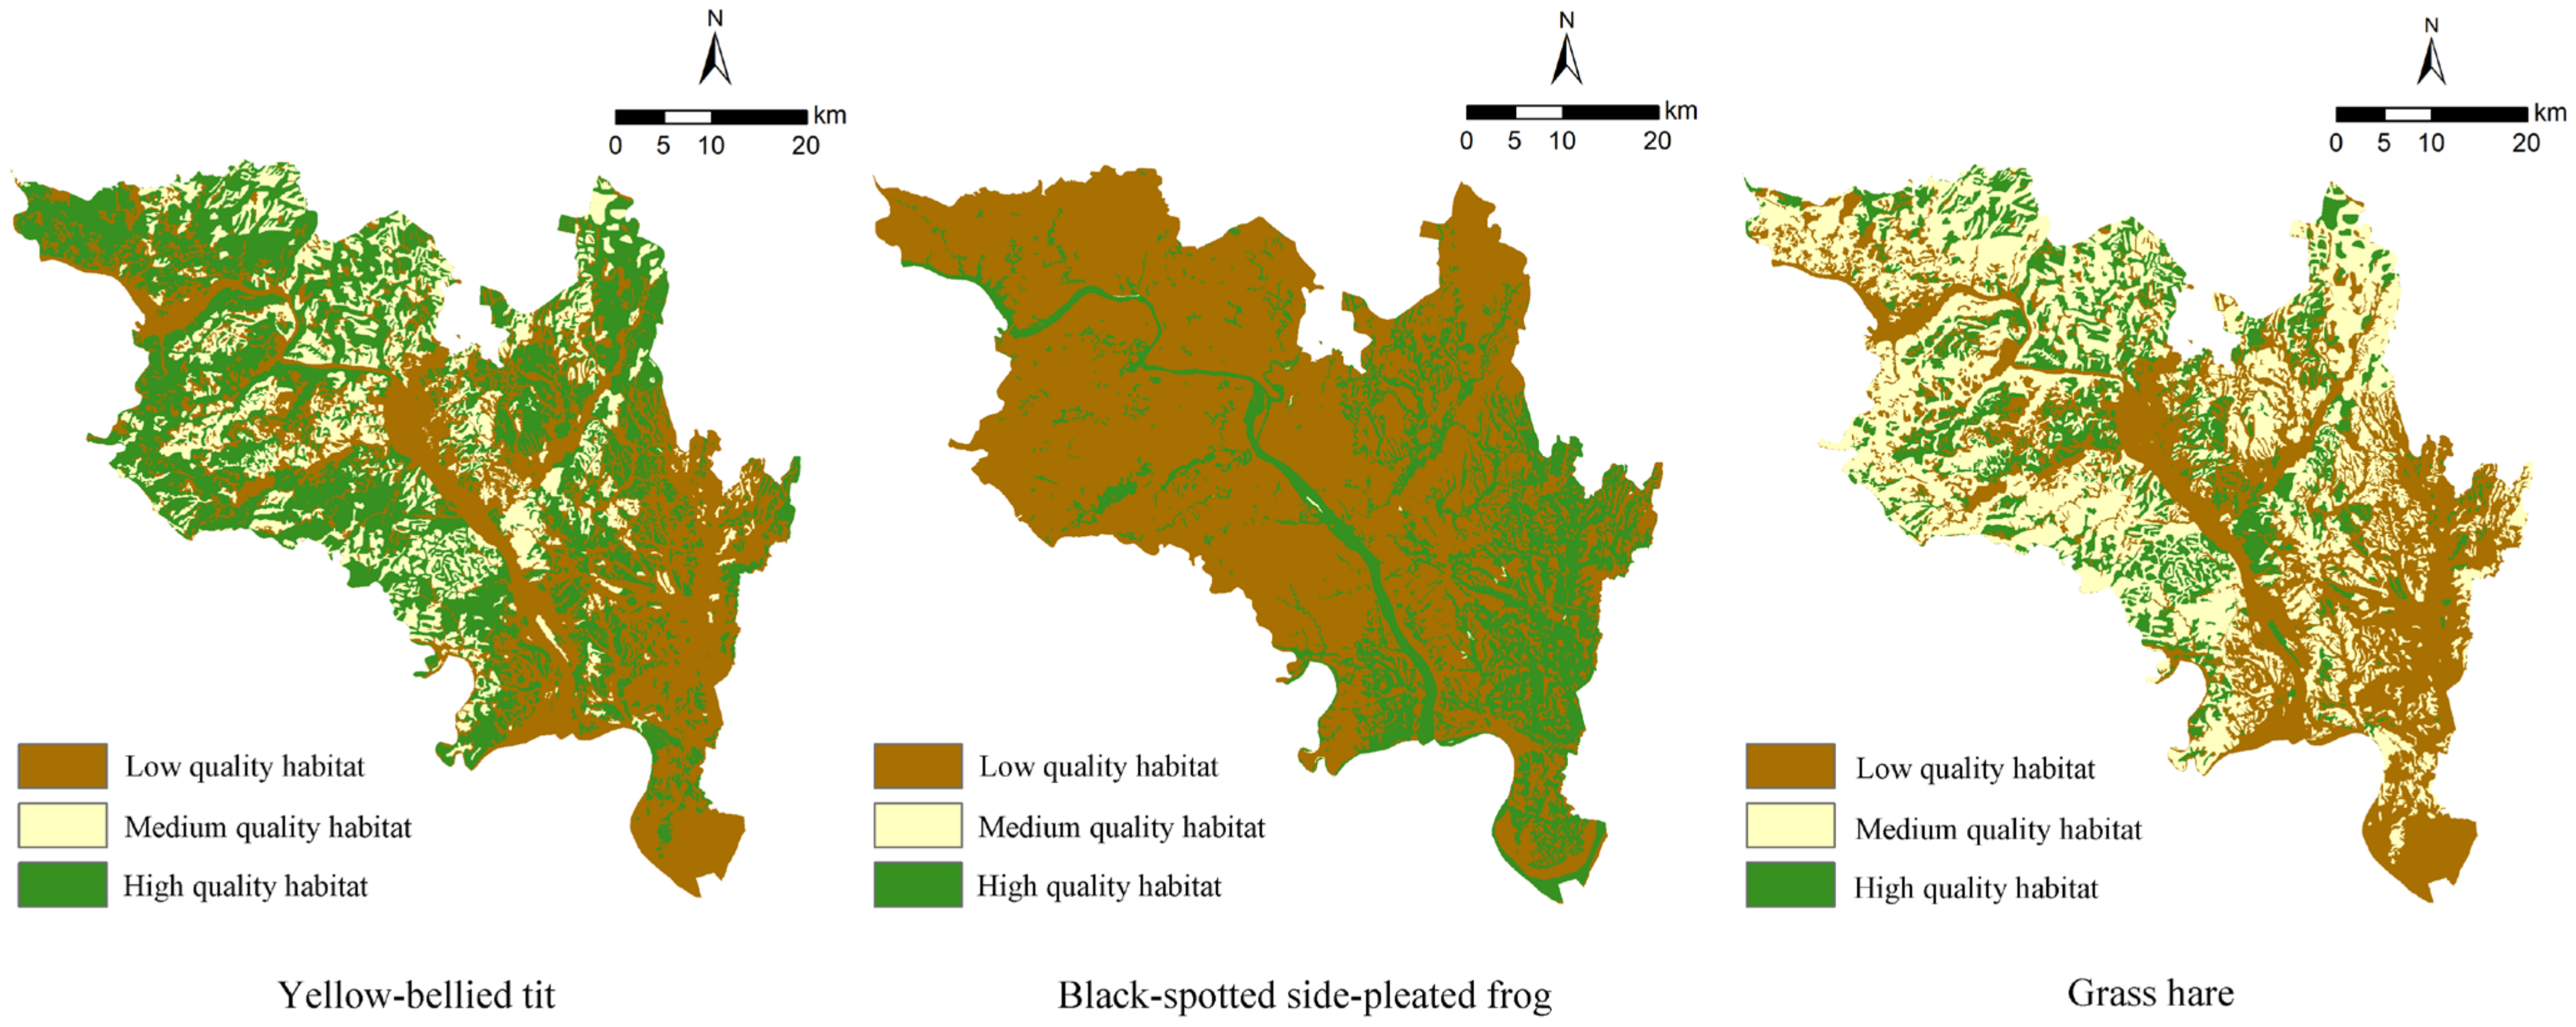
The distribution of habitat quality indices for the three species was quantified using the habitat quality module in the InVEST model, and the habitats in the study area were classified into three categories (Figure 3): high quality habitats (0.8 < HQ 1), medium quality habitats (0.5 < HQ 0.8) and low quality habitats (0 HQ 0.5), and the area and proportion of different quality habitats were counted (Table 3).
In terms of the area of different quality habitats, the area of high quality habitats of the yellow-bellied tit is higher than that of the black-spotted side-pleated frog and the grass hare. This indicates the study area is rich in habitats such as open forests and scrublands, which are more suitable for woodland species such as the yellow-bellied tit. The area of medium quality habitats of the black-spotted side-pleated frog is only 0.08%, as the habitat quality is polarized and is either good or poor. The area of low quality habitats of the frog is the largest of the three species, and needs to be improved. The habitat quality of the grass hare was not optimistic, and there is an urgent need to protect high quality habitats and restore low and medium quality habitats.
In terms of spatial distribution, high quality habitats of the yellow-bellied tit were more evenly distributed in the study area, high quality habitats of the black-spotted side-pleated frog were mainly distributed in the southeast, and high quality habitats of the grass hare were scattered, mainly in the northwestern and central parts of the study area.

4.2. Ecological Source Site Identification

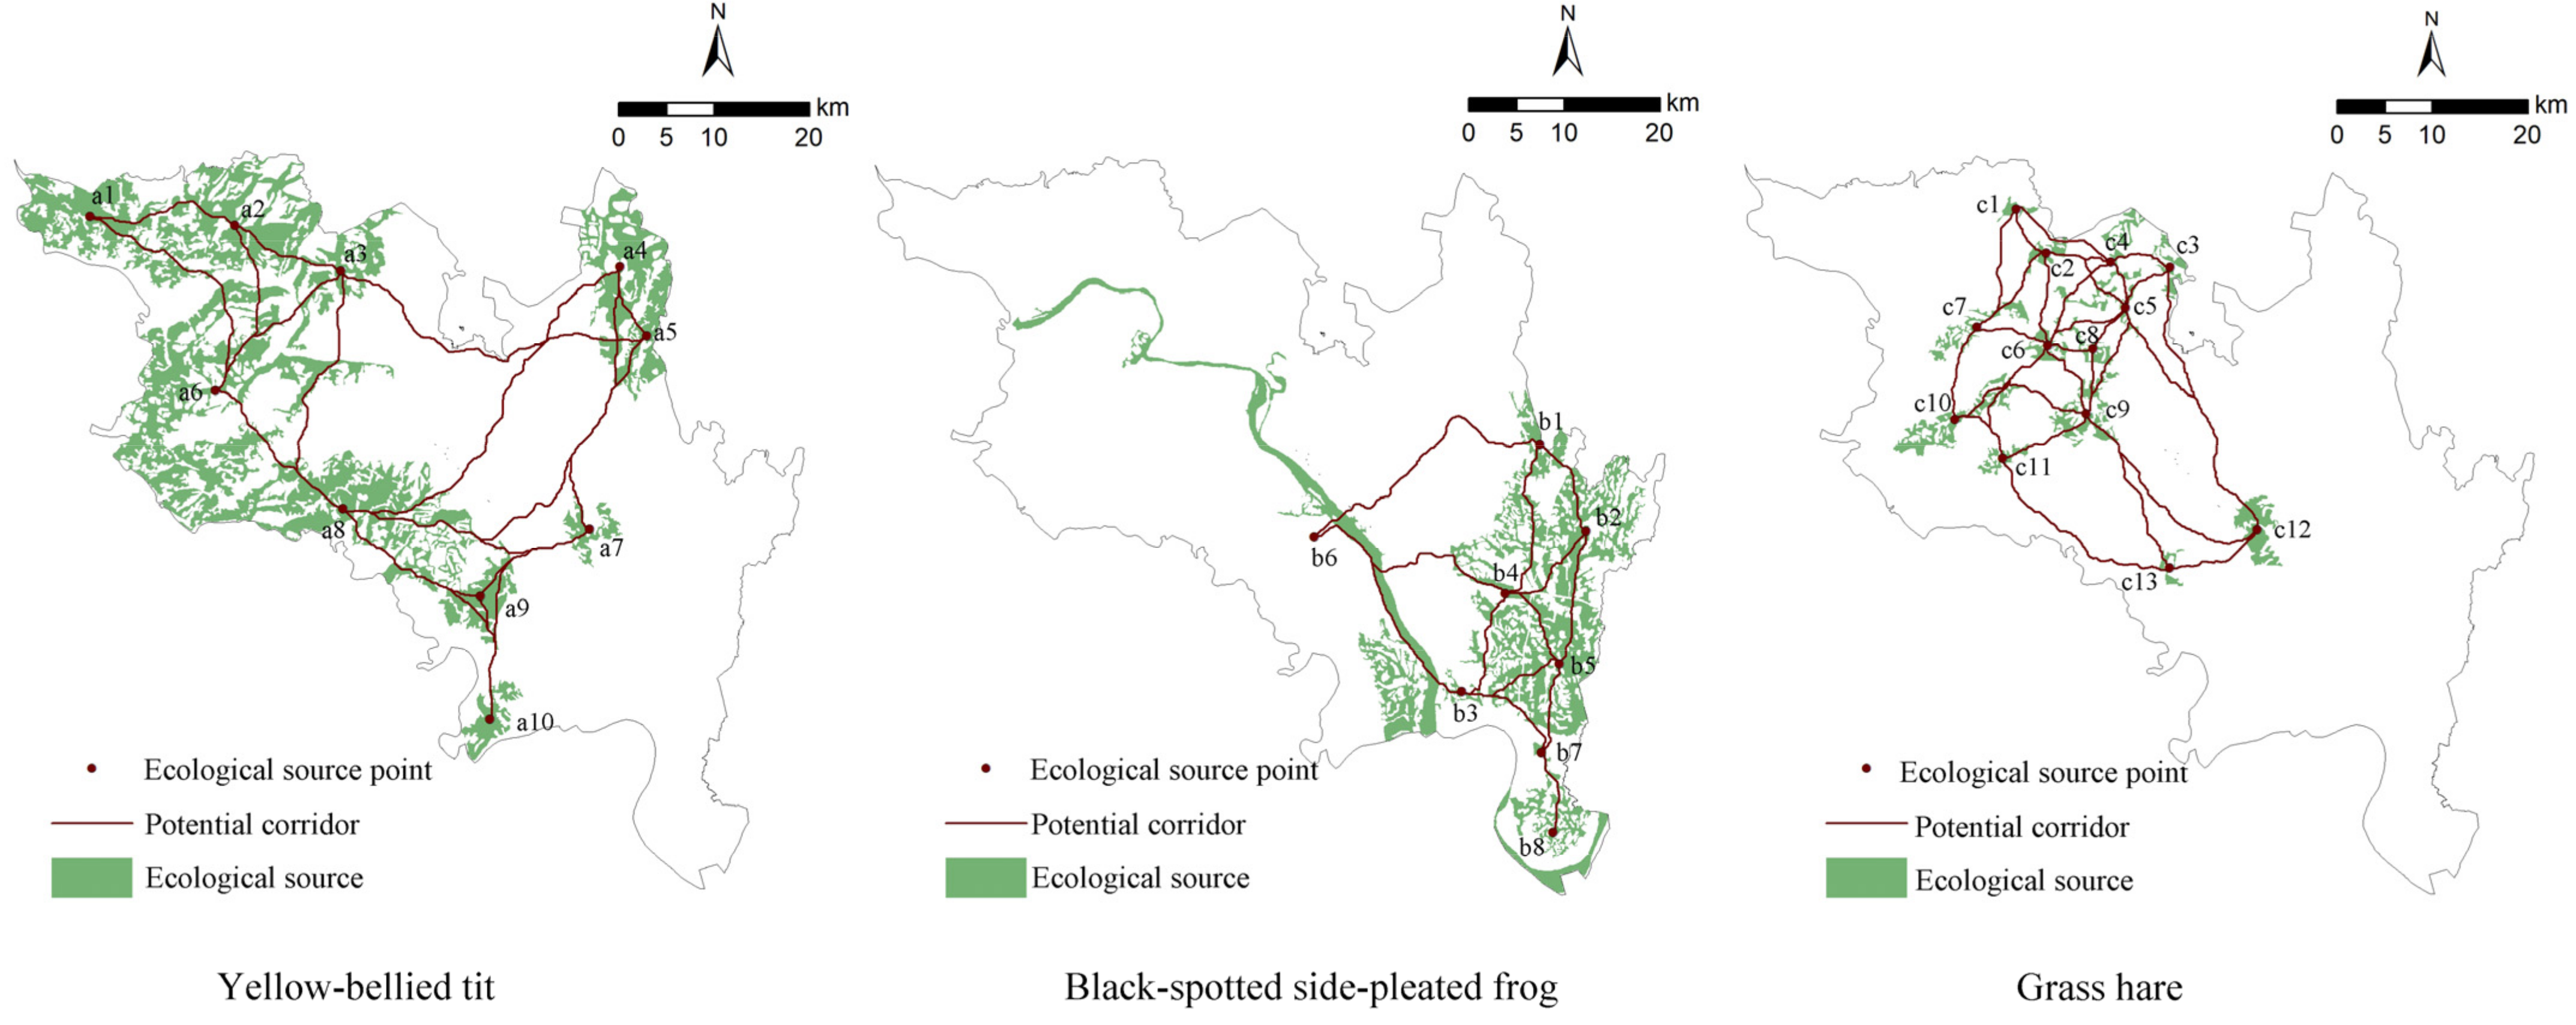
Based on the results of the InVEST model habitat quality assessment and connectivity calculation (Table 4), a total of 31 high-quality core area patches (Figure 4) were selected as ecological source sites. There were 10 source sites for the yellow-bellied tit, 8 for the black-spotted side-pleated frog and 13 for the grass hare, accounting for 21.01%, 11.13% and 3.81% of the study area respectively. Among them, the a6 source of yellow-bellied tit is the largest and its patch importance is the highest, followed by the a8 source. The black-spotted side-pleated frog has the largest b6 source and the highest b4 source patch importance. The c10 source of the grass hare is the largest, while the c6 source patch is the most important.
The ecological source sites were generally in the peripheral space of the built-up area, and the overall distribution was relatively balanced, but there were clustering characteristics in the distribution of different species of source sites. The source sites of the yellow-bellied tit were distributed in the northwestern mountain area of the study area, the source sites of the black-spotted side-pleated frog were mainly in the southeastern plain area and the Yangtze River, and the source sites of the grass hare were mainly in the central northward hilly area.

4.3. Resistance Surface Construction and Ecological Corridor Simulation

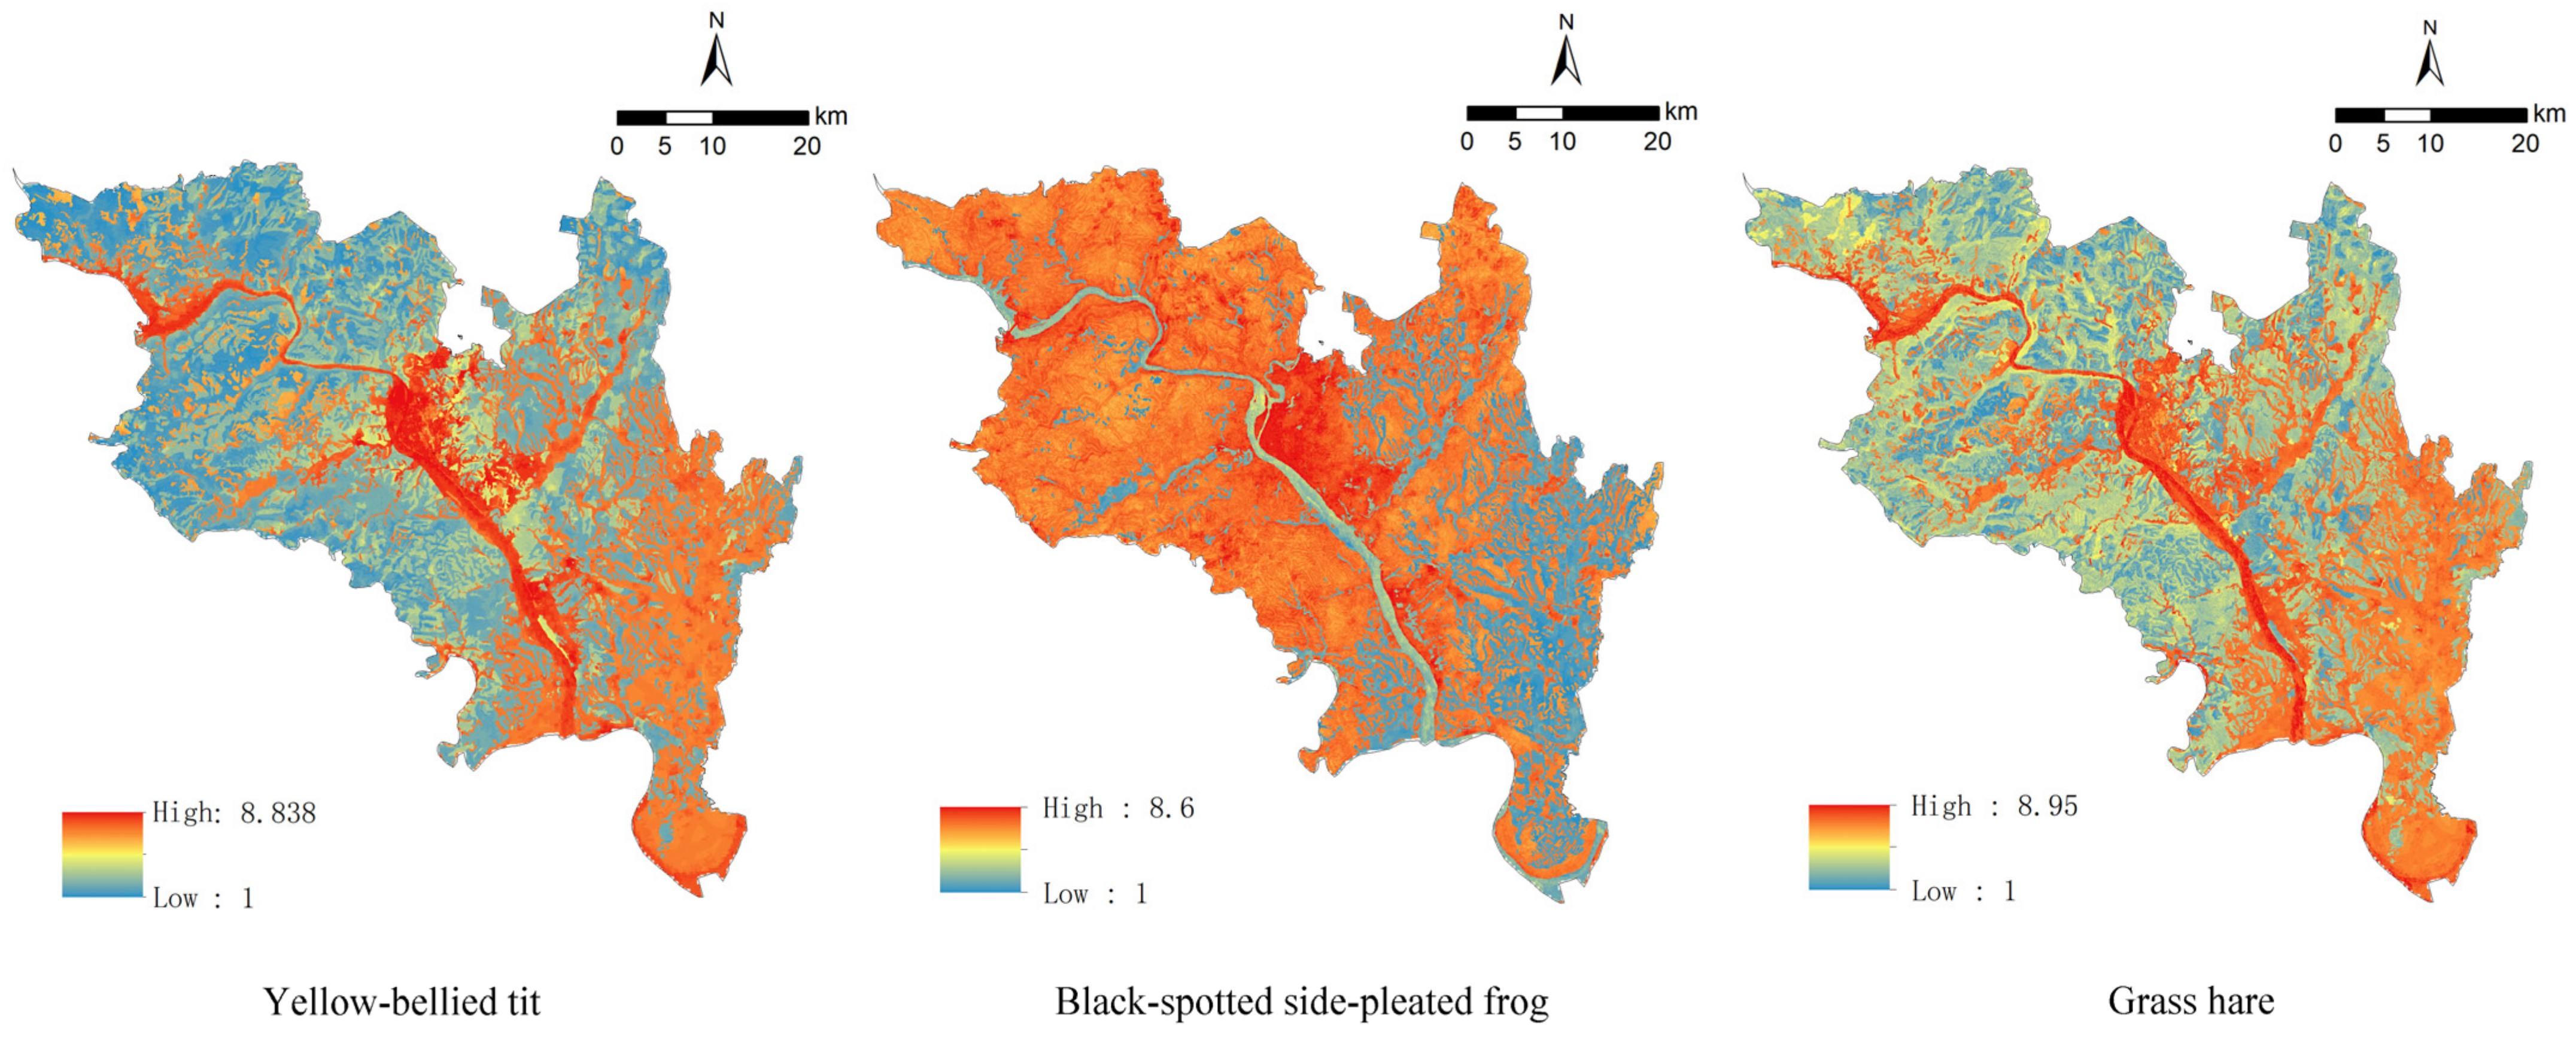
The weights of resistance factors for the three species were determined by hierarchical analysis (Tables S3–S5 in Supplementary Information), and the combined resistance surface for each focal species was simulated (Figure 5). For the yellow-bellied tit and grass hare, the areas with high resistance values were concentrated in the urban built-up area, followed by the southeastern agricultural area of the study area, while for the black-spotted side-pleated frog, resistance values were high in all areas except the southeastern agricultural area, indicating that the area where black-spotted side-pleated frogs can migrate is limited.
Based on the LCP model, the potential ecological corridors of the three species were simulated (Figure 6 and Table 5), resulting in 20 corridors for the yellow-bellied tit, 14 corridors for the black-spotted side-pleated frog, and 30 corridors for the grass hare, with average corridor lengths of 26.3 km, 16.9 km, and 13.1 km, respectively. The yellow-bellied tit corridors were widely distributed, spanning the central and northwestern parts of the study area; the black-spotted side-pleated frog corridors were mainly distributed in the southeast; and the grass hare corridors were the most densely populated. The highest density of grass hare corridors was concentrated in the central north area.

4.4. Ecological Node Identification

Ecological pinch points and ecological barrier points were mostly distributed among ecological source sites and near the edges of ecological source sites (Figure 7). The ecological network of the yellow-bellied tit identified 32 ecological pinch points and 20 ecological barrier points, and the ecological nodes in Corridor 1–6, Corridor 3–5, Corridor 3–8, and Corridor 4–8 were denser. The ecological network of the black-spotted side-pleated frog identified 19 ecological pinch points and 15 ecological barrier points, and the ecological nodes in corridors No. 3 and No. 12 were the most numerous, and protection and restoration efforts should be strengthened. The ecological network of the grass hare had 42 ecological pinch points and 23 ecological obstacle points, with a large number of ecological nodes and relatively uniform spatial distribution.

4.5. Ecological Network Structure

The degrees of the ecological source sites of the three ecological networks, as well as the average path length and the average clustering coefficient, were calculated and counted by constructing a complex network (Figure 8 and Figure 9). By calculating the degrees of each node in the network, it can be seen that the ecological source sites of yellow-bellied tit 1, black-spotted side-pleated frog 8, and grass hare 1, 3, 8 and 13 are of the highest importance and should be built and protected. The average path length of the grass hare ecological network is the highest, which indicates that the accessibility of its ecological network energy flow is higher. The mean clustering coefficient of the ecological network of the yellow-bellied tit is the highest, indicating that the ecological sources are strongly connected and the distribution of the sources is more even.

5. Discussion

Urban ecological networks are usually designed without selecting specific species and using single factors such as land use types for resistance analysis to simulate corridors [66,67]. However, this approach is not applicable to urban environments with complex geography and diverse habitat types [37,68]. The central city of Yichang is located in the transition zone of different topographic areas, and the differences in natural background leads to heterogeneity of ecological environments and species habitats. A single-function ecological network has many problems in practice construction, which can lead to uneven distribution of ecological networks and ecological disconnection between regions. Therefore, this paper addresses the specificity of cities with complex ecological environments, and optimizes the ecological network design method applicable to this type of city based on the focal species approach and using habitat quality assessment. This is the key to promoting a balanced layout of biodiversity conservation and protect the integrity of urban ecosystems.
In this study, unlike other studies in natural areas where endangered animals or large mammals are often selected as focal species [69,70], three more common and small species were selected to form the target species system, considering that the study area is located in a rapidly urbanizing area with strong anthropogenic disturbance, and the main animal taxa are very different compared to natural areas, as well as considering the concerns of people and the species’ role in cultural education. In previous studies related to habitat quality evaluation, generic species were selected, where the parameter settings were not guided by specific proxy species, but mainly based on the recommended data from the manual of model use [71,72]. The ecological network of the three focal species was superimposed to obtain a multi-species integrated ecological network (Figure 10), which generated different ecological corridors with little overlap. This was similar to the results of Hepcan et al., who selected four target species for ecological network analysis in Izmir province, Turkey [73], indicating that the selection of suitable habitat patches for different species and the establishment of a reasonable resistance surface are crucial for the design of ecological networks. In this paper, we also discussed the methods of ecological network construction and explored new methods in the selection of source sites by calculating the landscape connectivity. Previous studies usually delineated a single value as a criterion [71,72]. In this study, the habitat patches of three species needed to be selected, and their dPC values differed greatly, so we chose the method of separate ranking to select patches as source sites in the simulation of barrier point setting. The iteration radius was determined by referring to previous study [61] and according to the extent of this study area in the city.
Building an ecological network is one of the most important methods for biodiversity conservation. Based on the above study, the following suggestions are made for the actual construction of an ecological network in the central city of Yichang. First of all, we should strengthen the protection of ecological source sites. At present, some ecological source sites have been established as protected areas and forest parks, such as Sanxia Dam region Wetland Nature Reserve (source site a2), Chexi Nature Protection Community (source site a6), Wenfoshan Nature Protection Community (source site a8), Songshan Forest Park (a10), Gaobazhou Reservoir Area Wetland Nature Reserve (source site b6), Xiaoting Egret Nature Protection Community (source site b4), Muntjacs Nature Protection Community (c12), Xilingxia Zhendan Reserve (source c6), and Huaniuyan Scenic Area (c7). However, other ecological sources have not been protected [74]. It is recommended that ecological boundaries be strictly controlled, the integrity of ecological sources protected, and ecological management and environmental protection strengthened. Ecological corridors can provide relatively safe paths for the migration movement of organisms, thus protecting the biodiversity in the region [75]. The actual construction of ecological corridors should consider the suitable migration environment for major species, build landscape types with different plants, and interweave the original river and plant corridors with potential corridors to improve the connectivity between ecological source sites, giving priority to potential corridors with more ecological nodes. As an important spatial node for biological diffusion, ecological pinch points should protect the existing natural landscape, repair the more damaged fracture sections, delineate the protection range and minimize human interference. Ecological obstacle points need to optimize their habitat quality to reduce landscape resistance. For water bodies and roads with high resistance values, biological migration channels such as animal bridges, biological culverts, and ecological roads should be considered.
There are still some shortcomings in this study. Due to the lack of detailed species observation data and detailed research data of related species in the study area, the parameters of species habitat quality evaluation, and the score and weight of resistance surface construction in this study are all from related literature and expert consultation, which are somewhat subjective. The distribution data of species in the study area and more detailed information of the biological ecological habits can further validate and improve the study results. The representativeness of focal species for the overall biotope and all habitats needs to be further studied. The Yangtze River is the main water body in Yichang, and is an important habitat for a large number of fish and waterbirds. However, since the migration of species that depend on the Yangtze River needs to be considered comprehensively at the watershed scale or even at a larger scale, fish and waterbirds are not included as focal species in this study. Different organisms respond differently to the same landscape type and have different needs for habitat patches, migration paths, etc. The ecological corridors constructed in this study may not be applicable to all species. In terms of key ecological nodes, in addition to considering spatial location, the influence of the area and morphology of the nodes on biological migration should be further explored to better meet the conservation needs of realistic spatial geographic conditions. Although the ecological network was established using the LCP model and other methods, the study still did not involve interaction among ecological sources, the hierarchical classification of ecological corridors and the relationship among the ecological networks of the three focal species. Further analysis and optimization are needed. The construction of multi-scale and multi-level ecological networks is more conducive to the systematic protection of urban landscapes, and this study is at the central city-wide landscape scale. The construction of more refined ecological networks in built-up areas and urban communities can make the regional ecological network an organic whole, and there are higher requirements for data and indicators. The establishment of ecological networks at different levels and the articulation between them are key points that need further depth and strengthening in future research [61]. We can also consider adding factors related to seasonal changes guided by seasons, and taking into account seasonal behaviors such as hibernation and migration of animals.

6. Conclusions

In this study, three focal animal species—the yellow-bellied tit, the black-spotted side-pleated frog and the grass hare—were selected for habitat quality evaluation using the InVEST model. Based on the evaluation results, ecological source sites were extracted using MSPA spatial pattern analysis and landscape connectivity index as auxiliary methods. Potential ecological corridors were simulated using the LCP model, and ecological pinch points and ecological barrier points were identified based on circuit theory. A multi-level, point-line, nodal urban ecological network of “source–corridor–node” was constructed. There are three findings.
(1)
The high-quality habitats in the central city of Yichang are mainly distributed outside the built-up area, with an overall scattered and locally aggregated distribution, and the habitat quality distribution of the three focal species varies greatly.
(2)
Based on the results of habitat quality evaluation, the ecological network of the central city of Yichang was designed, and 31 ecological source sites were extracted, with a total area of 108,192.51 ha, accounting for 28.26% of the study area. By spatial characteristics, the ecological source sites were distributed more in the southeast and northwest and less in the middle. A total of 64 ecological corridors were simulated, with a length of 1154.63 km, and corridor density was high in the north and low in the south. A total of 151 nodes were identified, of which 93 were ecological pinch points and 58 were ecological barrier points.
(3)
With a relative lack of biological information in urbanized areas, it is feasible to design ecological networks based on the focal species approach and the results of habitat quality evaluation. The results of the study have significance and practical value for the construction of ecological networks targeting biodiversity conservation in rapidly urbanizing areas, and can also provide references and lessons for the construction of ecological networks in other areas.

Supplementary Materials

The following supporting information can be downloaded at: https://www.mdpi.com/article/10.3390/su15108313/s1. Table S1. Impact range of threat sources and their weight values. Table S2. Habitat suitability and sensitivity scales. Table S3. Yellow-bellied tit resistance assignment. Table S4. Black-spotted side-pleated frog resistance assignment. Table S5. Grass hare resistance assignment.

Author Contributions

Conceptualization: G.Y., Y.H. and T.C.; Data curation: G.Y. and P.S.; Formal analysis: G.Y.; Writing—original draft: G.Y.; Writing—review & editing: T.C.; Funding acquisition: Y.H. The graphics in the article are drawn by the authors. All authors have read and agreed to the published version of the manuscript.

Funding

This research was funded by the Fundamental Research Funds of Central Universities, grant numbers 2572017CA12 and 2572018CP06.

Institutional Review Board Statement

Not applicable.

Informed Consent Statement

Not applicable.

Data Availability Statement

The data used to support the findings of this study are available from the corresponding author upon request.

Conflicts of Interest

The authors declare no conflict of interest.

References

  1. Ma, Y.; Li, F.; Yang, R. Impacts of urbanization on biodiversity and control measures. Chin. Landsc. Archit. 2021, 37, 6–13. [Google Scholar]
  2. Zhong, L.; Yang, R.; Xue, F. A review of urban biodiversity conservation studies. Chin. Landsc. Archit. 2021, 37, 25–30. [Google Scholar]
  3. Collinge, S.K. Ecological consequences of habitat fragmentation: Implications for landscape architecture and planning. Landsc. Urban Plan. 1996, 36, 59–77. [Google Scholar] [CrossRef]
  4. Adriaensen, F.; Chardon, J.P.; De Blust, G.; Swinnen, E.; Villalba, S.; Gulinck, H.; Matthysen, E. The application of ‘least-cost’ modelling as a functional landscape model. Landsc. Urban Plan. 2003, 64, 233–247. [Google Scholar] [CrossRef]
  5. Yu, K.; Li, D.; Duan, T. A landscape planning approach to biodiversity conservation. Biodivers. Sci. 1998, 3, 45–52. [Google Scholar]
  6. Jones-Walters, L. Pan-European ecological networks. J. Nat. Conserv. 2007, 15, 262–264. [Google Scholar] [CrossRef]
  7. Kowarik, I. Novel urban ecosystems, biodiversity, and conservation. Environ. Pollut. 2011, 159, 1974–1983. [Google Scholar] [CrossRef] [PubMed]
  8. Jongman, R.H.G.; Külvik, M.; Kristiansen, I. European ecological networks and greenways. Landsc. Urban Plan. 2004, 68, 305–319. [Google Scholar] [CrossRef]
  9. Biondi, E.; Casavecchia, S.; Pesaresi, S.; Zivkovic, L. Natura 2000 and the Pan-European ecological network: A new methodology for data integration. Biodivers. Conserv. 2012, 21, 1741–1754. [Google Scholar] [CrossRef]
  10. Shen, J.K.; Wang, Y.C. Landscape ecological network planning: Shifting from spatial structure priority to ecosystem service enhancement for ecological spatial system construction. Landsc. Archit. 2020, 27, 37–42. [Google Scholar]
  11. Kong, F.; Yin, H.; Nakagoshi, N.; Zong, Y. Urban green space network development for biodiversity conservation: Identification based on graph theory and gravity modeling. Landsc. Urban Plan. 2010, 95, 16–27. [Google Scholar] [CrossRef]
  12. Miao, Z.; Pan, L.; Wang, Q.; Chen, P.; Yan, C.; Liu, L. Research on urban ecological network under the threat of road networks—A case study of Wuhan. ISPRS Int. J. Geo-Inf. 2019, 8, 342. [Google Scholar] [CrossRef]
  13. Xu, Q.; Tian, Y.; Hu, Y.; Liu, B.; Guo, Y. Construction and optimization of wetland ecological network in Daqing City. J. Gansu Agric. Univ. 2020, 55, 153–160. [Google Scholar]
  14. Mo, Z.C.; Fu, L.H.; Peng, Y.H.; Xie, M. Identification of key nodes of ecological spatial network based on comprehensive importance evaluation. J. Hunan Univ. Technol. 2018, 32, 64–69. [Google Scholar]
  15. Ersoy, E.; Jorgensen, A.; Warren, P.H. Identifying multispecies connectivity corridors and the spatial pattern of the landscape. Urban For. Urban Green. 2019, 40, 308–322. [Google Scholar] [CrossRef]
  16. Liu, X.Y.; Wei, M.; Zeng, J.; Zhang, S. Analysis and construction of ecological network in Min Delta City Cluster. Resour. Sci. 2021, 43, 357–367. [Google Scholar]
  17. An, C.; Shen, Q.J. Green infrastructure network construction method based on ecological performance of spatial utilization. Landsc. Archit. 2013, 2, 22–31. [Google Scholar]
  18. Peng, J.; Yang, Y.; Liu, Y.; Hu, Y.; Du, Y.; Meersmans, J.; Qiu, S. Linking ecosystem services and circuit theory to identify ecological security patterns. Sci. Total Environ. 2018, 644, 781–790. [Google Scholar] [CrossRef]
  19. Zhang, L.; Peng, J.; Liu, Y.; Wu, J. Coupling ecosystem services supply and human ecological demand to identify landscape ecological security pattern: A case study in Beijing–Tianjin–Hebei region, China. Urban Ecosyst. 2017, 20, 701–714. [Google Scholar] [CrossRef]
  20. Lu, M.; Qu, Y. Construction of regional ecological network based on ecosystem service functions—Harbin as an example. Chin. Landsc. Archit. 2017, 33, 103–107. [Google Scholar]
  21. Mengist, W.; Soromessa, T.; Feyisa, G.L. Landscape change effects on habitat quality in a forest biosphere reserve: Implications for the conservation of native habitats. J. Clean. Prod. 2021, 329, 129778. [Google Scholar] [CrossRef]
  22. Di, F.M.; Sallustio, L.; Vizzarri, M.; De Rosa, D.; De Lisio, L.; Loy, A.; Eichelberger, B.A.; Marchetti, M. Expert-based and correlative models to map habitat quality: Which gives better support to conservation planning? Glob. Ecol. Conserv. 2018, 16, e513. [Google Scholar]
  23. Moreira, M.; Fonseca, C.; Vergílio, M.; Calado, H. Spatial assessment of habitat conservation status in a Macaronesian island based on the InVEST model: A case study of Pico Island (Azores, Portugal). Land Use Policy 2018, 78, 637–649. [Google Scholar] [CrossRef]
  24. Sharp, R.; Tallis, H.T.; Ricketts, T.; Guerry, A.D.; Wood, S.A.; Chaplin-Kramer, R.; Nelson, E.J.; Ennaanay, D.; Wolny, S.; Olwero, N.; et al. InVEST 3.7.0 User’s Guide; The Natural Capital Project; Stanford University: Stanford, CA, USA; University of Minnesota: Minneapolis, MI, USA; The Nature Conservancy: Arlington, VA, USA; World Wildlife Fund: New York, NY, USA, 2019. [Google Scholar]
  25. Zhang, M.D.; Zhang, F.; Li, X. Habitat quality evaluation based on the InVEST model: An example from Tongzhou District, Beijing. Landsc. Archit. 2020, 27, 95–99. [Google Scholar]
  26. Gong, L. Research on the Optimization of Ecological Network in Central Beijing Based on Habitat Quality Evaluation. Master’s Thesis, Beijing Forestry University, Beijing, China, 2021. [Google Scholar]
  27. Terrado, M.; Sabater, S.; Chaplin-Kramer, B.; Mandle, L.; Ziv, G.; Acuña, V. Model development for the assessment of terrestrial and aquatic habitat quality in conservation planning. Sci. Total Environ. 2016, 540, 63–70. [Google Scholar] [CrossRef] [PubMed]
  28. Lambeck, R.J. Focal species: A multi-species umbrella for nature conservation. Conserv. Biol. 1997, 11, 849–856. [Google Scholar] [CrossRef]
  29. Brooker, L. The application of focal species knowledge to landscape design in agricultural lands using the ecological neighbourhood as a template. Landsc. Urban Plan 2002, 60, 185–210. [Google Scholar] [CrossRef]
  30. Billeter, R.; Liira, J.; Bailey, D.; Bugter, R.; Arens, P.; Augenstein, I.; Aviron, S.; Baudry, J.; Bukacek, R.; Burel, F.; et al. Indicators for biodiversity in agricultural landscapes: A pan-European study. J. Appl. Ecol. 2008, 45, 141–150. [Google Scholar] [CrossRef]
  31. Hess, G.R.; King, T.J. Planning open spaces for wildlife: I. Selecting focal species using a Delphi survey approach. Landsc. Urban Plan. 2002, 58, 25–40. [Google Scholar] [CrossRef]
  32. Rubino, M.J.; Hess, G.R. Planning open spaces for wildlife 2: Modeling and verifying focal species habitat. Landsc. Urban Plan. 2003, 64, 89–104. [Google Scholar] [CrossRef]
  33. Simberloff, D. Flagships, umbrellas, and keystones: Is single-species management passé in the landscape era? Biol. Conserv. 1998, 83, 247–257. [Google Scholar] [CrossRef]
  34. Wilcox, B.A. In Situ Conservation of Genetic Resources: Determinants of Minimum area Requirements. In Proceedings of the World Congress on National Parks, Bali, Indonesia, 11–22 October 1982; Smithsonian Institution Press: Washington, DC, USA, 1984. [Google Scholar]
  35. Power, M.E.; Tilman, D.; Estes, J.A.; Menge, B.A.; Bond, W.J.; Mills, L.S.; Daily, G.; Castilla, J.C.; Lubchenco, J.; Paine, R.T. Challenges in the quest for keystones. Bioscience 1996, 46, 609–620. [Google Scholar] [CrossRef]
  36. Liu, X.X. The Complete Fauna of the Three Gorges of the Yangtze River in China; Science Press: Beijing, China, 2010. [Google Scholar]
  37. Wang, L.R.; Feng, X.L.; Chang, Q.; Liu, H.; Wang, J. Study on the construction of urban green space habitat network pattern based on InVEST-MCR composite model. Chin. Landsc. Archit. 2020, 36, 113–118. [Google Scholar]
  38. Zhang, L.; He, L.; Yan, F.; Chen, Y. Habitat network planning for amphibians based on graph theory: The example of the black-spotted side-pleated frog. Chin. J. Appl. Ecol. 2021, 32, 1054–1060. [Google Scholar]
  39. Zhao, J.; Liang, Y.Q.; Mei, J. Target Species-Oriented Urban Habitat Network Construction. In Proceedings of the Annual Meeting of the Chinese Society of Landscape Architecture, Chengdu, China, 21–23 November 2020. [Google Scholar]
  40. Zhao, Z.J. Chinese Birds; Jilin Science and Technology Press: Changchun, China, 2001. [Google Scholar]
  41. Fei, L.; Hu, S.Q.; Ye, C.Y.; Huang, Y.Z. Zoology of China: Amphibians; Science Press: Beijing, China, 2009. [Google Scholar]
  42. Luo, Z.X. Chinese Wild Rabbit; China Forestry Press: Beijing, China, 1988. [Google Scholar]
  43. Chen, Y.; Qiao, F.; Jiang, L. Impact of land use pattern change on regional scale habitat quality based on InVEST model in Beijing. J. Peking Univ. Nat. Sci. Ed. 2016, 52, 553–562. [Google Scholar]
  44. Pan, D.Y. Toxicity of herbicides to the tadpoles of the zebra frog (Pleurotus ocellatus). Chin. J. Zool. 1990, 1, 32–33. [Google Scholar]
  45. Li, Y.; Xu, F.; Guo, Z.; Liu, X.; Jin, C.; Wang, Y.; Wang, S. Reduced predator species richness drives the body gigantism of a frog species on the Zhoushan Archipelago in China. J. Anim. Ecol. 2015, 80, 171–182. [Google Scholar] [CrossRef]
  46. Ke, X.; Guo, W.; Huang, J.; Deng, H.; Liu, Z.; Wang, X.; Xie, G.; Liu, T. Amphibian diversity in suburban rice fields of Ji’an City. J. Jinggangshan Univ. Nat. Sci. Ed. 2013, 34, 103–106. [Google Scholar]
  47. Han, X. Impact Assessment of Terrestrial Ecological Environment of Large Water Conservancy Projects. Master’ Thesis, Huaqiao University, Quanzhou, China, 2021. [Google Scholar]
  48. Tang, Y.; Gao, C.; Wu, X. Urban ecological corridor network construction: An integration of the least cost path model and the InVEST model. ISPRS Int. J. Geo-Inf. 2020, 9, 33. [Google Scholar] [CrossRef]
  49. Berta, A.A.; Noszczyk, T.; Soromessa, T.; Elies, E. The InVEST habitat quality model associated with land use/cover changes: A qualitative case study of the Winike Watershed in the Omo-Gibe Basin, Southwest Ethiopia. Remote Sens. 2020, 12, 1103. [Google Scholar] [CrossRef]
  50. Sulistyawan, B.S.; Eichelberger, B.A.; Verweij, P.; Boot, R.G.A.; Hardian, O.; Adzan, G.; Sukmantoro, W. Connecting the fragmented habitat of endangered mammals in the landscape of Riau–Jambi–Sumatera Barat (RIMBA), central Sumatra, Indonesia (connecting the fragmented habitat due to road development). Glob. Ecol. Conserv. 2017, 9, 116–130. [Google Scholar] [CrossRef]
  51. Qiu, Y.; Chang, Q.; Wang, J. MSPA-based urban green infrastructure network planning—Shenzhen as an example. Chin. Landsc. Archit. 2013, 29, 104–108. [Google Scholar]
  52. Soille, P.; Vogt, P. Morphological segmentation of binary patterns. Pattern Recognit. Lett. 2009, 30, 456–459. [Google Scholar] [CrossRef]
  53. Wickham, J.D.; Riitters, K.H.; Wade, T.G.; Vogt, P. A national assessment of green infrastructure and change for the conterminous United States using morphological image processing. Landsc. Urban Plan. 2010, 94, 186–195. [Google Scholar] [CrossRef]
  54. Smith, M.A.; Green, D.M. Dispersal and the metapopulation paradigm in amphibian ecology and conservation: Are all amphibian populations metapopulations? Ecography 2005, 28, 110–128. [Google Scholar] [CrossRef]
  55. Semlitsch, R.D. Differentiating migration and dispersal processes for pond-breeding amphibians. J. Wildl. Manag. 2008, 72, 260–267. [Google Scholar] [CrossRef]
  56. Sun, S.X. Life habits, activity patterns and hunting of hares. Chin. J. Zool. 1984, 4, 26–29. [Google Scholar]
  57. Tittler, R.; Villard, M.; Fahrig, L. How far do songbirds disperse? Ecography 2009, 32, 1051–1061. [Google Scholar] [CrossRef]
  58. Zhang, L.; Tian, B.; Zhou, Y.; Zhu, C. Analysis of urban ecological network pattern in Pudong New Area of Shanghai supported by remote sensing and GIS. J. East China Norm. Univ. Nat. Sci. Ed. 2015, 1, 240–251. [Google Scholar]
  59. Liu, Y.; Huang, T.; Zheng, X. A method of linking functional and structural connectivity analysis in urban green infrastructure network construction. Urban Ecosyst. 2022, 25, 909–925. [Google Scholar] [CrossRef]
  60. Teng, M.; Wu, C.; Zhou, Z.; Lord, E.; Zheng, Z. Multipurpose greenway planning for changing cities: A framework integrating priorities and a least-cost path model. Landsc. Urban Plan. 2011, 103, 14. [Google Scholar] [CrossRef]
  61. Zhu, J.; Su, J.; Yin, H.-W.; Kong, F.-H. Construction of Xuzhou ecological network based on integrated source site identification and multi-scale nesting. J. Nat. Resour. 2020, 35, 1986–2001. [Google Scholar]
  62. Kim, J.E. Green network analysis in coastal cities using least-cost path analysis: A study of Jakarta, Indonesia. J. Ecol. Environ. 2012, 35, 141–147. [Google Scholar] [CrossRef]
  63. McRae, B.H.; Beier, P. Circuit theory predicts gene flow in plant and animal populations. Proc. Natl. Acad. Sci. USA 2007, 104, 19885–19890. [Google Scholar] [CrossRef] [PubMed]
  64. Xu, W.; Wang, J.; Zhang, M.; Li, S. Construction of landscape ecological network based on landscape ecological risk assessment in a large-scale opencast coal mine area. J. Clean. Prod. 2021, 286, 125523. [Google Scholar] [CrossRef]
  65. Xu, W.X. Study on the Dynamic Evolution of Ecological Risk and Spatial Optimization of Ecological Network in Large Open-Pit Mining Area. Master’s Thesis, China University of Geosciences, Beijing, China, 2021. [Google Scholar]
  66. Cui, L.; Wang, J.; Sun, L.; Lv, C. Construction and optimization of green space ecological networks in urban fringe areas: A case study with the urban fringe area of Tongzhou district in Beijing. J. Clean. Prod. 2020, 276, 124266. [Google Scholar] [CrossRef]
  67. Huang, B.; Chiou, S.; Li, W. Landscape Pattern and Ecological Network Structure in Urban Green Space Planning: A Case Study of Fuzhou City. Land 2021, 10, 769. [Google Scholar] [CrossRef]
  68. Zhou, L.; Li, M.H.; Zhou, Q.G.; Meng, H.B.; Peng, C.H.; Liu, X.W. Constructing ecological security patterns in mega-mountain cities based on circuit theory: The case of Chongqing metropolitan area. Soil Water Conserv. Res. 2021, 28, 319–325. [Google Scholar]
  69. Carroll, C. Role of climatic niche models in focal-species-based conservation planning: Assessing potential effects of climate change on Northern Spotted Owl in the Pacific Northwest, USA. Biol. Conserv. 2010, 143, 1432–1437. [Google Scholar] [CrossRef]
  70. Liu, X.Y. Research on the Planning and Design of Urban and Rural Greenways Based on Biodiversity Conservation. Master’s Thesis, Beijing Forestry University, Beijing, China, 2020. [Google Scholar]
  71. Chen, H.Y.; Li, X. Optimization of green space habitat network in central Beijing based on MSPA-InVEST model. Landsc. Archit. 2021, 28, 16–21. [Google Scholar]
  72. Chen, N.N.; Kang, S.Z.; Zhao, Y.H.; Zhou, Y.J.; Yan, J.; Lu, Y.R. Construction of a mountain ecological network based on MSPA and MCR models in the Qinling Mountains (Shaanxi section). Chin. J. Appl. Ecol. 2021, 32, 1545–1553. [Google Scholar]
  73. Hepcan, E.; Hepcan, C.C.; Bouwma, I.M.; Jongman, R.H.G.; Özkan, M.B. Ecological networks as a new approach for nature conservation in Turkey: A case study of İzmir Province. Landsc. Urban Plan. 2009, 90, 143–154. [Google Scholar] [CrossRef]
  74. Ecological Landscape Planning for the Central City of Yichang. 2015. Available online: http://zrzy.yichang.gov.cn/content-61247-9359-1.html (accessed on 10 May 2023).
  75. Wu, J.; Delang, C.O.; Li, Y.; Ye, Q.; Zhou, J.; Liu, H.; He, H.; He, W. Application of a combined model simulation to determine ecological corridors for western black-crested gibbons in the Hengduan Mountains, China. Ecol. Indic. 2021, 128, 107826. [Google Scholar] [CrossRef]
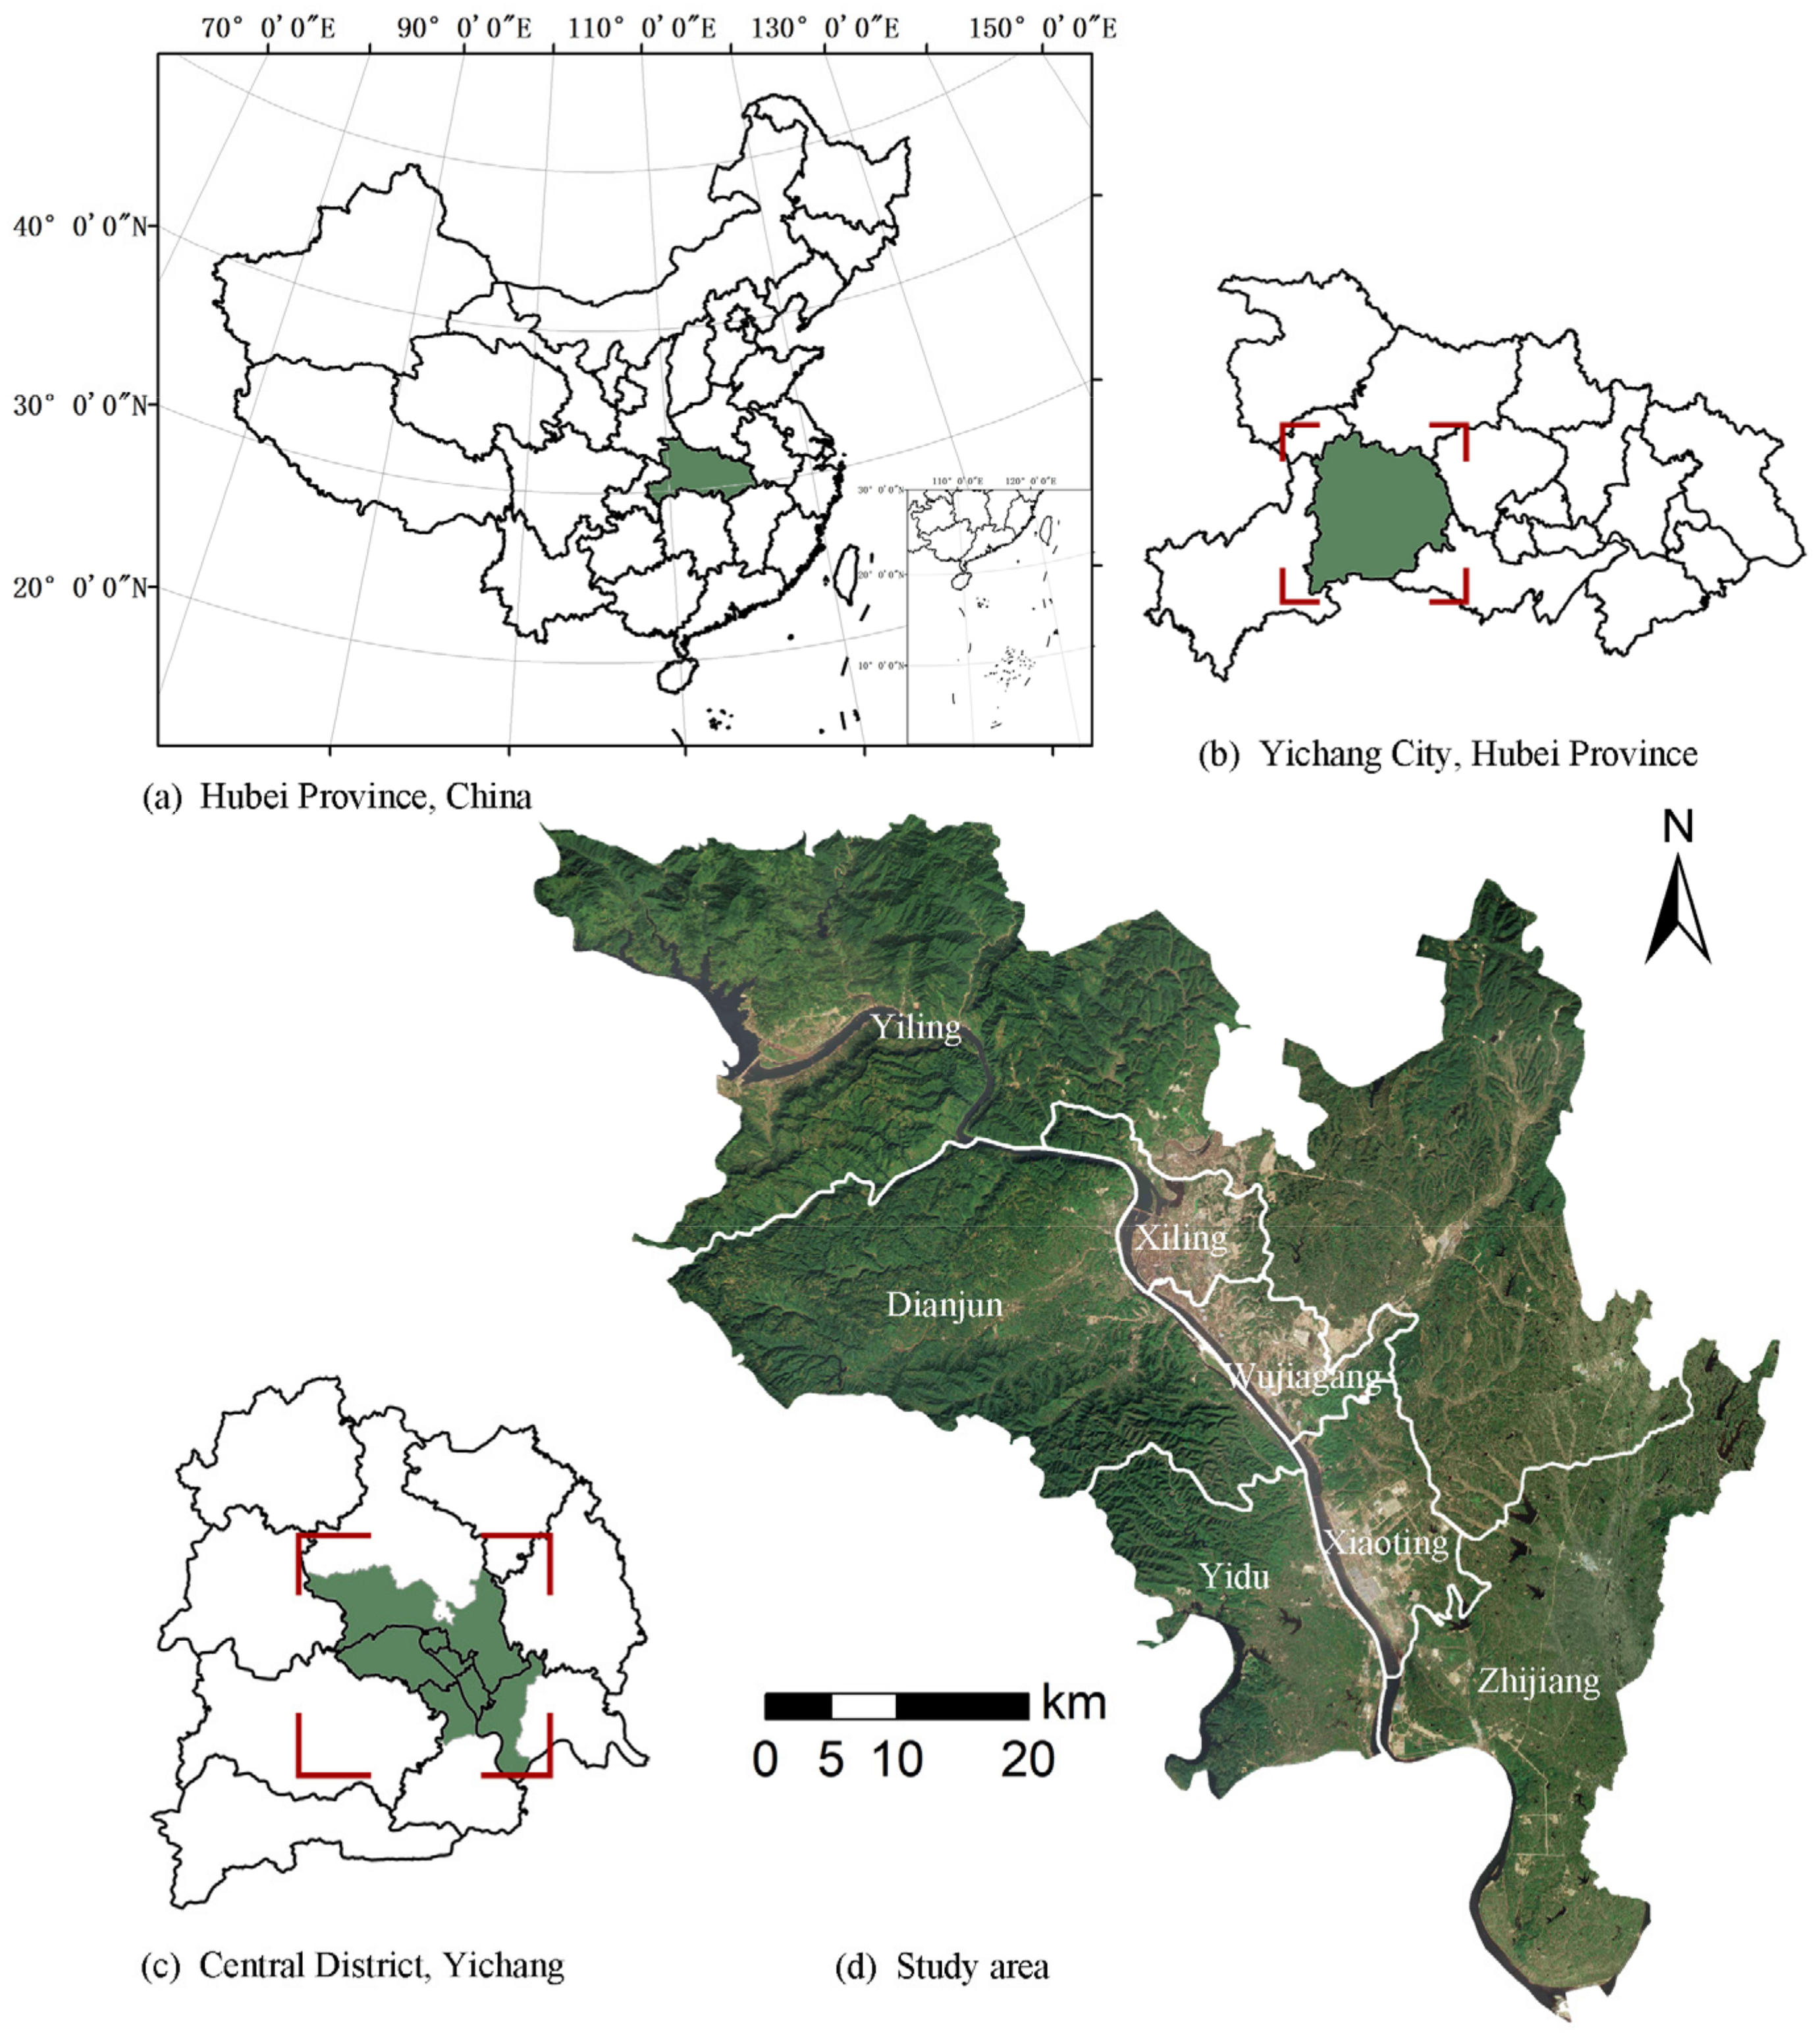
Figure 1. Location of the study area.
Sustainability 15 08313 g001
Figure 2. Research framework.
Sustainability 15 08313 g002
Figure 3. Habitat quality evaluation results.
Sustainability 15 08313 g003
Figure 4. Ecological source site identification results.
Sustainability 15 08313 g004
Figure 5. Integrated resistance surface of focal species.
Sustainability 15 08313 g005
Figure 6. Results of potential ecological corridor identification.
Sustainability 15 08313 g006
Figure 7. Ecological node identification results.
Sustainability 15 08313 g007
Figure 8. Complex network structure diagram.
Sustainability 15 08313 g008
Figure 9. Ecological network structure characteristic values.
Sustainability 15 08313 g009
Figure 10. Planning of an integrated ecological network based on multiple species.
Sustainability 15 08313 g010
Table 1. Data sources.
DataSourceSpatial Resolution
Land use data for 2020Resource and Environmental Science Data Service Center of the Chinese Academy of Sciences (http://www.resdc.cn (accessed on 5 February 2022)), and further corrected the data based on Google Earth HD historical images with visual interpretation30 m
Digital Elevation Model (DEM)Geospatial Data Cloud Platform of Chinese Academy of Sciences (http://wwwgscloud.cn/ (accessed on 4 January 2022))30 m
eMODIS normalized vegetation index (NDVI) dataU.S. Geological Survey website (http://www.usgs.gov/ (accessed on 4 January 2022))250 m
NPP/VIIRS night lighting dataNational Oceanic and Atmospheric Administration website (http://www.noaa.gov/ (accessed on 6 February 2022))500 m
Road dataOpenStreetMap-
Table 2. Analysis of three focal species.
SpeciesYellow-Bellied Tit
(Parus venustulus)
Black-Spotted Side-Pleated Frog
(Pelophylax nigromaculatus)
Grass Hare
(Lepus capensis)
Animal
category
Birds, climbing birdsAmphibiansSmall mammals
Habitat characteristicsIt mainly inhabits various forests in the mountains below 2000 m in altitude and descends to secondary forests, plantation forests and forest edge sparse scrub areas in the low mountains and foot plains in winter [40]It lives in coastal plains to hills and mountains at an altitude of about 2000 m. It is commonly found in paddy fields, ponds, lakes and ditches near still water or slow flowing rivers [41]Most of the subspecies in the Yangtze River valley are distributed in the mountains of the red loam belt and live mostly in winter around villages, narrow valleys, ravines, scrubs and grasses at the edge of fields. In summer and autumn, they tend to dig holes in the forest or scrub on ventilated and cool hills [42]
Protection levelChina’s special birds; List of Terrestrial Wild Animals of National Protection Beneficial or of Economic or Scientific Research Value (China); Red List of Threatened Species (IUCN): 2016–Least Concern (LC)Red List of Threatened Species (IUCN) ver 3.1: 2004–Near Threatened (NT); Red List of China’s Biodiversity—Vertebrates Volume (Amphibians)—Near Threatened (NT)List of Terrestrial Wild Animals of National Protection Beneficial or of Economic or Scientific Research Value (China); Red List of Mammalia rabbits (IUCN) ver 3.1: 2008–Low Risk (LC)
Table 3. Area and proportion of habitat quality classes for each focal species.
Habitat QualityYellow-Bellied TitBlack-Spotted Side-Pleated FrogGrass Hare
Area (ha)ProportionArea (ha)ProportionArea (ha)Proportion
Low(0~0.5)109,834.238.78%214,167.1575.62%111,075.2139.22%
Medium (0.5~0.8)50,321.0717.77%216.540.08%120,743.1942.63%
High (0.8~1)123,055.6543.45%68,827.2324.30%51,392.5218.15%
Total283,210.92100.00%283,210.92100.00%283,210.92100.00%
Table 4. Importance index and area of ecological source site patches.
Yellow-Bellied TitdPCArea/haBlack-Spotted Side-Pleated FrogdPCArea/haGrass HaredPCArea/ha
a115.416467.58b18.461695.60c16.33272.79
a225.919875.70b228.375611.50c211.67591.21
a39.413803.13b339.06368.82c37.41594.18
a411.485748.66b458.795661.90c421.981185.48
a55.932743.65b543.446300.81c57.77397.62
a642.4015,645.33b649.3110,145.79c628.42735.39
a73.741310.49b76.20186.30c714.091064.61
a837.4112,533.49b814.233513.24c816.81535.95
a911.793347.64 c928.011586.70
a104.011771.74 c1019.091965.60
c118.14519.03
c1212.521702.08
c137.06310.50
Table 5. Potential ecological corridor length and cumulative resistance values.
SpeciesSerial NumberEcological CorridorLength (km)Cumulative Resistance Value
Yellow-bellied tit1Corridor 1–217.4731480
2Corridor 1–629.3813826
3Corridor 2–313.2811561
4Corridor 2–620.563204
5Corridor 3–440.4958029
6Corridor 3–539.2868537
7Corridor 3–620.1311688
8Corridor 3–830.6744791
9Corridor 4–58.5391366
10Corridor 4–730.974349
11Corridor 4–845.64210,958
12Corridor 5–724.623684
13Corridor 5–847.5455914
14Corridor 6–819.9532479
15Corridor 7–829.4226243
16Corridor 7–914.7794577
17Corridor 7–1027.4346784
18Corridor 8–919.3262445
19Corridor 8–1032.2023058
20Corridor 9–1013.9831838
Black-spotted side-pleated frog1Corridor 1–211.5196380
2Corridor 1–418.8498876
3Corridor 1–632.83631,698
4Corridor 2–412.5316216
5Corridor 2–515.1373406
6Corridor 3–414.14711,827
7Corridor 3–512.4665209
8Corridor 3–626.99115,373
9Corridor 3–712.8535543
10Corridor 3–822.14510,329
11Corridor 4–510.7523239
12Corridor 4–626.70316,720
13Corridor 5–710.3815094
14Corridor 7–89.5515354
Grass hare1Corridor 1–26.3761366
2Corridor 1–412.6233208
3Corridor 1–714.7533120
4Corridor 2–47.3781570
5Corridor 2–511.8172284
6Corridor 2–610.7382769
7Corridor 2–711.8512334
8Corridor 3–47.2881887
9Corridor 3–57.3671185
10Corridor 3–1232.910,667
11Corridor 4–55.7811079
12Corridor 4–612.3072862
13Corridor 5–610.3832365
14Corridor 5–85.9171358
15Corridor 5–913.2873542
16Corridor 5–1230.5169928
17Corridor 6–78.5782167
18Corridor 6–85.121120
19Corridor 6–99.8752619
20Corridor 6–1013.8281903
21Corridor 6–1115.9933425
22Corridor 7–1011.1022125
23Corridor 8–97.2553049
24Corridor 9–1017.0323435
25Corridor 9–1111.1592575
26Corridor 9–1226.0346709
27Corridor 9–1320.434610
28Corridor 10–118.3831592
29Corridor 11–1324.7114926
30Corridor 12–1311.2863099
Disclaimer/Publisher’s Note: The statements, opinions and data contained in all publications are solely those of the individual author(s) and contributor(s) and not of MDPI and/or the editor(s). MDPI and/or the editor(s) disclaim responsibility for any injury to people or property resulting from any ideas, methods, instructions or products referred to in the content.