
Aeolian Sand Test with True Triaxial Stress Path Achieved by Pseudo-Triaxial Apparatus
Abstract
:1. Introduction
2. Experimental Procedures
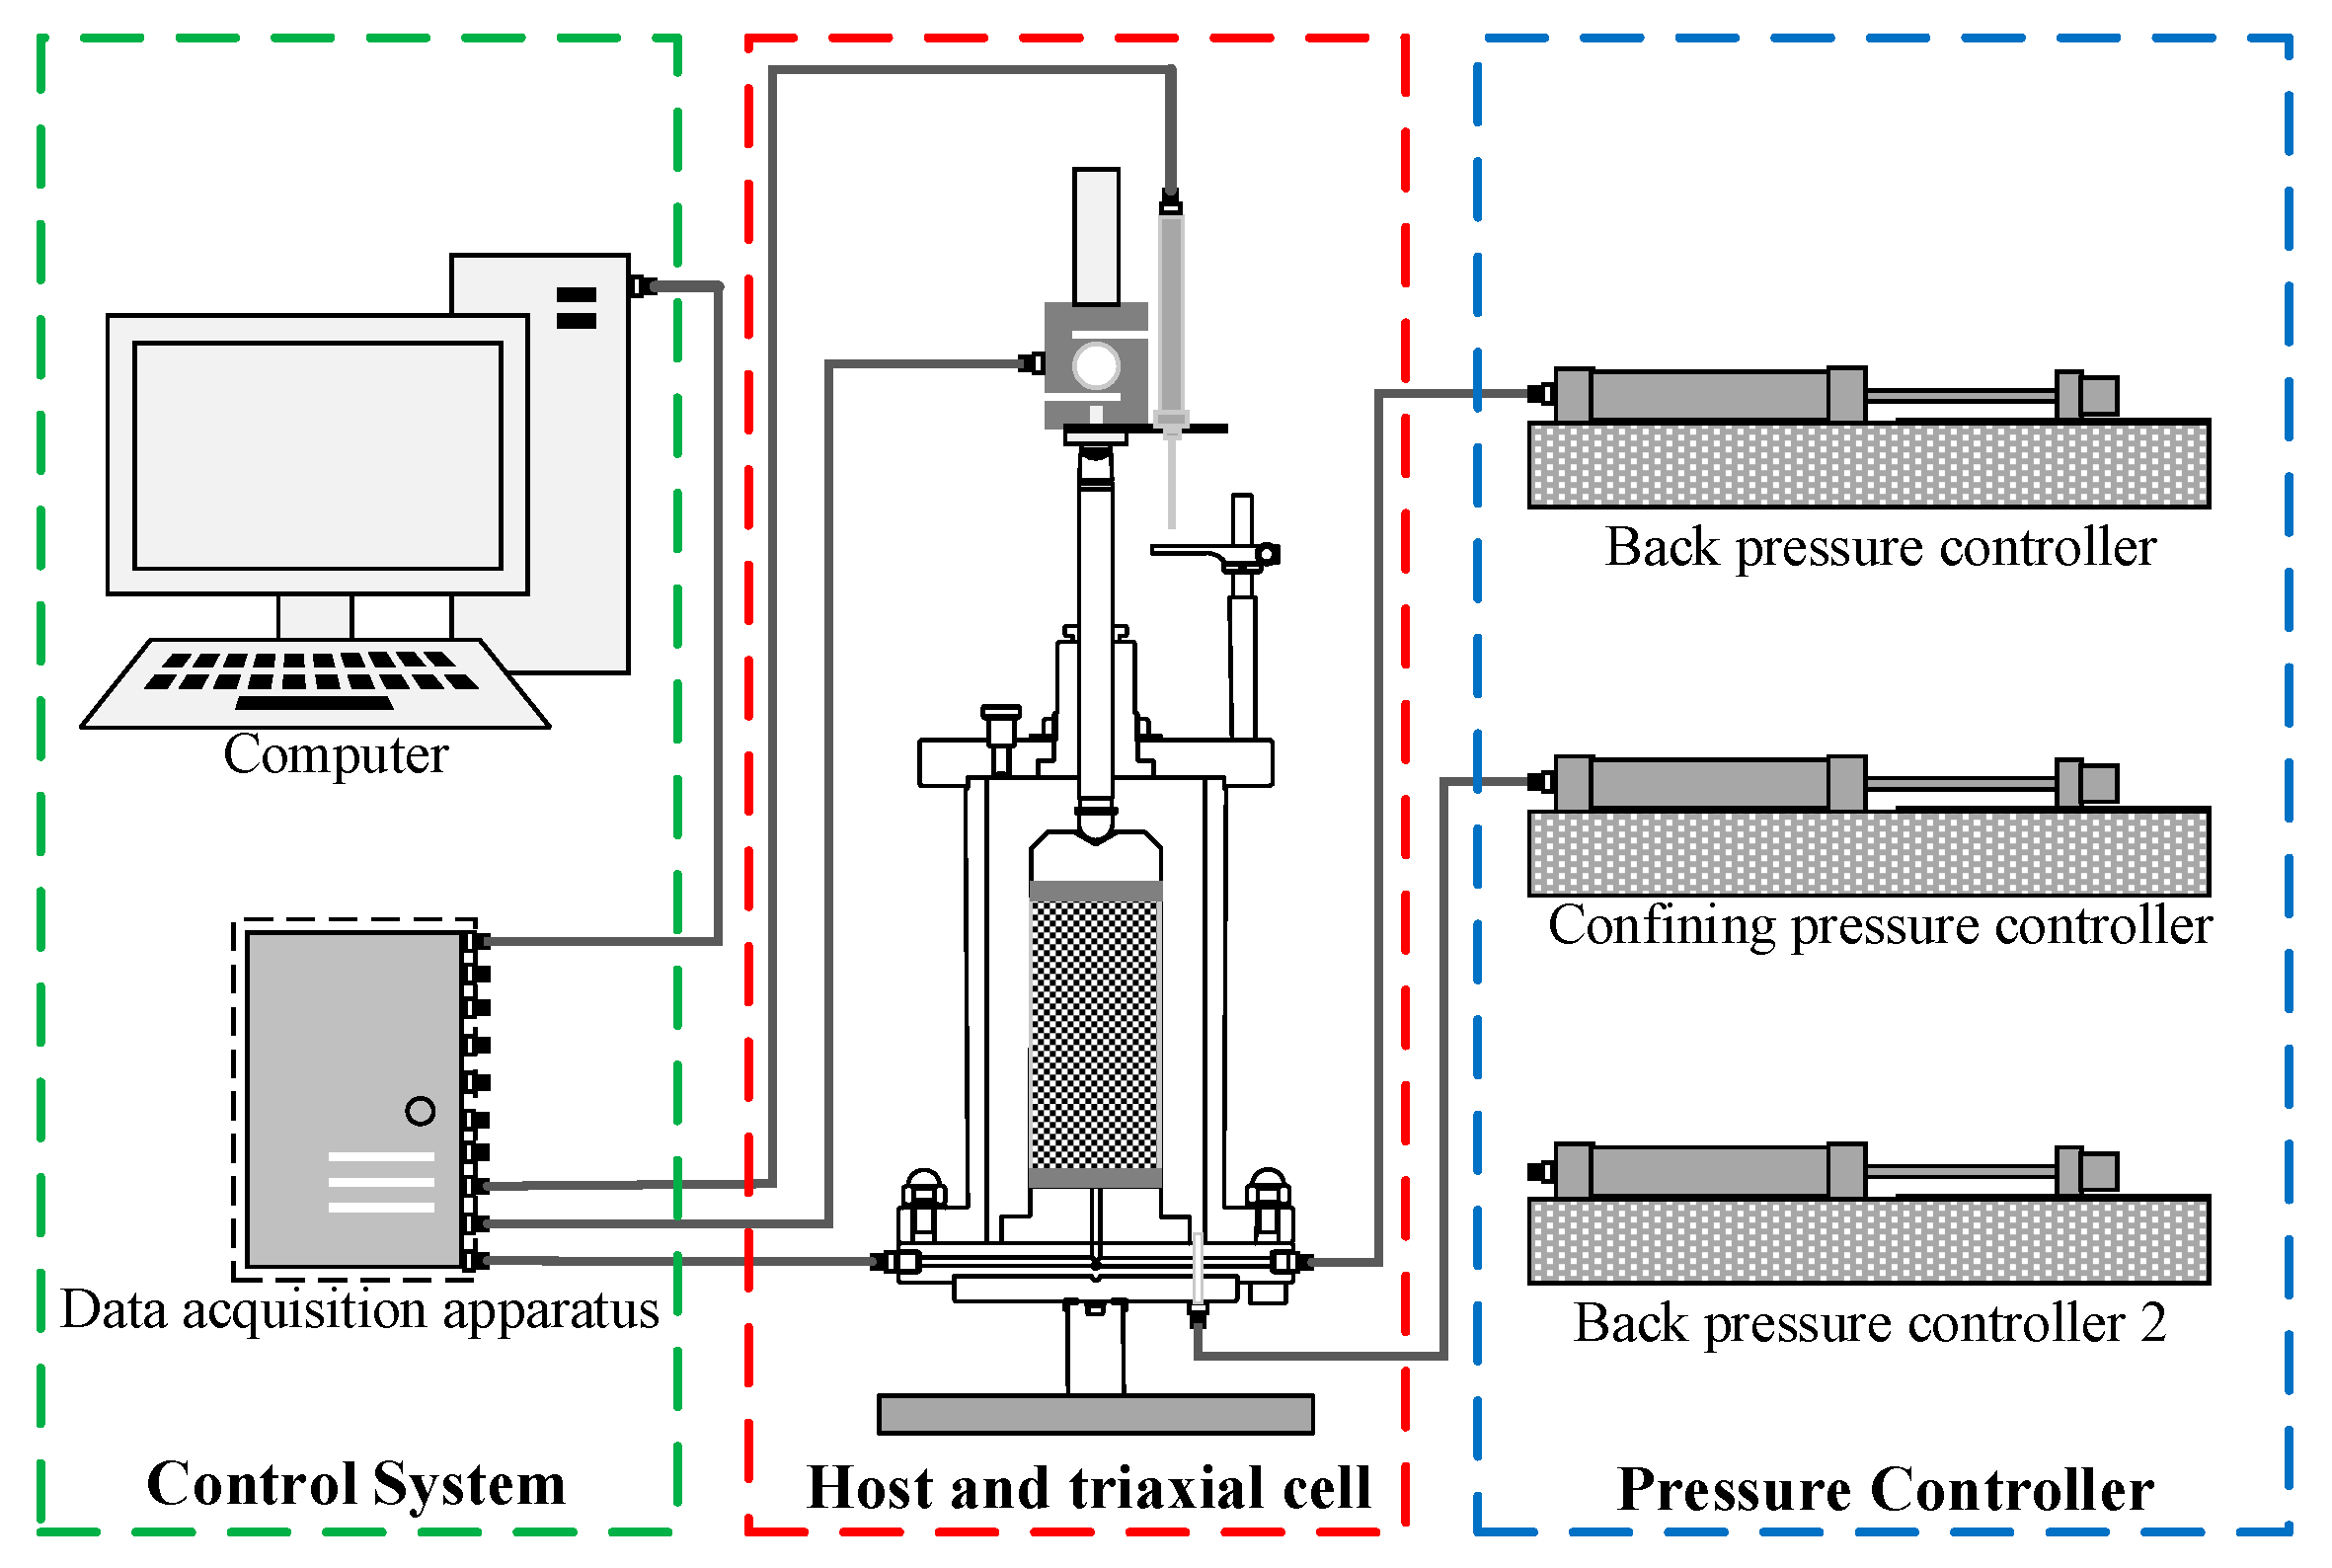
2.1. Pseudo-Triaxial Apparatus
2.2. Material Parameters of Aeolian Sand
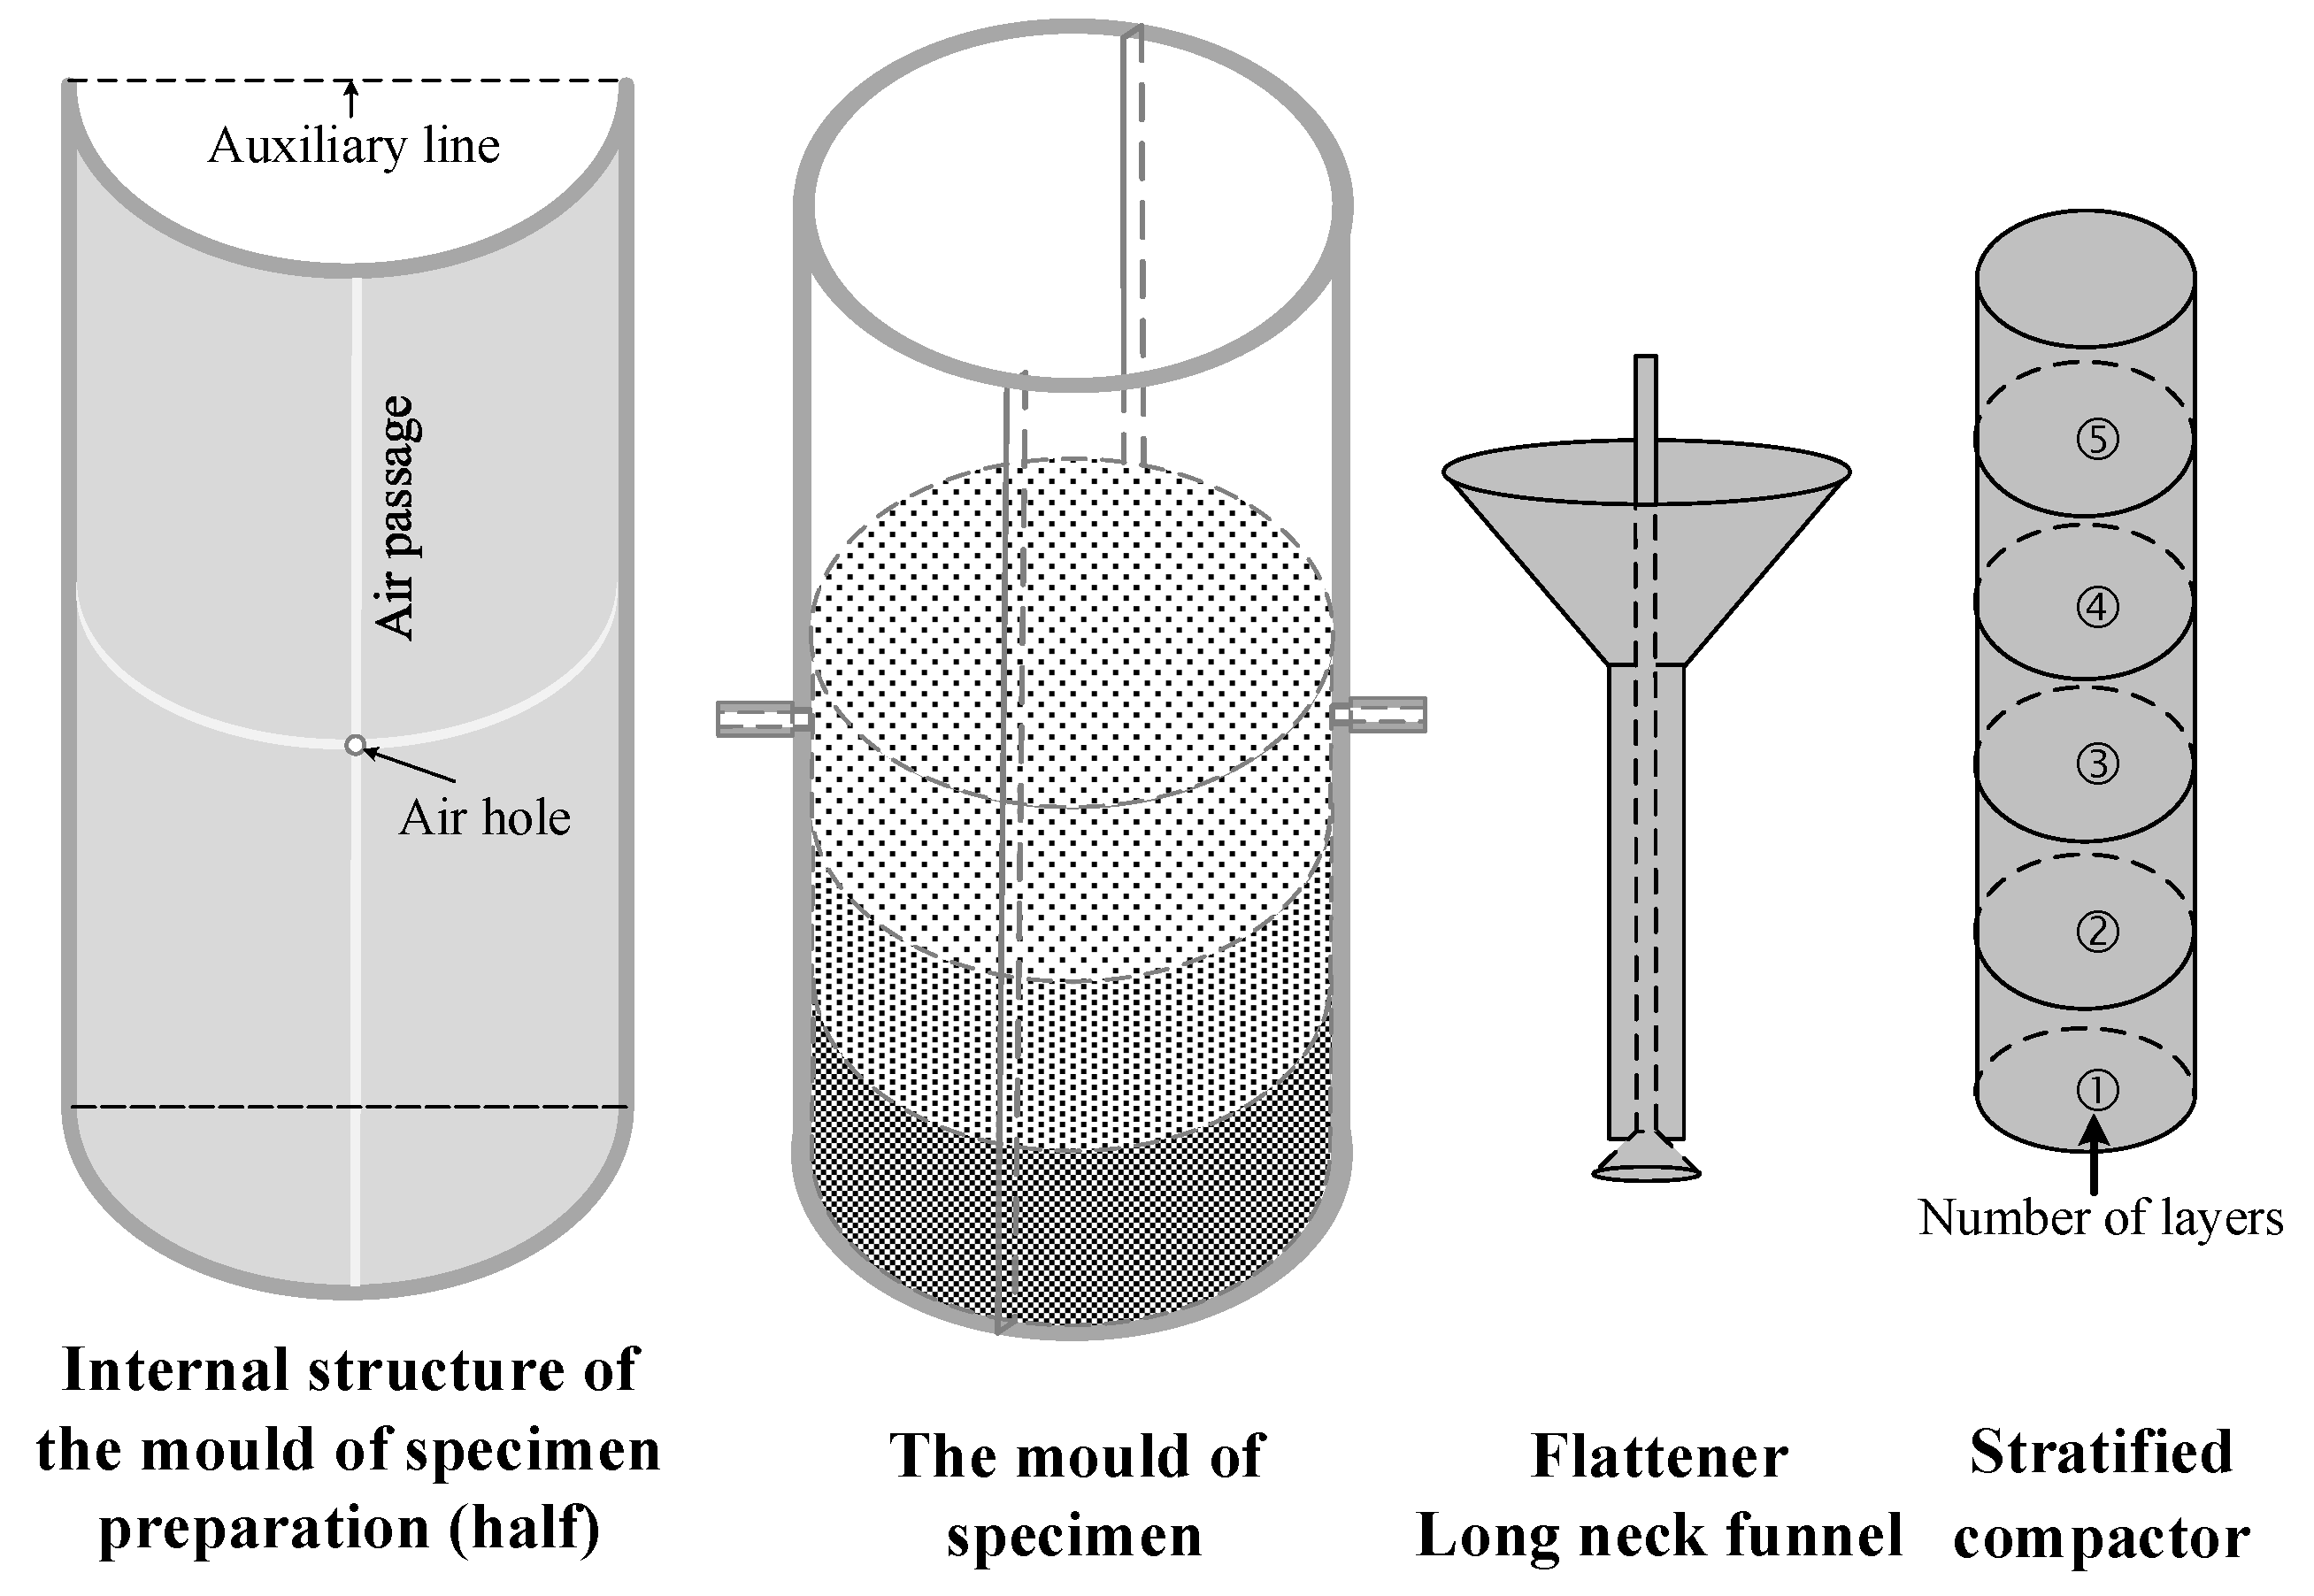
2.3. Specimen Preparation
3. Test Method and Strength Criterion
3.1. Test Method Introduction
3.2. Strength Criterion
4. Test Scheme and Results
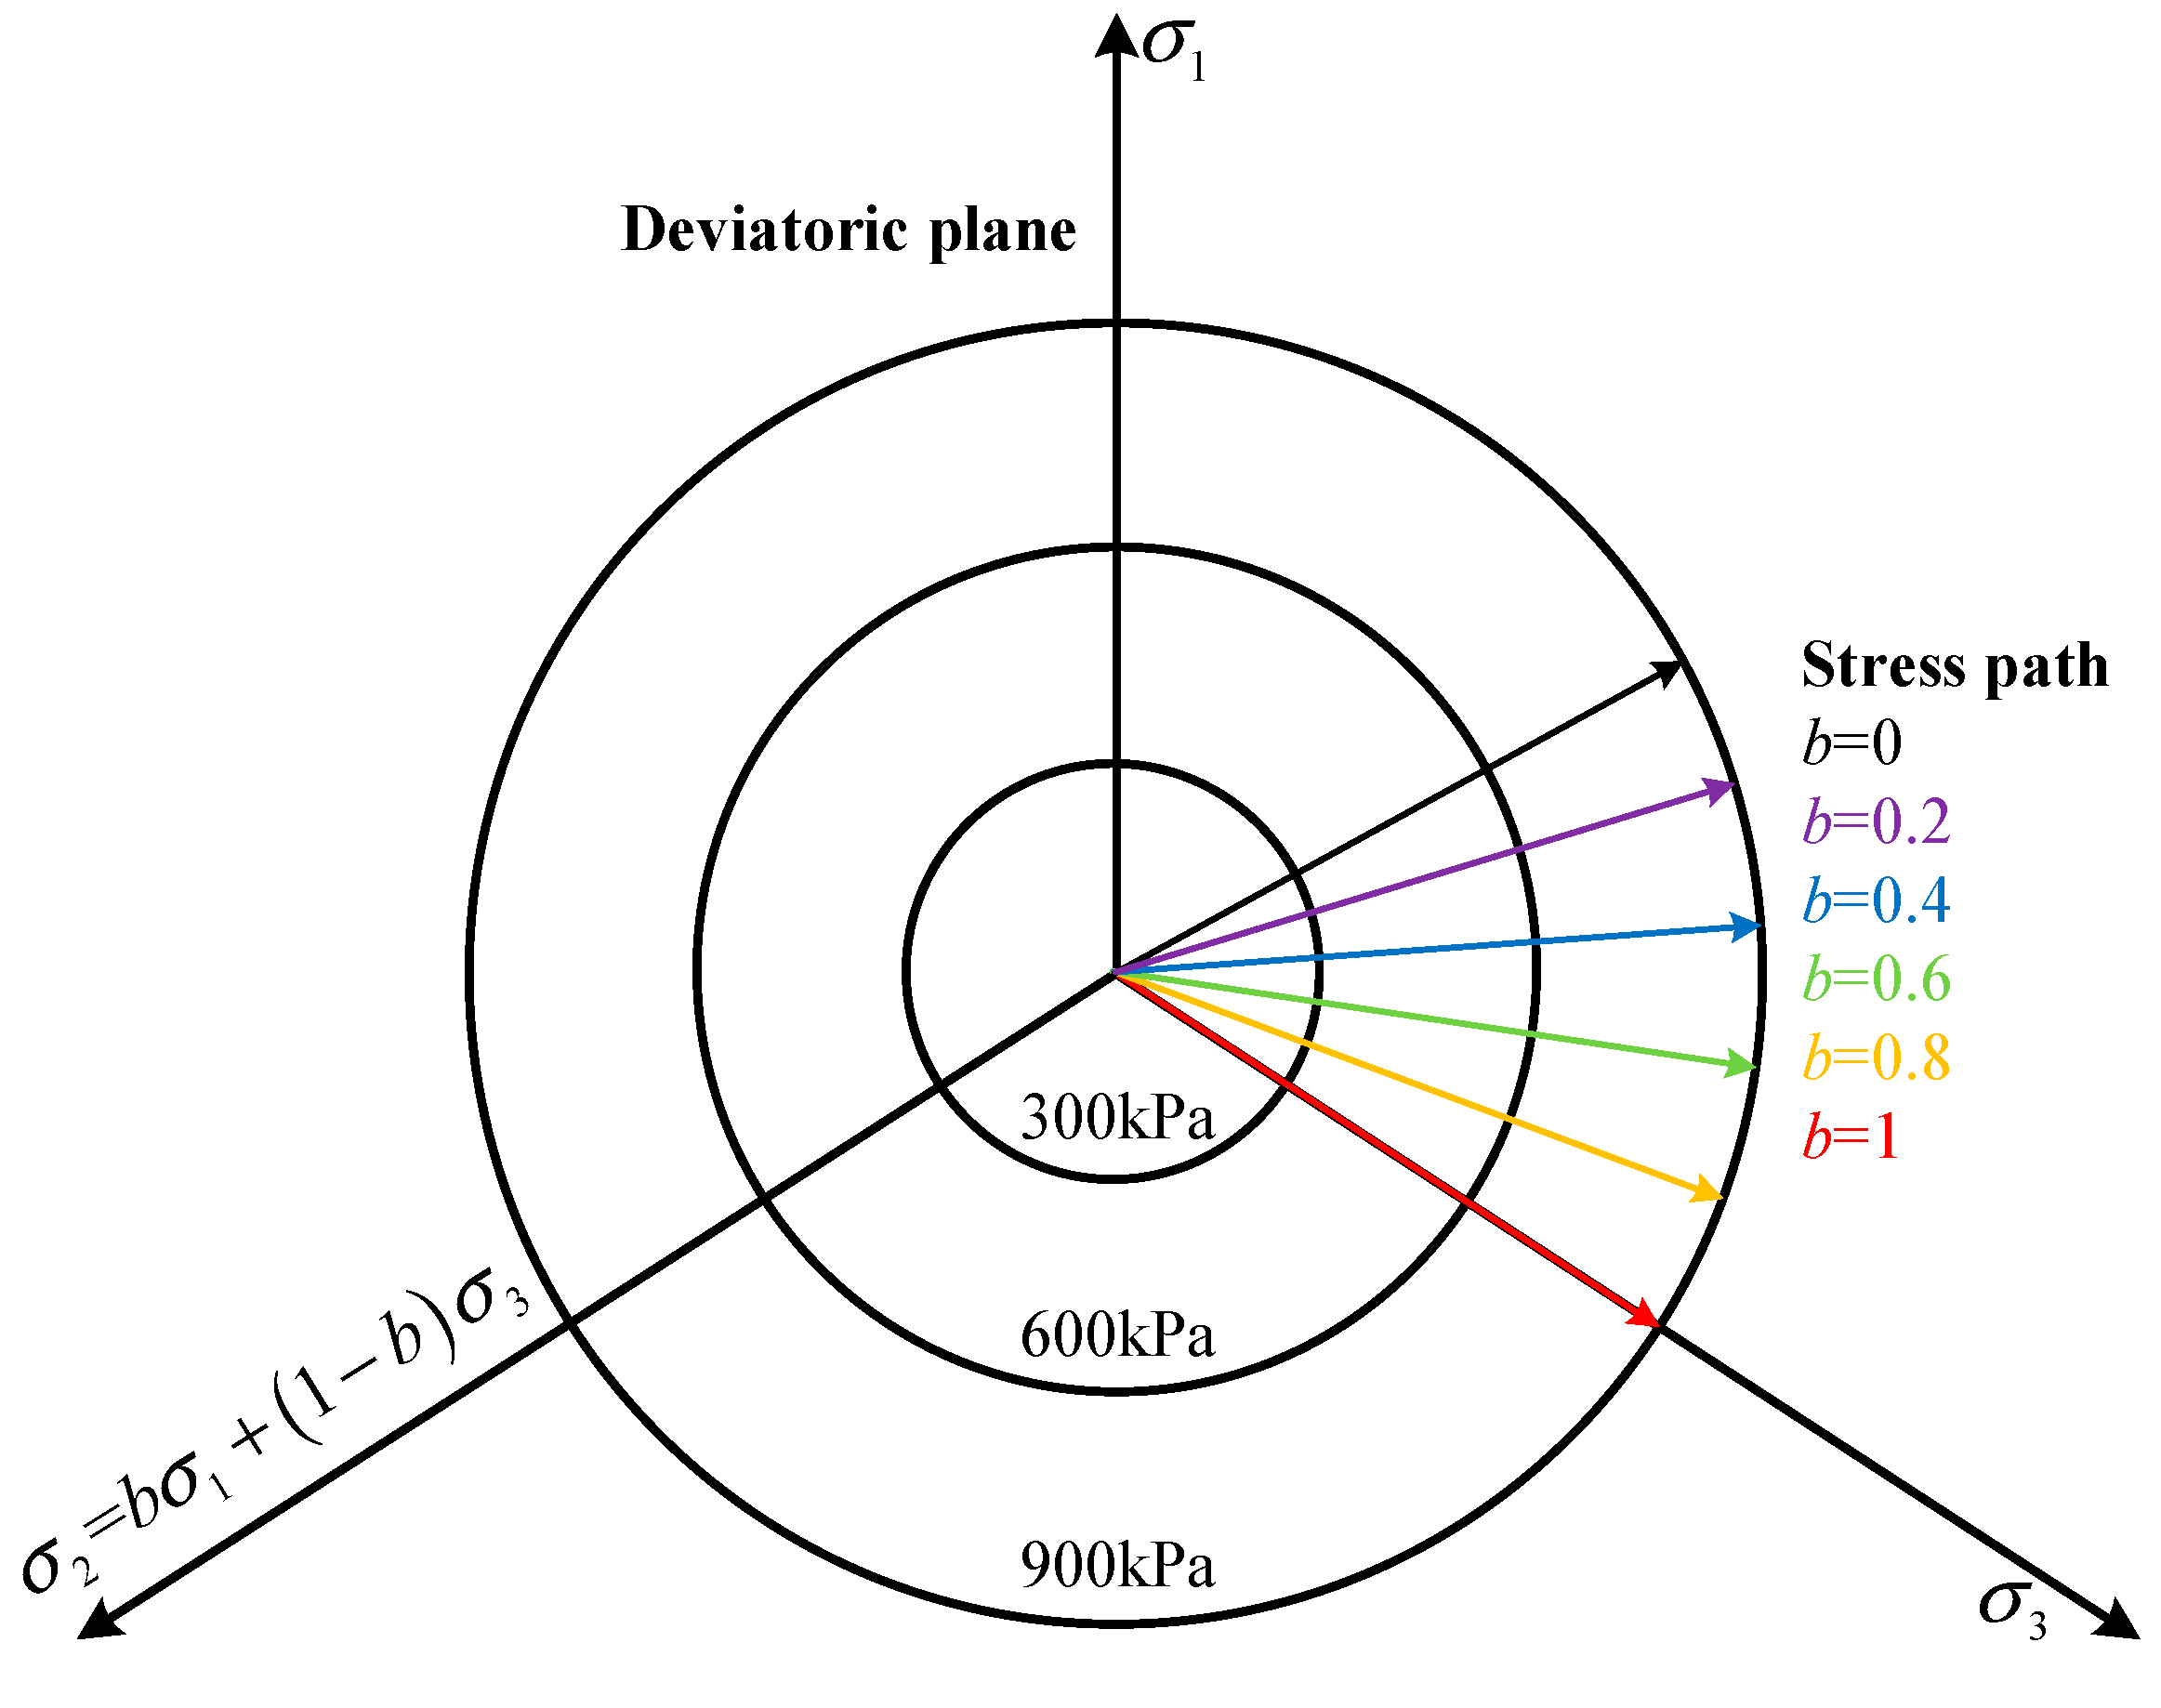
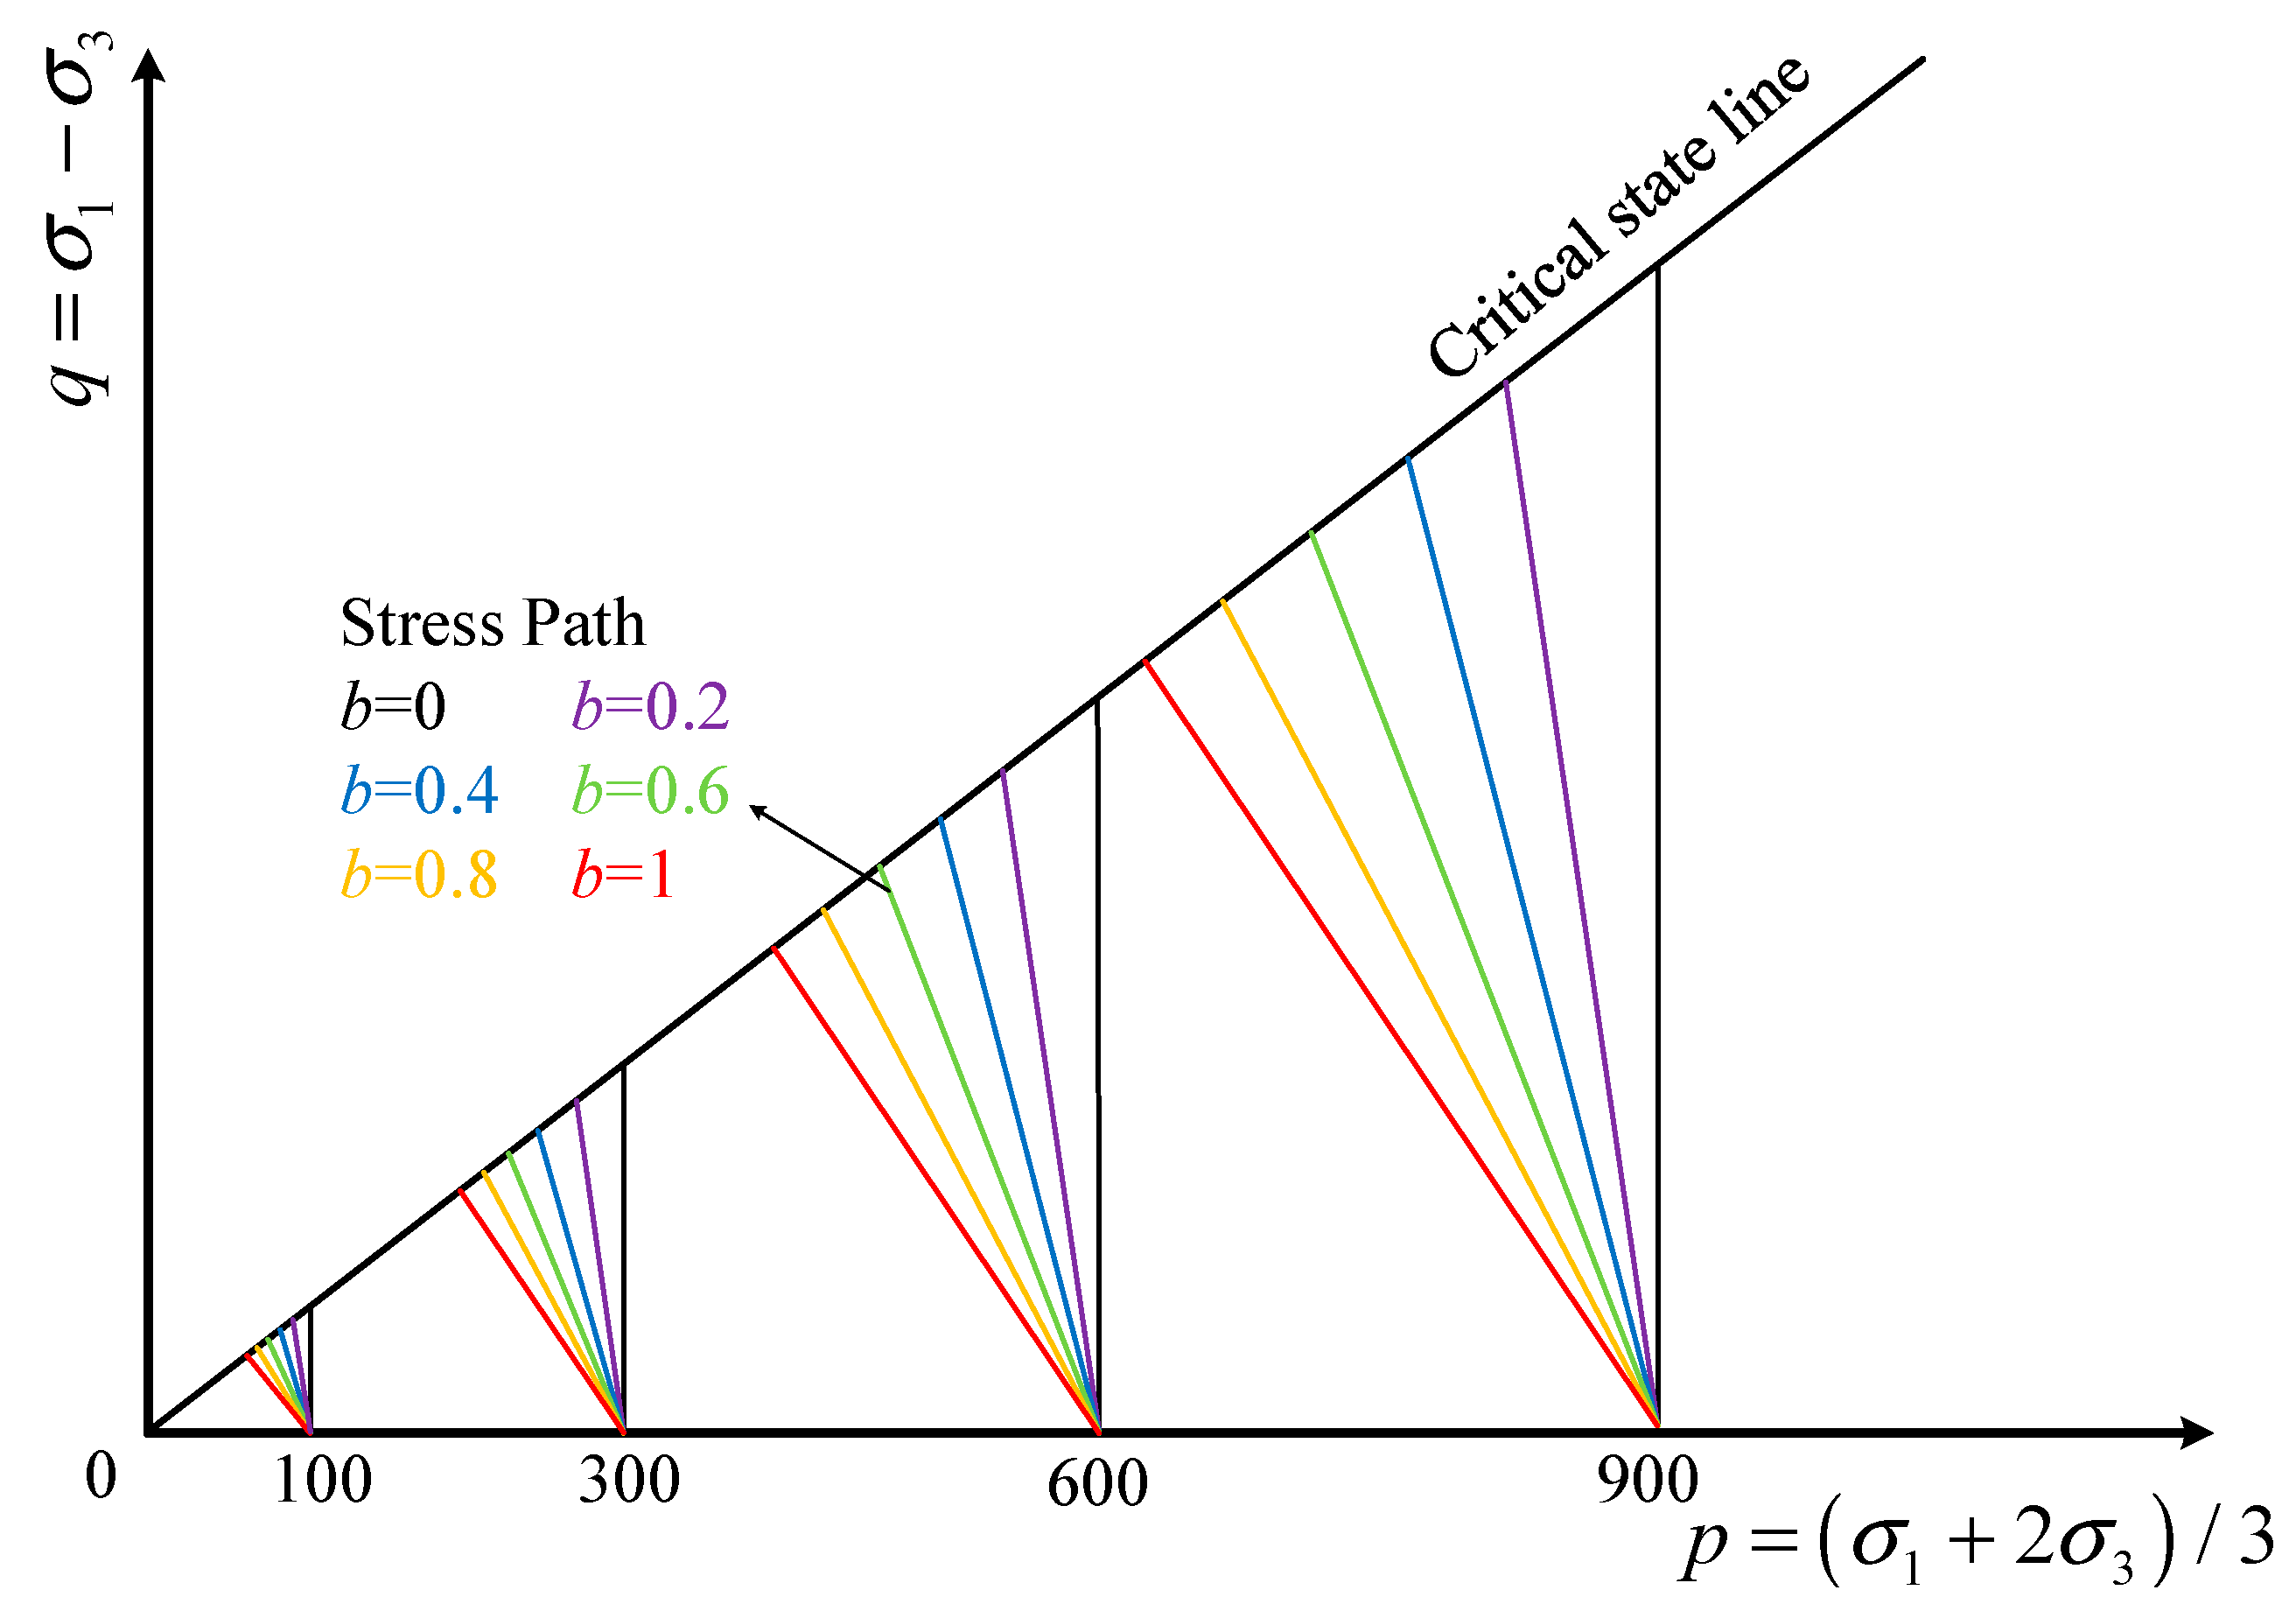
4.1. Stress Path Test Scheme

| p(kPa) | b | Loading Method |
|---|---|---|
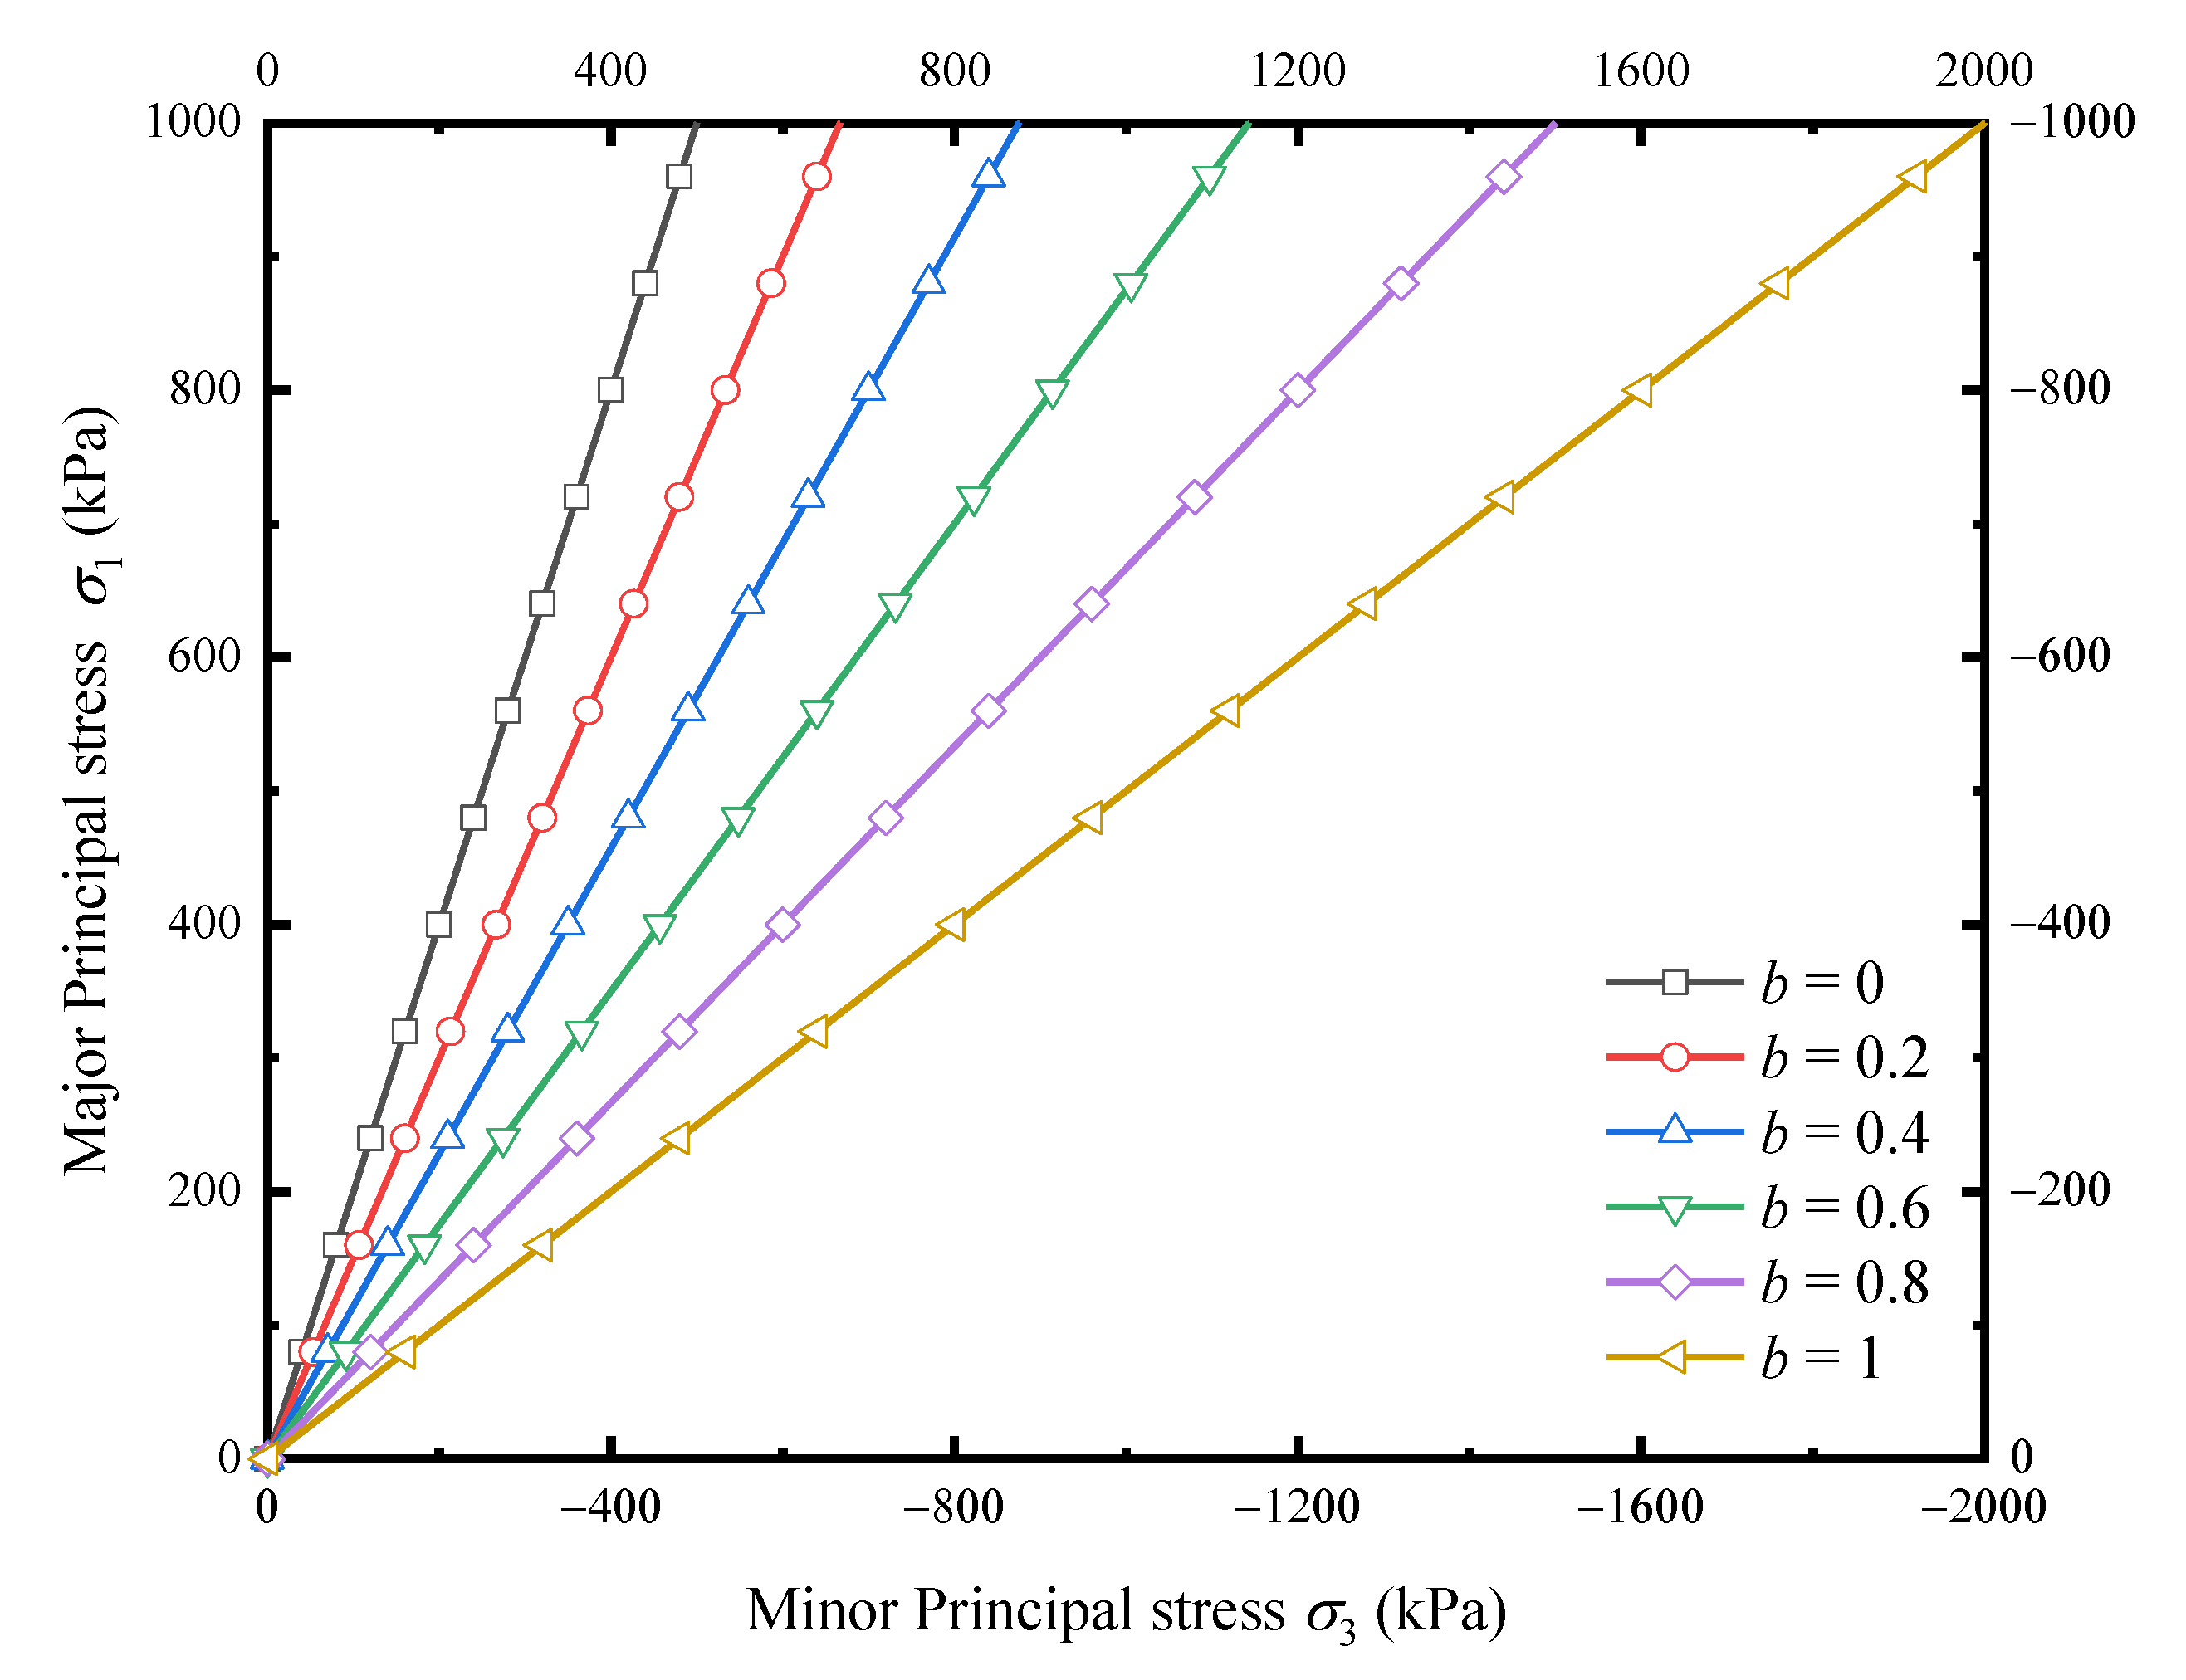
| 100 300 600 900 | 0 | The test adopts stress-controlled loading, and the constant p loading is achieved by controlling the increase of σ1 and the decrease of σ3; by controlling the increase rate of σ1 and the decrease rate of σ3, loading schemes of different b are achieved, i.e., Δσ3 = (b + 1)/(b − 2)·Δσ1; the control ratios of σ1 and σ3 are shown in Figure 4. |
| 0.2 | ||
| 0.4 | ||
| 0.6 | ||
| 0.8 | ||
| 1 |
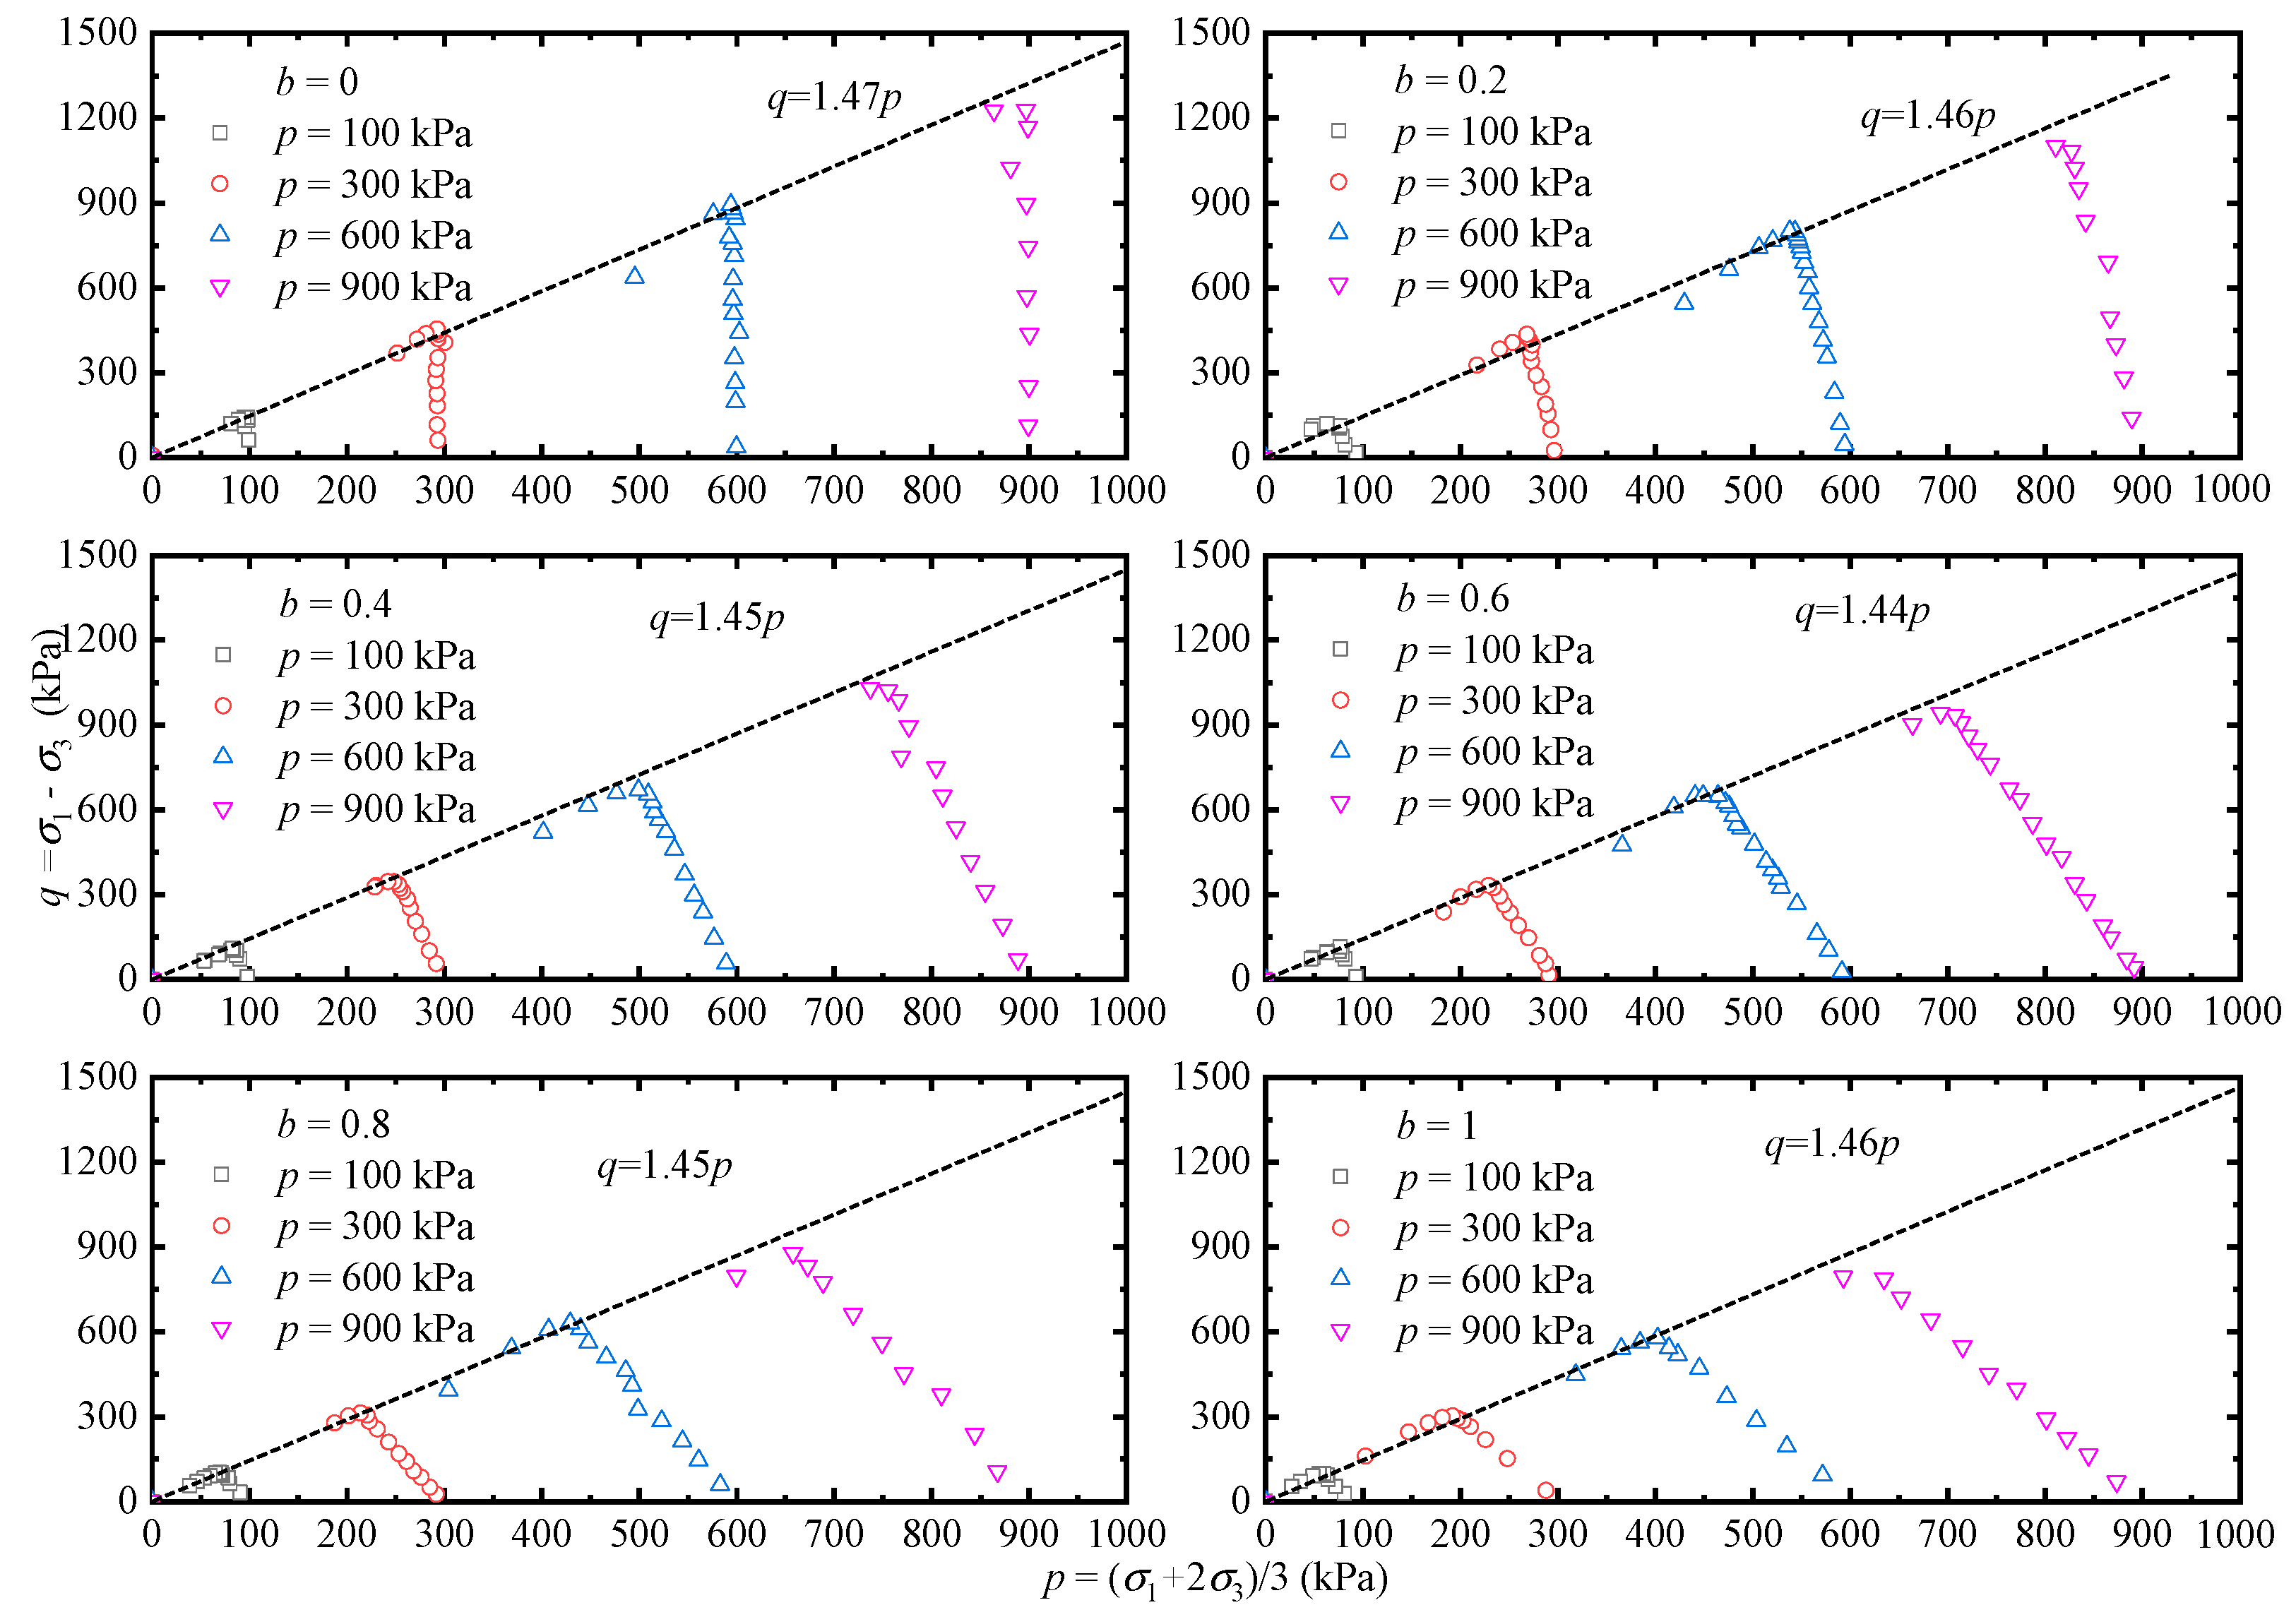
4.2. Stress Path Test Results
5. Conclusions and Discussion
- (1)
- The strength on the deviatoric plane in the equivalent study of the pseudo-triaxial test is similar to the characteristics measured by the true triaxial test, i.e., the peak shear stress decreases as b increases. It is shown that the PTA can equivalently achieve some stress paths of the TTA. The test results have verified the feasibility and rationality of the proposed method, indicating that the PTA can equivalently achieve some functions of the TTA.
- (2)
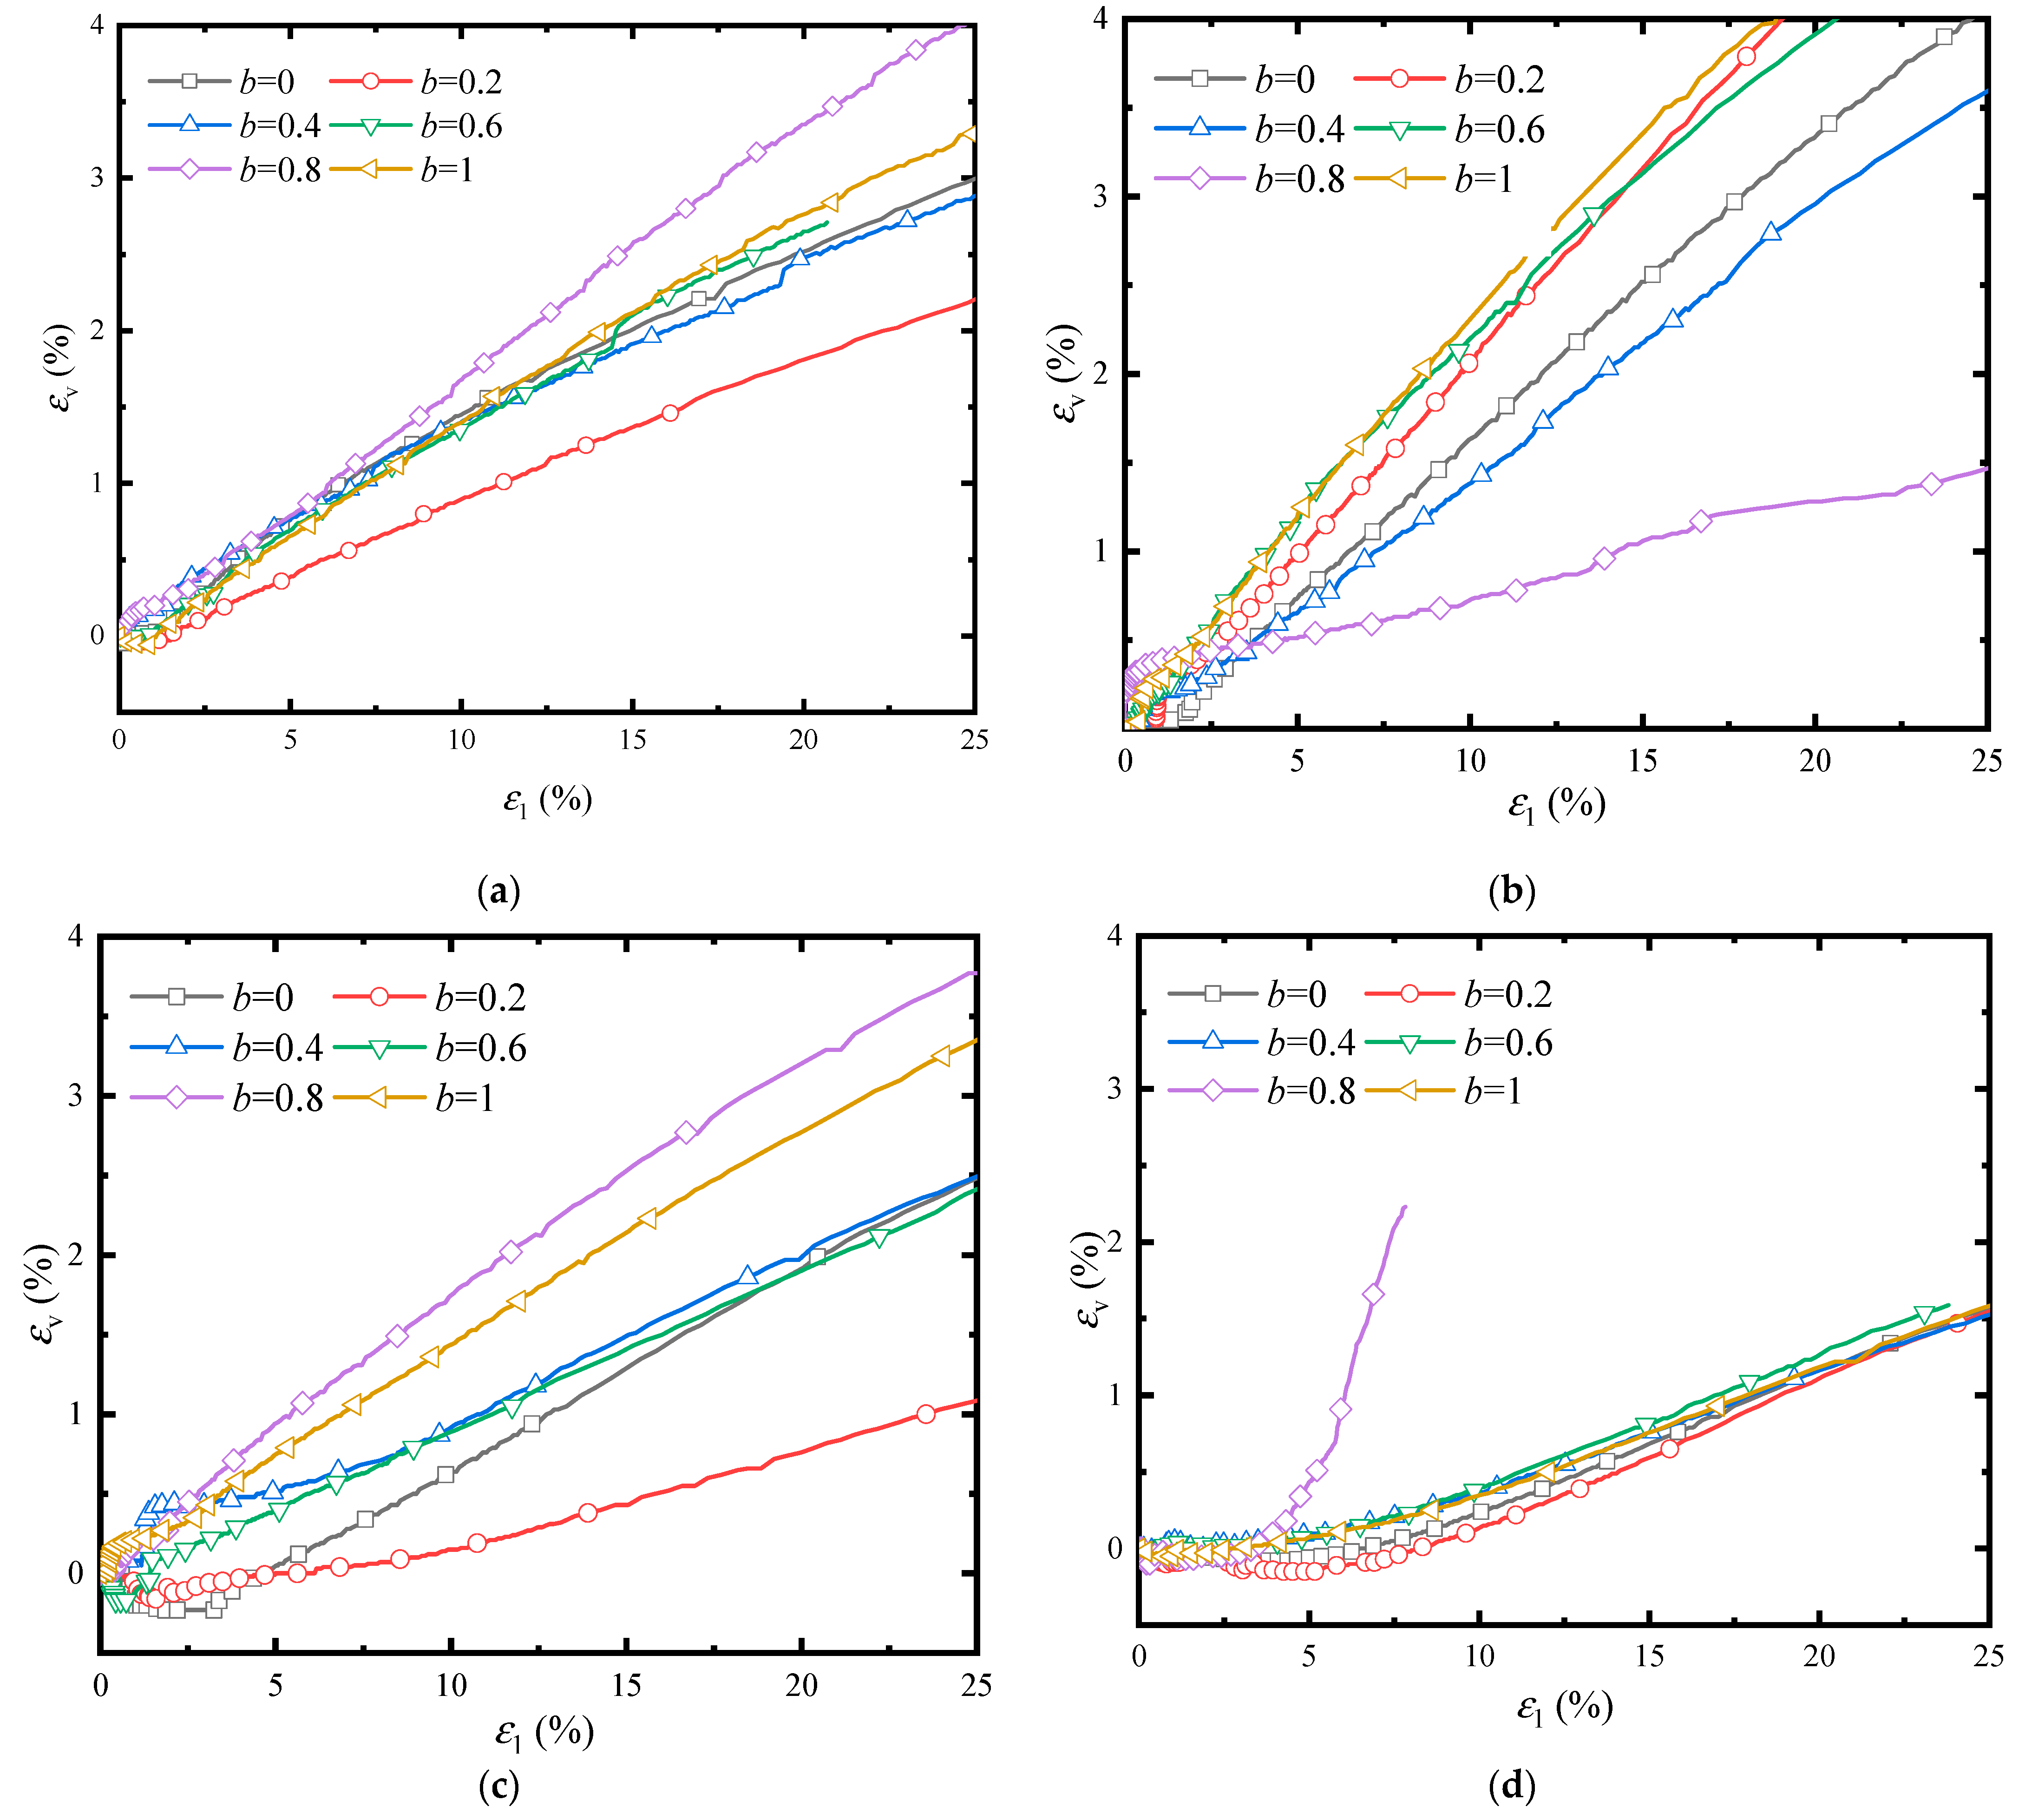
- The deformation failure mode of aeolian sand is mainly dilatancy at the lower p, and it also shows the contraction first and then dilatancy when p is larger and b is smaller. The deformation and failure modes are affected by p, q, and b, and the influence of the three factors needs to be considered comprehensively.
- (3)
- At the lower p, the linear relationship between ε3 and ε1 changes with b, and the deformation degree in different directions are different, which is significantly affected by the initial anisotropy. The εs/η-εs relationships can be described by a unified linear equation. At the same p, the slope of the εs/η-εs curve increases with the increase of b, and the strain-softening phenomenon is enhanced. The stress–strain relationships are affected by both p and b.
- (4)
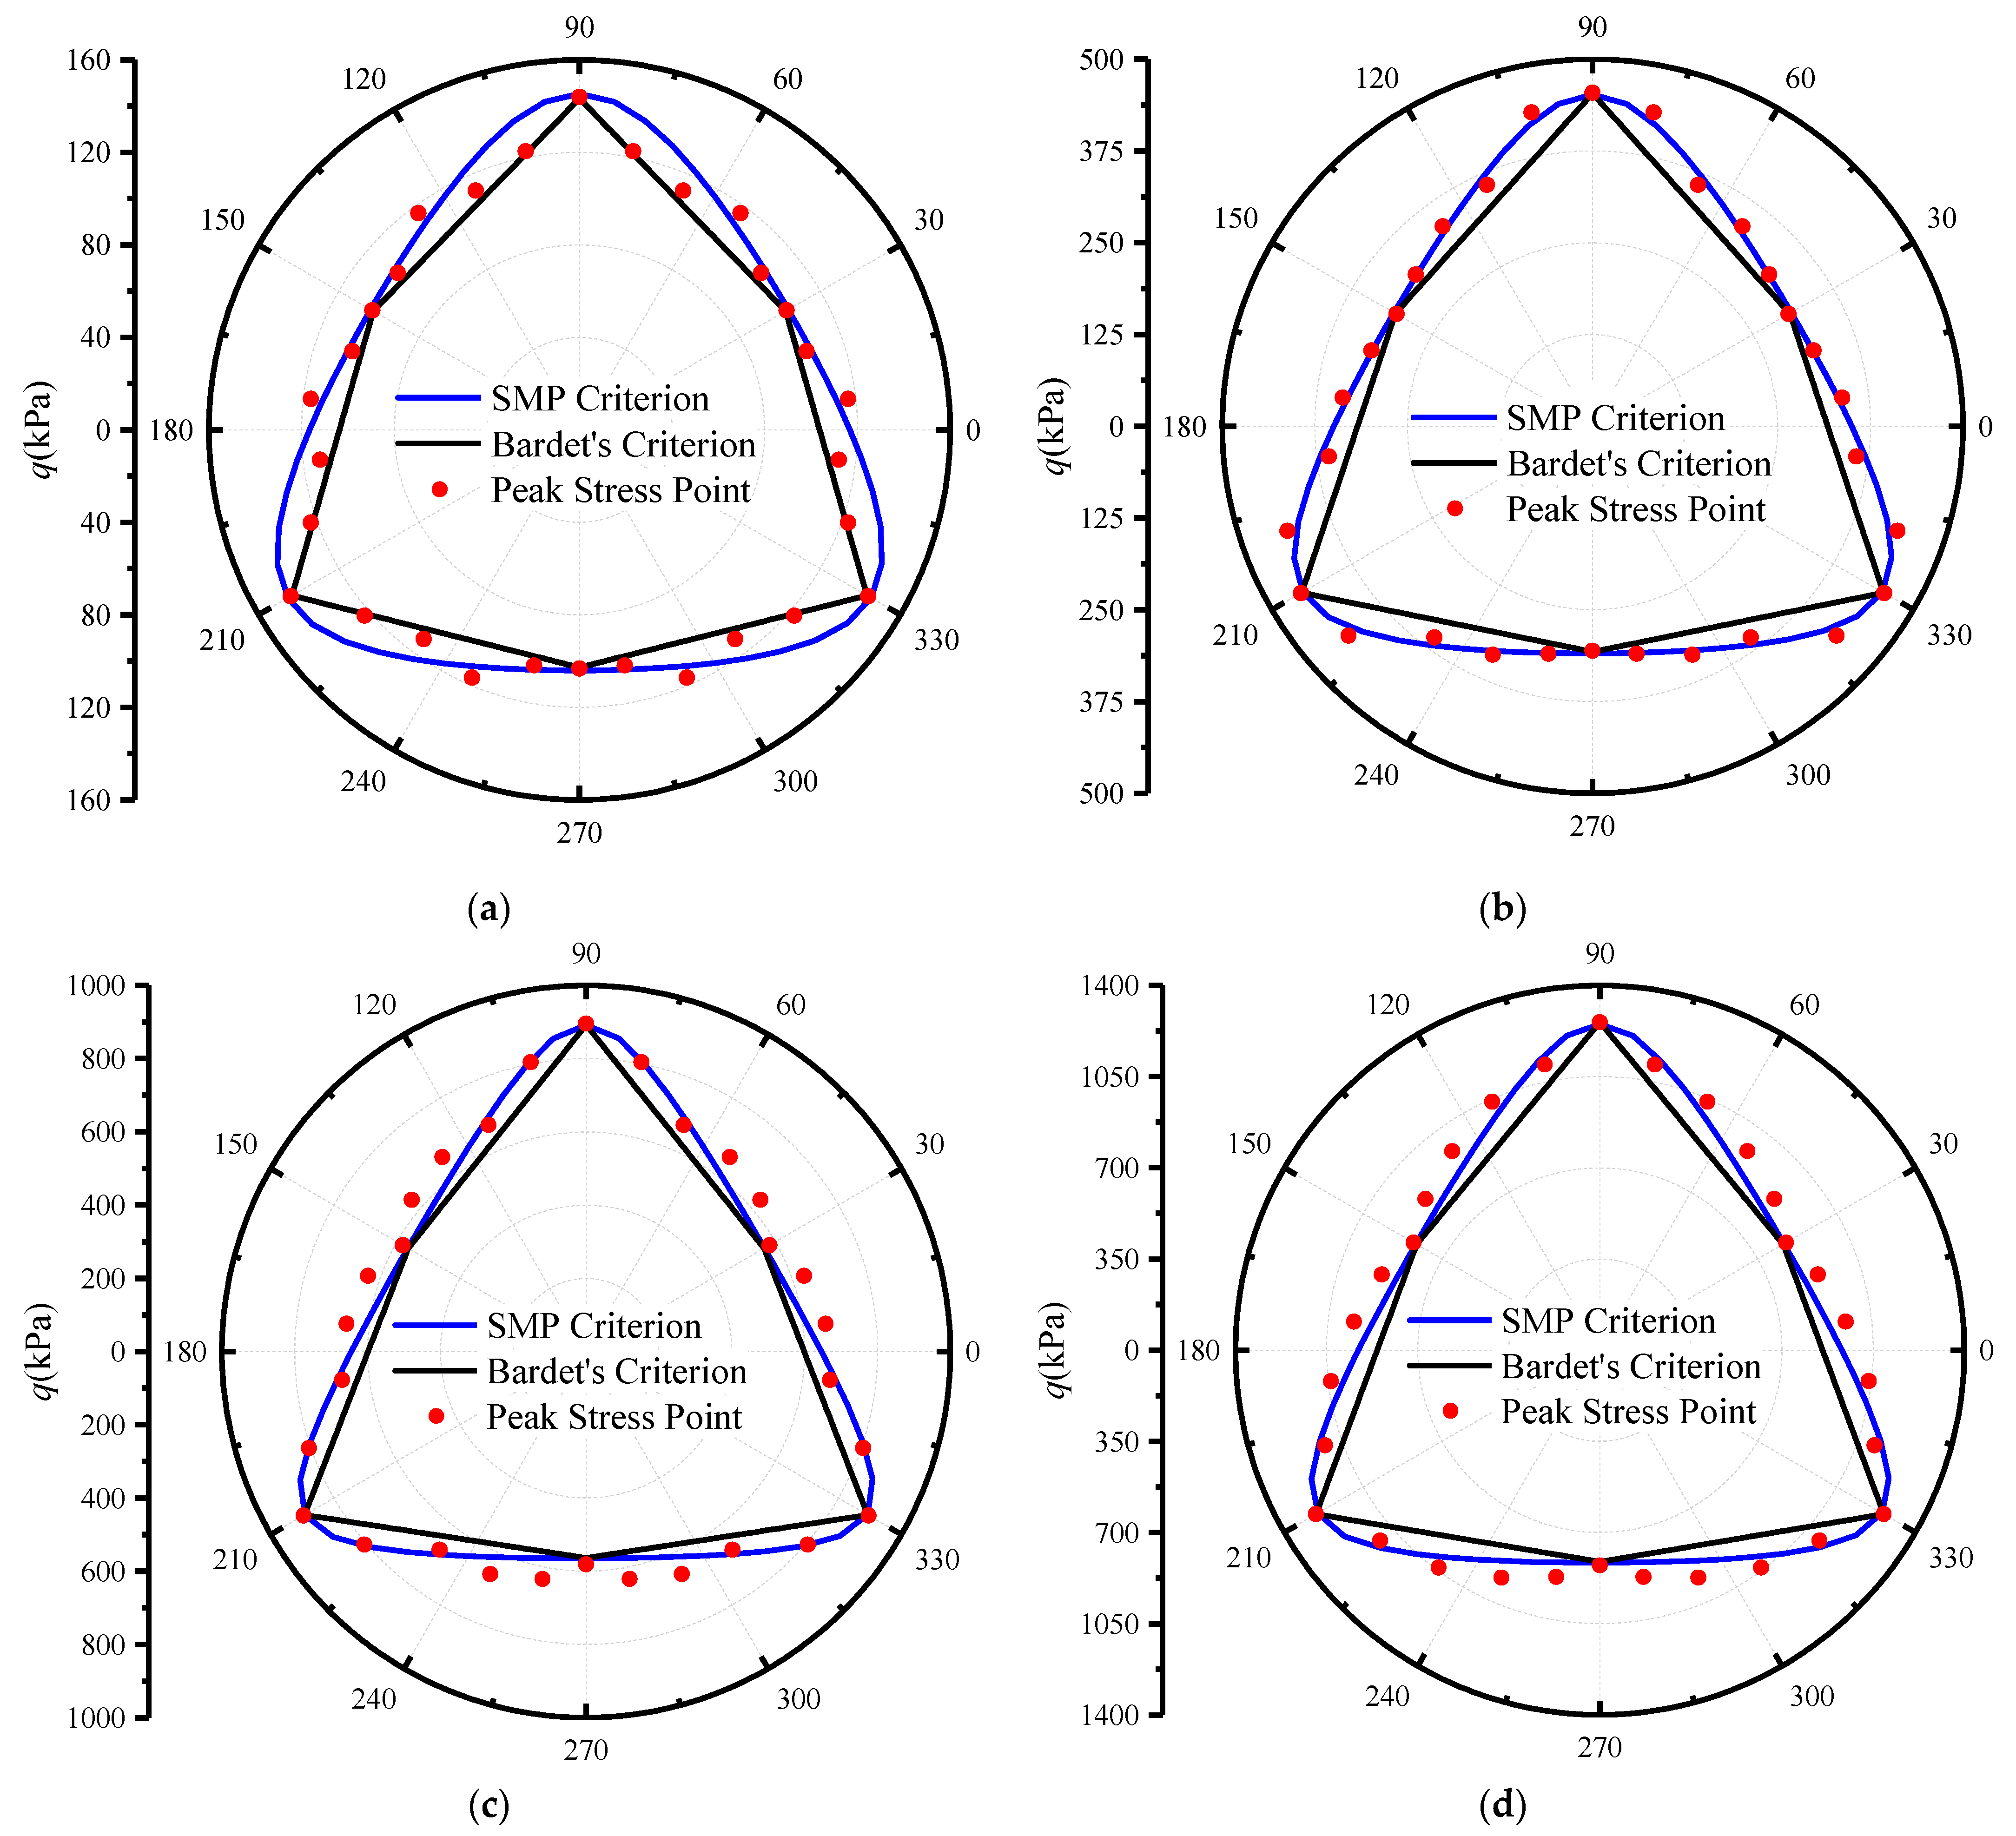
- Compared with the predicted strength lines of the SMP and Mohr–Coulomb criterion, the peak shear stress points are evenly distributed near the predicted failure surface, which better represents the peak strength characteristics at the special stress paths. The test results, once again, demonstrate the feasibility and rationality of achieving a three-dimensional stress path on the deviatoric plane with the PTA.
6. Patents
Author Contributions
Funding
Institutional Review Board Statement
Informed Consent Statement
Data Availability Statement
Conflicts of Interest
References
- Kjellman, W. Report on an apparatus for consummate investigation of the mechanical properties of soils. In Proceedings of the 1st International Conference on Soil Mechanics and Foundation Engineering, Cambridge, MA, USA, 22–26 June 1936; Volume 2, pp. 16–20. [Google Scholar]
- Bishop, A.W. The strength of soils as engineering materials. Geotechnique 1966, 16, 91–130. [Google Scholar] [CrossRef]
- Ko, H.Y.; Scott, R.F. Deformation of sand at failure. J. Soil Mech. Found. Div. 1968, 94, 883–898. [Google Scholar] [CrossRef]
- Alshibli, K.A.; Williams, H.S. A true triaxial apparatus for soil testing with mixed boundary conditions. Geotech. Test. J. 2005, 28, 534–543. [Google Scholar]
- Lade, P.V.; Duncan, J.M. Cubical triaxial tests on cohesionless soil. J. Soil Mech. Found. Div. 1973, 99, 793–812. [Google Scholar] [CrossRef]
- Gao, Y.; Wang, Y.H.; Su, J. Experimental characterization of the influence of fines on the stiffness of sand with inherent fabric anisotropy. Soils Found. 2015, 55, 1148–1157. [Google Scholar] [CrossRef]
- Zhang, M.; Xu, C.S.; Du, X.L.; Wang, G.S.; Lu, D.C. True triaxial experimental research on shear behaviors of sand under different intermediate principal stresses and different stress paths. J. Hydraul. Eng. 2015, 46, 1072–1079. (In Chinese) [Google Scholar]
- Li, X.; Ma, Z.; Lu, W.; Wang, Y. True-triaxial drained test of Tengger Desert sand. Advances in Civil Engineering. Adv. Civ. Eng. 2020, 2020, 8851165. [Google Scholar] [CrossRef]
- Li, K.F.; Li, X.F.; Chen, Q.S.; Nimbalkar, S. Laboratory Analyses of Non-coaxiality and Anisotropy of Spherical Granular Media under True Triaxial State. Int. J. Geomech. 2023. [Google Scholar]
- Nakai, T.; Matsuoka, H.; Okuno, N.; Tsuzuki, K. True triaxial tests on normally consolidated clay and analysis of the observed shear behavior using elastoplastic constitutive models. Soils Found. 1986, 26, 67–78. [Google Scholar] [CrossRef]
- Reddy, K.R.; Saxena, S.K.; Budiman, J.S. Development of a true triaxial testing apparatus. Geotech. Test. J. 1992, 15, 89–105. [Google Scholar]
- Matsuoka, H.; Sun, D.A. Extension of spatially mobilized plane (SMP) to frictional and cohesive materials and its application to cemented sands. Soils Found. 1995, 35, 63–72. [Google Scholar] [CrossRef] [PubMed]
- Choi, C.; Arduino, P.; Harney, M.D. Development of a true triaxial apparatus for sands and gravels. Geotech. Test. J. 2008, 31, 32–44. [Google Scholar]
- Shao, S.J.; Xu, P.; Shao, S.; Chen, F. Improvement and strength testing of true tri-axial apparatus with one chamber and four cells and rigid-flexible-flexible loading boundary mechanism-True triaxial apparatus developed in Xi’an University of Technology. Chin. J. Geotech. Eng. 2017, 39, 1575–1582. (In Chinese) [Google Scholar]
- Suits, L.D.; Sheahan, T.C.; Ibsen, L.B.; Prasstrup, U. The danish rigid boundary true triaxial apparatus for soil testing. Geotech. Test. J. 2002, 25, 254–265. [Google Scholar]
- Lade, P.V. Failure criterion for cross-anisotropic soils. J. Geotech. Geoenvironmental Eng. 2008, 134, 117–124. [Google Scholar] [CrossRef]
- Abelev, A.V.; Lade, P.V. Effects of cross anisotropy on three-dimensional behavior of sand. i: Stress–strain behavior and shear banding. J. Eng. Mech. 2003, 129, 160–166. [Google Scholar] [CrossRef]
- Abelev, A.V.; Lade, P.V. Characterization of failure in cross-anisotropic soils. J. Eng. Mech. 2004, 130, 599–606. [Google Scholar] [CrossRef]
- Rodriguez, N.M.; Lade, P.V. True triaxial tests on cross-anisotropic deposits of fine Nevada sand. Int. J. Geomech. 2013, 13, 779–793. [Google Scholar] [CrossRef]
- Lu, X.; Huang, M.; Qian, J. The onset of strain localization in cross-anisotropic soils under true triaxial condition. Soils Found. 2011, 51, 693–700. [Google Scholar] [CrossRef]
- Ochiai, H.; Lade, P.V. Three-dimensional behaviour of sand with anisotropic fabric. J. Geotech. Eng. ASCE 1983, 109, 1313–1328. [Google Scholar] [CrossRef]
- Wang, H.; Li, L.; Li, J.; Sun, D. Drained expansion responses of a cylindrical cavity under biaxial in situ stresses: Numerical investigation with implementation of anisotropic S-CLAY1 model. Can. Geotech. J. 2022, 60, 198–212. [Google Scholar] [CrossRef]
- Zhang, Y.; Shao, S.J.; Chen, F.; Ding, X.; Zhang, S.J. Experimental study of strength characteristics and failure modes of Q_3 intact loess under different stress paths. Rock Soil Mech. 2017, 38, 99–106. (In Chinese) [Google Scholar]
- Anhdan, L.; Koseki, J. Small strain behaviour of dense granular soils by true triaxial tests. Soils Found. 2012, 45, 21–38. [Google Scholar] [CrossRef] [PubMed]
- Suits, L.D.; Sheahan, T.C.; Yin, J.H.; Zhou, W.H.; Cheng, C.M. A rigid-flexible boundary true triaxial apparatus for testing soils in a three-dimensional stress state. Geotech. Test. J. 2011, 34, 102886. [Google Scholar] [CrossRef]
- Shi, L.; Li, X.; Bai, B.; Li, Q.; Feng, X. Numerical analysis of loading boundary effects in Mogi-type true triaxial tests. True Triaxial Test. Rocks 2012, 4, 19–32. [Google Scholar]
- Zhang, S.; Wu, S.; Zhang, G. Strength and deformability of a low-porosity sandstone under true triaxial compression conditions. Int. J. Rock Mech. Min. Sci. 2020, 127, 104204. [Google Scholar] [CrossRef]
- Wang, C.; Liu, Z.; Zhou, H.; Wang, K.; Shen, W. A novel true triaxial test device with a high-temperature module for thermal-mechanical property characterization of hard rocks. Eur. J. Environ. Civ. Eng. 2022, 27, 1697–1714. [Google Scholar] [CrossRef]
- Feng, X.T.; Zhang, X.; Kong, R.; Wang, G. A novel Mogi type true triaxial testing apparatus and its use to obtain complete stress–strain curves of hard rocks. Rock Mech. Rock Eng. 2016, 49, 1649–1662. [Google Scholar] [CrossRef]
- Green, G.E. Strength and deformation of sand measured in an independent stress control cell. In Proceedings of the of Roscoe Memorial Symposium on Stress-Strain Behaviour of Soils, Cambridge, UK, 29–31 March 1971. [Google Scholar]
- Green, G.E. Strength and Compressibility of Granular Materials under Generalised Strain Condition; University of London: London, UK, 1969. [Google Scholar]
- Zhou, H.; Hu, Q.; Yu, X.; Zheng, G.; Liu, X.; Xu, H.; Yang, S.; Liu, J.; Tian, K. Quantitative bearing capacity assessment of strip footings adjacent to two-layered slopes considering spatial soil variability. Acta Geotech. 2023, 1–15. [Google Scholar] [CrossRef]
- Li, X.; Du, C.; Wang, X.; Zhang, J. Quantitative Determination of High-Order Crack Fabric in Rock Plane. Rock Mech. Rock Eng. 2023, 1–10. [Google Scholar] [CrossRef]
- Lade, P.V.; Duncan, J.M. Elastoplastic stress-strain theory for cohesionless soil. J. Geotech. Eng. Div. 1975, 101, 1037–1053. [Google Scholar] [CrossRef]
- Desai, C.S.; Faruque, M.O. Constitutive model for (geological) materials. J. Eng. Mech. 1984, 110, 1391–1408. [Google Scholar] [CrossRef]
- Li, X.; Ma, Z. Method for Achieving Stress or Strain Path in Three-Dimensional Space with Pseudo-Triaxial Apparatus. Chinese Patent CN 114235571 B, 9 May 2023. Available online: https://pss-system.cponline.cnipa.gov.cn/documents/detail?prevPageTit=changgui (accessed on 9 May 2023).
- Matsuoka, H.; Nakai, T. Stress-deformation and Strength Characteristics of Soil Under Three Different Principal Stress. Proc. Jpn. Soc. Civ. Eng. 1974, 232, 59–70. [Google Scholar] [CrossRef] [PubMed]
- Warnke, K.W.E.; Warnke, E.P. Constitutive model for triaxial behaviour of concrete. In Proceedings of the International Association for Bridge and Structural Engineering, Zurich, Switzerland, 18–21 January 1975; pp. 1–30. [Google Scholar]
- Sun, Y.; Pu, J.; Li, G. Effect of different stress paths on stress-strain relationship of sand. Chin. J. Geotech. Eng. 1987, 6, 78–88. (In Chinese) [Google Scholar]


Disclaimer/Publisher’s Note: The statements, opinions and data contained in all publications are solely those of the individual author(s) and contributor(s) and not of MDPI and/or the editor(s). MDPI and/or the editor(s) disclaim responsibility for any injury to people or property resulting from any ideas, methods, instructions or products referred to in the content. |
© 2023 by the authors. Licensee MDPI, Basel, Switzerland. This article is an open access article distributed under the terms and conditions of the Creative Commons Attribution (CC BY) license (https://creativecommons.org/licenses/by/4.0/).
Share and Cite
Ma, Z.; Li, X. Aeolian Sand Test with True Triaxial Stress Path Achieved by Pseudo-Triaxial Apparatus. Sustainability 2023, 15, 8328. https://doi.org/10.3390/su15108328
Ma Z, Li X. Aeolian Sand Test with True Triaxial Stress Path Achieved by Pseudo-Triaxial Apparatus. Sustainability. 2023; 15(10):8328. https://doi.org/10.3390/su15108328
Chicago/Turabian StyleMa, Zhigang, and Xuefeng Li. 2023. "Aeolian Sand Test with True Triaxial Stress Path Achieved by Pseudo-Triaxial Apparatus" Sustainability 15, no. 10: 8328. https://doi.org/10.3390/su15108328