Abstract
Background: People invest hours of their working day to pay for their vehicle. Is this a worthwhile use of their time? Wouldn’t public transport be a more economical solution for those on low income? Which demographic group typically chooses the most effective mode of transport? Aim: The two studies presented in this paper answer those fundamental questions based on the effective speed concept. This is calculated by dividing the distance travelled by time (i.e., minutes spent travelling and earning the money to afford it). Methodology: A digital model of the residents in Berlin is created to calculate the ‘effective speed’ for everyone. In the second study, based on a survey of residents in New York City, the best mode of transport for each respondent based on their effective speed has been identified and compared to the mode chosen. Results: The results of the Berlin case study show that the mode share for cars would be less than 6% if people choose the mode of transport with the highest effective speed. A similar picture is seen in NYC. Factors that significantly affect whether people who should use public transport, do so, include: age, gender, education, place of work or home.
1. Introduction
In the second half of the 20th century transport planners mainly focussed on cars and the provision of new roads and parking facilities to meet their needs [1]. Cars were suppcorrectosed to provide people with freedom, independence, and time savings [1]. Initially, cars may have offered an advantage to the few privileged enough to own one [1,2]. However, in reality, when most people own a car, this advantage is limited due to congestion [1]. Transport planners have realised that these advertised benefits were short lived, and the benefits have become, to a degree, nothing more than an illusion [1]. The relative advantages offered by cars has since been mitigated as cars are no longer a luxury item. They have become rather a necessity to everyday life. To keep cars mobile, a large infrastructure is required (e.g., car producers, traffic management, road construction, maintenance, oil industry, salt gritting and snow clearance in winter and so on) [1]. Whilst cars are supposed to provide personal independence, the reverse came true when cars became a necessary possession to participate in a society. Implicit in this is their dependence on the services and infrastructure provided by others [1]. While alternative modes of transportation are increasingly considered, we are still stuck with an infrastructure built for and sustained for the use of motor vehicles, in many cities around the world.
Increasing wealth and increased travel speeds tend to promote inequality amongst divergent populations. First, the less affluent are exposed to the external effects of increased pollutants and secondly the cost to participate in the evolved society has increased [3]. In other words, everyone in a village bought their bread from the local bakery. With the acquisition of a car, the affluent were able to travel to a larger bakery further away. The village bakery lost customers and with insufficient demand for bread their business closed. In turn, this forced the less affluent to acquire transport to travel to the further away bakery. Society now has a heavy reliance on increasing the pace and distance of travel. To save time, faster modes of transport are required [4], which has resulted in an ever-increasing dependence on cars. This comes with the requirement of households to devote a large share of their income towards retaining this form of mobility. Car owners devote 20% of their income on travel, which means that 20% of their working time is spent in earning the money to pay for the car [3]. A few researchers have argued that from a holistic point of view, cars may not be a ‘time-saving device’ due to the requirement to earn money to pay for the car. The concept of the effective speed was proposed.
Similar to the average speed, the effective speed is calculated as distance divided by the time. This includes both the journey spent travelling from door to door as well as the additional hours devoted to earning the money to pay for the travel [5]. Speed is highly valued in this society [1]. However, many researchers have proven that increasing the average speed of cars in cities, in an attempt to save time, is only a ‘short-sighted fix’ given that the time spent in cars is only a share of the total time devoted to owning a car [6]. Also, enabling cars to travel faster, enables people to travel further with more road space required. Additionally, faster travelling cars require a larger area around them (i.e., buffer zone for traffic separation), than slowly travelling cars, which in turn further increases the land-area demand.
In 2020, Vale [7] still argued that the effective speed concept has been ‘poorly researched’. Until now this concept has been largely ignored in transport planning and research [7]. While the effective speed concept is popular with bicycle groups, as well as anecdotal books, the concept has been undervalued in scientific studies. To fill the gap this paper aims to offer a holistic approach to consider the effective speed for all residents in Berlin and NYC. The paper is especially useful for policymakers as it illustrates the extent to which residents choose a not cost-effective mode of transport. An overview of factors affecting the mode choice is given as well.
The following research objectives have been addressed:
RO1: Review of the literature with regards to the effective speed concept.
RO2: Develop a digital model of Berlin to determine the effective speed for all residents as well as their cost and time savings, if they wish to adopt it.
RO3: For each individual respondent of the NYC mobility survey, the mode of transport they had chosen in their trip diary, is compared to the mode they should have chosen based on the effective speed.
RO4: The results of RO3 are split into various demographic groups (e.g., age, education, place of residence, etc.).
The remainder of the paper is structured as follows: First, the literature on the effective speed and mode choice is illustrated. Second, the methodology of the two case studies is described. Third, the results are presented and discussed. Finally, conclusions are drawn.
2. Literature Review
2.1. Effective Speed
Henry David Thoreau is regarded as the originator of the idea behind the concept of the “effective speed” [1,4]. In his book ‘Walden’ from 1854, he compares his effective speed as a pedestrian and as a passenger on a train. Thoreau argued that he could walk on foot to a nearby town in one day whereas the person who takes a train will need to work for one day to earn the fare for the train and will arrive the following day. He acknowledged that train travel had limited benefits for the not so affluent passengers like him during the 19th century [1].
In 1974, Ivan Illich [8] brought Thoreau’s ideas into the 20th century by talking about commuters in cars. According to Illich, the typical American male, at the time of the study, devotes four hours per day to car travel. Either by driving or earning the money to pay for it. Over the year, it takes more than 1600 h to travel 7500 miles—an effective speed of less than five miles per hour.
Another frequently cited researcher on the effective speed concept is the German Sociologist D. Seifried. In 1990, he used the phrase ‘social speed’ which includes not only private costs (i.e., costs paid by the user) but also external costs like accidents [9]. Seifried concluded that the social speed of bicycles with 14 km/h is similar to the social speed of cars with 18 km/h [10]. Others cited [1,4,9] that Seifried proved that the social speed of bicycles is higher than the social speed of a car, without citing specific numbers.
Kifer [11] assessed the effective speed for commuters in the US. Dependant on the cost per mile, the effective speed ranged from 6.7 mph (i.e., $1.33 per mile) to 11.4 mph (i.e., $0.53 per mile) on freeways as well as between 4.8 mph (i.e., $1.33 per mile) and 7.8 mph (i.e., $0.53 per mile) in cities. The effective speed of bicycles was between 8.9 mph and 14.8 mph.
Tranter [1,4] conducted a study of the effective speed in Canberra, Austria. This city was chosen given that it is ideal for car drivers (i.e., limited traffic congestion, parking costs and no tolls) [4]. The example for public transport was taken from Perth [4]. Tranter intentionally chose a rather high average speed (Car: 45 km/h, Bus: 25 km/h, Cycle: 20 km/h, Train: 60 km/h). The average speed for cars is higher than the average speed Tranter [1] observed during a trip diary he conducted himself during a 4-week period in Canberra (average speed: 41.4 km/h). Tranter [1] concluded that only the Hyundai Getz has a higher effective speed than a passenger in a bus. If the driver would pay $5 parking per day the results would be reversed. If the driver happens to be an 18-year-old with only half the income and higher insurance premiums, the effective speed will drop to 15 km/h. This is slower than a cyclist or bus passenger.
In Tranter [4], the effective speed ranged from 12.8 km/h to 23.1 km/h depending on the model of the car. Perth train’s effective speed is 37.1 km/h, walking 6 km/h, bus 21.3 km/h and a bicycle 18 km/h [4]. Tranter stated that even if it is possible to increase the average speed of cars by building more freeways, it won’t substantially increase the effective speed [1,4]. If a Monaro driver increases its average speed from 45 km/h to 55 km/h, the effective speed would only rise by 0.9 km/h [4]. Increasing the average speed of public transport from 25 km/h to 35 km/h would increase the effective speed by 6.9 km/h [4]. He concluded that the most effective way to increase speed is by investing in cheaper modes, such as public transport or bicycles. While the following statement is debatable, Tranter argued that the more people swap to public transport the better the service will be. The opposite applies to cars as increased congestion will slow down the flow of traffic [4]. If the external costs are included, even the cheapest car in the study would take longer than taking a bus [4].
Tranter [4] also interviewed stakeholders in the Australian transport policy to ascertain their opinion about the effective speed concept. The interviewees where generally supportive of the concept, as well as seeing it as a useful argument to encourage travellers to reconsider the benefits and drawbacks of their current mode of transport. 65% of those interviewed thought that the effective speed concept could be used to influence policymakers and politicians [4]. However, further work may be required for its adoption at policy level [4]. Some of the interviewed felt that travel decisions are based on rather short-term logic. Hence, the concept of the effective speed may not be suitable for this type of decision making [4]. In short, most of those interviewed felt that the concept of the effective speed is not a ‘way of thinking’ generally applied [4].
Tranter [5] published another comparison of the effective speed. They used Google maps for the average speed (considering traffic congestion if available) for three trips starting in each city centre. Instead of calculating the effective speed, they calculated the speed a cyclist must pedal to be quicker than a car from the perspective of the effective speed. The following speeds include the external costs: New York, Los Angeles, Tokyo, Hamburg: 13 km/h, Toronto: 14.6 km/h, Canberra: 18.3 km/h. Tranter concluded that, it is questionable whether governments can increase the effective speed of cars by building more roads, due to the immense construction costs [5]. In London, increasing the average speed by 10 km/h increases the effective speed only by 0.7 km/h. A 10 km/h increase in the average speed of bicycles would increase their effective speed by 8.7 km/h [5].
Instead of commuting trips, Tranter [9] evaluated ‘school run’ trips to drop children off at school and their other free time activities. He concluded that driving children to school not only requires time to commute and the need to earn money to pay for the vehicle, but also children no longer get exercise from walking to school. Extra time is required to ferry children to sporting activities to regain fitness. The likelihood is they will meet friends there who live even further away.
Litmann [3] compared the effective speed in 2020. Depending on the hourly wage (i.e., $15 to $45 per hour), the effective speed ranged from 8 mph to 16 mph for cars, from 11 mph to 14 mph for public transport, and around 11 mph for bicycles.
Meira et al. [12] focussed on the intersection between ‘social effective speed’ and urban mobility policies for developing countries. They estimated the ‘social effective speed’ for the Metropolitan region of Recife (Pernambuco, Brazil). In contrast to others, they assumed a different monthly income for each mode of transport. Despite the significantly higher income of car owners assumed in this study (car: $2192.49, cyclist: $624), bicycles are still the fastest mode of transport in terms of their effective speed with 16.74 km/h. Cars are the second lowest with 6.34 km/h, followed by public transport with 5.23 km/h.
Researchers have also proposed variations of the effective speed such as ‘effective accessibility’. The goal of increasing accessibility is to reduce car dependency by improving the range of amenities reachable without a car [7]. Accessibility can be measured in time, cost, or effort to travel. It is essentially a measure to quantify the ‘distance friction’ [7]. However, most studies focus solely on the time component [7]. Vale et al. [7] proposed a cost-based accessibility measure called ‘effective accessibility’ of jobs (Ef-Acc), which uses the effective speed concept to measure travel impedance [7]. By including the hourly wage into an accessibility calculation, it measures affordability instead of merely focusing on costs or time [13]. Vale et al. [7] estimated the travel time-based accessibility (TT-Acc) and the Ef-Acc of jobs based on a case study in Lisbon. The Ef-Acc with a car for low-income people is zero as their travel cost exceeds 20% of their income [7]. The Ef-Acc using a bicycle is generally as good or better then public transport. Vale et al. [7] concluded that Ef-Acc is a much better representation of the accessibility than TT-Acc given that TT-Acc overestimates the accessibility up to 3-fold compared to Ef-Acc. This is especially the case for car travel.
2.2. Contribution and Gab in the Research
The problem with Tranter’s [1,4,5] Kifer’s [11] and Illich’s [8] methodology is that it only compares the effective speed for a limited selection of income per hour, average speeds and vehicles. Hence, their studies are only applicable to people who earn an average income but not for the majority of the population who earn more or less money. Littman [3] tried to overcome this problem by calculating the effective speed depending on the income. However, some researchers still argued in 2020 that the ‘effective speed concept’ has until now been ‘poorly researched’ [7]. And has been largely ignored in the transport planning and research community [7], despite its popularity in anecdotal books and blog posts.
This study differs from these approaches given that, for example, survey data is used to compare the mode of transport residents should use, based on their respective effective speed, with the mode that, in reality, they chose. Also, this study evaluates the effective speed for an entire city population (e.g., Berlin) and not just selected individuals. Doing so gives a ‘never before’ analysis into whether people choose the most cost-effective mode of transport, and the factors that encourage or prevent them from doing so.
The effective speed is defined by the following Equation (1).
where:
—effective speed
—annual total distance
—transport costs
—hourly wage
—time spend travelling in vehicles
2.3. Research on the Choice for Sustainable Modes of Transport
Walking, cycling, and public transport are seen as options to achieve sustainable transportation [14], due to their potential to reduce emissions, noise, and cost [15]. Researchers have for decades used a variety of methodologies to investigate the reasons people choose or reject sustainable modes of transport [16,17,18]. The factors and their ability to influence travel behaviour often differ between studies [19].
Yanar [19] investigated the factors influencing mode choice to recommend policies to increase the mode choice for sustainable modes of transport. Based on a literature review, they identified the following factors as being the most influential for mode choice: trip characteristics (trip distance, travel time, trip cost and transit features); household characteristics (income, number of children, number of cars and number of workers); personal characteristics (gender, age, habits and abilities); built and natural environment (diversity in land use, local densities, employment, employment densities at destination, population densities at origin, urban design, green spaces and terrain/hills) [19]. Vidovic et al. [20] found that the cost of parking influences the mode choice. In Maltese’s et al. [15] literature review, age, education level, gender and income were the most commonly mentioned factors affecting mode choice at their holiday destination. For leisure trips, Stroembald et al. [16] identified the following factors in their literature review: trip purpose, household size, having children and a partner, gender, age, education, income, car access, mode chosen to commute, built environment, subjective factors, and social influence. For commuting to University campuses, Kim et al. [21] found the following factors in their literature review: cost, attitude, built environment, and perceived safety. Based on a survey, Abdullah et al. [22] concluded, that amongst other factors, gender, car ownership, employment status, travel distance, primary purpose of travelling are significant factors affecting mode choice before the pandemic. Smartphones and fitness tracking apps may also influence mode choice [23].
Taking these studies into consideration, the present study uses the following factors to identify their influence on whether people would choose the most cost-effective mode of transport: household characteristics (income); personal characteristics (gender, age, education, student status), employment type, status as well as perceived safety/exposure to harassment. As opposed to comparing the typical built and natural environment characteristics, the home and work location have been used as a potential factor. Despite not being commonly cited in previous literature, additional factors have been included to give a broader understanding of the influences: working from home frequency, opinion about the congestion charge, industry of employment, and smartphone ownership.
3. Methodology
3.1. Berlin: Agent Based Model
3.1.1. Data
A digital model has been created of every resident in Berlin (i.e., 3,625,600). Each of these agents have been assigned an income and given a daily commuting distance.
Income per hour/value of time: The after-tax income per hour distribution of residents in employment (i.e., 50%) in Berlin has been estimated based on the “Mikrozensus” data from 2021. This includes the distribution of the monthly nett income of residents in employment, as well as the distribution of hours worked per week [24]. It is assumed that residents have 20 days of statutory holiday and a further 10 days of bank holidays per year. The data has been interpolated assuming an equal distribution of values between the maximum and minimum for each income bracket. To avoid extremely low hourly pay rates (i.e., value of time), the income category ‘less than EUR 500 per month’ has been assumed to be ‘EUR 250 to EUR 500’ and a triangular distribution has been assumed instead of the equal distribution. Given that the maximum wage is not a known quantity it has been set at 4000 € and a triangular distribution has been assumed. 33.7% of the residents in Berlin have an income (i.e., pension, job seeker allowance, etc.), but are not permanently employed. Their respective income distribution has been used. Given that they don’t work a specific number of hours, it is assumed that they can use 40 h per week for other chosen activities. The same holiday allowance for employed residents has been applied. Estimating the value of time for residents who don’t have a monthly wage (i.e., 16.3%) is not as easy. For example, housewives or students may have a busy life and therefore precious about their time availability. However, their value of time may depend on their spouse’s or parent’s income, which is not known in this statistic. Therefore, these residents have been excluded in this study.
Travel distance: For this estimation, only the distance travelled to and from the place of work is considered [25]. The categories in the statistic ‘the place of work is at home’ (4%), ‘the place of work is changing’ (9%) and ‘the distance to work is more than 50 km (1%) have all been disregarded and summarised as ‘distance too long or unknown’. To interpolate the dataset, it has been assumed that all data points follow an equal distribution within the boundary of the bin widths. Like before, the smallest and largest category are interpolated using a triangular distribution. Only the commute to work has been used in this study. Spontaneous trips may be unplanned, and the mode choice therefore may not be based on a thorough evaluation of various options whereas the repetitiveness of the commute to work will encourage a thorough evaluated mode choice.
Average speed: The average speed of pedestrians, cyclists, drivers and public transport has been taken from the SrV [26]. Only the average speed of trips within Berlin have been considered.
Costs: The cost of owning and operating a car has been sourced from the ADAC database [27]. While many people may own more prestigious cars, the cheapest (e.g., Dacia Sandero SCe 65 Access) has been chosen for following reasons: (i) many cars in Germany are company cars and therefore have a reduced cost compared to private ownership, (ii) people buy used cars, which may reduce the overall costs although they may incur extra fees to repair, and (iii) if the cheapest cars are not a cost effective option, then more expensive ones will not be either. There is no point in further increasing the cost of cars given that this would just further reduce the limited number of people who would drive a car. Bicycle costs [28] were slightly overestimated as in [5]. To account for the variety of bicycle prices, the fixed costs have been converted into variable costs given that a 1 km trip could easily be done on a cheap second-hand bicycle, while someone travelling more than 10 km per day would probably prefer a more robust or reliable bicycle. Walking is assumed to be free of charge, but only possible for up to 10 km each day. The public transport ticket costs are sourced from the website of the provider [29]. It is assumed that a resident will buy a monthly ticket. An increased travel distance meant that a ticket with more zones is required. External costs are not considered in this study given that it is rarely considered by individuals in their mode choice [5].
3.1.2. Sensitivity Analysis
In the sensitivity analysis, the cost and speed of each mode of transport has been increased by 20%. Additionally, the income has been increased by 20% and the fixed cost of cars have been disregarded. The latter comes closer to the cost car drivers assume they pay for their car as they tend to forget the reality of associated cost [1]. Drivers generally consider costs such as travel time, parking fees, and fuel while monthly/yearly paid fees such as registration, insurance and maintenance are often underestimated [30].
3.2. New York City: Survey
Every year around 3000 residents are surveyed as part of the Citywide Mobility Survey (CMS) in NYC (‘Household survey’ [31], Person survey’ [32], ‘Trip survey’ [33]). Using these datasets has the advantage that for each survey participant the exact combination of household income and travel distance etc. is known. Whereas in the Berlin study, the income and travel distances are randomly allocated to each ‘resident’ based on an overall statistic. It is possible to calculate, for each individual, the mode of transport they should use and compare it to the one they had chosen.
The annual income per person is calculated by dividing the household income by the number of adults in each household. The income per hour is calculated by dividing this number by 2080 (i.e., average number of hours worked for full time employees per year in the USA).
The travel distance per day is the sum of the distances for each person divided by the number of days for which they reported trips.
The modes of transport are combined as follows: taxi (i.e., taxi and app based for hire vehicles), public transport (i.e., bus, subway, ferry etc.) as well as car and bicycle. Most people use multiple modes of transport (e.g., walking and public transport), or forget to note the mode of transport for some trips in the survey. Hence, this study has been run using three different methodologies. To ease the evaluation, it was necessary to identify one mode of transport for each person. To do so, three options have been compared: (i) using the most frequent mode (excluding walking), (ii) the mode they use to travel to work or school, (iii) a combination of both methods. This method (iii) has been used given that the mode of transport to get to work/school should be a thoroughly evaluated choice (i.e., considering cost and time), as opposed to spontaneous trips where users might choose the mode that comes to mind first. This is emphasised by the fact that when using method (i) the share of people who use a car, but should use public transport, is generally higher than method (ii). Some people didn’t report their work or school location and therefore their most frequent mode of transport has been utilised instead. Some participants were excluded as it was not possible to identify their most frequently chosen mode of transport.
The average speed in NYC is estimated based on the travel times and distances reported in the survey for each mode of transport.
The cost for a taxi per km is an approximation based on the fares reportedly paid by survey respondents who reported trips by taxi or ride hailing in the survey. The cost of a car is taken from the following sources [34,35]. Only the minimum costs have been considered to avoid the argument that cars are only low performing because the costs have been overestimated. The cost of parking at the place of work/school is disregarded to keep the cost minimal. The public transport fare is assumed to be $4.71 per day (i.e., price cap in NYC is $33 per week). Due to a lack of data availability, the cost of bicycles is assumed to be the same as in Germany (converted into US$).
3.3. Limitations
The distribution of trip distances for non-employed residents is assumed to be the same as for employed residents due to a lack of available data. Note: The methodology and datasets used for the Berlin case study differs between this study and the case study in [36]. Schnieder [36] estimated the effective speed for all federal states in Germany, which means that a different dataset and methodology had to be used. The dataset used for the NYC case study is the same as in the case study in [36]. Schnieder [36] estimated the reduction of emissions, land use efficiency and external costs if residents use the mode of transport with the fastest effective speed instead of the one, they use in reality.
4. Results
4.1. Overview
Figure 1 illustrates the mode of transport with the fastest effective speed depending on the commuting distance and income. The average speed has been taken from SrV data of Berlin. Walking has a lower effective speed than cycling, as it saves time and is relatively inexpensive. If the distance is short enough, bicycles are predominantly the fastest mode almost irrespective of income (up to 50 €/h). Due to the fixed cost, public transport is only the fastest when the travel distance is at least 2 km to 12 km (depending on income). If the income is lower than 23 € or the distance is less than 11 km, cars are never the fastest option. Therefore, cars are only a ‘time saving device’ for a small portion of the society.
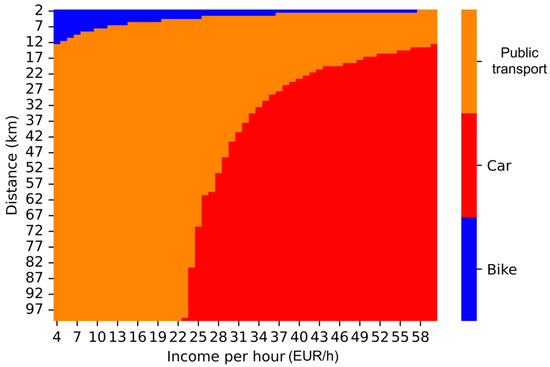
Figure 1.
Fastest mode of transport based on the effective speed for various commuting distances and income.
4.2. Berlin
4.2.1. Ideal Mode Share Based on the Effective Speed
Based on the model created in this study, 57% of all residents in Berlin should take public transport while only 2.8% should drive a car (Table 1). If the working population is compared, the share of people who should drive a car increases to 5.6%. This compares to more than 35% who use a car to travel to work [25]. Over 40% use public transport to travel to work [25], which is much lower compared to the share of people who should use public transport. The share of people who use a bicycle is similar (almost 15%) compared to the 12% who should use this method. Walking is never a recommended mode of transport in this study, however, in reality, 5% do walk to work. This study might indicate that people have a strong preference for modes of transports with greater flexibility (car, bicycles, walking), but don’t value as much the potential time savings when using public transport. Researchers have argued previously that people underestimate the costs of owning a car. If this is the case, it is not surprising that the actual mode share of cars in Berlin is higher than the 5.6% recommended.

Table 1.
Mode share based on the effective speed.
This study only considers the private cost (i.e., the cost paid by the user). External costs (i.e., accidents, pollution) are not considered, neither are private benefits (i.e., no gym membership required as fitness is gained by cycling or walking to work), nor external benefits (i.e., reduced health cost due to fitter and healthier residents).
4.2.2. Cost and Time Reduction
In the following, it is estimated how much money could be saved per day if residents who should use a bicycle or public transport instead of driving a car, would do so (Figure 2). On average, residents can save 19 € to 21 € (median) per day. If those who should ride a bicycle or use public transport do so instead of driving a car, then their daily commute would be increased on average by just 23 min (median) per day. However, the overall reduction in total time (i.e., working plus commuting) is 82 min (employed: 56 min, unemployed: 148 min).
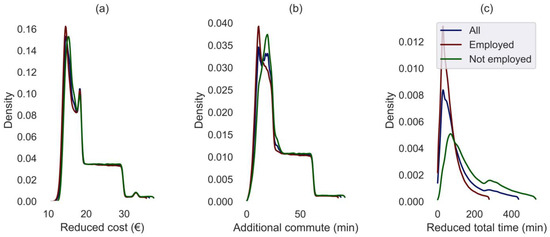
Figure 2.
Cost/time per day that could be saved by residents who should use a bicycle or public transport but drive a car instead. (a) reduced cost, (b) additional time spent commuting, (c) reduced time.
4.2.3. Sensitivity Analysis
In the following, it is estimated how the mode share based on the effective speed would change if certain parameters were adjusted (Figure 3). The most notable is ‘removing the fixed cost of private cars’. As said before, if all costs are considered, only 5.6% should drive a car. If only the variable costs of cars are included, the sensitivity analysis suggests that 54% of the employed residents should drive a car.
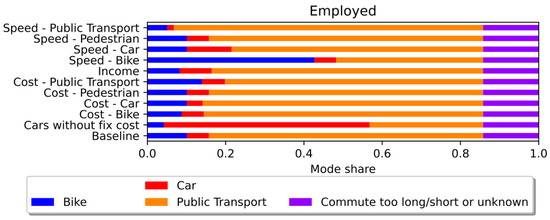
Figure 3.
Sensitivity analysis.
Increasing the cost of each mode of transport by 20% changes the mode share by only ±2 pp (percentage points) depending on the type of transport used. Increasing the average speed changes the mode share by up to ±6 pp. A similar picture can be seen when all residents (employed and unemployed) are compared. If the income is increased by 20%, the mode share changes by up to ±2 pp.
4.3. NYC
4.3.1. Mode Share Comparison
Table 2 compares the mode of transport chosen by the survey respondents, with the mode they should use. Given that some survey respondents use varied modes of transport, or don’t specify which they used, it was only possible to extract 2501 valid survey responses. 90% should use public transport, but only two thirds do. 27% drive a car for the majority of their trips instead. No-one should take a taxi due to the high price. This table highlights that despite the conservative assessment of the cost of a car in NYC, it is only a time saving device for a small fraction of the population. In NYC, due to the quality of the public transport system, bicycles are only the fastest mode of transport in a few cases, based on the effective speed. Note: The mode share is not representative to the real mode share in NYC as the one presented in Table 2 excludes walking. Also, only one mode of transport is used for each person as opposed to using all modes from all trips. Please see Schnieder [36] estimated for more details.
Table 2.
Mode of transport the survey respondents should use vs. mode used (N = 2501).
4.3.2. Mode Share Comparison for Each Zone
Figure 4 compares the mode of transport the customer chooses with the one they should use for each of the ten surveyed areas. Note: Combination of modes of transport with less than six survey respondents have been combined as others. Categories with less than 21 respondents have not been reported in this paper.
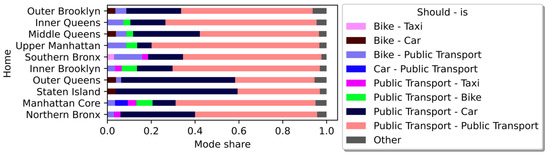
Figure 4.
Mode of transport the survey respondents should use vs. mode used split into survey zones.
For each of the ten surveyed areas, 200 to 300 valid responses could be extracted. Unsurprisingly, in NYC’s densely populated areas such as Upper Manhattan and Inner Queens 77% and 69%, respectively, correctly use public transport. Whereas in Outer Queens and Staten Island 52% and 56%, respectively, drive a car even if they should use public transport. In Northern Bronx, Middle Queens and Outer Brooklyn 34%, 30% and 25% drive cars even if they could save time using public transport.
Figure 5 clearly shows that with age the share of people who should use public transport but chose to drive a car instead is increasing. 67% of the 18–24-year olds, use and should use public transport, which reduces to 40% for 65–74-year olds.
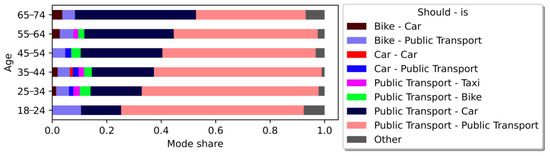
Figure 5.
Mode of transport the survey respondents should use vs. mode used split into age groups.
Only 45% of the people who strongly oppose a congestion charge use and should use public transport (Figure 6). This compares to 67% of the people who strongly support a congestion charge who should use and do use public transport. This may be obvious given that people who drive a car despite their lack of economy do not want extra cost added to their car travel. Interestingly, 64% of the people without a firm opinion either way use and should use public transport.
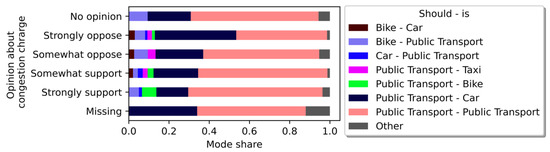
Figure 6.
Mode of transport the survey respondents should use vs. mode used split into opinions about the congestion charge.
The largest share of people who use and should use public transport can be seen for Graduate/Post-Graduate degree (63%) and Bachelor’s degree (63%) (Figure 7). The lowest share can be seen for people with High School graduate/GED (48%), less than High School (44%), Vocational/Technical training (48%), and Associate degree (48%). While this may not be a clear trend it may be indicating that people with a higher level of education are more likely to choose public transport if they should.
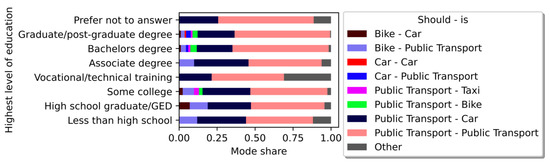
Figure 7.
Mode of transport the survey respondents should use vs. mode used split based on highest level of education.
A higher share of females uses and should use public transport (62%) compared to males (53%) (Figure 8).
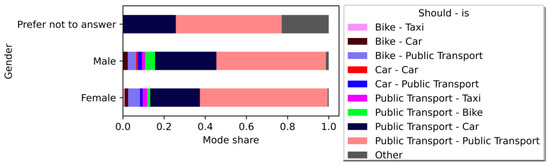
Figure 8.
Mode of transport the survey respondents should use vs. mode used split based on gender.
Figure 9 shows the mode share split according to the work industry. 75% of the people working in arts and entertainment use and should use public transport, followed by 72% in financial services, and 71% in professional and business services (consulting, legal, marketing) industry. At the other end of the scale, only 47% of people in real-estate industry use and should use public transport.
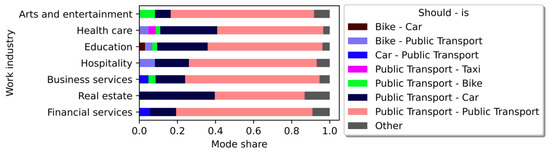
Figure 9.
Mode of transport the survey respondents should use vs. mode used split based on work industry.
Of those people who have a smartphone 59% use and should use public transport (Figure 10). Which compares to 50% of those who don’t have a smartphone.
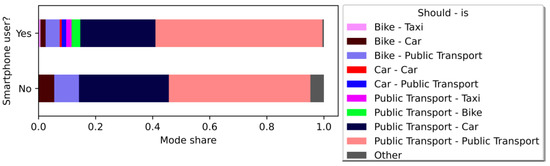
Figure 10.
Mode of transport the survey respondents should use vs. mode used split based on smartphone.
There is no clear trend between the frequency of working from home and whether people use public transport if they should do so (Figure 11). ‘Less than monthly’ sees the highest share (76%), followed by ‘1 day a week’ (74%) and ‘1–3 days a month’ (73%).
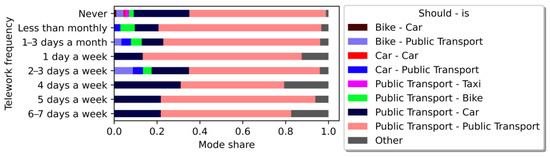
Figure 11.
Mode of transport the survey respondents should use vs. mode used split based on telework frequency.
Figure 12 illustrates the mode share split based on the student status. 71% of full-time students use and should use public transport, compared to 57% and 59% of ‘not students’ and ‘part time students’, respectively.
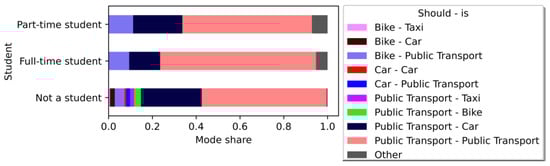
Figure 12.
Mode of transport the survey respondents should use vs. mode used split based on student status.
People working in Manhattan core are far more likely to use public transport if they should do so (83%), followed by Upper Manhattan (69%) and Inner Brooklyn (67%) (Figure 13). People working in Staten Island are the most likely to drive a car even though they should use public transport (73%), followed by Outer Queens (66%).
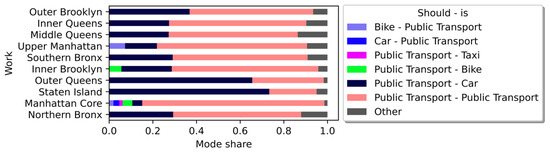
Figure 13.
Mode of transport the survey respondents should use vs. mode used split based on place of work.
The share of people driving a car even though they should take public transport is lowest for people with a household income of under $25,000 per year (20%) (Figure 14). This share is constantly increasing until the income bracket $75,000–$99,999 (30%). However, the share then begins to decrease. There is no clear trend over the entire income spectrum. Surprisingly, 8% of the ‘$200,000 or more’ earners use public transport even though they would save money and time by driving a car. In the low-income group (under $25,000), 17% use public transport even though they should ride a bicycle. This is reduced to 8% for the $25,000–$49,999 income group. Public transport might be good enough in NYC, that these decide to use it even though they would be better off if they don’t.
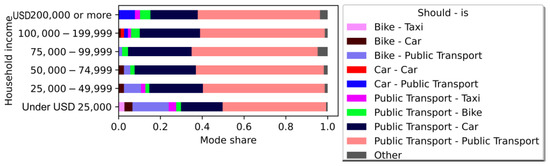
Figure 14.
Mode of transport the survey respondents should use vs. mode used split based on household income.
People who are full time employed are the most likely to use public transport if they should (66%) (Figure 15). Primarily self-employed are the least likely to choose public transport even though they should (51%).
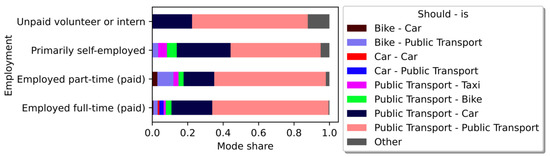
Figure 15.
Mode of transport the survey respondents should use vs. mode used split based on employment.
Of those people who have seen and/or experienced harassment or violence in the past week, 70% and 62% should use and use public transport (Figure 16). Of those who have no experience of harassment in the last week, only 54% use and should use public transport. This may indicate that people who use public transport have a higher exposure to harassment than people driving a car.
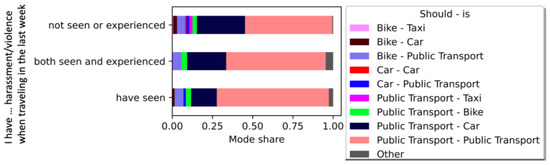
Figure 16.
Mode of transport the survey respondents should use vs. mode used split based on experience with harassment.
Those who have seen or experienced harassment in the last week, were asked how this has influenced their travel behaviour (Figure 17). In the following figures, the category ‘Missing’ refers to the people who have not seen/experienced any harassment in the last week, or have skipped the question. The first option they could select was whether they prefer to travel in a private car. Of those who selected this option, 59% drive a car even though they could save money and time on public transport. This indicates that harassment is one of the key factors for people to drive a car instead of using public transport, even if they could save time and money.
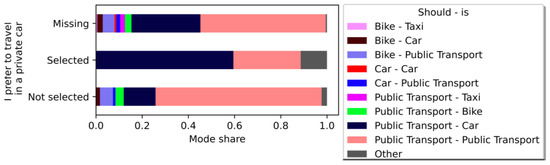
Figure 17.
Mode of transport the survey respondents should use vs. mode used split based on preference to drive a car due to harassment.
Of those who stated that they have reduced their use of public transport due to harassment, 41% drive a car even though they should use public transport (Figure 18). This clearly highlights the need to improve security and safeguarding in the transport system as it is unfair to restrict their ability to choose their most cost effective mode of transport.
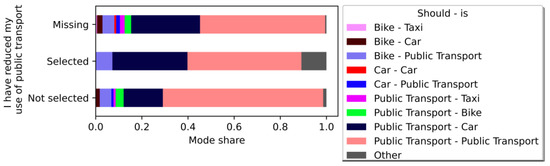
Figure 18.
Mode of transport the survey respondents should use vs. mode used split based on their reduction in public transport use due to harassment.
Chi square tests of independence have been performed to determine whether there is a statistical significant difference between the previous results. To simplify the comparison only two groups have been compared: (i) should use and use public transport, and (ii) should use public transport but drive a car instead. Categories such as ‘Missing’ or ‘Prefer not to say’ have been removed as well as categories with less than 20 responses as these would be difficult to interpret. All this has been done to ensure that there is a meaningful number of subjects within each combination of category and subjects. The Chi-square independent sample test showed that there is no significant association between whether someone has a smartphone and whether they use public transport as they should, X2 (1, N2117) = 2.4, p = 0.12. For all other comparisons, there is a statistical significant difference between the groups (Table 3).
Table 3.
Statistical significance.
To evaluate whether the income, age, and working from home frequency differs between the two groups (i.e., (i) should use and do use public transport, and (ii) should use public transport but drive a car instead), an independent t-test has been performed. There is a significant difference (p < 0.001) between the age of people in group (i) and (ii). The mean age of people driving a car instead of using public transport is higher with 46.2 years compared to 41.4 years of people who should use and use public transport. There is no statistical significance for the income or work from home frequency for both groups (Table 4).
Table 4.
Results from an independent t-test.
4.3.3. Reduction in Cost and Time
Figure 19 illustrates the change in cost and time if the survey respondents had use a bicycle or public transport, as they should have done. On average (median), they would save $35, spend an extra 11 min commuting per day, and save a total time (i.e., commuting and working) of 93 min. The cost savings almost corresponds to the fixed cost of owning a car per day.
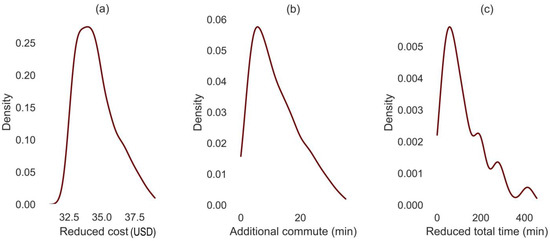
Figure 19.
Reduction of cost and time if the fastest mode of transport is used. (a) reduction of costs, (b) increase in time spent commuting, (c) reduction of time.
5. Discussion
5.1. Results
The study compares the effective speed of residents in Berlin and NYC to identify their fastest mode of transport. A digital model has been created of the residents in Berlin using mikrozensus statistics. The study of NYC uses data from a mobility survey and therefore compares the exact mode of transport the resident uses vs. the mode they should use.
In the Berlin study, it has been concluded that 70.1% of the residents in employment should use public transport and only 5.6% should drive a car. This is despite the potential savings of 18 € to 19 € (median) per day on average if residents were to choose a bicycle or public transport instead of driving a car. Clearly a larger share of residents in Berlin do prefer to drive a car to work. By using a more sustainable mode of transport, the commute would be increased by on average 23 min (median). However, the overall reduction in time spent to travel or earn the money is 82 min (employed: 56 min, unemployed: 148 min).
A similar picture can be seen in NYC where 58% of the residents should use public transport and do so. On the other hand, 27% of the residents drive a car for most trips even if they would be financially advantaged using public transport. Unsurprisingly, the share of residents who use and should use public transport is higher for those living in Upper Manhattan (77%) and Inner Queens (69%). On the other hand, the largest share of respondents who should use public transport but drive a car instead can be found in Outer Queens (52%) and Staten Island (56%), respectively. The data underlines that younger people (18–24-year-old) are more likely to use public transport when they should do so (67%) compared with older people (+65 years: 40%). Based on an independent t-test, the mean age is significantly different between the following two groups: (i) should use and do use public transport, and (ii) should use public transport but drive a car instead. Also, people who are against a congestion charge are rather unlikely to choose public transport even if they should do so for economic reasons (45%). This is obvious given that people for whom it does not make economic sense to drive a car will certainly object to even higher prices for car driving. The share of people who should and do use public transport varies depending on their level of education. The residents with a Bachelor’s, Graduate or Post-graduate degree seem more likely to use public transport if they should, compared to people with less than a college degree. Women are proportionately more likely to use public transport if they should do so (62%), compared to men (53%). People working in the entertainment industry are the most likely to choose public transport if they should do so (75%), while people working in real estate are the least likely (47%). There is no statistical difference between the mode choice of people (i) having or not having a smartphone, (ii) work from home frequency or (iii) income. Full time students (71%) are more likely to use public transport if they should do so compared to those who are not (57% and 59%). The place of work is also changing the likelihood of whether someone who should use public transport does so. At the top is Manhattan core with 83% choosing public transport as they should, followed by Upper Manhattan (69%) and Inner Brooklyn (67%). People working in Staten Island are the most likely to drive a car even though they should use public transport (73%), followed by Outer Queens (66%). People who are full time employed are the most likely to use public transport if they should (66%). Primarily self-employed are the least likely to choose public transport if they should do (51%). The results also indicate that harassment is one of the reasons people drive a car even though they would be better of using public transport. Out of those who have stated that they prefer to drive a car due to harassment, 41% drive a car even though they should use public transport.
5.2. Comparision with Results from Other Mode Choise Studies
The following section compares selected factors that influence whether people choose the mode of transport they should with the factors that are commonly cited as affecting the mode choice.
The influence of income on mode choice is generally considered high in the literature [19,37,38]. In this study, there is no statistical difference in the income between people who use public transport, as they should, and people who don’t. The share of people using public transport as they should is initially increasing with the income until the income bracket $75,000–$99,999 and then reducing with higher incomes. A possible reason could be that in NYC other factors are more significant than income alone. Also, Yanner et al. [19] noted, based on a literature review, that car ownership generally increases in line with income. However, various studies were listed that proved a positive linear relationship between income and commuting on a bicycle while others found a negative relationship [19].
Age has proven in the literature as a strong indicator of mode choice [19]. In line with previously published studies [39], also in this study the older people are, the less likely they are, to use public transport as they should.
A higher level of education has been observed as increasing the likelihood for someone to choose public transport [40] or to walk [41]. Also in this study, the type of degree is a significant factor.
Employment status is a significant factor in the literature [22] and also in this study.
Men are more likely to drive a car than woman according to the literature [38,39]. Also, in this study, women are more likely to use public transport if they should do so (62%), compared to men (53%).
This comparison shows that the factors affecting mode choice, generally also affect whether people choose the most cost-effective mode of transport. The only major discrepancy is income. This study shows that some very affluent people choose a sustainable mode of transport despite driving a car being the most cost-effective mode of transport for them. Further research is needed to determine their motives.
6. Conclusions
The studies in this paper offer a previously non-existent overview as to whether people choose their most cost-effective mode of transport based on the effective speed. Factors that encourage or prevent them from doing so are evaluated too. Using the effective speed for a mode choice comparison is novel as it offers a valuable insight.
The study clearly shows that a large portion of residents overestimate the ‘time saving ability’ of cars. Obviously, it is possible that people like their job and dislike the time spent on commuting. They may wish to spend the extra hour at work to reduce their commuting time by a few minutes, to avoid public transport or ride a bicycle. With a crisis in the cost of living it is essential that political will must improve the appearance and quality of public transport and cycling infrastructure in the short term. Doing so, would enable more people to choose the mode of transport with the highest effective speed for them. It is not fair to build entire cities around cars even though it is only the fastest mode of transport for rich people, based on the effective speed. People whose fastest mode of transport is a bicycle or public transport are only provided with a patchwork infrastructure or a basic public service.
Using the mobility survey of NYC, the study identifies, which factors may increase the likelihood of people choosing the mode of transport they should. Most surprisingly, the study could not prove that household income is one of the significant factors. The share of people using public transport as they should is highest for people earning $50,000–$74,999 and reducing either side of this income bracket. The quality of public transport may be attractive in NYC given that 17% of low-income people and 8% of the highest earners choose public transport even though they should ride a bicycle or drive a car, respectively. Working from home frequency is not a significant factor either. However, the older the people, the least likely they are to choose public transport even if they should do so. The place of work, home address, highest level of education, opinion about congestion charge, gender, industry of work, student status are factors affecting the likelihood of someone choosing public transport, as they should. The study also highlights the detrimental effect exposure to harassment or violence has on public transport usage.
Future research should conduct similar studies in other cities to get a more detailed overview of the factors preventing or encouraging people to choose the mode of transport with the highest effective speed. By addressing these, policymakers may be able to increase the cost effectivity of transportation, which gives people more time and increases affordability. Given that there are a lot more factors that could potentially affect people’s mode choice, further research should evaluate their influence on whether people choose the most cost-effective mode of transport. Further research could also investigate the potential benefit to the environment if people chose the mode with the highest effective speed.
Funding
This research received no external funding.
Institutional Review Board Statement
Not applicable.
Informed Consent Statement
Not applicable.
Data Availability Statement
Travel and household data: NYC Open Data, “Citywide Mobility Survey—Household Survey 2019,” 2022. Accessed: 7 April 2023. [Online]. Available: https://data.cityofnewyork.us/Transportation/Citywide-Mobility-Survey-Household-Survey-2019/a5rk-jemi; NYC Open Data, “Citywide Mobility Survey—Trip Survey 2019,” 2022. https://data.cityofnewyork.us/Transportation/Citywide-Mobility-Survey-Trip-Survey-2019/w9dc-u4ik (accessed on 7 April 2023); NYC Open Data, “Citywide Mobility Survey—Person Survey 2019,” 2022. Accessed: 7 April 2023. [Online]. Available: https://data.cityofnewyork.us/Transportation/Citywide-Mobility-Survey-Person-Survey-2019/6bqn-qdwq.
Conflicts of Interest
The author declares no conflict of interest.
References
- Tranter, P. Effective Speeds: Car Costs Are Slowing Us down. Australian Greenhouse Office. 2004. Available online: https://citeseerx.ist.psu.edu/document?repid=rep1&type=pdf&doi=616342a78d237767c1e2462c648cb62961ebbb6b (accessed on 7 April 2023).
- Gorz, A. The Social Ideology of the Motorcar. Uneven Earth, 11 August 2018. Available online: https://unevenearth.org/2018/08/the-social-ideology-of-the-motorcar/ (accessed on 20 December 2018).
- Litman, T. Not So Fast: Better Speed Valuation for Transportation Planning. 2021. Available online: https://vtpi.org/nsf.pdf (accessed on 7 April 2023).
- Tranter, P.J.; May, M. Questioning the need for speed: Can ‘effective speed’ guide change in travel behaviour and transport policy? In Proceedings of the Australasian Transport Research Forum, 28TH, Sydney, Australia, 6–8 March 2005. [Google Scholar]
- Tranter, P.J. Effective speed: Cycling because it’s faster. City Cycl. 2012, 57, 74. [Google Scholar]
- Tranter, P. How to save time and money: Using the Walking School Bus to increase your ‘effective speed’. World Transp. Policy Pract. 2008, 14, 56–64. Available online: http://www.eco-logica.co.uk (accessed on 7 April 2023).
- Vale, D. Effective accessibility: Using effective speed to measure accessibility by cost. Transp. Res. D Transp. Environ. 2020, 80, 102263. [Google Scholar] [CrossRef]
- Illich, I. Energy and Equity; Harper & Row: New York, NY, USA, 1974. [Google Scholar]
- Tranter, P.J.; May, M. The hidden benefits of walking: Is speed stealing our time and money? In Walk21-VII, “The Next Steps”, Proceedings of the 7th International Conference on Walking and Liveable Communities, Melbourne, Australia, 23–25 October 2006; 2006; Available online: www.walk21.com (accessed on 7 April 2023).
- Pendakur, V.S.; Badami, M.; Lin, Y.-R. Nonmotorized Transportation Equivalents in Urban Transport Planning. Transp. Res. Rec. 1995, 1487, 49–55. [Google Scholar]
- Kifer, K. Auto Costs Versus Bike Costs. 2004. Available online: https://www.phred.org/~alex/kenkifer/www.kenkifer.com/bikepages/advocacy/autocost.htm (accessed on 7 April 2023).
- Meira, L.H.; de Mello, C.A.; Castro, Y.M.; Oliveira, L.K.; Nascimento, C.D.O.L. Measuring social effective speed to improve sustainable mobility policies in developing countries. Transp. Res. D Transp. Environ. 2020, 78, 102200. [Google Scholar] [CrossRef]
- El-Geneidy, A.; Levinson, D.; Diab, E.; Boisjoly, G.; Verbich, D.; Loong, C. The cost of equity: Assessing transit accessibility and social disparity using total travel cost. Transp. Res. Part A Policy Pract. 2016, 91, 302–316. [Google Scholar] [CrossRef]
- Unterstaller, A. The First and Last Mile—The Key to Sustainable Urban Transport Transport and Environment Report 2019. 1994. Available online: https://www.eea.europa.eu/publications/the-first-and-last-mile (accessed on 7 April 2023).
- Maltese, I.; Zamparini, L. Sustainable mobility choices at home and within destinations: A survey of young Italian tourists. Res. Transp. Bus. Manag. 2022, 100906. [Google Scholar] [CrossRef]
- Strömblad, E.; Hiselius, L.W.; Rosqvist, L.S.; Svensson, H. A qualitative case study examining individuals’ perceptions of mode choice and the possibility to reduce car mileage for everyday leisure trips. Case Stud. Transp. Policy 2022, 10, 2183–2194. [Google Scholar] [CrossRef]
- Black, J.A.; Paez, A.; Suthanaya, P.A. Sustainable Urban Transportation: Performance Indicators and Some Analytical Approaches. J. Urban. Plan. Dev. 2002, 128, 184–209. [Google Scholar] [CrossRef]
- Silvestri, A.; Foudi, S.; Galarraga, I. How to get commuters out of private cars? Exploring the role of perceived social impacts in mode choice in five European countries. Energy Res. Soc. Sci. 2022, 92, 102811. [Google Scholar] [CrossRef]
- Yanar, T. Understanding the choice for sustainable modes of transport in commuting trips with a comparative case study. Case Stud. Transp. Policy 2023, 11, 100964. [Google Scholar] [CrossRef]
- Vidovic, N.; Simicevic, J. The impact of parking pricing on mode choice. Transp. Res. Procedia 2023, 69, 297–304. [Google Scholar] [CrossRef]
- Kim, J.; Lee, B. Campus commute mode choice in a college town: An application of the integrated choice and latent variable (ICLV) model. Travel. Behav. Soc. 2023, 30, 249–261. [Google Scholar] [CrossRef]
- Abdullah, M.; Dias, C.; Muley, D.; Shahin, M. Exploring the impacts of COVID-19 on travel behavior and mode preferences. Transp. Res. Interdiscip. Perspect. 2020, 8, 100255. [Google Scholar] [CrossRef] [PubMed]
- Wong, R.C.P.; Yang, L.; Szeto, W.Y. Wearable fitness trackers and smartphone pedometer apps: Their effect on transport mode choice in a transit-oriented city. Travel. Behav. Soc. 2021, 22, 244–251. [Google Scholar] [CrossRef]
- Amt für Statistik Berlin-Brandenburg. Ergebnisse des Mikrozensus. 2021. Available online: https://www.statistik-berlin-brandenburg.de/a-i-10-a-i-11-a-vi-2-j (accessed on 7 April 2023).
- Feilbach, J. Der Weg zur Arbeit Verkehrsmittelnutzung in Berlin im Kontext Soziostruktureller Merkmale. 2018. Available online: https://download.statistik-berlin-brandenburg.de/d58c6d31722f6239/d8ef794cc51b/hz_201802-04.pdf (accessed on 7 April 2023).
- Gerike, R.; Hubrich, S.; Ließke, F.; Wittig, S.; Wittwer, R. Tabellen zum Forschungsprojekt Mobilität in Städten—SrV. 2018. Available online: https://tu-dresden.de/bu/verkehr/ivs/srv/ressourcen/dateien/SrV2018_Ergebnispraesentation.pdf?lang=en (accessed on 8 April 2020).
- ADAC. ADAC Autokosten Herbst/Winter 2022/23 Kostenübersicht für über 1.500 Aktuelle Neuwagen-Modelle. 2022. Available online: https://assets.adac.de/Autodatenbank/Autokosten/autokostenuebersicht.pdf (accessed on 7 April 2023).
- DieEinsparBerater OHG. Kosten-, Zeit- und Verbrauchsvergleich Verschiedener Fahrradtypen. Available online: http://www.dieeinsparinfos.de/guenstige-mobilitaet/fahrrad/kosten/ (accessed on 7 April 2018).
- VBB. VBB-Umweltkarte. 2023. Available online: https://www.vbb.de/en/tickets/monthly-tickets/vbb-umweltkarte/ (accessed on 7 April 2023).
- Litman, T. Transportation Cost Analysis for Sustainability. Victoria, BC. 1999. Available online: www.vtpi.org (accessed on 7 April 2023).
- NYC Open Data. Citywide Mobility Survey—Household Survey 2019. 2022. Available online: https://data.cityofnewyork.us/api/odata/v4/a5rk-jemi (accessed on 7 April 2023).
- NYC Open Data. Citywide Mobility Survey—Trip Survey 2019. 2022. Available online: https://data.cityofnewyork.us/api/odata/v4/w9dc-u4ik (accessed on 7 April 2023).
- NYC Open Data. Citywide Mobility Survey—Person Survey 2019. 2022. Available online: https://data.cityofnewyork.us/Transportation/Citywide-Mobility-Survey-Person-Survey-2019/6bqn-qdwq (accessed on 7 April 2023).
- Gosine, S. Is It Worth Owning a Car in NYC? 2020. Available online: https://www.hauseit.com/owning-a-car-nyc/#Traffic%20&%20Parking%20Tickets (accessed on 7 April 2023).
- AAA. Your driving costs 2021—How Much Does it Really Cost to Own a New Car? 2021. Available online: https://newsroom.aaa.com/wp-content/uploads/2021/08/2021-YDC-Brochure-Live.pdf (accessed on 7 April 2023).
- Schnieder, M. Effective speed: Can cost effective transportation be sustainable and reduce emissions and external costs? Environments, 2023; submitted. [Google Scholar]
- Dargay, J.; Gately, D. Income’s effect on car and vehicle ownership, worldwide: 1960–2015. Transp. Res. Part A Policy Pract. 1999, 33, 101–138. [Google Scholar] [CrossRef]
- Ashrafi, S.; Neumann, H. Determinants of Transport Mode Choice in the Austrian Province of Vorarlberg; REAL CORP: Vienna, Austria, 2017. [Google Scholar]
- Mussone, L.; Changizi, F. A study on the factors that influenced the choice of transport mode before, during, and after the first lockdown in Milan, Italy. Cities 2023, 136, 104251. [Google Scholar] [CrossRef] [PubMed]
- van den Berg, P.; Arentze, T.; Timmermans, H. Estimating social travel demand of senior citizens in the Netherlands. J. Transp. Geogr. 2011, 19, 323–331. [Google Scholar] [CrossRef]
- Ivan, I.; Horák, J.; Zajíčková, L.; Burian, J.; Fojtík, D. Factors Influencing Walking Distance to the Preferred Public Transport Stop in selected urban centres of Czechia. GeoScape 2019, 13, 16–30. [Google Scholar] [CrossRef]


Disclaimer/Publisher’s Note: The statements, opinions and data contained in all publications are solely those of the individual author(s) and contributor(s) and not of MDPI and/or the editor(s). MDPI and/or the editor(s) disclaim responsibility for any injury to people or property resulting from any ideas, methods, instructions or products referred to in the content. |
© 2023 by the author. Licensee MDPI, Basel, Switzerland. This article is an open access article distributed under the terms and conditions of the Creative Commons Attribution (CC BY) license (https://creativecommons.org/licenses/by/4.0/).