Abstract
Carbon neutrality in municipalities can be achieved by combining individual heating and district heating solutions involving the use of renewable energy sources. Each approach has advantages and disadvantages, but the best solution depends on the specific circumstances of each municipality. As an environmentally friendly and efficient energy use, a decentralised heat supply contributes to achieving energy conservation and emissions reduction goals. Decentralised energy use, such as solar collectors with thermal energy storage or biomass as a resource, reduces dependence on centralised heat generation and transmission. The appropriate infrastructure for connection to district heating networks has not yet been built. On the other hand, it is easier to make investments to construct proper infrastructure in the case of large-scale centralised heat supplies. Moreover, a centralised heat supply with renewable energy sources can provide more inhabitants with renewable heat energy. Within the framework of the study, the possibilities of using renewable energy sources in one of the municipalities of Latvia—the Carnikava parish of Ādaži Municipality—are analysed. The study examines two scenario complexes including individual heating solutions in buildings or district heating solutions with a centralised approach. The study evaluates several alternatives to increase the share of RES (solar collectors, biomass, heat pumps, etc.) in the centralised heat supply. To evaluate individual RES solutions in various municipal buildings, this study evaluates alternatives with different technical solutions that increase the use of RES in heat supply.
1. Introduction
1.1. Nature of the Study
The progress of the European Union (EU) towards increasing the share of renewable energy sources (RES) in the energy sector is dynamic. From 2014 until May 2022, four regulatory legislative measures were announced, setting out the target for the share of RES in the energy sector to be achieved by 2030. Initially, the target was only 27%, but given the recent developments in the world and the Russian Federation’s aggression against Ukraine, it soared to 45% [1]. Given that the Republic of Latvia (RoL) is an EU Member State, participation in the achievement of this target is its responsibility. According to Latvia’s National Energy and Climate Plan 2021–2030 [2,3], it plans to increase the share of RES to be used in energy production by 2030 from 40% to 50%. One way of achieving this objective is to modernise different municipalities’ district heating (DH) systems.
Before modernisation, an in-depth study is carried out with a structured analysis of each case and a description of the existing situation. It is standard practice worldwide to develop a Sustainable Energy Action and Climate Plan (SECAP) in a city/municipality context [4]. Municipalities have competence in achieving the energy transition objectives locally, including increasing the RES share in the energy mix [5,6]. Various aspects must be considered, which can accelerate and ease the energy transition process or make it more difficult.
The main strength of the local government in such matters is its influence [7]. Influence can be seen through local regulatory legislative measures, investments, taxes, and fees [8]. The main area for improvement is related to the search for attracting, splitting, and relating the bureaucracy of funding sources. There are examples where the rational use of local government influence resulted in high-value results for achieving the energy transition objectives. Municipal green energy initiatives have contributed significantly to energy diversification and have influenced energy policy in countries such as Denmark (Denmark has consistently reduced both primary and final energy consumption since 2010, and Denmark [9] installed significant amount of large-scale solar heating plants [10] and set the national target for a building sector solely supplied by RES in 2035 [11]), Germany (Germany has a long history of seasonal thermal energy storage development [10] and a number of policies to reduce greenhouse gas (GHG) emissions [12]), and Britain, United Kingdom (UK) (the UK has set itself on a transition to carbon neutrality in both its economy and society, through the imposition of a goal, under the 2008 Climate Change Act, of reducing GHG emissions by 80% by 2050 [9]). In the meantime, such examples apply to DH and do not relate to initiatives and actions in local or individual heating (IH) [10]. In some municipalities, the share of IH may be higher than DH, which means that the influence should be directed to supporting IH in the transition to RES. It is necessary to balance DH and IH support to move optimally towards carbon neutrality [11,12,13]; however, most studies are based on a theoretical approach while manuscripts with case studies rarely occur.
Despite a narrow range of similar analyses, the study described in this article brings new scientific contributions. First, a developed methodology offers access to the analysis of the various DH and IH alternatives using three different parameter categories: technical, economic, and environmental. This approach makes it possible to identify an economically viable alternative and a more sustainable and environmentally friendly one. The methodology’s structure can be reproduced in other similar studies and adapted for specific purposes. Secondly, the methodology developed was examined in a case study (see Section 2.1). The study’s calculations are based on the real system, not on the model. Thirdly, alternative variations consist of a variety of RES technology combinations. Each alternative is scientifically justified.
1.2. Comparison of DH and IH
Various factors determine the difference between DH and IH [12,13,14]. By nature, DH and the IH differ in the level of centralisation. For example, local boilers may be installed in each private property or apartment, which in some ways ensures tariff independence and allows for a more intensive change in their consumption [15,16,17,18]. DH provides continuous heating through heating networks from heat generators (e.g., boilers, cogeneration plants, etc.) which are located away from the consumer [19,20,21]. Two further factors are related to infrastructure nuances—distribution costs (including building/renewal and periodical management of the heating networks) and heat losses in heating networks [11,16]. The distribution costs are closely linked to the shares of DH and IH in each municipality. This share can be characterised by linear heat density [16]. A higher share of DH means a higher linear heat density value. Accordingly, the higher linear heat density value means heating distribution costs for consumers [11]. Heat losses in heating networks only exist in the case of DH and affect the need for a higher-power boiler. This is certainly reflected in costs [17]. The reduction in heat loss in networks can be achieved by transitioning to a fourth-generation DH [18,19]. In this respect, the fourth generation means reducing the temperature regime in the heating networks (low-temperature network) by considering the specific thermal energy consumption of each connected building, which impacts the heat loss and fuel consumption reduction [6,18]. There are examples of good practices where the transition to the fourth-generation DH positively impacted the development of municipal infrastructure [6]. Since 2013, the German company BTB GmbH Berlin has implemented a project aimed at a low-temperature network with two-way connections and network substations. A new residential area called “Life in Camp” was created, including 1200 apartments in single-family homes, row houses, and multi-apartment houses—sixty-two buildings with low heat demand, five buildings with low energy consumption, and three buildings with additional energy. The main characteristic is developing a low-temperature district heating network (60/40 °C) using a return stream from a conventional heat grid (110/55 °C). This is probably due to a low thermal energy consumption of less than 15 W/m2 [20].
Under Project LowTEMP: Low-Temperature District Heating for the Baltic Sea Region, fourth-generation DH was tested and implemented from 2017 to 2020 in the village of Gulbene municipality, Latvia. The project renovated a boiler house (replacing a 1 MW wood boiler with a modern high-efficiency container-type 200 kW pellet boiler) and heating networks. The heating system was rescheduled to minimise the length of the heating networks and thus reduce heat losses. The renovated buildings were switched to low-temperature DH, reducing heat supply temperature and reducing total heat losses. Heat transmission losses decreased from 40% to 5% due to heat reconstruction and reduced heat carrier temperature [21].
Within the framework of the study, the possibilities of using renewable energy sources in one of the municipalities of Latvia—the Carnikava parish of Ādaži Municipality—are analysed.
The objective of the research is to understand exactly how, in certain municipal buildings of residents (residential buildings with multiple apartments) that have a centralized heat supply using fossil fuels (natural gas) and in municipal buildings using individual natural gas boilers, a partial or complete conversion to RES heat supply solutions is possible. In the concrete municipality, the issue of how to transfer the residential and municipal buildings sector from natural gas to RES is important for the municipality’s progress in meeting the goals of the Latvian National Energy and Climate Plan and the European Green Deal in the buildings sector.
This study examines two scenario complexes including IH individual heating solutions in buildings or DH solutions with a centralised approach. The study evaluates several alternatives to increase the share of RES (e.g., solar collectors, biomass, heat pumps, etc.) in the centralised heat supply. The study was carried out based on real data on the thermal energy consumption of Carnikava’s buildings and scientific data sources in order to make assumptions.
In order to evaluate the most sustainable RES heat supply solutions (technology combinations) that could replace the natural gas solutions used in DH and IH in Carnikava village, the CSI was created.
2. Methodology
2.1. Case Study
Carnikava is a village and the centre of the Carnikava parish of Ādaži Municipality in Latvia. The geographical limits of the study were defined (see Appendix B). The area includes twenty-eight residential buildings, six municipal buildings, and five commercial buildings
2.1.1. DH System
The Carnikava DH system consists of six interconnected boiler houses and heating networks. The total length of the heating networks is 2837 m, of which 1156 m is industrially insulated. All boiler houses have Viessmann natural gas boilers with different capacities, from 520 kW to 1500 kW (as shown in Appendix B). The main data on DH in Carnikava are shown in Table 1. Losses in heating networks range from 15% to 17%. The loss value indicates that the heat transmission infrastructure is inferior. The main reason is the preparation of hot water outside the heating season. As summer consumption is meagre, the percentage of heat losses is very high in the summer months.

Table 1.
Major Data on DH in Carnikava Village.
2.1.2. Municipality Buildings
According to 2019 data, the municipality has more than 9500 inhabitants and in the case of this study 6 municipal buildings were analysed. Therefore, municipal buildings are very diverse in terms of their functionality and building characteristics, and they are not connected to the DH system. Table 2 contains a summary of the technical parameters of municipal buildings. Each parameter is obtained using the information provided by the municipality, data on electricity, heat energy, as well as calculations based on real and scientific assumptions. Scientific assumptions for making calculations are summarized in Appendix A.
Table 2.
Technical Parameters of Municipal Buildings in Carnikava Village.
Figure 1 shows the average monthly heat and electricity consumption from 2019 to 2021. The largest energy consumers are the elementary school, preschool, and office building. The largest heat energy consumption is in the heating season, especially in winter. During the summer, the heat energy consumption is for preparing hot water. From September to April, electricity consumption is higher in the preschool and elementary school, but in other buildings the difference in electricity consumption between winter and summer is up to 1 MWh per month.
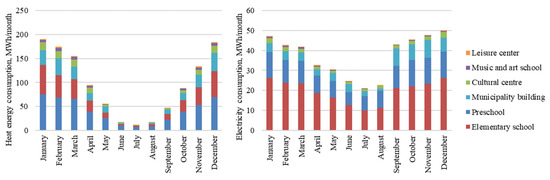
Figure 1.
Average heat and electricity consumption (2019–2021), MWh/month (2019–2021) in Carnikava Village.
Analysing the specific energy consumption of municipal buildings, the buildings with the highest specific energy consumption are preschool, music and art school, and culture centre buildings (see Figure 2). The preschool and music and art school have the highest specific heat energy consumption, but the elementary school has the lowest. The preschool and primary school have the highest specific electricity consumption, while the music and art school has the lowest specific electricity consumption. On average, the specific electricity consumption is four times lower than the specific heat energy consumption. However, the most similar specific electricity and heat energy consumption is for the elementary school, but the biggest difference in the specific electricity and heat energy consumption is for the music and art school.
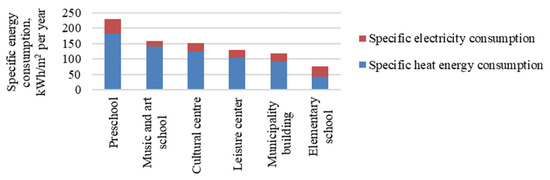
Figure 2.
Specific energy (electricity and heat) consumption in municipal buildings in Carnikava village.
2.2. Development Scenarios
The existing solutions in Carnikava’s district heating are natural gas—six local boiler houses and natural gas boiler houses in municipal buildings. To compare the sustainability of DH solutions and individual IH solutions, by comparing the values of different factors, the case of Carnikava is used and six DH alternatives are compared with -four IH scenarios for municipality buildings. In the case of district heating, different scenarios are evaluated by combining existing and connecting new consumers. Based on research in the scientific literature, alternative RES solutions have been selected and identified, which can be used in DH residential buildings and IH municipal buildings. The selection of technology combinations was carried out in such a way that solutions with biomass, e.g., wood chips and pellets; air heat pump solutions, which are considered economically easier to implement; as well as additional sources for covering the summer load, including solar energy solutions, i.e., solar collectors for heat supply and electricity supply/for operating the heat pump and solar panels, were included (Table 3).
Table 3.
Scenarios for district heating and municipal buildings.
2.2.1. District Heating System
Six possible alternatives were defined for increasing the share of RES in DH. Alternatives can be introduced at the same time as the implementation of IH development scenarios. They mainly involve the combination of separate systems and heat networks.
Different RES alternatives for consumer scenarios were evaluated for the scenario of existing consumers and the scenario of connecting new consumers. Two cases of DH development were evaluated—the five boiler houses on the left side of the railroad and the DH system contained in them were combined into a whole, and two DH were combined according to their distance from each other. Since the DH in Carnikava is also used for hot water production, which means that there is also a summer load, the scenarios of installing heat pumps and solar collectors were also evaluated when comparing the alternatives. For the created large gas boiler plant, the scenario of installing a wood chip boiler was evaluated, while in the case of the two smaller created plants, the installation of pellet boilers was evaluated as a basic alternative. The heat pump and solar collector scenarios are each supplemented by the fuel boiler used for each system—wood chips for the large system and pellets for the two smaller systems. The six alternatives for DH are listed in Table 4.
Table 4.
Alternative DH in multi-apartment buildings—the current situation with new consumers.
Woodchip boiler. In the scenario that envisages combining the five existing DH plants of Carnikava into one and connecting the municipal buildings, the construction of a woodchip boiler house was evaluated.
Pellet boiler. The construction of pellet boiler houses was evaluated in the scenario that proposes to combine Carnikava’s five existing DH systems into two separate systems and connect municipal buildings to them. By creating two separate systems, the consumer load is slightly too low for using a wood chip boiler.
Woodchip boiler + solar collectors with storage. Considering that the number of consumers in Carnikava is small and distributed over a large area, the scenario where solar collectors with storage are installed to cover the summer load will be studied. They should be placed closer to the consumers. A woodchip boiler will be used to cover the heating load in the case of a combined CSA system.
Pellet boiler + solar collectors with storage. Considering that the number of consumers in Carnikava is small and spread over a large area, it is planned to study the scenario where PV panels are installed in combination with an air source heat pump to cover the summer load. They will be placed closer to the consumers. In the case of two separate CSA systems, pellet boilers will be used to cover the heating load.
2.2.2. Individual Heating Solutions
Four possible alternatives were defined for increasing the share of RES in IH in municipality buildings, replacing natural gas boilers Alternatives can be introduced at the same time as the implementation of DH development scenarios. The alternatives for IH solutions are as follows in Table 5.
Table 5.
Alternatives for individual heating solutions in municipality buildings.
Pellet boilers. One of the alternatives is to replace natural gas boilers with a pellet boiler that provides heating and hot water: solar panels and a heat pump. The building has a summer heat load, so one alternative is solar panels, which would generate electricity for the heat pump during the summer months. Solar collectors. Assuming the roof of the building is suitable for installing solar panels, solar panels can be considered another heat energy alternative. Thus, the necessary summer heat load can be met with solar collectors.
One of the alternatives is to replace the natural gas boilers with a pellet boiler that provides heating and hot water. The provision of thermal energy with solar panels and a heat pump was analyzed as another technological solution since the heat pump does not require a large area, and the building has a large roof area that can be effectively used for solar panels. The electricity consumption of the heat pump can be covered in the summer months by using electricity from solar collectors. Therefore, this alternative evaluates the installation of both an air source heat pump and a solar power plant. In these scenarios, solar panels are considered to meet the summer load and the existing natural gas system or its replacement with a pellet boiler to meet the remaining heat load. Solar collectors could meet the summer load of the building’s hot water consumption, provided the building’s roof is suitable for solar collector installation. The installation of solar collectors is not considered for buildings that have low summer hot water consumption or are heavily shaded. In addition to the solar collectors, a suitable buffer tank should be integrated to cover 2–3 days of consumption.
2.3. Decision-Making Analyses
Sustainability assessment requires an integrated approach and a structure with several interconnected steps. The methodology of this study is based on three main pillars:
- The identification of the internal and external context that influences the sustainability of the heat supply system
- The calculation of the composite sustainability index
- The analysis of the results and the decision-making process.
Identifying the internal and external context includes a literature review of current practises in the sustainability assessment of energy supply technologies to identify key sustainability issues and develop a research methodology. The core element of the sustainability assessment is the construction of the composite sustainability index.
Composite indices are commonly used amongst scientists when choosing the most appropriate methodology to evaluate sustainable development. The method combines various aggregate values that are used to determine indicators of the topic being studied. Composite index is commonly used in research projects for policymakers to simplify the problem and highlight significant findings. A composite index allows for easy comparisons to assess the sustainability performance of regions, sectors, and other factors.
The main chronological steps that are applied when developing a composite sustainability index are illustrated in Figure 3 below.
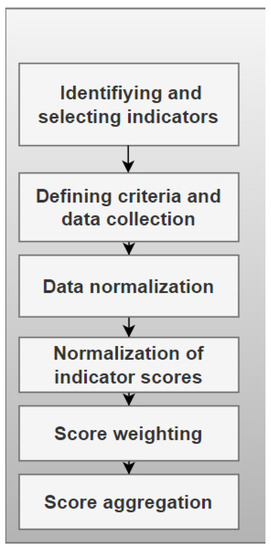
Figure 3.
Construction of CSI [16,22].
In this study, the composite sustainability index is calculated for six district heating scenarios and four different technical solutions for decentralised (individual) heat supply. The indicator considers only the consumption of primary resources, shown as fuel consumption/total energy production in MWh in each of the scenarios. The share of solar collectors and PV panels are not considered in the calculation of efficiency; however, solar collectors and PV panels are included in the investment calculations.
The methodology of composite sustainability and the selected indicators were chosen following the study in [15].
2.3.1. Identification of Criteria
The second step is to identify and select appropriate criteria that are significant determiners of the study’s dependent variable. When identifying key indicators, it is crucial to consider data availability for the indicators (see Table 6).
Table 6.
Indicators for the construction of CSI for DH and IH technologies.
Indicators such as fuel enerrgy consumption (i1), specific NOx emissions (i2), specific PM emissions (i3), CO2 reduction costs (i4), investments (i5), IRR (i6) (example of net cash flow for technologies in Table 7), production costs (i7), and opportunities for diversification of energy resources used (i8) were used to evaluate and compare the district heating and individual heating scenarios.
Table 7.
Net cash flow EUR/year (for 15 years) for DH wood chip boiler with flue gas condenser technologies.
All scenarios are calculated based on the same input data (e.g., thermal energy consumption, thermal energy tariff, etc.) and assumptions (technology efficiency, technology investment and operating costs, etc.). The assumptions were made based on the scientific literature, technology catalogue manuals, findings of energy industry representatives, and other sources. At the same time, the selected parameter values reflect the current situation and are partially subject to uncertainties related to the authors’ vision and the energy sector’s rapidly changing situation (see parameters in Appendix A). The most appropriate solution was selected based on the above indicators, including the internal rate of return (IRR) and CO2 savings per amount of money invested. As an additional parameter, the amount of investment required is given, which describes the amount of money originally intended for implementing the project.
Calculations for each indicator.
I1 Consumption of fuel energy (Equation (1)):
Example calculations for DH wood chip boiler with flue gas condenser:
where
Wood chip consumption—10,876 ber/m.
Wood chip lowest heat of combustion—0.7 MWh.ber/m3.
Annual amount of energy produced—7689 MWh.
All greenhouse gas emissions result from the combustion and fugitive release of fuels. The emission factor is a relative measure and can be used to estimate emissions from various sources of air pollution. An emission factor is a representative value that relates the amount of a pollutant released into the atmosphere to an activity associated with the release of that pollutant. It is expressed as the mass of the pollutant divided by the unit mass, volume, distance, or duration of the activity that releases the pollutant (e.g., kilograms of particles emitted per megagram). Residential wood combustion is the primary emission source for some pollutants. PM and NOx emissions per MWh generated vary depending on whether the boiler is small or large. PM and NOx emission factors once for different technologies and different resources. All NOx and PM emission factors for each technology are based on the AARHUS UNIVERSITY department of Environmental Science emission factors (for fuel input) database [23].
I2 Specific NOx emissions (Equation (2)):
Example calculations for DH wood chip boiler with flue gas condenser:
where
Consumption of DH wood chip—0.99 MWh/MWh.
NOx emission factor for DH wood chip boiler—324 g/MWh (data based on AARHUS University Department of Environmental Science emission factors [24] (group 010203—district heating plants, wood and similar combustion plants <50 MW (boilers)).
I3 Specific PM emissions (Equation (3)):
Example calculations for DH wood chip boiler with flue gas condenser:
Specific PM emissions of DH wood chip boiler = Consumption of wood chip (MWh/MWh) × PM emission factor for DH wood chip boiler.
where
Consumption of DH wood chip—0.99 MWh/MWh.
PM emission factor for DH wood chip boiler—emission factor for PM2.5 is 36/MWh. (Data based on AARHUS UNIVERSITY Department of Environmental Science emission factors [24]. Group 010203—district heating plants, wood, and similar combustion plants <50 MW (boilers)).
I4 Costs of CO2 reduction
By switching from fossil fuels to RES, a reduction in CO2 emissions is achieved. Reducing CO2 emissions is one of the priorities at the national and municipal levels, as the consequences of climate change affect everyone.
- (1)
- The reduction in CO2 emissions depends on the amount of fossil energy replaced and the type of fossil energy (see Equation (4)).
—reduction in CO2 emissions, tons.
Q—the annual amount of heat energy produced, MWh.
—CO2 emission factor, kgCO2/kWh.
- (2)
- Costs of CO2 reduction (Equation (5)):
Example calculations:
- The reduction in CO2 emissions for DH wood chip boiler with flue gas condenser:
—reduction in CO2 emissions, tons;
Q—7689 MWh;
Boiler efficiency—90%;
—CO2 emission factor, kgCO2/kWh—0.202.
- 2.
- Cost of CO2 reduction for DH wood chip boiler with flue gas condenser:
I5 Investments—investments per unit of energy produced, EUR/MWh (see Equation (6)):
I6 Internal rate of return (IRR), % (Equation (7))
Internal rate of return, % for DH wood chip boiler:
I7 Production costs
Production costs, EUR/MWh (Equation (8)).
where production costs, EUR—458,312. Q—the annual amount of heat energy produced, MWh/year—7689.
Calculated data for CSI construction
Table 8 shows the calculated data for constructing the composite sustainability index for each alternative. Values equal to 0 are denoted as 0.00001 because setting the input value to 0 in the complex index is not permissible.
Table 8.
Calculations for district heating and individual heating comparison (based on scientific assumptions and Appendix A).
2.3.2. Data Normalization
When creating a complex composite sustainability index, the data must first be normalized for mutual comparison of measures and indicators. To compare and compile indicators, the data must first be normalized. To standardise the indicators, the min–max method was used in sustainability studies for normalization. The min–max normalization method was used for normalisation, which is also used in environmental decision making and policy analysis. This method presents the results on a scale of [0;1]. The indicators selected for the study were normalized using Equation (9).
where
I+N,ij Normalized indicator;
I+act,i The actual value of indicator;
I–min,i Minimum value of an indicator;
I+max,i Maximum value of an indicator;
i Specific indicator [16,24,25].
2.3.3. Weighting of Indicators
To determine the weight of each indicator, it is possible to use expert interviews to determine the importance of the indicators or assign the same weight to each indicator so that the total weight of the indicators is one. An equal weighting technique was used in this study. Since eight indicators have been chosen, which describe the economic profitability and environmental dimension of RES technologies, the weight of each indicator is 0.13.
The composite sustainability index is calculated as the total sum of all indicators, according to Equation (10).
2.3.4. Aggregation of Indicators into CSI
The sum of all indicators results in the final CSI, which can be used for further comparisons.
where
is a composite sustainability index;
the impact weight of indicators of equal importance (calculated in %) [23,25]
the normalized value of an indicator.
3. Results and Discussion
The selected indicators make it possible to assess the economic potential of the selected DH and IH alternatives, characterized by the costs of implementing the relevant technologies instead of the existing natural gas boilers, the technical possibilities for diversifying resources, as well as the impact of technological solutions on the environment.
Economic dimension indicators. The calculations show that out of the six alternatives offered in the centralized heat supply and four alternative solutions in the individual heat supply, the highest fuel energy consumption is for the alternatives DH pellet boiler and IH pellet boiler. The highest investment in the energy produced is calculated for the alternative IH heat pump solution + PV panels. Among the technological solutions, the lowest IRR, replacing the existing natural gas boiler by introducing one of the RES technologies, was evaluated for the DH alternatives pellet boiler and solar collectors with storage, but the highest for the DH alternative wood chip boiler with flue gas condenser. The highest costs of CO2 production are calculated for IH solar collectors with storage and natural gas boiler. The IH heat pump solution + PV panels are rated as the highest-production-cost alternatives.
For the environmental dimension indicators, among the alternatives, the highest NOx and PM emissions were assessed for the IH wood pellet boiler.
From the calculated indicators, it was not unequivocally determined which of the proposed alternatives will be the most sustainable solution, which should be introduced in the municipality as the first, and whether they will be DH or IH technological heat supply solutions, which would allow the existing heat supply solution—natural gas boilers—to be partially or wholly abandoned. In order to determine the sustainability of these solutions based on the calculated indicators for each of the alternatives, the CSI was created.
Assessment of Alternatives in DH and IH
The composite index results (see Figure 4) show the highest score for three DH alternatives—DH wood chip boiler and PV panels + heat pump solution (0.79); DH wood chip boiler and solar collectors with storage (0.73); and DH pellet boiler and PV panels + heat pump solution (0.69). All three solutions rated above combine either wood chip boilers or wood pellet boilers in combination with heat pumps and/or solar panels or solar collectors. Two higher rated DH alternative solutions include air-type heat pumps, and two include PV panels. All three alternatives have lower production costs and investments needed compared to the other alternatives, and it is also possible to diversify energy sources.
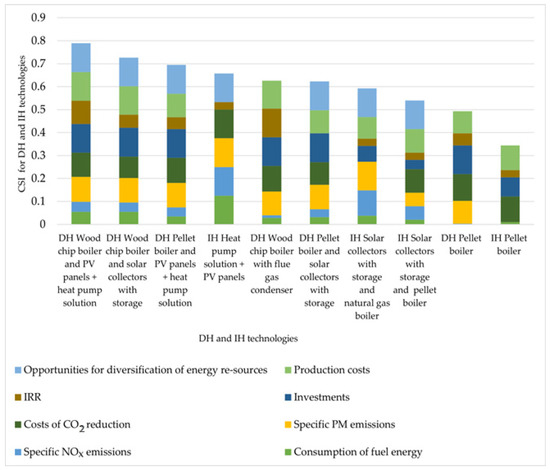
Figure 4.
CSI for IH and DH technologies.
The fourth highest rated alternative was the IH heat pump solution + PV panel (0.66). This technological solution does not require fuel energy consumption, emissions are formed only from the electricity required to operate the pump, and it also has the lowest CO2 reduction costs of the alternatives.
Four lower rated alternatives were three alternative solutions for individual heat supply for municipal buildings and one DH alternative solution—IH solar collectors with storage and natural gas boiler (0.59); IH solar collectors with storage and pellet boiler (0.54); DH pellet boiler (0.49); and IH pellet boiler (0.34).
IH alternatives with solar collectors with storage and natural gas boilers are undervalued due to economic indicators such as IRR and investments/produced energy. Therefore, the lowest indicator for the alternative of solar collectors with a natural gas boiler is the IRR, which determines that installing such a combination of technologies for a specific municipal building is not profitable. Similarly, IH solar collectors with storage and pellet boilers in the case of an alternative. The low score for individual heat supply with solar collectors can be explained by the fact that a specific urban building was evaluated and not a set of several buildings in this case. Therefore, in the case of solar collectors, a larger investment is required for one building, and the maximum roof area of the urban building for installing solar collectors must also be considered.
The DH pellet boiler alternative is rated with the second lowest rating in CSI. Such indicators as fuel energy consumption and NOx emissions influence the low rating of the alternative. The lowest alternative in the sustainability index is the installation of an IH pellet boiler instead of existing natural gas boilers, which is determined by such indicators as fuel energy consumption, emissions, and IRR, which characterize the fact that such a project will not be economically feasible to implement.
The following are the limitations of the study: The low score is influenced by the fact that a solution with solar collectors was only considered for a single municipal building, but solutions for other technologies were considered for multiple buildings, adding up the volume produced and the total investment by types of alternatives. Solar collectors are one of the highest investments in terms of technology, and the maximum roof area of each building influences the possible number of collectors. In addition, this scenario includes the installation of a pellet boiler. Therefore, compared to the other alternatives, it is not economical for the specific urban building to implement this solution, which is also reinforced by the low IRR indicator.
In future studies, it would be necessary to use expert surveys to add indicators characterizing the social dimension to the economic environmental indicators for the most complete analysis.
4. Conclusions
This research aims to understand how it is possible to switch to renewable energy technologies in multi-apartment buildings and municipal buildings in Carnikava, where natural gas is used as fuel. Furthermore, it asks which economic or environmental indicators affect the potential and sustainability of RES technologies. This study was conducted based on real data on the thermal energy consumption of Carnikava’s buildings and scientific data sources to make assumptions.
The two main technological solutions compared to existing natural gas combustion systems were wood chip and pellet boilers. Solar collectors and heat pumps were evaluated as additional alternative scenarios to complement the wood chip and pellet boilers. The scenario with solar collectors included the installation of a wood chip or pellet boiler to meet the heating load, supplemented by solar collectors with storage to meet the summer hot water load. The scenario with heat pumps also provided for installing a wood chip or pellet boiler to cover the heating load, supplemented by installing heat pumps to cover the summer hot water load. Since electricity is needed to operate the heat pump, installing heat pumps and solar panels to generate electricity was considered. Air-to-water-type heat pumps were chosen for the analysis of alternatives.
The composite index results show the highest score for three DH alternatives—DH woodchip boiler and PV panels + heat pump solution (0.79); DH woodchip boiler and solar panels with storage (0.73); and DH pellet boiler and PV panels + heat pump solution (0.69). Only the fourth highest rated alternative was for the IH alternative heat pump solution + PV panel (0.66).
The lowest rated alternatives were IH solar collectors with storage and natural gas boiler (0.59) and IH solar collectors with storage and pellet boiler (0.54). The low ratings of the solar collector solutions can be explained by the fact that the possibilities of installing solar collectors were analyzed for a municipal building, where the implementation of such a project is too expensive, and that the low rating is mainly influenced by factors such as the IRR and the total investment concerning the total amount of energy generated.
The DH pellet boiler (0.49) and IH pellet boiler (0.34) boiler alternatives are rated the second lowest and lowest in CSI. Indicators such as fuel energy consumption and NOx emissions influence the low rating of the alternatives. The lowest alternative in the sustainability index is the installation of an IH pellet boiler instead of the existing natural gas boilers. This is determined by indicators such as fuel energy consumption, emissions, and IRR, which characterize the fact that such a project is not economically feasible. It can be concluded that the significant impact on the sustainability rating in CSI comes from IRR and investments per unit of energy produced. If the alternative is not economically feasible to implement and the invested investments do not pay off, this determines that the alternative will have a lower rating in the long-term evaluation. Alternatives that include wood pellet boiler solutions are most affected by indicators such as fuel energy consumption and NOx emissions.
It can be concluded that DH solutions in the case of Carnikava are more sustainable, which is determined by economic indicators such as IRR and investments, economic and technical indicators such as fuel energy consumption, and environmental indicators such as NOx emissions.
The analysis and creation of a CSI based on real data and assumptions based on the scientific literature serves as an effective method that can be used in the decision-making process to simultaneously evaluate the economic and environmental dimensions and decide on the most sustainable solutions, so that municipalities can decide to increase RES in centralized and individual heat supply.
Author Contributions
Conceptualization, I.P., L.B. and D.B.; Methodology, L.B.; Validation, V.K. and I.P.; Formal analysis, L.B., B.Z., A.G. and V.K.; Investigation, L.B. and A.G.; Data curation, L.B., B.Z., A.G., O.S. and V.K.; Writing—original draft, I.P., L.B., O.S. and I.P.; Writing—review & editing, L.B., B.Z. and O.S.; Supervision, I.P., V.K. and D.B. All authors have read and agreed to the published version of the manuscript.
Funding
This work has been supported by the European Social Fund within the project No 8.2.2.0/20/I/008 “Strengthening of Ph.D. students and academic personnel of Riga Technical University and BA School of Business and Finance in the strategic fields of specialization”.
Institutional Review Board Statement
Not applicable.
Informed Consent Statement
Not applicable.
Data Availability Statement
Not applicable.
Conflicts of Interest
The authors declare no conflict of interest.
Nomenclature
| Individual heating | IH |
| District heating | DH |
| Composite sustainability index | CSI |
| Renewable energy sources | RES |
| Particulate matter emissions | PM emissions |
Appendix A
Table A1.
Parameters and values used in the study.
Table A1.
Parameters and values used in the study.
| Parameter | Value | Unit |
|---|---|---|
| Technology creators | ||
| Natural gas boiler efficiency | 90 | % |
| Chip boiler efficiency | 87 | % |
| Pellet boiler efficiency | 85 | % |
| Diesel boiler efficiency | 90 | % |
| Solar panel area | 1.92 | m2 |
| Power of one solar panel | 405 | W |
| Nominal efficiency of solar panels | 0.211 | |
| Loss factor of solar panels | 0.95 | |
| Nominal efficiency of the solar collector | 78.8 | % |
| Maximum efficiency of the solar collector | 0.89 | % |
| The average temperature of the solution circulating in the solar collector at the given hour | 70 | °C |
| Absorption area of the solar collector | 1.78 | m2 |
| Solar panel area | 2.05 | m2 |
| Technology costs | ||
| Pellet boiler | 526.803.94 × x(−0.299) | EUR/kW |
| Pellet boiler with hydraulic system | 104.0117.4 × x(−0.349) | EUR/kW |
| 40 | % |
| 45 | % |
| 6 | % |
| 9 | % |
| Chipped boiler house | −4081.6 × x3 + 74,447.43 × x2 − 452,854.13 × x + 1,151,845.31 | EUR/kW |
| 33 | % |
| 45 | % |
| 6 | % |
| 16 | % |
| Flue gas condenser | 100 | EUR/kW |
| Heat pump (technology + installation) | 266.36 | EUR/kW |
| Solar panels (technology + installation) | y = 5883.3086467157x − 0.3743667246 1 | EUR/kW |
| Solar collectors (high-power projects) | 155.4 | EUR/m2 |
| Solar collectors (low-power projects) | 275.3 | EUR/m2 |
| Thermal energy storage (large-capacity projects) | 113.8 | EUR/m3 |
| Thermal energy storage (low-capacity projects) | 735 | EUR/m3 |
| The heating unit of the building | 50 | EUR/kW |
| CSS pipeline (metal pipe) | =1.3756 × x + 150.89 2 | EUR/m |
| Fuel indicators | ||
| The lowest heat of combustion of natural gas | 9.5 | MWh/1000 m3 |
| The lowest heat of combustion of wood chips | 0.7 | MWh/t |
| The lowest heat of combustion of pellets | 5 | MWh/t |
| The lowest heat of combustion of diesel fuel | 9.91 | Mwh/m3 |
| Cost of energy resources | ||
| The price of natural gas | 90.00 | EUR/MWh |
| Chip price | 32.00 | EUR/MWh |
| The price of pellets | 64.00 | EUR/MWh |
| Electricity tariff | 300.00 | EUR/MWh |
| Electricity price for electricity transferred to the network (within the Net settlement system) | 250.00 | EUR/MWh |
| Electricity received from the network (within the Net settlement system) | 50.00 | EUR/MWh |
| The price of diesel fuel | 93.24 | EUR/MWh |
| Heat energy production indicators | ||
| Service costs | ||
| Natural gas | 12.500 | EUR/MW gadā 3 |
| A splinter | 20.000 | EUR/MW gadā |
| Granules | 17.500 | EUR/MW gadā |
| Diesel fuel | 12.500 | EUR/MW gadā |
| Administrative costs and salaries | ||
| Natural gas | 15.000 | EUR/MW gadā |
| A splinter | 25.000 | EUR/MW gadā |
| Granules | 20.000 | EUR/MW gadā |
| CO2 taxes | ||
| Natural gas | 15 | EUR/tCO2 |
| A splinter | 0 | EUR/MWh (saražoto) |
| Granules | 0 | EUR/MWh (saražoto) |
| Additional costs (not fuel) | ||
| Natural gas | 20.0 | % |
| A splinter | 50.0 | % |
| Granules | 30.0 | % |
1 x—technology capacity, kw. 2 x—pipeline diameter, mm. 3 The installed capacity of the technology.
Appendix B

Figure A1.
The area of Carnikava village, that falls within the scope of the study (created by authors).
Figure A1.
The area of Carnikava village, that falls within the scope of the study (created by authors).

References
- European Union. REPowerEU: A Plan to Rapidly Reduce Dependence on Russian Fossil Fuels and Fast Forward the Green Transition. Available online: https://ec.europa.eu/commission/presscorner/detail/en/ip_22_3131 (accessed on 22 April 2023).
- European Commision. Assessment of the Final National Energy and Climate Plan of Latvia; European Commision: Brussels, Belgium, 2020. [Google Scholar]
- Cabinet of Ministers. National Energy and Climate Plan of the Republic of Latvia for 2021–2030; European Commision: Brussels, Belgium, 2020. [Google Scholar]
- Hoang, A.T.; Pham, V.V.; Nguyen, X.P. Integrating renewable sources into energy system for smart city as a sagacious strategy towards clean and sustainable process. J. Clean. Prod. 2021, 305, 127161. [Google Scholar] [CrossRef]
- Kata, R.; Cyran, K.; Dybka, S.; Lechwar, M.; Pitera, R. The Role of Local Government in Implementing Renewable Energy Sources in Households (Podkarpacie Case Study). Energies 2022, 15, 3163. [Google Scholar] [CrossRef]
- Thellufsen, J.Z.; Lund, H.; Sorknæs, P.; Østergaard, P.A.; Chang, M.; Drysdale, D.; Nielsen, S.; Djørup, S.R.; Sperling, K. Smart energy cities in a 100% renewable energy context. Renew. Sustain. Energy Rev. 2020, 129, 109922. [Google Scholar] [CrossRef]
- Liu, W.; Best, F.; Crijns-Graus, W. Exploring the pathways towards a sustainable heating system—A case study of Utrecht in the Netherlands. J. Clean. Prod. 2021, 280, 125036. [Google Scholar] [CrossRef]
- Neij, L.; Heiskanen, E. Municipal climate mitigation policy and policy learning—A review. J. Clean. Prod. 2021, 317, 128348. [Google Scholar] [CrossRef]
- Barton, J.; Davies, L.; Dooley, B.; Foxon, T.J.; Galloway, S.; Hammond, G.P.; O’grady, Á.; Robertson, E.; Thomson, M. Transition pathways for a UK low-carbon electricity system: Comparing scenarios and technology implications. Renew. Sustain. Energy Rev. 2018, 82, 2779–2790. [Google Scholar] [CrossRef]
- Askeland, K.; Bozhkova, K.N.; Sorknæs, P. Balancing Europe: Can district heating affect the flexibility potential of Norwegian hydropower resources? Renew. Energy 2019, 141, 646–656. [Google Scholar] [CrossRef]
- Gebremedhin, A. Introducing District Heating in a Norwegian town—Potential for reduced Local and Global Emissions. Appl. Energy 2012, 95, 300–304. [Google Scholar] [CrossRef]
- Yoon, T.; Ma, Y.; Rhodes, C. Individual Heating systems vs. District Heating systems: What will consumers pay for convenience? Energy Policy 2015, 86, 73–81. [Google Scholar] [CrossRef]
- Gudmundsson, O.; Thorsen, J.E.; Zhang, L. Cost analysis of district heating compared to its competing technologies. Trans. Ecol. Environ. 2013, 176, 1743–3541. [Google Scholar]
- Wang, K.; Nakao, S.; Thimmaiah, D.; Hopke, P.K. Emissions from in-use residential wood pellet boilers and potential emissions savings using thermal storage. Sci. Total Environ. 2019, 676, 564–576. [Google Scholar] [CrossRef] [PubMed]
- Safarzadeh, S.; Rasti-barzoki, M.; Hejazi, S.R. A review of optimal energy policy instruments on industrial energy efficiency programs, rebound effects, and government policies. Energy Policy 2020, 139, 111342. [Google Scholar] [CrossRef]
- Balode, L.; Dolge, K.; Blumberga, D. The Contradictions between District and Individual Heating towards Green Deal Targets. Sustainability 2021, 13, 3370. [Google Scholar] [CrossRef]
- Dochev, I.; Peters, I.; Seller, H.; Schuchardt, G.K. Analysing district heating potential with linear heat density. A case study from Hamburg. Energy Procedia 2018, 149, 410–419. [Google Scholar] [CrossRef]
- Li, H.; Nord, N. Transition to the 4th generation district heating—Possibilities, bottlenecks, and challenges. Energy Procedia 2018, 149, 483–498. [Google Scholar] [CrossRef]
- Kristensen, M.H.; Petersen, S. District heating energy efficiency of Danish building typologies. Energy Build. 2021, 231, 110602. [Google Scholar] [CrossRef]
- Pakere, I.; Romagnoli, F.; Blumberga, D. Introduction of small-scale 4th generation district heating system. Methodology approach. Energy Procedia 2018, 149, 549–554. [Google Scholar] [CrossRef]
- IRENA. Renewable Energy in District Heating and Cooling with Co-Generation of Heat and Power; IRENA: Masdar City, United Arab Emirates, 2017. [Google Scholar]
- Balode, L.; Dolge, K.; Lund, P.D.; Blumberga, D. How to Assess Policy Impact in National Energy and Climate Plans. Environ. Clim. Technol. 2021, 25, 405–421. [Google Scholar] [CrossRef]
- Aarhus University. Emission Factors per GJ Fuel Input. Available online: https://envs.au.dk/fileadmin/envs/Emission_inventories/Emission_factors/Emf_internet_energy_GHG.htm (accessed on 8 May 2023).
- Lemke, C.; Bastini, K. Embracing multiple perspectives of sustainable development in a composite measure: The Multilevel Sustainable Development Index. J. Clean. Prod. 2020, 246, 118884. [Google Scholar] [CrossRef]
- Razmjoo, A.A.; Sumper, A.; Davarpanah, A. Development of sustainable energy indexes by the utilization of new indicators: A comparative study. Energy Rep. 2019, 5, 375–383. [Google Scholar] [CrossRef]


Disclaimer/Publisher’s Note: The statements, opinions and data contained in all publications are solely those of the individual author(s) and contributor(s) and not of MDPI and/or the editor(s). MDPI and/or the editor(s) disclaim responsibility for any injury to people or property resulting from any ideas, methods, instructions or products referred to in the content. |
© 2023 by the authors. Licensee MDPI, Basel, Switzerland. This article is an open access article distributed under the terms and conditions of the Creative Commons Attribution (CC BY) license (https://creativecommons.org/licenses/by/4.0/).