Abstract
The coordinated development of Beijing–Tianjin–Hebei (BTH) is a major regional strategy in China that aims to alleviate Beijing’s non-capital functions and address the “big city disease”. Understanding the spatial distribution and changing trends of industrial development in BTH is critical for achieving BTH’s coordinated development goals. In particular, it is important to assess the effectiveness of Beijing’s non-capital functions at the industrial level. This study utilized the 2013 and 2018 economic census data and statistical methods such as spatial Gini coefficient, trend analysis, specialization index, and industry similarity. We first characterized the industrial development pattern by analyzing the spatiotemporal changes of the operating income and the number of legal entities in BTH urban agglomeration. Then, we identified the changes in the leading industries and industrial structure of different cities in BTH urban agglomeration from 2013 to 2018. The results indicate that the coordinated development policy has influenced the industrial structure of the BTH urban agglomeration, with an 85.53% increase in the number of legal entities and a 14.61% increase in operating income. Beijing’s non-capital functions have achieved initial results, mainly involving technology-intensive and knowledge-intensive tertiary industries such as information technology, finance, and scientific research. The division of industry and the development positioning of the three regions are gradually becoming clear. Our results show how the economic census data and spatial analysis can support significant advances in evaluating industrial and economic development patterns, and they can be used worldwide in the future.
1. Introduction
During the process of urbanization and socioeconomic development of China, the sustainable development of cities has been negatively influenced due to excessive population agglomeration and serious industrial homogeneity, leading to greater regional development gaps, especially in developed cities and urban agglomerations [1,2,3]. As one of the regions with a higher development level in China, the BTH urban agglomeration is also facing the same development dilemma. Therefore, the term “BTH Coordinated Development” originated in 2015, when Beijing faced a major urban disease that could not be ignored during its development, and the development gap between Beijing, Tianjin, and Hebei gradually increased. The policy explains the ideas and key tasks for the coordinated development of BTH comprehensively and profoundly and points out the direction for the coordinated development of Beijing–Tianjin–Hebei. The Ministry of Industry and Information Technology, together with the people’s governments of Beijing, Tianjin, and Hebei Province, formulated the Beijing–Tianjin–Hebei Industry Transfer Guide [4] in 2017. The government of Beijing also issued the Catalogue of Prohibitions and Restrictions on New Industries in Beijing in 2014, 2015, and 2018, attempting to orderly dissolve Beijing’s non-capital functions. As the essential content and key support for the coordinated development of BTH, industrial integration is conducive to giving full play to the comparative advantages of various regions, guiding the orderly transfer and undertaking of industries, and gradually forming a rational spatial layout, as well as a scientific industrial chain of urban agglomeration. As the largest economic agglomeration in the north, the Beijing–Tianjin–Hebei region has achieved preliminary successes in terms of coordinated development, but the overall level is still lacking [5]. At present, these issues are the focus of attention in solving Beijing’s “big city disease” and are also the top priority in the realization of BTH’s coordination: What is the progress of non-capital function dissolution? What is the path of dissolution of different industries? What changes have taken place in the spatial pattern of the BTH industrial structure?
In recent years, a significant amount of research has been conducted on various aspects of regional economic development, industrial spatial patterns, and industrial transfer by scholars who have employed different data, methods, and perspectives, such as regional economic development [6,7,8,9], industrial spatial pattern [10,11,12], and industrial transfer [6,13,14] and its effectiveness [15,16,17]. Of particular interest is the spatiotemporal pattern of industrial transfer, which is an effective form of coordinated development of the region and a hot topic in the field [6]. The scale of research on the pattern of economic development [18,19], division of labor [18,19,20], and the evolution of industrial development [21,22,23] has ranged from the nation to urban agglomerations and regions [24]. Such studies have provided a reference for regional development strategies and industrial distribution countries. However, due to the limitation of traditional statistical data, there has been a lack of feasible data analysis related to the industrial structure, particularly at the regional scales of cities and districts. Scholars have used various quantitative measures, such as the Gini coefficient [25], industry concentration, specialization index, Herfindahl index [26], and E-G index [27], to examine industrial development changes and the spatial distribution of regional industries. The BTH urban agglomeration, as one of the major national development strategies, has been the subject of many studies by scholars who have measured the level of industrial coordination and identified driving factors such as innovation capacity [28,29,30] and technology proficiency [31,32,33], analyzed industrial evacuation paths [30] and mechanisms [34,35,36], and examined industrial transfer and undertaking, particularly in the manufacturing [37] and producer service industries [38,39,40]. Scholars have also evaluated the implementation and effectiveness of coordinated development in the BTH urban agglomeration [41,42,43].
Scholars have used various theoretical and empirical frameworks to analyze the spatiotemporal pattern of industrial transfer. Some of the notable contributions in this area include the following: Shi et al. conducted a categorization of industries from the perspective of industrial value chain and used an improved locational entropy index to conduct a time-series analysis of the urban industrial division of labor pattern in the Zhongyuan urban agglomeration and proposed the functional positioning of each city’s development [20]. Zhou conducted a study on spatial heterogeneity, urban cluster division of labor, and regional economic integration in the Yangtze River Delta city cluster [22]. Yu conducted a study on the industrial transfer of manufacturing industries in Beijing in the background of Beijing–Tianjin–Hebei’s coordinated development. It used a combination of quantitative and qualitative methods to analyze the industrial transfer process in this region [37]. This work reflects the effectiveness of coordinated development at industrial level in BTH urban agglomeration from the quantitative perspectives by calculating different indicators based on economic and industrial data. Moreover, these studies have greatly enriched our understanding of industrial development and changes in industrial structure. However, due to the deficiency of economic census data, insufficient research has been performed on industrial development patterns and industrial structure changes in various cities of the BTH urban agglomeration after coordinated development, especially after the 2015 planning outline. The economic census completed in 2018 provides a very reliable data source on a fine geographical scale for the analysis of the industrial structure since the introduction of BTH coordinated policy.
The economic census is one of the important references for studying and formulating national economic and social development plans, and the data provide an effective and unique perspective on industry development. The economic census data have been proved to highly correlate with industry development scale, structure, benefits, etc., including operating income, number of legal entities, number of employees, and other indicators. With the end of the fourth economic census, it is possible to obtain industrial development data under the coordination of BTH. However, the effectiveness of Beijing’s non-capital functions at the industrial level and the development of industrial division in BTH have not yet been clarified. Therefore, it is crucial to quantify the spatiotemporal pattern of industry development in the BTH urban agglomeration. In this paper, based on the data of the two economic censuses in 2013 and 2018, we first characterize the industrial development pattern by analyzing the spatiotemporal changes of operating income and number of legal entities in the BTH urban agglomeration. Then, we identify the changes of leading industries and industrial structure of different cities in the study area from 2013 to 2018.
2. Materials and Methods
2.1. Study Area
The BTH urban agglomeration (Figure 1) includes Beijing, Tianjin, and Hebei Province, including two municipalities and one provincial-level administrative region (eleven prefecture-level cities), covering an area of approximately 217,000 km2, accounting for 2.3% of China. At the end of 2018, its permanent population was 110 million, accounting for 8.1% of China, and its regional GDP was 8.5 trillion RMB, accounting for 9.4% of China.
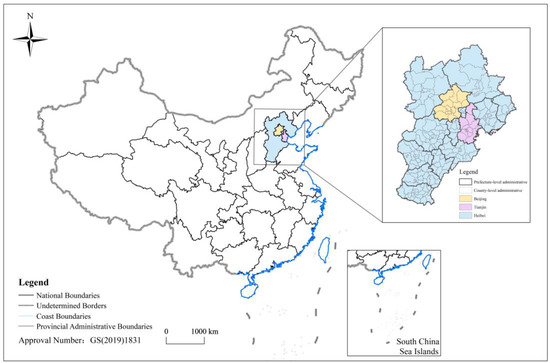
Figure 1.
Overview of the study area.
2.2. Data Source and Process
2.2.1. Data Source
The industry-related data of this research come from the economic censuses in 2013 and 2018. The objects of the economic censuses are all legal entities, industrial activity units, and self-employed households engaged in the secondary and tertiary industries in China.
2.2.2. Indicators and Industries
The economic census data include the operating income, the number of legal entities, and the number of employees in various industries (Table 1). Among them, the operating income refers to the income obtained by a company in its production and business activities as a result of selling goods and providing labor services. The data used in this study are district-level operating income (regardless of industry) which represent the industrial development of the region. The number of legal entities in districts and counties (regardless of industry) and the number of employees (by industry) are important data in the economic censuses, which are also the main market players in the census area, reflecting the city’s economic vitality and industrial development trends. Among them, the secondary industry refers to the mining industry (excluding mining auxiliary activities), manufacturing industry (excluding metal products, machinery, and equipment repair industry), electricity/heat/gas/water production and supply industry, and construction industry. The tertiary industry is the service industry, which refers to industries other than the primary industry and the secondary industry. According to the Classification of National Economic Industries (GB/T 4754-2017), the secondary and tertiary industries are classified in detail (Table 2). Among them, the scope of financial industry legal person units includes units supervised by the People’s Bank of China, China Banking Regulatory Commission, and China Securities Regulatory Commission, as well as the units engaged in the financial industry outside the scope of supervision.

Table 1.
Indicator description [44,45].
Table 2.
Industry codes [46].
2.3. Methodology
According to the analysis framework, this article uses the spatial Gini coefficient and trend analysis method to analyze the evolution of the industrial development pattern of the BTH urban agglomeration under the background of coordinated development. We use the specialization index and similarity coefficient to identify the leading industries in each city, with details as follows (Figure 2).
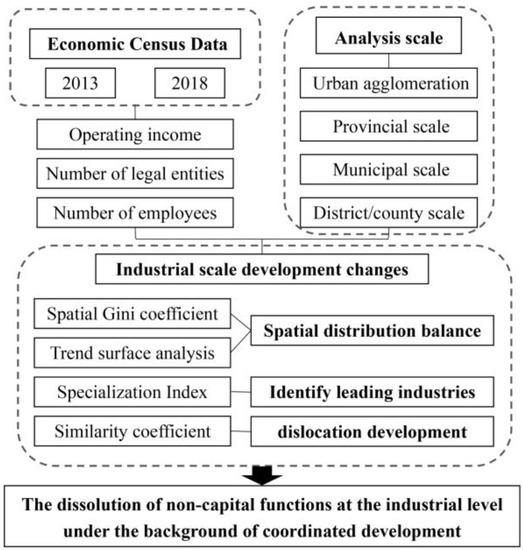
Figure 2.
Methodology flowchart.
2.3.1. Spatial Gini Coefficient
The spatial Gini coefficient was proposed by the American economist Krugman in 1991 [14]. It was originally used to measure the degree of agglomeration of American manufacturing industries [24,26] and has now been extended to various geographic factors. In this article, it is used to calculate the spatial distribution equilibrium degree of the number of legal person units at the municipality/prefecture level of the BTH urban agglomeration. The calculation formula is as follows [47]:
where M is the number of municipalities/prefecture-level cities in the BTH urban agglomeration; Pi is the proportion of the number of legal entities in the i-th municipality/prefecture-level city in the total number of legal entities in the BTH urban agglomeration; Gini is the spatial Gini coefficient; and C is the degree of distribution balance. Gini is between 0 and 1. The larger the value of Gini, the smaller C is, meaning that the geographic elements are concentrated in this area with unbalanced spatial distribution.
2.3.2. Trend Surface Analysis
The trend surface analysis is used to judge the spatial change trend of the number of legal person units in each district and county of the BTH urban agglomeration. The trend surface analysis is a statistical method based on mathematical analysis. It uses mathematical curved surfaces to simulate the spatial distribution and change trend of geographic system elements. In essence, it is based on the principle of regression analysis to fit a binary non-linear function by using the least squares method to simulate the spatial distribution of geographic elements and show the changing trend of geographic elements in the region. In the trend analysis graph, the two curves represent the fitting curves of geographic elements Z with longitude and latitude (the order setting can be selected according to situation, generally set to 2 or 3). In addition, the YOZ surface, XOZ surface, and XOY surface draw projections of spatial points. In this case, the influence of the trend gradually weakens from the center of the area to each boundary (the maximum value appears at the center of the area, and the minimum value appears near the boundary).
2.3.3. Specialization Index
The specialization index is used to quantitatively analyze the main economic functions of BTH cities. The calculation formula is as follows [26]:
where, Xij represents the number of employees of the j industry in city i, and Xj represents the number of employees of industry j in BTH. The numerator in the formula represents the proportion of employees in a certain industry in a prefecture-level city in BTH, and the denominator indicates the proportion of employees in this industry. In general, the greater specialization index Iij indicates greater professionalization of industry j in city i. According to the value of all kinds of industries in each city, the leading industry and future development direction of the city can be determined.
2.3.4. Similarity Coefficient
The similarity coefficient is used to measure the degree of convergence of industrial structure among the three regions in the BTH urban agglomeration. It aims to identify whether the industries in the three regions have gradually achieved dislocation development. The similarity coefficient is proposed by the International Industrial Research Center of the United Nations Industrial Development Organization. It is an indicator that is to measure the similarity of regional structure (industrial structure, employment structure, consumption structure, etc.). The calculation formula is as follows [24]:
where Sij is the industrial structure similarity coefficient; and Xik and Xjk are the number of employees of industry k in area i and area j, respectively. The value of Sij ranges from 0 to 1. The higher the similarity coefficient value, the higher the degree of similarity in industrial structure between different places. This article calculates the industrial similarity coefficients among Beijing, Tianjin, Hebei, and the BTH urban agglomeration, aiming to judge whether the dislocation development of industries in various regions is gradually being realized.
3. Results
3.1. Spatiotemporal Changes in the Number of Legal Entities
In terms of time change, the number of legal entities in the BTH urban agglomeration, including all the three places, has shown an upward trend from 2013 to 2018, with Hebei having the largest change. The number of legal entities increased from 0.44 million to 1.11 million from 2013 to 2018, with an increase of 162.05%. Since the policy of dissolving Beijing’s non-capital functions was proposed in 2015, industrial dissolution has been one of the key areas. Labor-intensive industries that are incompatible with the capital’s functions and other industrial manufacturing industries such as the Shougang Iron and Steel Industry have all been moved to surrounding cities. The number of legal entities in Tangshan has increased from 47,300 to 94,300, showing a substantial increase of 99.55%. The number of legal entities in Beijing and Tianjin also shows a certain degree of growth, with growth rates of 55.70% and 35.69% respectively.
In terms of spatial distribution, the number of legal entities in BTH urban agglomeration shows an unbalanced spatial structure of “center–periphery” as a whole (Figure 2). The number of legal entities in Beijing is relatively high, especially in the Haidian District and Chaoyang District, and decreases towards the periphery, with the two places as the center. From 2013 to 2018, the number of legal entities begins to gradually spread from the urban area of Beijing to the surrounding areas, and the number of legal entities in Shijiazhuang in the southwest of the urban agglomeration and Tangshan in the east increases significantly. According to the trend analysis of the changes in the number of legal person units, a comparative analysis in 2013 and 2018 is shown in Figure 3. It shows that the overall spatial distribution trend of the number of legal entities in the BTH urban agglomeration has not changed significantly from 2013 to 2018, with a trend of high in the middle and low in the surrounding area. However, the curve of the fitting curve of the number of legal person units is slightly flat from 2013 to 2018, indicating that, with the economic development of the agglomeration, the absolute value of the difference shows a shrinking trend in spite of some spatial differences in the number of legal person units.
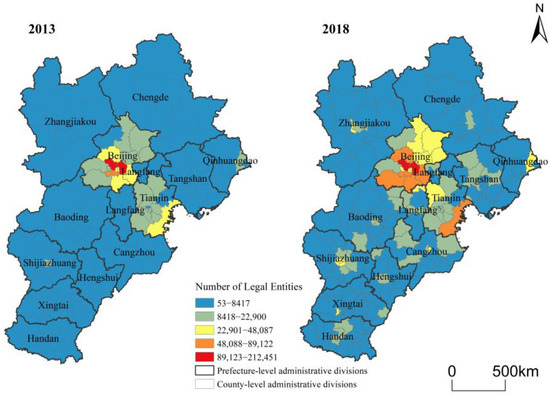
Figure 3.
Spatial distribution changes in the number of legal entities in counties in the BTH urban agglomeration.
The spatial Gini coefficient of the number of corporate units in the BTH urban agglomeration has shown an upward trend during 2013–2018, from 0.7 to 0.8. On the contrary, the degree of spatial equilibrium shows a downward trend, from 0.3 to 0.2. It also shows that the number of corporate units is gathering at the scale of urban agglomeration. The distribution difference between regions is becoming stronger.
3.2. Spatiotemporal Changes in Operating Income
Based on the operating income data of the counties in the two economic censuses, this article analyzes the spatial and temporal changes in the operating income of BTH urban agglomeration. Figure 4 shows the changes in operating income across the agglomeration in 2013 and 2018. For absolute value, the operating incomes of Beijing, Tianjin, and Tangshan belong to the high-value areas in the BTH urban agglomeration. However, as a prefecture-level city, Tangshan ranks first in regard to the operating income in Hebei Province, but there is still a big gap compared with Beijing and Tianjin. For changes in operating income, Qinhuangdao, Langfang, and Handan in Hebei Province have experienced higher growth rates, with operating income increases by 68.38%, 38.31% and 31.02%, respectively, compared with 2013. The operating income growth rates of Handan and Zhangjiakou were 31.02% and 26.47%, respectively, which were very similar to Beijing (29.38%). This shows that although the operating income base of these two cities is not large, the development trend in recent years has been good, closely following Beijing. Figure 4 clearly shows that although the operating income of most cities in the urban agglomeration shows an increasing trend, there are large differences between regions, especially between the municipalities directly under the central government and the prefecture-level cities.
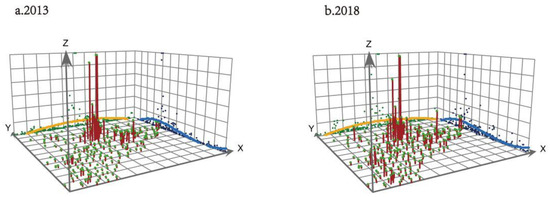
Figure 4.
Spatiotemporal changes in the number of legal entities in counties in the BTH urban agglomeration.
Figure 5 shows the changes in the spatial pattern of the operating income of the districts and counties in the BTH urban agglomeration. It shows that the spatial distribution pattern of operating income is generally consistent with the number of legal entities, both having a “center–peripheral” circle structure distribution, decreasing towards the surrounding areas, with Beijing as the high-value area of operating income. Among them, the operating income of Tianjin Binhai New Area is at the same level as Beijing’s Chaoyang and Haidian Districts.
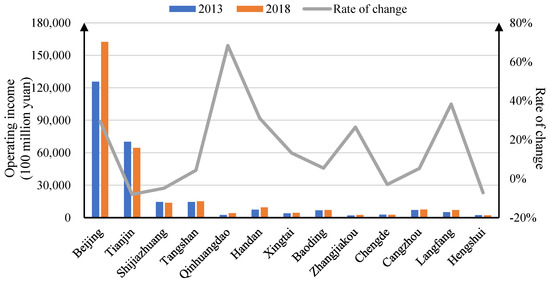
Figure 5.
Changes in operating income across BTH urban agglomeration in 2013 and 2018.
3.3. Spatiotemporal Changes of Industrial Structure
3.3.1. Practitioners Change
The evolution of the industrial structure and the change of the employment structure maintain a correlation in the process of economic development, and the coordination and interaction of the two is also an inevitable requirement for the optimization of the industrial structure and the effective promotion of employment [30,31,48].
Figure 6 shows the results of calculating the changes of employees in various industries in the BTH urban agglomeration and every city. It shows that, except for Tianjin and Chengde, the number of employees in other cities has shown an upward trend. In terms of the urban agglomeration, the number of employees has also shown an upward trend, increasing from 29.1 million in 2013 to 32.7 million in 2018, with a growth rate of 12.61%. In terms of different industries, the number of employees in the manufacturing industry far exceeds that of other industries, although the number of employees has shown a downward trend during 2013–2018, from 7.88 million in 2013 to 6.17 million, with a decrease of 21.80%. However, due to the large number of employees in the manufacturing industry, it still occupies a dominant position among the 19 industries in the urban agglomeration. At present, the BTH urban agglomeration is in the process of promoting the transformation and upgrading of the manufacturing industry and high-quality development. The decline in the number of employees is also a normal adjustment to adapt to the process of industrial upgrading. The number of employees in the construction industry, the wholesale and retail industry, and the leasing and business service industries also accounts for a huge proportion of the urban agglomeration.
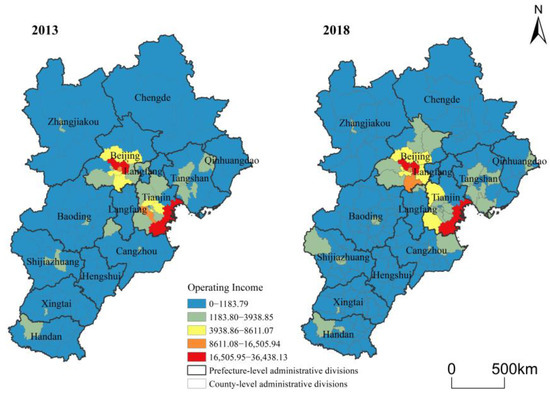
Figure 6.
Spatial distribution changes of county operating income in the BTH urban agglomeration.
The overall number of employees in Beijing has shown an upward trend, from 10.91 million to 13.4 million, with an increase of 22.84%. Among them, there are three declining industries, namely agriculture, forestry, animal husbandry, and fishery (−66.23%); mining (−48.04%); and manufacturing (−30.58%). The other 15 industries have shown increasing trends. Among them, the industries with a large increase in the number of employees are the financial industry (86.13%) and the scientific research and technical service industry (50.67%), also in line with Beijing’s functional positioning as the capital of technology innovation center. Some high-energy-consuming industries, non-technological-innovation-oriented industries, and technological-innovation-transformation-oriented industries, as well as high-end manufacturing industries that lack comparative advantages in production and processing links, need to move from Beijing to Tianjin and Hebei, including logistics bases, wholesale markets, call centers in the tertiary industry, service outsourcing, healthcare, etc. These industries gather a large number of employees and serve the entire region. They are labor-intensive industries and need to be transferred to the surrounding areas. The total number of employees in Tianjin has shown a downward trend as a whole, from 5.66 million to 4.91 million, with a decrease of −13.33%. Among them, the three most significant industries are agriculture, forestry, animal husbandry, and fishery (−75.38%); manufacturing (−46.67%); and residential services (−39.35%). The three industries with the most significant increases are financing (148.37%), leasing and business services (53.59%), and real estate (40.27%). The total number of employees in Hebei Province has shown an upward trend, from 12.49 million to 14.42 million, with an increase of 15.43%. The three industries with the most obvious decline are agriculture, forestry, animal husbandry, and fishery (−71.33%); mining (−27.93%); and manufacturing (−6.57%). Despite the downward trend, the number of employees in these three industries still accounts for a large proportion of the total number of employees in the province; the three industries with the most significant increase are the financial industry (186.88%), information technology service industry (135.23%), and leasing business service industry (83.15%).
Figure 7 shows the changes in the number of employees in different industries in each city of the BTH urban agglomeration from 2013 to 2018. As can be seen from the figure, the number of employees in agriculture, forestry, animal husbandry, fishery, mining, and manufacturing shows a downward trend in most cities and the urban agglomeration. Among them, Handan is a well-known coal and high-grade iron-ore-producing area, where the number of employees in the mining industry has shown an upward trend. The number of employees in Baoding’s water conservancy, environment and public facilities management, leasing and business services, and information technology services has increased significantly. As an important node city in the Baiyangdian Ecological Economic Zone and the advanced manufacturing industry along the Beijing–Guangzhou line, Baoding with Anxin, Xiongxian, Gaoyang, and Rongcheng as the supporting nodes, the unique advantages of the largest wetland in North China will be used to increase the construction of protected ecological forests in Beijing–Tianjin and promote the construction of Baoding·Zhongguancun Innovation Center, Jingjinbao Chuangye Innovation Street, and other projects. Thus, new economic growth points will be cultivated, gradually realizing the diversified development of industries. The number of employees in the wholesale and retail industry, information technology service industry, leasing business service industry, and public management in Langfang has increased significantly. The reason is that, since the beginning of the dissolution of Beijing’s non-capital functions in 2014, Langfang has had a geographical advantage in undertaking the transfer of industries from the capital and actively undertakes the spillover of functional elements such as Beijing’s industry, technology, and talent. The number of employees in the service industry and wholesale and retail industry of Cangzhou has shown an increase. Its Pearl Trade City and the characteristic town of the Pearl Apparel Industry will take over the clothing trading enterprises of Beijing Dahongmen and the Zoo Wholesale Market, for example. The practice of Cangzhou undertaking the relocation of industries from Beijing to Tianjin is also known as the “Cangzhou phenomenon”.
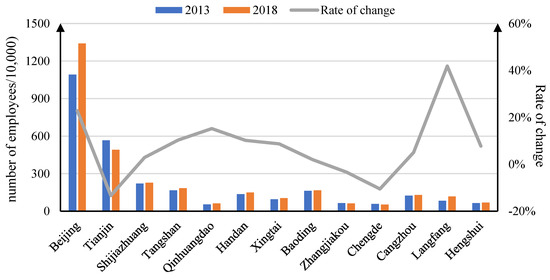
Figure 7.
Changes in the number of employees in the BTH urban agglomeration.
In general, the changes in employees in BTH from 2013 to 2018 show the following patterns (Figure 8): First, the number of employees in traditional industries such as agriculture, forestry, animal husbandry, and fishery, as well as manufacturing, has shown a downward trend, but due to the large number of employees in manufacturing, it still occupies a dominant position. Second, the number of employees in the tertiary industry, such as financial industry, scientific research and technical service industry, and information technology service industry, has increased significantly, especially in Beijing and Tianjin, also illustrating that the industrial structure of the BTH urban agglomeration is showing an optimization and upgrading trend.
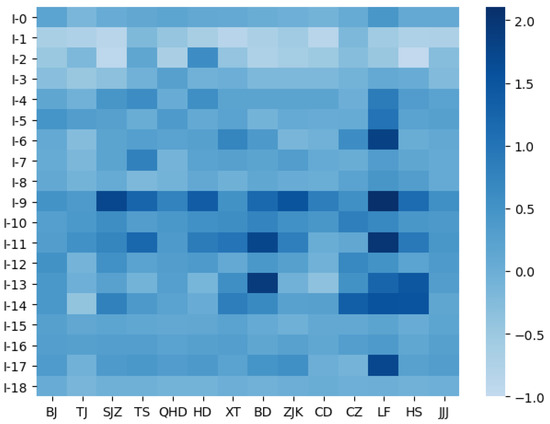
Figure 8.
Changes in the number of employees in the BTH urban agglomeration by industry in each region, from 2013 to 2018. BJ—Beijing; TJ—Tianjin; SJZ—Shijiazhuang; TS—Tangshan; QHD—Qinhuangdao; HD—Handan; XT—Xingtai; BD—Baiding; ZJK—Zhangjiakou; CD—Chengde; CZ—Cangzhou; LF—Langfang; HS—Hengshui; JJJ—BTH urban agglomeration.
3.3.2. Changes in Major Economic Functions
The specialization indexes of various industries in different regions were calculated, aiming to identify industries with high specialization indexes in BTH urban agglomeration in 2013 and 2018, and we analyzed the changes in the leading industries in various regions. It can be seen from Table 3 that, in 2013, the industries with a higher specialization index of Beijing employees were mainly concentrated in information technology, scientific research, culture, sports, and entertainment. In 2018, the industries with a higher specialization index were information technology, finance, and scientific research, all technology-intensive industries. Moreover, knowledge-intensive tertiary industries are also more in line with Beijing’s capital positioning as a “science and technology innovation center”. Some high-energy-consuming industries, non-technological-innovation enterprises, and technological-innovation-transformation enterprises, as well as high-end manufacturing industries that lack comparative advantages, are all non-capital functional enterprises, so these all need to be transferred.
Table 3.
The top three industries in 2013 and 2018 in the employment specialization index.
In 2013, the industries with higher specialization indexes in Tianjin were residential service, manufacturing, and construction. In 2018, they changed to construction, finance, and residential service industries. In terms of Hebei Province, the industries with higher specialization indexes changed from agriculture, forestry, animal husbandry, fishery, mining, and public management in 2013 to agriculture, forestry, animal husbandry, fishery, mining, and manufacturing in 2018. Beijing Hyundai’s fourth factory was settled in Cangzhou, Hebei Province, and started construction. Such policies as the promotion of the Zhongguancun Demonstration Zone, Yizhuang Development Zone and Tianjin–Hebei cooperation to jointly build big data corridors, Baoding Zhongguancun Innovation Center, and other science and technology parks accelerate the construction of a chain of cross-BTH science and technology innovation parks and promote the deep integration of the innovation chains, industrial chains, and capital chains, accelerating the continuous development of Hebei’s manufacturing industry.
3.3.3. Convergence and Change of Industrial Structure
The similarity coefficients and the industrial structure of the BTH urban agglomeration were calculated, aiming to analyze the changes in the industrial structure of Beijing, Tianjin, and Hebei. Table 4 shows that the industry similarity coefficient between Beijing and Tianjin had an upward trend during 2013–2018, and the similarity coefficient between Beijing and Hebei showed a downward trend. The functional positioning and industrial division of the two places have gradually become clear and certain. To a certain extent, it shows that during the third and fourth economic censuses, Beijing’s non-capital functions achieved initial results, and the positioning of the capital was constantly clear. The similarity coefficient between Tianjin and Hebei was relatively high, but it showed a downward trend during 2013–2018. Tianjin’s geographical location advantage and manufacturing base constantly clarify the functional positioning of “one base and three districts” in the context of coordinated development. Hebei Province, as a major heavy industry and manufacturing province in BTH, is also one of the important transfer places for the capital industry, and the industry similarity coefficients with Beijing and Tianjin show a downward trend.
Table 4.
Industry similarity coefficient by region of the BTH urban agglomeration in 2013 and 2018.
Under the premise of “coordinated development” and “resource sharing” in the BTH urban agglomeration, the development positioning of the three places is becoming more and more clear. According to their respective functional positioning, Beijing will gradually build a technological innovation center, Tianjin will gradually form a high-level modern manufacturing R&D and transformation base, Hebei will build a key industrial technology research and development base, and the three regions will gradually develop in the direction of mutual support and supplementation in industries. It also provides opportunities for the optimization of industrial structure and economic development of the BTH urban agglomeration.
4. Discussion
4.1. The Impact of Coordinated Development Policies on Industrial Structure
The introduction of relevant policies under the background of coordinated development has had a non-negligible impact on the changes in the industrial structure of the BTH urban agglomeration. At the same time, we also draw on relevant previous research to support our conclusions.
4.1.1. The Changes in the Number of Legal Entities
For the impact of coordinated development policies on changes in the number of legal entities, Hebei changed the most, with an increase of 162.05%. Industrial relocation has been one of the key areas since the policy of relieving Beijing’s non-capital functions was proposed in 2015, as well as labor-intensive industries that are inconsistent with the capital’s functions and other industrial manufacturing industries. Hebei has precisely built a key undertaking platform system aimed at accelerating the transfer of industries from Beijing and Tianjin. By the end of 2020, Hebei Province undertook the transfer of a total of more than 20,000 legal entities to Beijing and Tianjin [39]. Hao et al. found that the total number of legal entities transferred to Hebei from Beijing and Tianjin during the period 2016–2020 exceeds 24,000, and several major industrial projects have been landed and implemented [38], which is also consistent with our results. The steel industries of Shougang have all been relocated to some cities in Hebei. With land advantages and industrial foundation, Tangshan signed the “Framework Agreement on Jointly Building Caofeidian Cooperative Development Demonstration Zone” with Beijing in 2014. Tangshan is expected to use 100 km2 of land to jointly build an industrial park. Meanwhile, the Shougang Beijing–Hebei Cooperation Development Investment Fund will be set up to assist the transfer of the Shougang steel industry to Caofeidian [39]. Under the guidance of coordinated development and industrial transfer policies, the number of legal entities in Tangshan showed a substantial increase of 99.55%.
4.1.2. The Changes in the Operating Income
For the impact of coordinated development policies on changes in the operating income, the cities of Langfang, Handan, Zhangjiakou, and Qinhuangdao in Hebei Province all showed substantial growth, with a growth rate of over 20%. The study by Zhao et al. points out that the acceptance sites of enterprises moving out from Beijing and Tianjin in Hebei are mainly concentrated in the closer urban and rural fringe areas, such as Tangshan, Langfang, Cangzhou, Qinhuangdao, and other areas around Beijing, as well as areas with special geographical advantages or special resources, thus confirming our finding. Located between the two major central cities of Beijing and Tianjin, Langfang has a very important position in the undertaking of Beijing and the docking of the industrial development of Beijing and Tianjin. Qinhuangdao, strategically located in the center of the Bohai Rim Economic Zone, adheres to coastal development and boasts a good investment environment. Zhang et al. showed that, in the process of industrial restructuring in Beijing, some industries lacking comparative advantages, especially some mature traditional manufacturing industries such as the steel industry, have started to make a gradient shift, gradually moving the whole or part of the production chain to the surrounding areas of Hebei [35]. The operating income of the Tianjin Binhai New Area is at the same level as Beijing’s Chaoyang and Haidian Districts. Ever since being approved as a national-level free-trade pilot zone in 2014, the strategic positioning of Tianjin Binhai New Area has been to serve the coordinated development of the BTH agglomeration [29]. It became the first state-level new area in China with the regional GDP exceeding one trillion RMB. The implementation of the opening-up policy for industrial development has achieved remarkable results, and the economic development level has been relatively high.
4.1.3. The Changes in the Number of Employees in Different Industries
For the impact of coordinated development policies on changes in the number of employees in different industries, Langfang has a geographical advantage in undertaking industrial transfer in the capital, and it actively undertakes Beijing’s industry, technology, talents, and other functional elements. Moreover, the number of employees in wholesale and retail, information technology services, and leasing business services has increased significantly. The number of employees in the residential service industry and the wholesale and retail industry in Cangzhou has increased significantly due to the acquisition of Dahongmen, the Zoo Wholesale Market, and other clothing trading enterprises from Beijing. For Handan, which is a coal-mining area, the number of employees in its mining industry has shown an upward trend. The change of the industrial similarity coefficient shows that the relief of non-capital functions has achieved initial results, and the development orientation of Beijing, Tianjin, and Hebei is constantly clear. Zhang et al. compared the location quotient of industrial subsectors in Beijing, Tianjin, and Hebei. They found that the advantageous industries in Beijing are concentrated in the life service industry and technology and capital-intensive modern manufacturing industry; the advantageous industries in Tianjin are equipment manufacturing and modern manufacturing industries; and the advantageous industries in Hebei are mainly resource-processing and labor-intensive industries [36]. Beijing is gradually forming a highly precise industrial structure through the deconstruction of non-capital functions [39]. These are also more consistent with the results of the specialization index calculated in this study.
4.2. Shortcomings and Prospects
Although this paper has carried out a relatively detailed and in-depth analysis on the basis of the existing data, we believe that there are still the following limitations: First, the analysis scale is not precise enough. The smallest statistical unit of each indicator in the National Economic Census is at the district or county scale. Therefore, the analysis based on the Economic Census data can only focus on the district or county level, and the spatial granularity is not fine enough, so the accuracy of identifying the location of the problem is insufficient. For example, the industrial similarity coefficients of Beijing and Tianjin showed an upward trend from 2013 to 2018. This conclusion may be misleading. In fact, Beijing and Tianjin are gradually realizing dislocation development from a more refined industry division. However, since it is limited by the smallest statistical unit and industry subdivision of employee data in the Economic Census, we cannot obtain more precise changes in the similarity coefficients of Beijing and Tianjin. Therefore, this conclusion based on the industry classification of the economic census data is not consistent with the conventional thinking. With the emergence of additional open social data and spatial data such as POI data, corporate spatial data, etc., regional economic development research is going through an era of big data. They not only provide detailed information about socioeconomic activities but also form a foundation for large-scale applications of industrial development and changes at a relatively fine resolution. Second, the empirical analysis of industrial structure change and its influencing factors is not deep enough. Several factors, such as economic development, functional positioning, market demand, infrastructural security, and government willingness, have influenced the change of industrial structure in urban agglomerations. Due to the limitation of data acquisition, this paper did not explore the influencing factors of industrial structure change in BTH urban agglomeration in depth; therefore, this is one of the directions to carry out in-depth research in the future. Last but not least, the industrial development of new areas in the BTH urban agglomeration, such as the Beijing Economic-Technological Development Area, Xiong’an New Area, and Tianjin Binhai New Area, is also worthy of attention. In the future, on the basis of available data, an in-depth analysis of the industrial development of the new district and its impact on changes in the industrial structure of urban agglomerations can be conducted. Additional efforts to explore the above limitations are required.
4.3. Policy Suggestions for the Coordinated Development of Industries in the BTH Urban Agglomeration in the Future
Compared with the third national economic census, the changes in the number of legal entities, operating income, and employees in the fourth census not only reflect the development of China’s economy and industry but also the result of optimizing the business environment. From 2013 to 2018, the planning and policy system at the national level has been increasingly improved. In particular, a number of policies have been issued, such as the BTH Coordinated Development Planning Outline and the BTH Coordinated Development Industrial Upgrade and Transfer Plan. These also provide an action guide for BTH industrial transfer.
To achieve a higher level of coordinated development in the future, cities in BTH would give full play to their comparative advantages, carry out specialized division of labor, perform their respective duties, and achieve dislocation development in the future. Beijing should continue to clarify the capital positioning of the four major centers and give play to the radiating and leading role of the central city. Tianjin should make full use of its port advantages and manufacturing bases and focus on developing coastal industries, advanced manufacturing industries, and productive services. While undertaking the transfer of manufacturing from Beijing and Tianjin, Hebei should give full play to its advantages in land, labor, and resources; focus on optimizing the industrial structure; and build a modern industrial development system with its own characteristics. Last but not least, the BTH urban agglomeration should strengthen the connections of multiple factors, pay attention to dislocation development, and achieve coordinated development under the idea of one game of chess [29] in the three regions.
5. Conclusions
The conclusions of this study are summarized as follows. The results show that the coordinated development policy does have an impact on the change of industrial structure in the BTH urban agglomeration. The coordinated development level of the BTH urban agglomeration at the industrial level has continued to improve. Beijing’s non-capital functions at the industrial level have achieved initial results. Firstly, the number of legal entities and the operating income of BTH urban agglomeration show an overall upward trend, having increased by 85.5% and 14.61% from 2013 to 2018, respectively. Secondly, although the number of employees has increased by 12.61% from 2013 to 2018; the number of employees in the traditional industries, such as agriculture, forestry, animal husbandry and fishery, and manufacturing, has shown a clear downward trend. Finally, the changes in the specialization index and industry similarity coefficients show that the division of industry and the development positioning of three regions are gradually clear.
Author Contributions
Conceptualization, R.L., H.W. and X.N.; data curation, R.L., X.C. and X.Z.; formal analysis, R.L. and H.W.; methodology, R.L.; project administration, H.W. and X.N.; resources, R.L., H.W. and X.C.; software, R.L. and X.Z.; supervision, H.W. and X.N.; validation, R.L. and X.C.; visualization, R.L.; writing—original draft, R.L.; writing—review and editing, H.W. and X.N. All authors have read and agreed to the published version of the manuscript.
Funding
This research was funded by the Fundamental Scientifific Research Funds for Central Public Welfare Research Institutes (AR2304), the Fourth National Economic Census Project of the National Bureau of Statistics (JJPCZB18), and the Natural Resources Planning and Management Project (A2315, A2316).
Institutional Review Board Statement
Not applicable.
Informed Consent Statement
Not applicable.
Data Availability Statement
The third and fourth economic census data used in the manuscript can be downloaded and used by the public on the website of the National Bureau of Statistics. For details, see http://www.stats.gov.cn/tjsj/pcsj/jjpc/4jp/zk/indexce.html, accessed on 5 September 2020.
Acknowledgments
We would like to thank the National Bureau of Statistics of China for providing economic census data.
Conflicts of Interest
The authors declare no conflict of interest.
References
- Bao, W.; Yang, Y.; Zou, L. How to reconcile land use conflicts in mega urban agglomeration? A scenario-based study in the Beijing-Tianjin-Hebei region, China. J. Environ. Manag. 2021, 296, 113168. [Google Scholar] [CrossRef] [PubMed]
- Da, Z.; Huang, Q.; He, C.; Yin, D.; Liu, Z. Planning urban landscape to maintain key ecosystem services in a rapidly urbanizing area: A scenario analysis in the Beijing-Tianjin-Hebei urban agglomeration, China. Ecol. Indic. 2018, 96, 559–571. [Google Scholar] [CrossRef]
- Yang, Y.; Wu, J.; Wang, Y.; Huang, Q.; He, C. Quantifying spatio-temporal patterns of shrinking cities in-urbanizing China: A novel approach based on time-series nighttime light data. Cities 2021, 118, 103346. [Google Scholar] [CrossRef]
- Beijing Municipal People’s Government; Tianjin Municipal People’s Government; Hebei Provincial People’s Government; National Ministry of Industry and Information Technology. Beijing-Tianjin-Hebei Industry Transfer Guide. 2016. Available online: http://www.mofcom.gov.cn/article/b/g/201608/20160801384086.shtml (accessed on 11 August 2020).
- Zhang, X.; Wang, H.; Ning, X.; Zhang, X.; Liu, R. Identification of Metropolitan Area Boundaries Based on Comprehensive Spatial Linkages of Cities: A Case Study of the Beijing–Tianjin–Hebei Region. ISPRS Int. J. Geo-Inf. 2022, 11, 396. [Google Scholar] [CrossRef]
- Liu, X.; Wu, K. Change of industrial investment networks in the central core area of the Beijing-Tianjin-Hebei region under the background of non-capital function dispersal. Prog. Geogr. 2020, 39, 1972–1984. [Google Scholar] [CrossRef]
- Zhang, W.; Shen, Y. The Spatial Characteristics of Producer Service Agglomeration in Beijing-Tianjin-Hebei Metropolitan Region. Prog. Geogr. 2012, 31, 742–749. [Google Scholar]
- Wang, X. The Spatial Characteristics of Producer Service Agglomeration in Beijing-Tianjin-Hebei Metropolitan Region. Lead. Companion 2016, 9, 62–67. [Google Scholar] [CrossRef]
- Liu, A.; Zhang, Y.; Jiang, L.; Liu, W. Industrial Relocation and Structural Optimization of Manufacturing Sectors in Beijing, Tianjin and Hebei: From a Perspective of Imperfect Competition. J. Chongqing Univ. (Soc. Sci.) 2013, 19, 1–7. [Google Scholar] [CrossRef]
- He, C.; Liu, Z.; Wang, L. Economic Transition and Convergence of Regional Industrial Structure in China. Acta Geogr. Sin. 2008, 63, 807–819. [Google Scholar]
- Liu, H.; Fan, J.; Zhou, D.; Zhang, H. The Evolution of Spatial Distribution and Its Influencing Factors of High-Energy Intensive Industry in China since 2000. Econ. Geogr. 2019, 39, 110–118. [Google Scholar]
- Liu, H. Research on the Measurement of the Status of Beijing’s Division of Labor—Based on the Perspective of the Upstream Degree of the Industry. Mod. Ind. Econ. 2013, 75, 45–52. [Google Scholar]
- Peri, G. Determinants of Knowledge Flows and Their Effect on Innovation. Rev. Econ. Stat. 2005, 87, 308–322. [Google Scholar] [CrossRef]
- Krugman, P. Increasing returns and economic geography. J. Political Econ. 1991, 99, 483–499. [Google Scholar] [CrossRef]
- Ellison, G.; Glaeser, E. Geographic Concentration in U.S. Manufacturing Industries: A Dartboard Approach. Natl. Bur. Econ. Res. 1997, 94, 1–41. [Google Scholar] [CrossRef]
- Huang, S.; Wang, Y.; Zhang, K. The Transfer of Manufacturing Industry among Eight Regions in China—Based on the Idea of Shift-Share Analysis. Econ. Geogr. 2013, 33, 90–96. [Google Scholar] [CrossRef]
- John, H. The Paradigm of International Production: Past, Present and Future. J. Int. Bus. Stud. 1988, 8, 173–190. [Google Scholar]
- He, C.; Zhu, S. The principle of relatedness in China’s regional industrial development. Acta Geogr. Sin. 2020, 75, 2684–2698. [Google Scholar]
- Wang, Z.; Wang, X. A Study on the Influence of Urbanization to the Transformation of Industrial Structure in Agglomerations of Sichuan-Chongqing Region—Based on the Comparison with the Three Major Metropolitan Agglomerations: Beijing-Tianjin-Hebei, Yangtze River Delta and Pearl River Delta. Northwest Popul. J. 2021, 42, 1–11. Available online: https://kns.cnki.net/kcms/detail/62.1019.C.20210318.1550.002.html (accessed on 11 December 2020).
- Shi, Y.; Huang, J. Evolution of Industrial Specialization Pattern in Zhongyuan Urban Agglomeration and Its Functional Orientation. Econ. Geogr. 2017, 37, 84–91. [Google Scholar]
- Yan, M.; Ma, X.; Luo, C. Comparative Study of the Division of Labor and Its Complementary in the Coastal Megalopolis of China. Econ. Geogr. 2016, 36, 69–74. [Google Scholar]
- Zhou, T. Spatial Heterogeneity, Division of Urban Agglomeration and Regional Economic Integration: Evidence from Urban Agglomeration in Yangtze River Delta. Urban Dev. Stud. 2017, 24, 57–63. [Google Scholar]
- Li, B.; Jin, Q.; Yang, L.; Chen, W.; Ye, Y. Spatial Planning of Industrial Division and Cooperation in Pan-Pearl River Delta. Trop. Geogr. 2007, 4, 337–342. [Google Scholar]
- Li, Z.; Yang, Y.; Liu, Y. Researches on the Industrial Division of Cities at Prefecture Level in Northwestern China. Areal Res. Dev. 2010, 29, 65–71. [Google Scholar]
- Okubo, T.; Tomiura, E. Industrial relocation policy, productivity and heterogeneous plants: Evidence from Japan. Reg. Sci. Urban Econ. 2012, 42, 230–239. [Google Scholar] [CrossRef]
- Guan, A.; Chen, R. General Study on Methods in Evaluating the Industrial Agglomeration Level in a region. J. Ind. Technol. Econ. 2014, 33, 150–155. [Google Scholar] [CrossRef]
- Hill, E.; Brennan, J. A Methodology for Identifying the Drivers of Industrial Clusters: The Foundation of Regional Competitive Advantage. Econ. Dev. Q. 2000, 14, 65–96. [Google Scholar] [CrossRef]
- Cowan, R.; Jonard, N.; Zimmermann, J.B. Bilateral Collaboration and the Emergence of Innovation Networks. Manag. Sci. 2007, 53, 1051–1067. [Google Scholar] [CrossRef]
- Cui, Z. Research on the Industry Coordinated Development of Beijing-Tianjin-Hebei during the 14th Five-Year Plan Period. City 2021, 3, 3–13. [Google Scholar]
- Yang, Y.; Wu, H.; Jin, T. Research on the Level Measurement and Realization Path of Industrial Coordinated Development in Beijing-Tianjin-Hebei. Econ. Res. Guide 2021, 20, 15–21. [Google Scholar]
- Yang, D.; Ren, K.; Qin, Q. Research on the Driving Factors of Industrial Coordination of Beijing-Tianjin-Hebei. Macroecon. Manag. 2022, 1, 52–67. [Google Scholar] [CrossRef]
- Ren, A.; Liu, L.; Liu, J. Synergistic Development or Siphon Effect: “Dynamic” Multidimensional Evaluation from Jing-Jin-Ji Region. Reform Econ. Syst. 2022, 1, 59–66. [Google Scholar]
- Fei, M. Analysis of the Progress and Trends of Industrial Coordination between Beijing-Tianjin-Hebei Based on Big Data. China Econ. 2022, 9, 117–119. [Google Scholar]
- Sun, W.; Mao, L.; Tang, Z. Research on the Non-capital Function Decentralization Sequence Based on the Sensitivity Model. Geogr. Res. 2016, 35, 1819–1830. [Google Scholar] [CrossRef]
- Zhao, C.; Liu, D.; Wang, Y. Research on the impact path and effect of industrial relief on Beijing-Tianjin-Hebei Coordinated Development. Rev. Econ. Manag. 2022, 38, 53–66. [Google Scholar] [CrossRef]
- Zhang, G.; Wang, S.; Liu, S.; Jia, S. Study on Co-ordination between Beijing-Tianjin-Hebei Based on Industry Matching and Transfer. Econ. Manag. 2014, 28, 14–20. [Google Scholar]
- Yu, Q. Research on Industrial Transfer of Beijing’s Manufacturing Industry under the Background of Beijing-Tianjin-Hebei Coordinated Development—The Study from the Perspective of Location Entropy. China Bus. Mark. 2021, 35, 70–78. [Google Scholar] [CrossRef]
- Hao, K.; Xing, Y. Research on the Transfer of Industries to Beijing-Tianjin-Hebei Based on Big Data. China Price 2022, 6, 20–23. [Google Scholar]
- Liu, T.; Wang, L. The Important Progress and Problems Solving of the Industrial Transfer in Beijing-Tianjin-Hebei Region. Reg. Econ. Rev. 2022, 1, 117–123. [Google Scholar] [CrossRef]
- Yang, D.; Ren, K.; Yuan, G. Research on the Characteristics and Effects of Beijing-Tianjin-Hebei Industrial Transfer Based on the Perspective of Collaboration. China Price 2021, 2, 35–39. [Google Scholar]
- An, S.; Dong, H. The Policy Mid-term Effect Evaluation of Beijing-Tianjin-Hebei Coordinated Development Strategy. Econ. Probl. 2022, 4, 1–9. [Google Scholar]
- Wu, Z.; Han, Z.; Zhao, L.; Tian, Z. Research Situation and Hotspot Analysis of Coordinated Development of the Beijing-Tianjin-Hebei region. Econ. Manag. 2021, 35, 3. [Google Scholar]
- Lu, X.; Liu, Q.; Xu, S. Research on the Spatial Linkage Effect of Industrial Transformation and Upgrading in Beijing-Tianjin-Hebei. J. Stat. Inf. 2021, 36, 52–63. [Google Scholar]
- Office of the Leading Group of the Third National Economic Census of the State Council. China Economic Census Yearbook 2013; China Statistic Press: Beijing, China, 2015. Available online: http://www.stats.gov.cn/tjsj/pcsj/jjpc/3jp/indexch.htm (accessed on 15 August 2020).
- Office of the Leading Group of the Fourth National Economic Census of the State Council. China Economic Census Yearbook 2018; China Statistic Press: Beijing, China, 2020. Available online: http://www.stats.gov.cn/tjsj/pcsj/jjpc/4jp/indexch.htm (accessed on 15 August 2020).
- National Bureau of Statistics of China, Classification of National Economic Industries (GB/T 4754-2017). 2017. Available online: http://stats.gov.cn/xxgk/tjbz/gjtjbz/201710/t20171017_1758922.html (accessed on 19 December 2020).
- Jekl, J.; Jánský, J. Security Challenges and Economic-Geographical Metrics for Analyzing Safety to Achieve Sustainable Protection. Sustainability 2022, 14, 15161. [Google Scholar] [CrossRef]
- Yu, B.; Cong, Y. A Study of the Interactive Mechanism of Industrial Structure and Employment Structure under the Vision of BTH Coordinated Development. Contemp. Econ. Manag. 2020, 42, 59–65. [Google Scholar] [CrossRef]
Disclaimer/Publisher’s Note: The statements, opinions and data contained in all publications are solely those of the individual author(s) and contributor(s) and not of MDPI and/or the editor(s). MDPI and/or the editor(s) disclaim responsibility for any injury to people or property resulting from any ideas, methods, instructions or products referred to in the content. |
© 2023 by the authors. Licensee MDPI, Basel, Switzerland. This article is an open access article distributed under the terms and conditions of the Creative Commons Attribution (CC BY) license (https://creativecommons.org/licenses/by/4.0/).