Abstract
It is necessary to harmonize the needs of society in terms of agricultural production and land protection from various forms of degradation throughout sustainable land management. Assessing the justification of investment in sustainable management of land resources is an important step in this process. Consequently, an analysis of soil erosion risk was carried out in the suburban area of the morphological unit of the Barička river watershed, using the Revised Universal Soil Loss Equation (RUSLE) method, with the existing and projected structure of agricultural production according to the Future Agricultural Production Structure Model from the Aspect of Preserving Land Resources for Mountain Catchment Areas of Serbia (FAPSMS). The value of the existing and projected production structure from an economic aspect was also examined using dynamic economic methods. In order to assess the risk and uncertainty of investments, a sensitive analysis of dynamic methods was carried out. The results show that soil erosion losses are already below tolerance values with the existing production structure and that they could be reduced even more by applying the designed structure. Economic indicators show that the investment is justified and that it is more sensitive to changes in income.
1. Introduction
Soil resources are unevenly distributed in different biomes and geographical regions [1]. Areas with highly productive soils in favorable climates are limited due to high population density and are already under crops, pastures, forests and energy plantations. Soil is the basis of any agricultural production, but the area of arable soil per capita is constantly decreasing. One third of the world’s arable soil has been lost in the last 40 years, mainly due to erosion and pollution [2]. In order to enable the production of healthy and safe food for an increasingly large population, which is one of the biggest challenges today, it is necessary to ensure and preserve soil fertility [3]. Apart from this basic one, other numerous roles, functions and ecosystem services provided by soil are known today, such as water storage and filtration, biodiversity preservation, carbon sequestration and storage, adaptation and mitigation of climate change, which are either limited or stimulated by human activities [4] (Günal et al., 2015). Water erosion is one of the main contributors to desertification, loss of organic matter, biodiversity, and flooding, while also affecting other factors [5]. Erosion control is one of the most prominent options for the mitigation of agriculture emissions [6].
On the other hand, the risk of degradation of both soil and the environment increases year by year, which has significant negative effects on the provision of its ecosystem services and functions. In addition, most soils are prone to degradation due to misuse and poor management. Anthropogenic impacts that lead to soil degradation are most often caused by greed, short-sightedness and poor planning motivated by quick economic profit, in the case of large agricultural companies, but also by the poverty and helplessness of small farmers. Some agricultural practices that are beneficial for individuals can cause soil erosion, carbon emissions, biodiversity loss, and can have many other negative ecological effects on local and global scales [7]; meanwhile, conservational agricultural techniques are often overlooked, even though they are beneficial from both the environmental and economic point of view [8]. In this sense, environmental awareness is of great importance, along with the maintenance of a certain socio-economic level of the rural population that enables the continuous application of sustainable soil management measures [4]. Exploring long-term socioeconomic environmental paths validates the benefits of sustainable management approaches in dealing with the predicted market and environmental challenges caused by soil erosion [9].
Soil erosion is a critical environmental problem that inflicts multiple, serious damages in managed ecosystems such as crops, pastures, or forests, as well as in natural ecosystems [10]. Upland soil erosion leads to a great number of on-site and off-site problems [11]. The intensification of erosion processes leads to loss of fertility due to the removal of the most fertile soil particles, as well as many other negative effects on soil functions [12], as it is one of the dominant forms of soil degradation, especially in developing countries. Sun and Huang (2022) also used the particle discrete element method (PDEM) to simulate geo-materials, such as rock and soil, and to obtain stress and strain to improve the solving of such a problem [13]. Soil degradation is one of the most severe socioeconomic and environmental problems threatening our survival and well-being, mainly when it comes to food security and safety [14]. Over time, this leads to the devastation of the environment as a whole, and from an economic point of view, it results in a decrease in yields, and thus in farm income in the long term.
In order to fully unlock soil potentials, it is necessary to turn to sustainable soil management systems. Sustainable soil management is the “correct” way of using soil. The development of modern society is focused on sustainability, which was defined by the Brutland Commission as “meeting current human needs without compromising the needs of future generations” [15]. Bearing in mind that the global population has increased by almost three billion people since the Brutland Commission, and that number is continuously growing, it is clear that respecting this principle today represents a much greater challenge. On the other hand, a large amount of research, as well as many other advantages of the modern world have created the conditions to approach this challenge strategically, systematically, planned to be economically profitable at all levels, from local to global [16]. The international scientific community defined the principles and goals of sustainable development (SDG) that were adopted by all member states of the United Nations [17], from which numerous strategies, policies and recommendations arose. The Goal 15 of SDGs, “Life on Earth,” unequivocally positions soil conservation as a resource among the leading global priorities when it comes to sustainability. The environment and soil, which is its basic element, represent the basis of life on earth and are recognized as such within the framework of other SDGs.
Today, various models of sustainable soil management are being applied in the world. They are aimed at adequate activities in preventing the destruction by erosion of the soil through adequate processing methods, with appropriate yields and positive economic effects of such production [18]. For example, many structural and vegetative soil conservation measures such as terraces, stone bunds, soil bunds, herbaceous or woody plants used as reinforcement are proven to be effective as erosion control measures if used properly [19]. The importance of implementing a comprehensive soil conservation management plan to reduce soil losses due to water erosion should also be emphasized [20]. Conservation of soil on sloped terrains is of great importance, especially having in mind that mountain soils are home to 25% of all terrestrial biodiversity, including agrobiodiversity [21]. Sustainable agricultural management needs to account for site specific characteristics, including topographic factors and coexisting biotopes [22].
Soil erosion is very widespread in Serbia. More than 86% of Serbia’s surface is affected by erosion of different intensities. The soil erosion endangerment of the research area of the Barička rivndengerment er basin—determined using Gavrilović’s erosion potential method, which is successfully applied in our region [23]—showed that the erosion potential coefficient has values between Z = 0.25 and Z = 0.65, with the mean value of Zmn = 0.56, which places it in the III category (medium erosion) of endangerment [24]. It depends on a large number of physical-geographical and anthropogenic factors. Some primary factors that have the greatest influence are shown, such as: relief, climate, geological composition, vegetation cover, soil use and management [25]. Erosion processes in Serbia became more intense during the middle of the twentieth century, when the industrialization and development of the country’s economy took place. Agriculture and animal husbandry in rural areas were intensified, as was the process of urbanization along with an increase in the number of inhabitants. The trend of people leaving rural households and moving to cities increased during the second half of the twentieth century until today. That led to a change in soil use so that the areas under meadows, orchards and vineyards were increased at the expense of areas under arable soils and pastures [25]. As a final result, the intensity of erosion processes in rural areas of Serbia has decreased. Unfortunately, no matter how beneficial it is from the aspect of soil conservation, it is not a consequence of strategical, planned and sustainable soil management. This shows the lack of awareness of the importance of soil as a primary natural resource, as well as the lack of an adequate soil preservation strategy [18]. Therefore, the identification of processes, practices and policies for sustainable soil management is more important now than ever before [1].
The sustainable management of soil resources should be the goal of every country in the world; in the Republic of Serbia, specifically, legislation covers a large number of aspects of the conservation of soil as a resource. In addition to the application of the law, it is also necessary to provide incentives for the implementation of “good” practices that are in accordance with the strategies, guidelines and criteria prescribed by the international scientific community. The National Rural Development Program of the Republic of Serbia for the period 2022–2024 foresees economic incentives for the implementation of measures that contribute to the achievement of the goals defined by the program. The program envisages financial support from the IPARD (Instrument for Pre-Accession in Rural Development) program, and also from the local self-government support programs for sustainable soil use in agriculture and forestry, which include anti-erosion measures, among others [26]. These incentives are extremely important since the economic factor is the one that decisively influences the decision-making on the way soil is used, from the point of view of agricultural producers. The cost of taking action against land degradation is much lower than the cost of inaction, which should be a strong incentive for taking action against land degradation [27]. The profitability of sustainable systems is the first prerequisite for their implementation. In this regard, it is necessary to conduct as many research and case studies as possible, from an economic point of view, at every level—locally, regionally and globally—in order to spread awareness and promote these systems, which will potentially result in their wider application. Moreover, economic well-being leads to decisions correctly in favor of conserving landscapes [28].
The aim of this study is to determine the ecological, i.e., the change in soil erosion risk, and the economic effects of the application of the future production structure model, and to evaluate the justification of investments in anti-erosion works based on economic parameters and the possibility of making a profit from these works in the area of the morphological unit of the Barička river in Serbia.
2. Materials and Methods
2.1. Study Area
The Barička river watershed is located on the territory of Belgrade, Republic of Serbia, at the south of the municipality of Čukarica and north-east of the municipality of Obrenovac (44.648516, 20.344199) (Figure 1). The study area (morphological unit) was established with nine plots, eight of which were positioned within the watershed, while one plot was outside the watershed. The plots were established according to the erosion predisposition factors, land cover and hydrological factors in order to analyze it with ease and precision [24] (Figure 1).
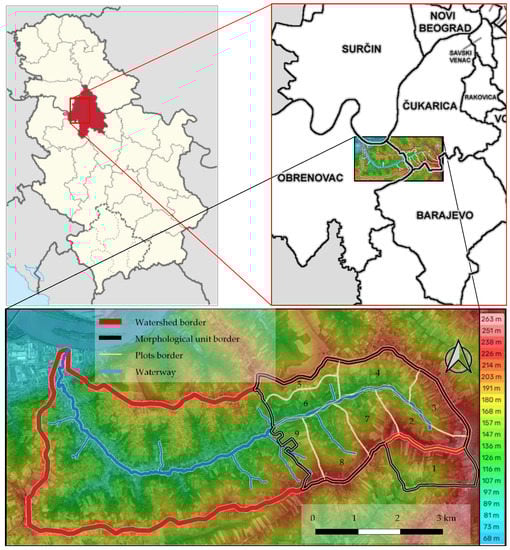
Figure 1.
Location of the Barička river watershed and the morphological unit with plot numbers and the elevation map [29,30].
The area of the watershed is 26.96 km2, and the area of the morphological unit is 11.28 km2. The length of the Barička river is 12.90 km, of which 4.53 km passes through the studied area. The area can be characterized as hilly, with the lowest point of the morphological unit at 114 m above sea level (ASL), and the highest at 257 m ASL, while the mean altitude is 180.21 m ASL. The medium altitude difference is 66.21 m, while the mean slope of terrain is 10.06%.
The morphological unit should be marked as an erosion prone area because of sediment production and the danger of landslides; it should be managed accordingly. According to the geological map (https://geoliss.mre.gov.rs/karte/geo300.html (accessed on 15 January 2023)), the morphological unit of the Barička river is composed of complex lake sediments. There are two types of these heterogeneous deposits: the first series of river and river-lake deposits is represented with gravelly and sandy sediments; the second series is made of clay and sand which belong to lake environments. Overall, only sedimentary rocks, specifically fine to coarse grained clastic rocks and carbonaceous rocks can be found on the site. From the aspect of pedology, the most common types of soil in the study area are Eutric Cambisols and Vertisols [31].
Given that the study area is located on the territory of Belgrade, climate characteristics for the Belgrade area were regarded for the period 1991–2015. In short, Belgrade has a temperate continental climate with four distinct seasons. January is the coldest month, with an average temperature −0.7 °C, while the mean annual temperature is 13.2 °C. Spring is short and rainy, and summer is fast approaching. Autumn is longer than spring, with longer sunny and warm periods, while winter is not so harsh. The mean relative air humidity is 69.5%, while the mean annual precipitation is 710.79 mm; May and June are the months with most rainfall [32].
2.2. Data
Data used for the definition of parameters that have been used in the RUSLE model and tolerable values of mean annual soil loss were obtained from meteorology year books of the Republic Hydrometeorological Service of Serbia for a Belgrade-Observatory meteorological station, for the period 1991–2015, and study of [24]:
- -
- geographic location and area;
- -
- number of plots that make up research area;
- -
- values of soil erodibility factor;
- -
- plots slope rate and length;
- -
- vegetation cover and active anti-erosion measures; and
- -
- soil depth.
The discount rate was obtained from the official reports of the discount rate, provided by the World bank, for Serbia and Eastern Europe countries, for the objective period [33].
Data on the detailed structure of current agricultural production in the research area was obtained from the statistical report from the RZS webpage [34].
All necessary cost values were taken from the Ministry of Agriculture of Serbia’s official website for the costs of agricultural goods [35].
2.3. Soil Erosion Assessment
The Revised Universal Soil Loss Equation (RUSLE) method was used to quantify the erosion processes [36,37,38,39] by obtaining the mean annual soil losses due to erosion per unit area (Equation (1)).
A—average annual soil loss (t ha−1 year−1);
R—rainfall-runoff erosivity factor (MJ mm h−1 ha−1 year−1);
K—soil erodibility factor (t ha h−1 ha−1 MJ−1 mm−1);
LS—topographic factor—slope length (L) and slope gradient (S) (/);
C—vegetation cover factor (/);
P—anti-erosion practices (/).
Average annual precipitations data were used to calculate the R factor in the aforementioned period (1991–2015), due to the lack of thirty-minute precipitation data values. The value of the R factor was determined by the Van der Knijff method [40] (Equation (2)).
R—rainfall-runoff erosivity factor (MJ mm h−1 ha−1 year−1);
b0—empirical coefficient, ranges from 1.1–1.5 (MJ h−1 ha−1 year−1);
Pm—mean annual precipitation on a representative meteorological station (mm).
The values of the K factor were taken from the study of [24]. The values were determined after defining the physical properties of soil: particle size analysis, structure, water permeability and the organic matter content, using the Wischmeier & Smithnomograph [36].
The values of LS, C and P factors were determined based on the data about length and slope, type of vegetation cover, and the type of active anti-erosion measures for each individual plot of the morphological unit that were described in the study [24]. The lengths of the slopes are 260–960 m, while the slope grades are 6.11–13.57%.
The topographic factor LS was determined using the equation of Wischmeier and Smith [36] (Equation (3)).
L—slope length factor (/);
X—slope length in meters (m);
m—exponent whose value is in the function of the slope (0.5 for the slopes >5%, 0.3 for the slopes 3–5% and 0 for the slopes <1%) (/);
S—slope factor (/);
s—slope rate (%).
Vegetation cover factor C was defined based on the values suggested by Wischmeier and Smith [41]. The mean value of C was calculated for each plot.
The P value depends on the applied anti-erosion measures. The P value was determined by the Wischmeier and Smith method [36].
Tolerable values of mean annual soil loss were calculated based on the defined soil depths within the plots, using the Wischmeier method [24,36]. Tolerable soil loss represents the amount of soil that is equal to the annual soil production of soil in pedogenetic processes [42]. Based on the relation of erosion loss and tolerable soil losses, the Erosion Risk Index was calculated [36] (Equation (4)):
Ei = A/Gp
A—annual soil loss (kg/m2/year);
Gp—tolerable soil losses by Wischmeier (1978) (kg m−2 year−1).
2.4. FAPSMS Model
This model of future agricultural production from the aspect of preserving land resources is based on previous work by Sheng [43]. His scheme of soil use classes according to the soil depth and slope rate can be used for smaller watersheds in hilly areas with the forest-pasture-arable land use model, so it is adaptable to conditions in Serbia [44]. The model is based on the structure of future production, depending on the slope, the degree of soil endangerment by the process of erosion and the needs of the population in the research area, where losses should be below the tolerance limits. Professor Zlatić has modified and adapted the model for its use in Serbia [25] as the Future Agricultural Production Structure Model from the Aspect of Preserving Land Resources for Mountain Catchment Areas of Serbia. The FAPSMS model is based on the erosion soil loss assessment, which is calculated using the RUSLE; more specifically, it is based on the Erosion Risk Index and the slope rate. Further, on the areas with given slopes and the Erosion Risk Index, corresponding plant culture production is designed with the aims of the reduction of soil losses, meeting the needs of the population and, in the end, the maximization of profit. Possible limitations of the model are its limitation of applicability in regions that are climatically and orographically different from the ones found in Serbia.
Per this method, the areas under forest vegetation, bare lands and some others are not subjected to the change of land management; only the agricultural areas, such as fields, gardens, orchards, vineyards, meadows, pastures, ponds, reeds and marshes are (Table 1). With the increase in the degree of danger and slope, the areas under orchards increase, while the areas under crop rotation containing row crops, grain and grass formations increase.

Table 1.
FAPSMS model [25].
The detailed structure of current agricultural production in the area of the studied morphological unit was determined based on the statistical report from the RZS webpage [34].
2.5. Economic Assessment
The methodological approach to price selection is the first step in assessing the economic effects of the future production structure model. All necessary cost values were taken from the official website of the Ministry of Agriculture of Serbia for the costs of agricultural goods [35]. The average value of RSD was used in the equations, taking into account inflation and currency fluctuations. The average value of RSD for one Euro in the year 2017 was 124.
The quantification of incomes and expenses was based on the calculations of unit prices for building the orchards and for the regular production. Calculations were carried out for corn, sunflower, soy, wheat, oat, lucerne, grasses mixture, apple, pear, peach, apricot, plum, cherries, raspberry, blackberry and walnut. The calculation of unit prices for building an orchard included soil preparation, planting and nursing values, while the calculation of unit prices for regular production included material consumption, production service, amortization, premium costs and insurance cost. An economic assessment was also carried out for the projected production structure in the form of calculations of unit prices for anti-erosion measures plus the residual value of production within the species where the profitable production period exceeds fifteen years (Equation (5)).
Rv—residual value;
n—profitable length of production (years);
As—amortization rate (%);
Vp—production value (EUR).
Dynamic methods for the estimation of the economic effectivity of the existing and projected production were used, such as Internal Rate of Return (IRR), Repayment of the Invested Funds (RIF), Cost-Benefit Ratio (CBR) and Net Present Value (NPV). All of these methods use the same input values and the same equations, but each time, different relationships between the data are calculated, and therefore, results could be evaluated from different perspectives [25]. Necessary data for these calculations: investment costs, investment benefits, interest rate and useful life of the investment (number of years). The logic in economic assessment analysis is in comparing the costs and benefits from the investments. If the benefit from the investment is enough to cover its costs, then the investment is effective from the economic point of view [45].
IRR is mathematically defined as the interest rate that equates the present worth of a series of cash flows to zero. It is being used as a measure for project efficiency and its evaluation [46] (Equation (6)).
b—yearly investment benefit;
a—investment expenses (without the amortization of investment facilities);
r—interest factor (r = 1 + pi/100);
pi—discount rate, real calculative interest rate (12%);
n—duration of the investment.
The economic validity of the investment into agricultural production is determined by comparison of IRR with the discount rate. The discount rate for our region is 12% [18,44,47,48]. We have also found and considered the official values of the discount rates for Serbia and Eastern Europe countries, for the objective period, that World bank has provided [31]).
RIF represents the time needed for the return of the invested capital and it is calculated from the same equation as the IRR. In order for the investment to be rentable, it has to repay itself before its useful life expires.
CBR represents the relation between the sums of the annual benefits and costs of the investment, and it can indicate profitability of the investment. If the ratio value is greater than 1, the investment is considered to be profitable [45] (Equation (7)).
“NPV is determined by discounting all arising cash flows (at some internal rate of return) to the start time of the project. As such, the NPV can be regarded as the ‘cash equivalent’ of undertaking the project and can be used for measuring project’s financial benefit” [49] (Equation (8)).
The total accumulation of the investment represents the amount of available funds that can be further implemented into new projects. Investment is profitable if the NPV is above zero. If NPV equals zero, investment is on the edge of profitability and implies that a sensitivity analysis should be done. This method may not be of major interest for the investors, but it is significant for the community [45].
The risk assessment and uncertainty of investment method used in this paper includes a sensitivity analysis of IRR and RIF for the cases when the values of investment, income and expenses change [44].
3. Results
3.1. Ecological Effects of the FAPSMS Model
The ecological effect of the FAPSMS model refers to a soil erosion assessment using the RUSLE model for all nine plots of the Barička river morphological unit. Tolerable values of mean annual soil losses were obtained from the study of [24], based on the defined soil depths within the plots according to the Wischmeier method [36]. Its value for a research area is 10.61 t ha−1 year−1, with a range of values for different plots of 7.90–13.00 t ha−1 year−1.
Rainfall-runoff factor R was calculated based on the data from the meteorology year books of the Republic Hydrometeorological Service of Serbia. It provides data on the kinetic energy that is released on the researched area when the raindrops hit the soil. The mean annual amount of rainfall for the period 1991–2015 was 710.79 mm. Using the Van der Knijff [38] equation and the b0 latitude correction coefficient of 1.3 for the study area, the calculated value of the factor R was 924.03 MJ mm h−1 ha−1 year−1 for every plot.
The topographic factor LS represents factors that quantify the influence of the length and slope rate of the slopes on soil erosion. With the increase in the length and slope rate of the slope, the intensity of the erosion process increases. The slope rate was relatively uniform for different plots in a range of 8.53–12.56%, while the mean values of slope length occurred in a relatively wide range of 70–1040 m. Accordingly, values of the topographic factor LS fluctuated for different plots 0.12–0.47, with the mean value of 0.34 for the whole morphological unit. The values of factor R and LS are the same for existing and projected agricultural production, considering them constant.
The range of values of the vegetation cover factor C for the existing and projected production structure on different plots was 0.47–0.70 and 0.25–0.29, respectively, with mean values for the whole research area of 0.53 and 0.26, respectively. The values of the C factor for an existing production structure are bigger than the values for a projected structure due to inadequate choice of agricultural production on different plots, reducing the ability of vegetation cover to protect the soil from erosion. However, the application of projected production proposed by the FAPSMS model would establish better soil protection regarding to soil erosion.
The values of the anti-erosion practices factor P for the existing and projected production structure of different plots was 0.85–1.00 and 0.25–0.45, respectively, with a mean value for the whole research area of 0.89 and 0.33, respectively. The values of the P factor for an existing production are relatively high. The reason is that the existence of any anti-erosion measures was hardly observed in the researched area. Establishing crop rotation and orchards with terraces proposed by the FAPSMS model, the values of factor P would be significantly reduced, contributing to the reduction of soil erosion losses in the research area.
The calculated average annual soil losses A within the existing production structure are below tolerant values for each of the nine plots, within the range of 1.22–7.11 t ha−1 year−1, and with a mean value of 3.80 t ha−1 year−1 for the whole research area. Reducing the values of C and P factors by application of the FAPSMS model, the average annual soil loss value was reduced almost six times to the average annual soil loss value of 0.67 t ha−1 year−1, with a values range of 0.24–1.01 t ha−1 year−1 for different plots (Figure 2).
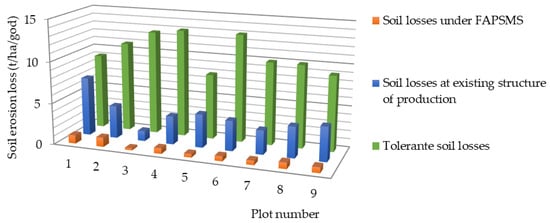
Figure 2.
Soil losses due to erosion within the existing and projected production structure, and tolerant soil losses in the area of the Barička river morphological unit.
Based on the ratio of annual average soil losses and tolerant soil losses, erosion risk categories were determined for all nine plots. Considering that erosion risk values are below 1 for both existing and projected production structures, soil is classified in the category I No Risk of erosion (Table 2, colored green).
Table 2.
FAPSMS model [25] applied on the Barička river morphological unit.
Regarding the obtained levels of the erosion risk of existing agricultural production and slope rate for different plots, a proposed agricultural production structure using the FAPSMS model would imply the application of anti-erosion crop rotation and orchards for slope rates under 6°, and anti-erosion crop rotation and orchard on terraces for slope rates of 6–12°.
Considering that factors C and P are only changing in a RUSLE equation for existing and projected agricultural production, the effect of applying the FAPSMS model on the research area is expressed through the modification of vegetation cover and the modification or implementation of anti-erosion practices. The detailed change of the existing structure of production by applying the FAPSMS model on the area of the morphological unit of the Barička river is given in Figure 3. It predicts changes of the production structure; specifically, increases of arable land and orchards of 16.53% and 421.26%, respectively, at the expense of areas under meadows, pastures and vineyards, which decrease 35.36% and 100%, respectively, while the areas under the forests and other uses are kept the same. The very structure of the products within the main groups is also changed in accordance to the FAPSMS model propositions. Thus, the areas under wheat, soy and sunflower are increased 28.59, 762.71 and 584.8%, respectively, while the areas under oath and corn are reduced 6.35 and 7.66%, respectively. Given that the area under meadows ise reduced, areas under Lucerne and grassed mixture are also reduced 39.68 and 32.16%, respectively. When it comes to orchards, the areas under cherry, sour cherry, plum, walnut, raspberry and blackberry are eliminated, while the areas under apple, peach, pear and apricot are increased by 1194.94, 4394.77, 809.39 and 431.78%, respectively.
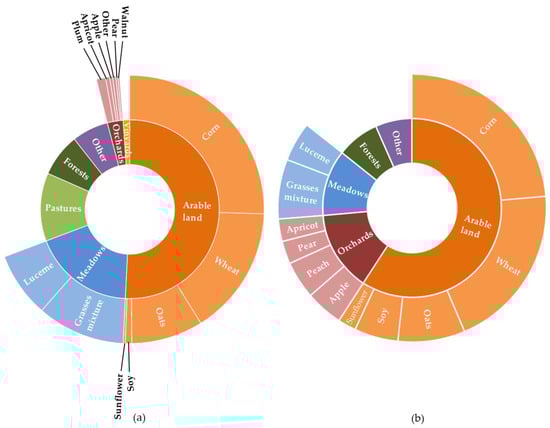
Figure 3.
Detailed change of the existing structure of agricultural production (a) by applying the FAPSMS model (b) in the area of the morphological unit of the Barička river.
3.2. Economic Effects of Using the FAPSMS Model
Based on the calculations of unit prices for building orchards, the calculations of regular production and the calculations of unit prices of proposed anti-erosion measures, incomes and expenses were quantified in the case of the existing and future production structure (Figure 4).
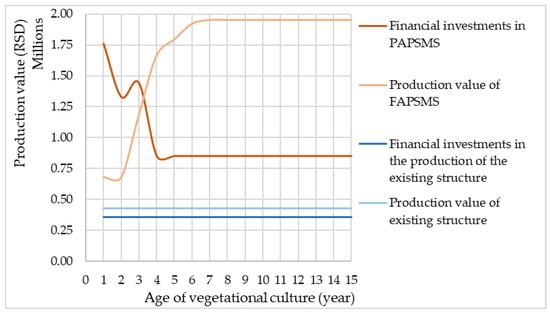
Figure 4.
Incomes and expenses for the cases of existing and future agricultural production structures after the application of FAPSMS model (production value is expressed in RSD).
The quantification of incomes and expenses in the study area is expressed through suggested conservation measures, the estimation of present production lines and making new production lines. In the first two years, orchards have neither fruits nor income. Income starts in the third year, but it is significantly lower than in full yield in the sixth or seventh year. With that in mind, apples and pears would not bear fruits during the first two years, would yield around 40% in the third year, in fourth 75% in the fourth, 85% the fifth, 95% in the sixth, and would be expected to yield 100% between the seventh and fifteenth years. Apricot, peach, plum and cherries also do not have fruits in the first two years, and the expected yield is around 40% in the third year, 80% in the fourth, 90% in the fifth, and 100% between the sixth and fifteenth years. Raspberry and blackberry have a five-year production cycle, which means that within a designed model of fifteen years, their production cycle would be repeated three times. These berries also do not have fruits in the first year, but in the second year, the yield is already 90%, and in the last three years of the cycle it is at 100%. Walnut does not have fruits in the first four years; in the fifth, the expected yield is around 30%, in the sixth it is 70%, in the seventh it is 80%, in the eighth it is 90% and from the ninth year on 100% yield is expected.
When calculating the values for the projected production structure, the residual value was added for the cultures where the profitable length of the production cycle is longer than 15 years. For apples and pears, the profitable length of the production cycle is 25 years, while for the walnut it is 50 years. The residual value was added onto the value on the 15th year. Investment expenses for the already-established production structure include the expenses of production, and are significantly lower than investment expenses of the projected production structure, which also include the expenses regarding the establishment of the production and application of anti-erosion measures.
The value of the existing agricultural production structure is greater than expenditures by 19.45%, while the value of the projected agricultural production is lower in the first few years, but after the 7th year it surpasses the expenditures value by 128.49% (Figure 4).
The evaluation of the economic effects is shown through the dynamic methods results, IRR, RIF, CBR and NPV. IRR is 28.23%, and it is higher than the interest rate for the countries of Eastern Europe, which is 12% [4]. This means that on each EUR 100 invested, the revenue is EUR 16.23 (Figure 5a). RIF is 7 years, which is a time period more than two times shorter than the “useful lifetime” of the system, which is 15 years (Figure 5b). CBR is 1.487, meaning that for each euro invested there is a revenue of EUR 0.487 (Figure 6a). Finally, NPV is EUR 2,716,259.25 (Figure 6b), which indicates that the future investments in the production systems are justified, along with three other economic indicators.
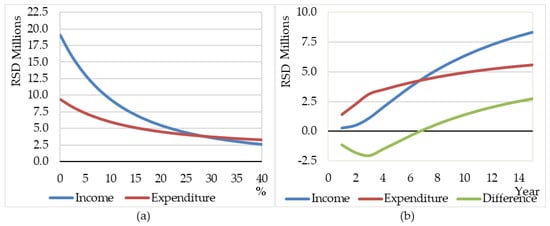
Figure 5.
Economic effects evaluation of applied measures through dynamic methods IRR (a), RIF (b). Note: currency is RSD, Dinar of the Republic of Serbia.
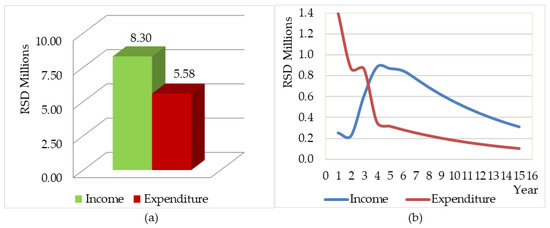
Figure 6.
Economic effects evaluation of applied measures through dynamic methods CBR (a), NPV (b). Note: currency is RSD, Dinar of the Republic of Serbia.
The evaluation of the economic effectiveness of investments using dynamic methods is based on safe and stable elements. They are calculated for some future time, so the investment evaluation needs to be done and it needs to include uncertainties. The causes of investment uncertainties are most often the result of changed factors that determine the internal rate of return, and other dynamic method factors: initial issuance for investment, changes in annual expenses which arise due to natural expenses and changes in the prices of materials consumed in production, changes in use of investments that arise due to the decline of natural conditions and changes in prices, and changes of obligations towards the social community. Testing the capacity to generate income from the project was carried out by sensitivity analysis, assuming that the necessary changes to the initial conditions have been made. It is based on the changes of annual incomes and expenses.
IRR sensitivity analysis results show that the maximum allowed decrease in incomes is 32.73%, in which case IRR would fall to 12%. On the other hand, expenses could increase to a maximum of 48.65%, which means that IRR is more sensitive to changes in income (Figure 7a). RIF sensitivity analysis results show that the highest possible decrease in incomes can be 32.73%, and highest possible increase of expenses can be 48.65%, in order for the repayment time to be fifteen years, which is the lifetime of production system. With this in mind, it can be said that RIF is more sensitive to the changes in incomes (Figure 7b).
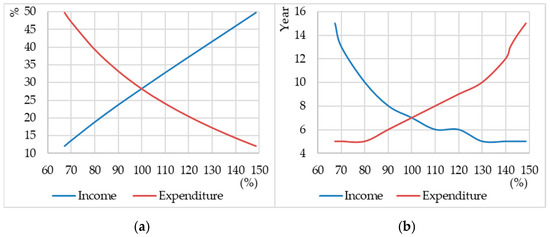
Figure 7.
Sensitivity analysis of the IRR (a) and RIF (b).
4. Discussion
The existing production structure at the Barička river morphological unit is a result of long-term investment of individual farms in agricultural production in accordance with their needs and resources. However, some authors pointed out the importance of choosing the right crop on slopes for the prevention of soil loss [50]. Sustainable land use implies minimizing soil loss, while establishing production that will be economically effective. It is based on the preservation of land resources and production planning that will have positive effects.
An analysis of soil endangerment, in terms of soil erosion induced by rainfalls in the research area, is conducted by using the RUSLE method on nine plots that were established according to the erosion predisposition factors, land cover and hydrological factors. Such an approach enables us to accurately and realistically analyze the vulnerability of the area regarding soil erosion. The analysis showed that none of the plots and, therefore, none of the study area was threatened by soil erosion. However, existing soil erosion has reduced many times over after applying the FAPSMS model as a direct consequence of vegetation cover and anti-erosion practice changes. The application of the FAPSMS model, besides the introduction and elimination of some plant cultures, leads to the redistribution of existing plant cultures, at the same time improving the economic potential of the production structure. Therefore, less profitable cultures of pastures, vineyards, agriculture under cereals, meadows and orchards are replaced with some other cultures of cereals and orchards, maximizing the economic income and profit of the studied area.
Although the projected production structure needs some time to reach its full potential, quantifying incomes and expenses and evaluating the economic effects through dynamic methods gave positive results. Positive revenue and projected production structure payout in a time twice shorter than its lifetime indicate the justification of such investment. The FAPSMS model application obtained positive results for the researched area, but model adjustments and changes in terms of some production lines’ representation are still possible; this would increase the positive effects of its application, while at the same time reducing the risks brought by agricultural production, both from an ecological and an economical point of view. Such a model concept allows considerable flexibility and gives it breadth with the possibility of its application in different climatic conditions.
Considering that this economic analysis is for a multi-year period, the calculation is subject to changes due to many potential variables, such as climate change, market prices or policy interventions that could have tremendous impacts on the research area, specifically its ecologic and economic conditions. Given that the long-term climate scenario for our region indicates that we are moving towards a drier climate, we can expect bigger expanses needed for irrigation within regular agricultural production, and changing the production structure towards agricultural crops more resistant to drought. There are also new regulations and policies that Serbia adopted in the process of inclusion in the European Union that should have beneficial impacts on an economic aspect of agricultural production. We are witnessing that global macro politics has a great influence on the prices of products and services in the world, changing the price of others. In an attempt to provide some insight into the sensitivity of the change of annual incomes and expenses, we conducted sensitivity analyses that showed certain resilience to a possible macro economy change.
The implementation of the necessary anti-erosion works and measures such as the construction of terraces for orchards and the raising of new fruit plantations requires the engagement of a new workforce, which would also achieve a certain social justification. It should also be emphasized The immeasurable effects of the model application should also be emphasized; they include the defense of natural resources from degradation, as well as contributions to the regulation of the water regime and the fight against drought.
In summary, the implementation of projected production could have significant positive economical and environmental effects which would contribute to the achievement of sustainable development goals on the farm scale. Specifically, greater farm incomes and employment directly refer to goals 1—No poverty, and 8—Decent work and economic growth. An increase in yield refers to goal 2—Zero hunger. The implementation of anti-erosion measures refers to goals 12—Responsible consumption and production, 13—Climate action, and 15—Life on land through its positive environmental effects such as the reduction of carbon emissions from degraded soils and biodiversity preservation.
5. Conclusions
The differences in the intensity of soil loss in existing and projected productions are directly dependent on the vegetation cover and applied anti-erosion measures. The mean value of soil loss within the regular production structure does not exceed tolerable values and, therefore, investment is not justified in that way. However, this study showed that applying the FAPSMS model for soil conservation in the areas designated for agricultural production is economically beneficial for the local population. Although there is an economical gain from the existing production system, the benefits of changing the production system by applying the FAPSMS model exceed the existing economic gain multiple times. The initial investment repays in the 7th year, while reducing the production pressure and conserving the soil resource for the future generations, showing a certain rate of resilience to possible market fluctuations.
Bearing in mind that the main motive for the implementation of conservation measures among agricultural producers is economic profit, such studies are significant as a tool for their promotion. Emphasizing the economic benefits of applying these measures and presenting the results of such studies through producer education programs raise the awareness of individuals and will eventually lead to their widespread application. That is why it is necessary to conduct a large number of studies in different regions and environmental conditions. The ecological and economic benefits of the implementation of conservation measures are in line with the goals of sustainable development that are pursued by modern society and promoted by the international community
Author Contributions
Conceptualization, N.T., V.R., N.Ž., T.G., L.S., N.J. and M.Z.; Formal analysis, L.S.; Funding acquisition, V.R., N.Ž., T.G. and M.Z.; Investigation, N.T., V.R., T.G. and M.Z.; Methodology, V.R., N.Ž., T.G., N.J. and M.Z.; Project administration, M.Z.; Resources, L.S., N.J. and M.Z.; Supervision, M.Z.; Visualization, N.T., V.R., N.Ž., T.G. and N.J.; Writing—original draft, N.T., V.R., N.Ž., T.G., L.S., N.J. and M.Z.; Writing—review & editing, N.T., V.R., N.Ž., T.G., L.S. and N.J. All authors listed have made a substantial intellectual contribution to the work. All authors have read and agreed to the published version of the manuscript.
Funding
This research was funded by the Ministry of Education, Science and Technological Development of Republic of Serbia (Grant No: 451-03-47/2023-01/200026, 451-03-47/2023-01/200169, 451-03-47/2023-01/200011).
Institutional Review Board Statement
Not applicable.
Informed Consent Statement
Not applicable.
Data Availability Statement
The data presented in this study are available on request from the corresponding author. The data are not publicly available due to data privacy restriction.
Conflicts of Interest
The authors declare no conflict of interest. Nikola Jovanović is an employee of MDPI but did not work for the journal Sustainability during the preparation, submission, or publication of this article.
References
- Lal, R. Laws of Sustainable Soil Management; Agronomy for Sustainable Development; Springer: Berlin/Heidelberg, Germany, 2009; Volume 29, pp. 7–9. [Google Scholar]
- Seeman, T.; Šrédl, K.; Prášilová, M.; Svoboda, R. The Price of Farmland as a Factor in the Sustainable Development of Czech Agriculture (A Case Study). Sustainability 2020, 12, 5622. [Google Scholar] [CrossRef]
- FAO. Revised World Soil Charter. 2015. Available online: https://www.fao.org/3/I4965E/i4965e.pdf (accessed on 1 July 2022).
- Günal, H.; Korucu, T.; Birkas, M.; Özgöz, E.; Halbac-Cotoara-Zamfir, R. Threats to Sustainability of Soil Functions in Central and Southeast Europe. Sustainability 2015, 7, 2161–2188. [Google Scholar] [CrossRef]
- Tesfai, M.; Øygarden, L.; Hessel, R.; Panagos, P.; Kværnø, S.; Verheijen, F.; Ballabio, C.; Stolte, J.; Keizer, J. (Eds.) Soil Threats in Europe; Joint Research Centre, Institute for Environment and Sustainability, Publications Office: Brussels, Belgium, 2015; Available online: https://data.europa.eu/doi/10.2788/828742 (accessed on 1 August 2022).
- Smith, P.; Gregory, P.J. Climate change and sustainable food production. Proc. Nutr. Soc. 2013, 72, 21–28. [Google Scholar] [CrossRef] [PubMed]
- Mishra, P.K.; Rai, A.; Abdelrahman, K.; Rai, S.C.; Tiwari, A. Analysing Challenges and Strategies in Land Productivity in Sikkim Himalaya, India. Sustainability 2021, 13, 11112. [Google Scholar] [CrossRef]
- Barbier, E.B. The Economics of Land Degradation and Rural Poverty Linkages in Africa. In UNU/INRA Annual Lectures on Natural Resource Conservation and Management in Africa, November 1998; UNU/INRA: Accra, Ghana, 1998. [Google Scholar]
- Martina, S.; Emanuele, F.; Robert, M.; Philippidis, G.; Kirsten, B.-U.; Pasquale, B.; Luca, M.; Panos, P. Remaining Loyal to Our Soil: A Prospective Integrated Assessment of Soil Erosion on Global Food Security. Available online: https://ssrn.com/abstract=4329549 (accessed on 15 January 2023).
- Zuazo, V.D.; Pleguezuelo, C.R.R. Soil-Erosion and Runoff Prevention by Plant Covers: A Review. Agron. Sustain. Dev. 2009, 28, 785–811. [Google Scholar] [CrossRef]
- Tang, Q.; He, C.; He, X.; Bao, Y.; Zhong, R.; Wen, A. Farmers’ Sustainable Strategies for Soil Conservation on Sloping Arable Lands in the Upper Yangtze River Basin, China. Sustainability 2014, 6, 4795–4806. [Google Scholar] [CrossRef]
- Majoro, F.; Wali, U.G.; Munyaneza, O.; Naramabuye, F.-X. Sustainability Analysis of Soil Erosion Control in Rwanda: Case Study of the Sebeya Watershed. Sustainability 2023, 15, 1969. [Google Scholar] [CrossRef]
- Sun, J.; Huang, Y. Modeling the simultaneous effects of particle size and porosity in simulating geo-materials. Materials 2022, 15, 1576. [Google Scholar] [CrossRef]
- Yang, T.; Siddique, K.H.; Liu, K. Cropping systems in agriculture and their impact on soil health-A review. Glob. Ecol. Conserv. 2020, 23, e01118. [Google Scholar] [CrossRef]
- Keeble, B.R. The Brundtland report: ‘Our common future. Med. War 1988, 4, 17–25. [Google Scholar] [CrossRef]
- Grujić, T.; Maksimović, J.; Dinić, Z.; Pivić, R.; Stanojković-Sebić, A.; Jovković, M. Recognized values of the content of hazardous and harmful substances in the soil from the angle of science and legislation. In Proceedings of the XXV International Eco-Conference 2021, XIV Environmental Protection of Urban and Suburban Settlements, Novi Sad, Serbia, 22–24 September 2021; pp. 105–113. [Google Scholar]
- FAO. Sustainable Development Goals. 2015. Available online: https://www.fao.org/sustainable-development-goals/en/ (accessed on 1 July 2022).
- Rončević, V.; Zlatić, M.; Todosijević, M. Environmental and economic effects of investments in sustainable land management in the basin of Sutilovac stream. Bull. Fac. For. 2019, 213–232. [Google Scholar] [CrossRef]
- Diop, M.; Chirinda, N.; Beniaich, A.; El Gharous, M.; El Mejahed, K. Soil and Water Conservation in Africa: State of Play and Potential Role in Tackling Soil Degradation and Building Soil Health in Agricultural Lands. Sustainability 2022, 14, 13425. [Google Scholar] [CrossRef]
- Neto, M.R.R.; Musselli, D.G.; Lense, G.H.E.; Servidoni, L.E.; Stefanidis, S.; Spalevic, V.; Mincato, R.L. SOIL LOSS MODELLING BY THE IntErO MODEL-EROSION POTENTIAL METHOD IN THE MACHADO RIVER BASIN, MINAS GERAIS, BRAZIL. Agric. For. 2022, 68, 7–21. [Google Scholar] [CrossRef]
- FAO. Understanding Mountain Soils: A Contribution from Mountain Areas to the International Year of Soils; FAO: Rome, Italy, 2015. [Google Scholar]
- Vasić, F.; Paul, C.; Strauss, V.; Helming, K. Ecosystem Services of Kettle Holes in Agricultural Landscapes. Agronomy 2020, 10, 1326. [Google Scholar] [CrossRef]
- Gavrilović, S. Engineering of Torrential Flows and Erosion; Izgradnja: Belgrade, Serbia, 1972; pp. 1–292. [Google Scholar]
- Kostadinov, S.; Redžić, S.; Zlatić, M.; Dragović, N. Program for Erosion Protection and Proposal for the Designation of Erosion Areas with the Regulation of Antierosion Measures in the Area of the Municipality of Voždovac; Institute for Forestry and Wood Industry—Belgrade; Faculty of Forestry, University of Belgrade: Belgrade, Serbia, 1988. [Google Scholar]
- Zlatić, M. Evaluation of Anti-Erosion Works from the Aspect of Technical and Economic Justification in the Endangered Area of the City of Belgrade. Ph.D. Thesis, Faculty of Forestry, University of Belgrade, Belgrade, Serbia, 1994. [Google Scholar]
- National Rural Development Program for the Period 2022–2024. Available online: http://www.minpolj.gov.rs/nacionalni-program-ruralnog-razvoja-za-period-2022-2024-godine-2/?script=lat (accessed on 1 November 2022).
- Nkonya, E.; Mirzabaev, A.; Von Braun, J. Economics of Land Degradation and Improvement—A Global Assessment for Sustainable Development; Springer: Berlin/Heidelberg, Germany, 2016. [Google Scholar]
- Istanbuly, M.N.; Krása, J.; Amiri, B.J. How Socio-Economic Drivers Explain Landscape Soil Erosion Regulation Services in Polish Catchments. Int. J. Environ. Res. Public Heal. 2022, 19, 2372. [Google Scholar] [CrossRef]
- topographic-map.com. Free Cartography Tool—Europe Topographic Map. Available online: https://en-gb.topographic-map.com/map-cvtgt/Europe/?center=44.64154%2C20.29312&zoom=13&base=5 (accessed on 15 January 2023).
- Serbia: Belgrade City. Available online: http://www.citypopulation.de/en/serbia/belgradecity/?fbclid=IwAR05uc3rXKMtxN_ioSJ6w7RLUay6kTSyeZWzjmyHq6YiPegxFDmTPTvZvUg (accessed on 15 January 2023).
- Škorić, A.; Filipovski, G.; Ćirić, M.; Vuković, T. Klasifikacija Zemljišta Jugoslavije; Akad: Sarajevo, Yugoslavia, 1985. [Google Scholar]
- Climatology Yearbooks for the Period of 1991–2015. Available online: https://www.hidmet.gov.rs/eng/meteorologija/klimatologija_srednjaci.php (accessed on 1 July 2022).
- Mecometer. Available online: http://mecometer.com/whats/serbia/central-bank-discount-rate/ (accessed on 1 November 2022).
- Statistical Office of the Republic of Serbia. Available online: https://www.stat.gov.rs/ (accessed on 15 January 2023).
- Market Information System of Agriculture of Serbia 2004–2023. Available online: https://www.stips.minpolj.gov.rs/ (accessed on 1 November 2022).
- Wischmeier, W.H.; Smith, D.D. Predicting Rainfall Erosion Losses—A Guide to Conservation Planning; Agriculture Handbook No. 537; U.S. Department of Agriculture: Washington, DC, USA, 1978.
- Renard, K.G. Predicting Soil Erosion by Water: A Guide to Conservation Planning with the Revised Universal Soil Loss Equation (RUSLE); USDA: Washington, DC, USA, 1997.
- Fernández, C.; Vega, J.A.; Vieira, D. Assessing soil erosion after fire and rehabilitation treatments in NW Spain: Performance of rusle and revised Morgan-Morgan-Finney models. Land Degrad. Dev. 2010, 21, 58–67. [Google Scholar] [CrossRef]
- Djoukbala, O.; Hasbaia, M.; Benselama, O.; Mazour, M. Comparison of the erosion prediction models from USLE, MUSLE and RUSLE in a Mediterranean watershed, case of Wadi Gazouana (N-W of Algeria). Model. Earth Syst. Environ. 2018, 5, 725–743. [Google Scholar] [CrossRef]
- Van der Knijff, J.M.F.; Jones, R.J.A.; Montanarella, L. Soil Erosion Risk Assessment in Italy; European Soil Bureau, European Commission: Brussels, Belgium, 1999. [Google Scholar]
- Morgan, R.P.C. Soil Erosion and Conservation, 3rd ed.; Blackwell Publishing: Malden, MA, USA, 2005. [Google Scholar]
- Kadović, R. Protiverozioni Agroekosistemi—Konzervacija Zemljišta; Šumarski fakultet: Beograd, Serbia, 1999. [Google Scholar]
- Sheng, T.C. Runoff plots and erosion phenomena on tropical steeplands. In Research Needs and Applications to Reduce Erosion and Sedimentation in Tropical Steeplands (Proceedings of the Fiji Symposium, June 1990): IAHSAISH Publ. No. 192, 1990; International Association of Hydrological Sciences Publication: Wallingford, UK, 1990. [Google Scholar]
- Todosijević, M. Ecological and Economic Effects of Sustainable Management of Land Resources in the Mountainous Area of the Municipality of Ljubovija. Ph.D. Thesis, Faculty of Forestry, University of Belgrade, Belgrade, Serbia, 2012. [Google Scholar]
- Zlatić, M. Economics of Managing Erosion Areas; University of Belgrade: Belgrade, Serbia, 2005. [Google Scholar]
- Hartman, J.C.; Schafrick, I.C. The relevant internal rate of return. Eng. Econ. 2004, 49, 139–158. [Google Scholar] [CrossRef]
- Vulević, T.; Todosijević, M.; Dragović, N.; Zlatić, M. Land use optimization for sustainable development of mountain regions of western Serbia. J. Mt. Sci. 2018, 15, 1471–1480. [Google Scholar] [CrossRef]
- Zlatić, M.; Todosijević, M.; Momirović, N. Economic justification of investment in defense against torrential floods on the example of the Ljuboviđa River. Glas. Šumar. Fak. 2015, 112, 121–133. [Google Scholar] [CrossRef]
- Wiesemann, W.; Kuhn, D.; Rustem, B. Maximizing the net present value of a project under uncertainty. Eur. J. Oper. Res. 2010, 202, 356–367. [Google Scholar] [CrossRef]
- Ma, B.; Liu, G.; Ma, F.; Li, Z.; Wu, F. Effects of crop-slope interaction on slope runoff and erosion in the Loess Plateau. Acta Agric. Scand. Sect. B—Soil Plant Sci. 2018, 69, 12–25. [Google Scholar] [CrossRef]


Disclaimer/Publisher’s Note: The statements, opinions and data contained in all publications are solely those of the individual author(s) and contributor(s) and not of MDPI and/or the editor(s). MDPI and/or the editor(s) disclaim responsibility for any injury to people or property resulting from any ideas, methods, instructions or products referred to in the content. |
© 2023 by the authors. Licensee MDPI, Basel, Switzerland. This article is an open access article distributed under the terms and conditions of the Creative Commons Attribution (CC BY) license (https://creativecommons.org/licenses/by/4.0/).