Article

Construction and Optimization Strategy of County Ecological Infrastructure Network Based on MCR and Gravity Model—A Case Study of Langzhong County in Sichuan Province

1
School of Landscape Architecture, Zhejiang A&F University, Hangzhou 310000, China
2
Faculty of Architecture and Urban Planning, Chongqing University, Chongqing 400045, China
*
Author to whom correspondence should be addressed.
Sustainability 2023, 15(11), 8478; https://doi.org/10.3390/su15118478
Submission received: 25 January 2023 / Revised: 12 March 2023 / Accepted: 24 March 2023 / Published: 23 May 2023

Abstract

:
Against the backdrop of rapid urbanization, there is a passive adaptation state shown in urban and rural ecological spaces. Due to the shrinking of ecological patches and the fracture of corridors, problems such as the obstruction of ecological processes, the decline of ecosystem services, and the loss of biodiversity occur. Considering that county ecological space is the key level to undertake provincial ecological security patterns and implement ecological demonstration projects, the construction of a county ecological infrastructure (EI) network is beneficial to the protection of regional ecological security, the improvement of the structures and functions of farmland ecosystems, and the enhancement of the quality of human settlements. In this study, taking Langzhong County in Sichuan Province as an example, a method path for an EI network construction was explored, and an optimization strategy for ecological patterns was proposed. Firstly, morphological spatial pattern analysis (MSPA) and a patch importance index were employed to identify ecological sources. Secondly, by constructing a landscape resistance surface and adopting a minimum cumulative resistance (MCR) model, potential EI corridor paths were extracted. Thirdly, the interaction force values between ecological sources were calculated with a gravity model and important ecological corridors were identified for priority protection and restoration. Finally, an EI corridor network was optimized by combining network structure indexes (α, β, and γ) with the field situation, and stepping stone patches and ecological breakpoints were identified. Based on the analysis results, an ecological protection pattern, which involved three vertical and two horizontal ecological belts, four ecological control zones, and six clusters of EI networks in Langzhong County, was put forward, aiming at protecting 50 ecological sources, repairing 105 ecological corridors of different grades, adding 9 stepping stone patches near long-distance corridors and 15 at the intersection of ecological corridors, and repairing 18 ecological breakpoints. This study has guiding significance for the optimization of county ecological patterns, the construction of farmland forest belts, and site selection of ecological restoration projects.

1. Introduction

With the rapid development of urbanization, there are more and more human settlement construction activities such as urban land expansion, traffic and municipal corridor construction, agricultural reclamation and planting, animal husbandry, and industrial mining. Moreover, urban and rural ecological space is in a passive adaptation state, with erosion, movement, and succession occurring constantly. Furthermore, the shrinking of ecological patches and the rupture of corridors also result in the obstruction of ecological processes, the decline of ecosystem services, and the loss of biodiversity [1,2]. The concept of ecological infrastructure (EI) was formally proposed in the Man and Biosphere Program in 1984. Originating from a biodiversity conservation study, EI contains similar concepts, including the concepts of ecological network, green infrastructure network, and biodiversity conservation network [3]. EI focuses on building spatial patterns, thereby guaranteeing ecological processes, including two key elements: ecological sources and ecological corridors. An ecological source is the source and sink of an ecological process and serves as the habitat for organisms, while an ecological corridor is the flow path of the ecological process and serves as the channel for organisms to spread and migrate among patches in different habitats [4]. As indicated by the study, it was more conducive to the exertion of ecosystem service functions and responses to climate change to connect the discrete and isolated ecological sources functionally and maintain the integrity of the regional landscape compared to adopting an incremental approach focusing on isolated ecological patches and the expansion of natural habitat areas [5]. EI networks can maintain biodiversity, ecological processes, and the sustainability of ecological functions, thus promoting ecosystems to have stronger anti-interference abilities and resiliencies [6,7]. Moreover, the ecosystem services provided by an EI network can optimize the landscape, enrich recreational activities, and enhance aesthetic value, which is of great significance for improving the quality of human settlements [8].
In terms of EI network construction methods, scholars have conducted numerous studies on EI networks in many fields such as island ecology [9], landscape ecology [10,11], land use and planning [12], and ecosystem services [13]. Currently, by following the principle of landscape ecology, the path of “ecological source identification-corridor extraction-network optimization” is a common practice used in constructing regional EI networks [14,15]. Broadly speaking, ecological sources include the habitats of animals and plants as well as patches that provide important ecosystem services and have high ecological benefits. Moreover, the theoretical basis for ecological source selection is the “source-sink” theory in which a source area is directly proportional to the diversity of habitats. Furthermore, forests, grasslands, wetlands, and water bodies meeting a certain area threshold can all be selected as screening criteria [16] or can be identified by performing morphological spatial pattern analysis (MSPA) [17] and ecological security pattern evaluation [18]. Area identification of ecological sources do not consider the connectivity of ecological source areas, while the ecological security pattern assessment method requires a large amount of data and is more complex. MSPA has often been used because of its advantages of using small amounts of data and producing visualizations of analysis results. Because the number of identified ecological sources is often large, it has often been combined with area and connectivity analysis to screen ecological sources. Presently, there are two methods widely used for corridor extraction. One method is based on Forman’s “patch corridor” concept [19], which uses the minimum resistance model to extract potential EI corridors [20]. The other method involves introducing the connectivity model of circuit theory into ecological process simulation [21] with the low-resistance corridor used as the extraction corridor. When there are many ecological sources, the number of corridor path results is also large, so it is necessary to classify the relative importance of these corridor paths to reduce construction cost and ensure implementation. Corridor classification is mostly based on the Green Infrastructure Assessment method, but the amount of data required is large and Weight values are subjective. In addition, quantitative analysis is often applied in network optimization, and a network structure index [22] and landscape index [23] are usually employed for optimization.
Since 1992 when the Convention on Biological Diversity was adopted by the United Nations Conference on Environment and Development, China, as a contracting party, began to devote itself to strengthening the construction of ecological nature reserve systems and repairing regional ecological environments degraded by rapid urbanization. According to the exploration of many Chinese scholars on ecological network construction methods in Fujian Province [24], Taihu Lake Basin [25], Nanjing City [26], the Yangtze River Delta Integration Demonstration Zone [27], and Dianchi Lake [28], EI corridors possess a large span on the macroscale, playing a more flexible role in control and superior guidance. Moreover, county ecological space is the key level to undertake provincial ecological security patterns and implement ecological demonstration projects [
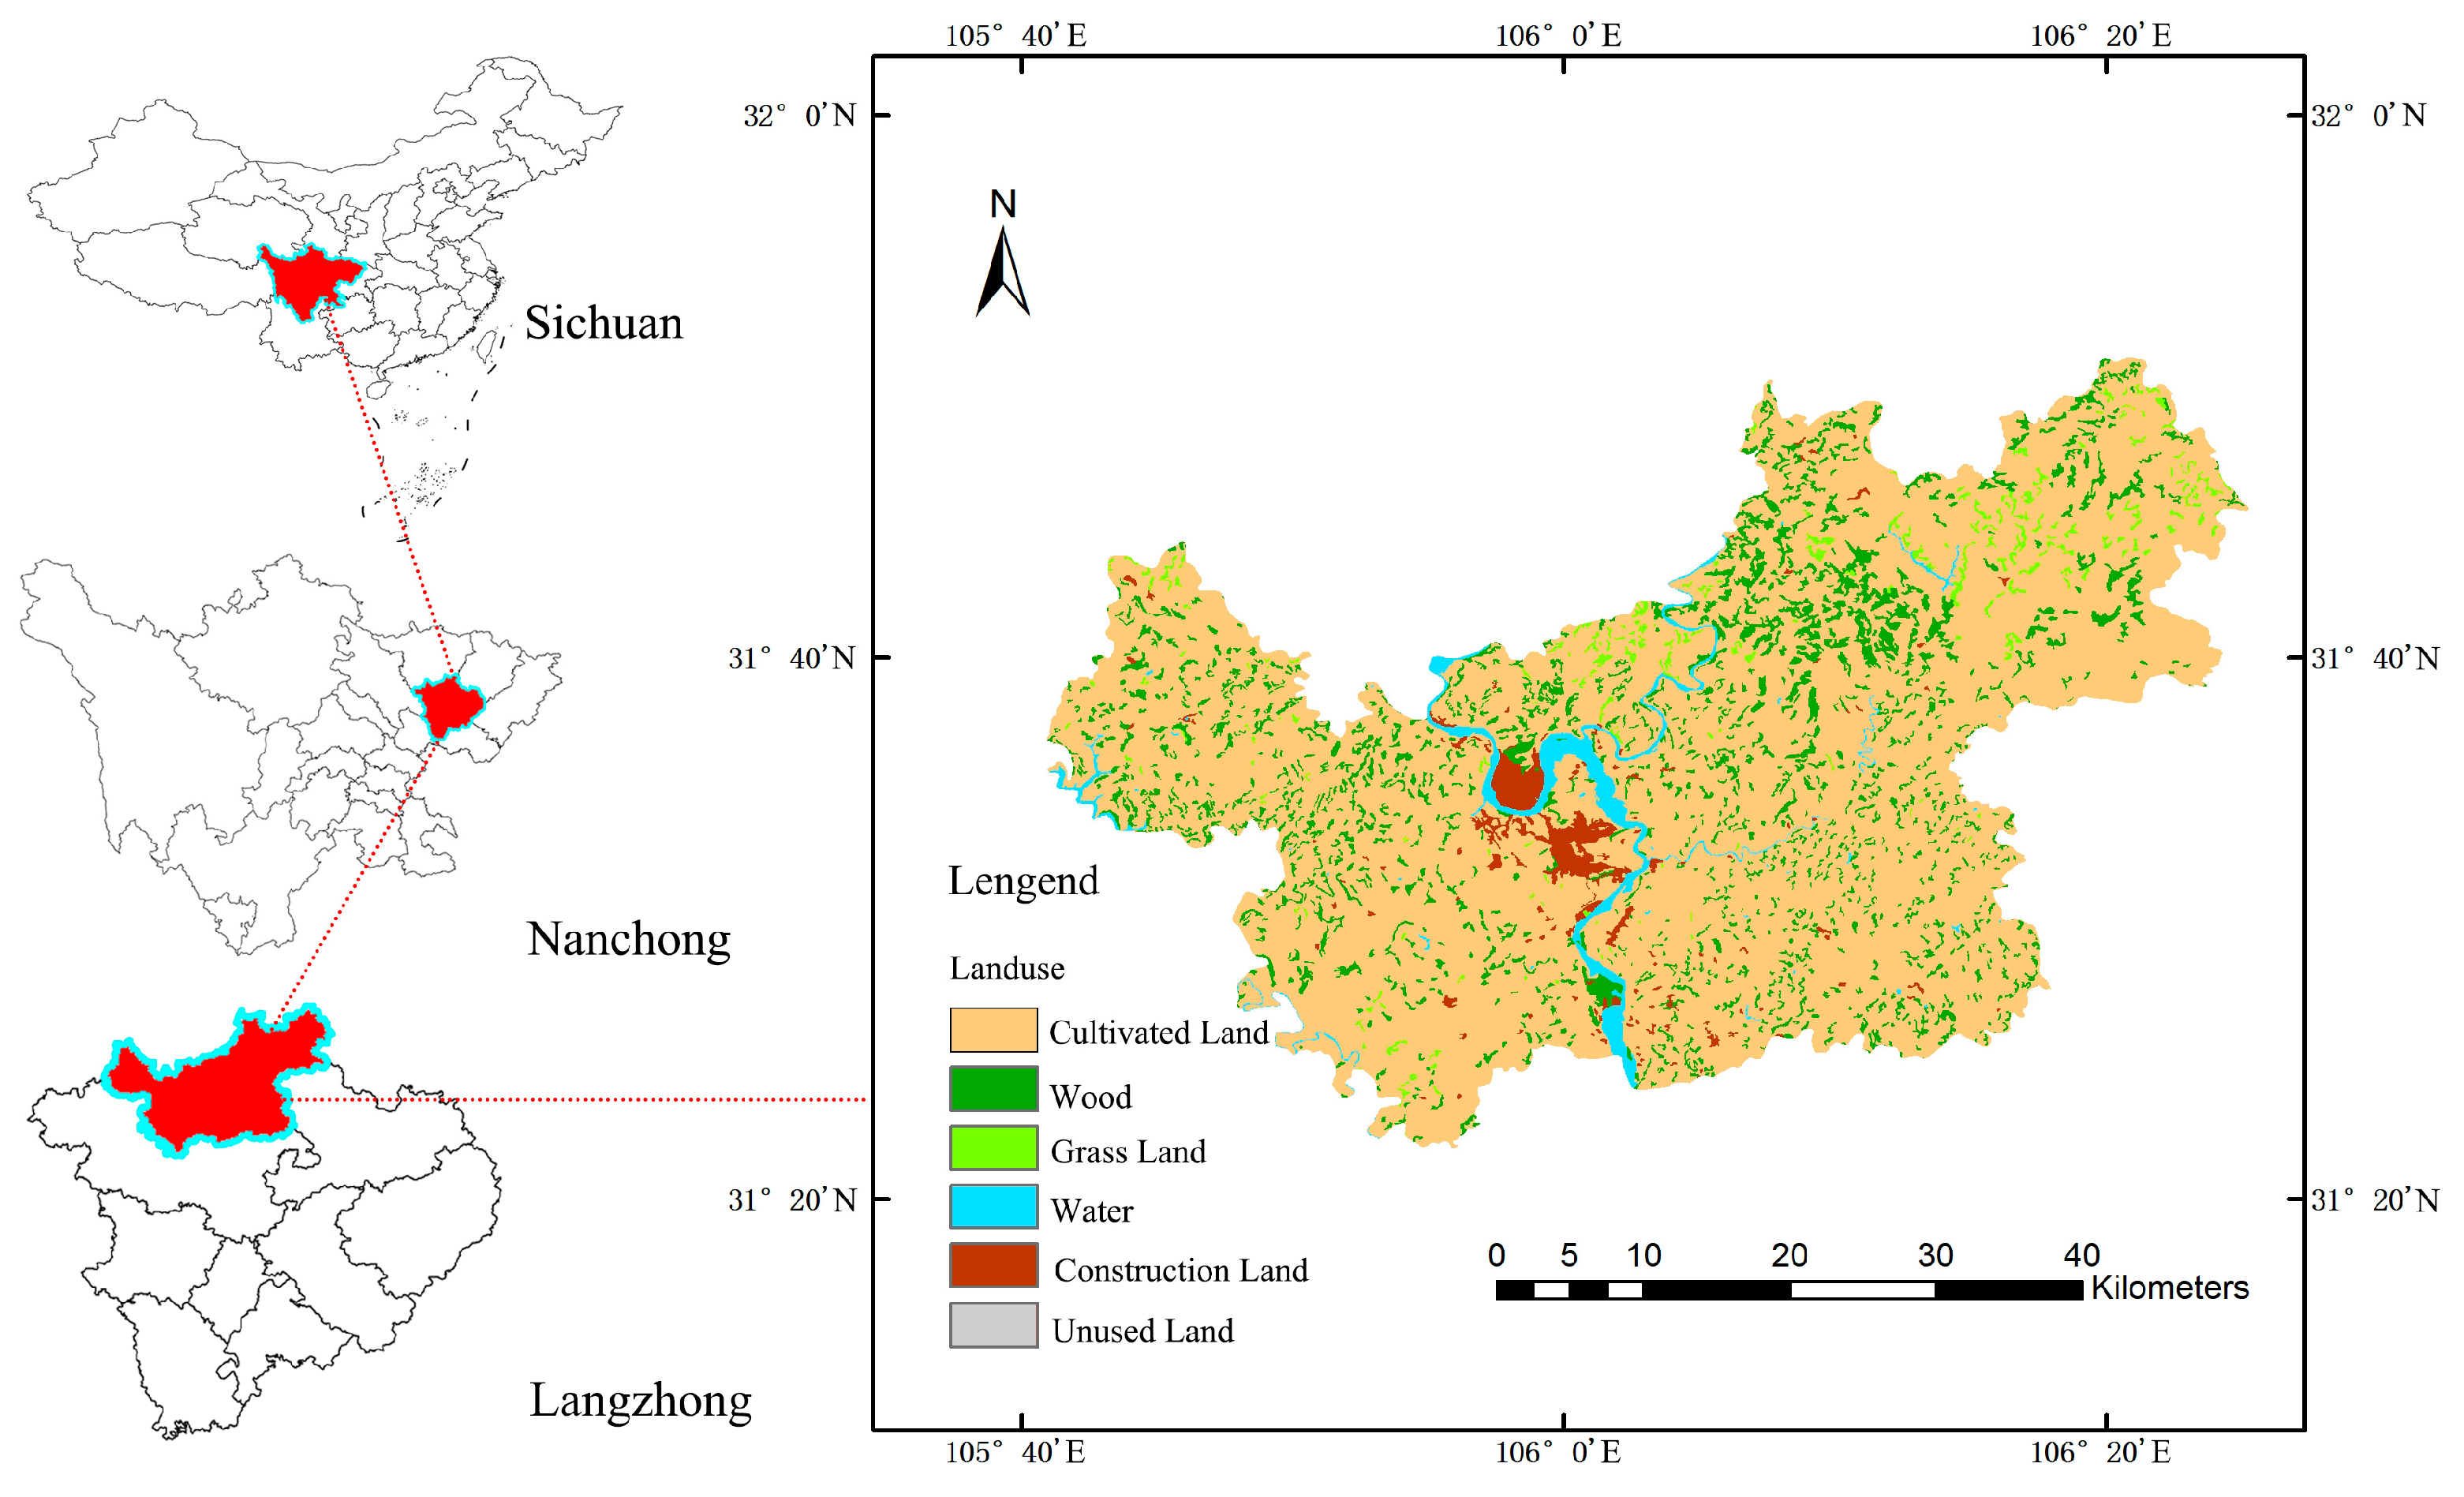
29]. In recent years, against the backdrop of giving priority to economic development, county space has often been faced with problems such as fragmentation of ecological space and the fracture of ecological corridors. How to build and screen important ecological corridors and propose feasible ecological network construction strategies in fragmented landscape patterns is crucial to county ecological restoration. Due to the redundancy of constructing ecological corridors by combining MSPA and MCR, implementation costs are too high and ecological corridors need to be screened. Considering the objectivity of screening, the availability of data, and the convenience of operation, this study introduces the gravity model to classify the importance of corridors on the basis of existing EI network planning methods and proposes to construct a quantitative method system for identifying ecological source areas based on “MSPA + connectivity evaluation”, extracting important ecological corridors based on “MCR + gravity model”, and optimizing corridors and identifying ecological strategic points based on “network structure evaluation”. Langzhong county in Sichuan province of China was taken as a case study to apply this method, and based on the spatial pattern of EI networks and the results of gravity model analysis, a progressive corridor construction scheme and a differentiated ecological zoning restoration strategy are proposed. We hope that this study can provide inspiration for the study of county ecological network construction methods and restoration strategies.

2. Materials and Methods

2.1. Study Area

Langzhong County, a county-level city nouth of Nanchong City, Sichuan Province, is located in the northern edge of the Sichuan Basin and the middle and upper reaches of the Jialing River. Moreover, it is between the east longitudes 105°41′–106°24′ and the north latitudes 31°22′–31°51′. Covering an area of 1878 square kilometers, Langzhong County has a resident population of 622,300. Additionally, it is dominated by low mountains and deep hills in Langzhong County. The main stream of the Jialing River and the four tributaries of Baixi, Donghe, Gouxi, and Xihe pass through Langzhong County. Due to its fertile land, mild climate, abundant rainfall, and moderate illumination, Langzhong County’s main land type is cultivated land, and, as determined by the state and Sichuan Province, it focuses on commodity grain production, sericulture, and cotton production. In addition, the county is abundant in animals and plants and various natural resources, including leopards, peregrine falcons, giant salamanders, ginkgoes, red bean trees, and nanmus. The urban construction land in Langzhong County is mainly distributed along the Jialing River and the ancient city of Langzhong located in the urban area is an important tourist destination in northeast Sichuan. For the past few years, Langzhong has shown rapid economic development. Simultaneously, reclamation of cultivated land, the increase in road networks, and urban construction have all led to the reduction, disappearance, and fragmentation of natural ecological patches in Langzhong County (Figure 1). As the Prime Farmland in Langzhong County cannot be encroached upon, it is unrealistic to restore and expand the ecological space in a large area. Hence, EI network construction and landscape connectivity improvements are feasible paths to protect ecological barriers and improve ecological services.

2.2. Data Sources and Study Framework

The data employed in this study include remote sensing monitoring data of land use in Langzhong in 2020 (the accuracy is 30 m × 30 m), road traffic data, elevation and slope data, Urban Master Plan data, and a compilation of basic data. The land-use data comes from the website of the Resources and Environmental Science and Data Center of Chinese Academy of Sciences (http://www.resdc.cn/Default.aspx) (accessed on 15 August 2021), the elevation and slope data sources come from the DEM digital elevation data of Geospatial Data Cloud (https://www.gscloud.cn/) (accessed on 12 July 2021), and road traffic data are obtained from Langzhong Natural Resources and Planning Bureau.
Taking Langzhong County, Sichuan Province as the study area, the core patches in Langzhong County were identified with the MSPA method and the ecological sources of the study area were selected based on patch area and importance. The potential corridor path was generated by adopting the minimum cumulative resistance (MCR) model and high relative importance was selected as the EI corridor by applying the gravity model. Finally, the EI network was optimized with a network connectivity index and stepping stone patches and ecological breakpoints were identified (Figure 2). The study results provide reference for the delineation of ecological protection red lines and ecological network construction in Langzhong County, propel ecological civilization construction and biodiversity protection in this area, and also have certain reference value for EI network construction in other counties.

2.3. Methods

2.3.1. Ecological Source Identification Based on MSPA and Patch Importance Index

EI concentrates on ecological conservation functions such as water source regulation and purification and biodiversity protection. As cultivated land is mainly used for food supply, its ecological conservation function is limited. Hence, in GIS, forest, grass, and water were taken as the prospects with other land use types as the background, and the data grid size was 30 m × 30 m in this study. The prospects were divided into seven types using Guidos software [30]. Considering the theory of landscape ecology, there are many elements of landscape patterns that affect the processes and functions of landscape ecology, among which patch area and connectivity are the important indexes affecting ecological service ability. Conefor software was used to calculate patch landscape connectivity [30]. Based on the key species and study scale, in Conefor software, the edge width was set to 30 m, the maximum dispersal distance was determined to be 2.5 km after repeated tests [31], and the connectivity probability was set to 0.5 [32]. Ecological sources were screened and graded based on the patch area index, possible connectivity index (PC), and overall connectivity index (IIC) [32]. The calculation formulas were as follows (the larger the value, the higher the connectivity):
P C = i = 1 n j = 1 n a i a j p i j * A L 2
where n refers to the number of patches, ai and aj are divided into the areas of patches i and j, respectively, AL represents the total landscape area, and p i j * denotes the maximum probability of species dispersing in patches i and j.
I I C = i = 1 j = 1 a i a j 1 + n l i j A L 2
where n refers to the total number of patches, ai and aj represent the areas of patches i and j, respectively, nlij denotes the number of connections between patches i and j, and AL represents the total area of the study area.
The importance of ecological sources in the whole network connectivity, namely dpc and dIIC, was determined by calculating the patch importance index with the following formula:
d i = I I I × 100 %
where I represents the index PC or IIC of patches and I’ denotes the PC and IIC after removing patches. The higher the value, the higher the core position of the ecological source.
It was also necessary to include scenic spots, nature reserves, various statutory parks, and cultural landscapes in the set of ecological sources. These areas have been demonstrated to be important ecological sources.

2.3.2. Identification of Potential Ecological Corridor Paths Based on MCR Model

Ecological corridor construction aimed at strengthening the connectivity of ecological sources and reducing the influence of surface cover resistance on ecological flow movement. Ecological flow movement was affected by two factors: the natural environment and the human social environment. Different types of land use generated different topographies, different ecological suitabilities, different habitat-providing capacities, and different interference degrees, thus causing different resistances on ecological flow movement [33]. The construction of the resistance surface reflected the interference degree of human activities on species migration and ecological flow in the plane space. As for different land-use types, there were great differences in the diffusion of biology, material, energy, and information [34]. Resistance factors were divided into natural factors (including elevation and slope), human factors (including distance from various traffic roads, industrial and mining land, and construction land), and comprehensive factors (including land-use type and vegetation-cover index). By superimposing the weights of various factors, a comprehensive resistance surface was formed [35,36] (Table 1).
Through a combination of the actual species with the geographical and geomorphological characteristics of the study area, the spatial resistance surface was constructed regarding topography (as Langzhong County is located in the upper-middle reaches of the Jialing River Basin characterized by low mountains and deep hills, and the elevation has little effect on the flow of animals, plants, and ecological processes, the slope was selected as the core factor among the natural topographic elements), landscape type, and distance from built-up areas as the factors and the basic resistance values were assigned to different factors by referring to existing studies [17,25,37] (Table 1). The weight value of the resistance factor was obtained by averaging the expert scoring method and the entropy weight method.
Night light data (NASA website, namely http://reverb.echo.nasa.gov) (accessed on 15 August 2021). effectively represented the regional economic development, urbanization level, and human activity interference factors [38]. To avoid excessive dependence of the resistance surface on subjective experience of the experts, the resistance surface was modified using night light data, thereby increasing its objectivity. For corridor construction, the minimum resistance model was adopted, with the formula as follows [9]:
M C R = F m i n j = n i = m D i j × R i
where F represents the functional relationship, Dij denotes the distance from j ecological source to target landscape element i, and Ri means the resistance of an intermediate point i between j and target point. The potential best contact channel between sources can be simulated based on this formula, under the condition of source and resistance determination, and by employing the cost distance analysis tool in GIS.
In GIS, geometric operation was adopted to extract the geometric center of the ecological source. This geometric center was also taken as the starting point and end point of corridor migration. Based on the comprehensive landscape resistance surface, ArcGIS’s cost path analysis tool was employed to calculate the minimum resistance value between sources, thereby generating the potential corridor-connecting path between two sources. Additionally, by vectorizing the cost path, the spatial distribution of potential EI corridor paths in the study area was obtained preliminarily.

2.3.3. Identification of Important EI Corridor Based on Gravity Model

In the practical construction and protection of ecological corridors, the interconnection of two adjacent ecological sources was not necessary. Under the condition that all ecological sources were directly or indirectly connected and there was a minimum number of ecological corridors maintained, redundant corridors crossing the same habitat patches could be eliminated and then important potential corridors could be identified by applying the gravity model. The importance and effectiveness of potential corridors were characterized by the interaction strength between source areas. The gravity model was used in constructing the interaction matrix between ecological sources. By relying on interaction strength, important ecological corridors were scientifically screened for priority protection and restoration [23,39]. This also provided a more feasible scheme for GI corridor protection and construction in the study area. The formula of the gravity model is shown below:
G a b = N a N b D a b 2 × I P a × l n S a I P a × l n S a L a b L m a x = L m a x 2 l n S a l n S b L a b 2 P a P b
where Gab refers to the interaction force between sources a and b, Na and Nb represent the weight values of the sources, Dab denotes the normalized value of potential corridor resistance between patches a and b, Pa denotes the resistance value of source a, and Sa refers to the area of source a. Moreover, Lab represents the accumulated resistance value of a corridor between sources a and b and Lmax refers to the maximum resistance of all corridors in the study area.

2.3.4. Optimization of EI Network and Identification of Stepping Stone and Breaking Point

Based on the network structure analysis, the EI corridors screened with the gravity model were supplemented and optimized, thus forming a more ideal scheme. The ecological sources were deemed as nodes and the corridors carrying ecological flows were treated as a network structure with a certain connection degree. Following this, by calculating the network spatial connection degree, the functional characteristics of the network were evaluated [40], mainly including three indexes (Table 2).
As a temporary habitat, the quantity, quality, and distribution of stepping stones can greatly affect the time, frequency, and success probability of species migration [41]. Long-distance corridors are not conducive to efficient migration of organisms and connectivity can be increased by adding stepping stones as temporary habitats. According to the landscape ecology theory, larger patch areas and higher proportions of forest land are the factors most conducive to improving biodiversity, so the patches with larger areas and higher proportions of forest land near the long-distance corridors were selected as stepping stones. At the same time, the intersection of EI corridors are the key strategic points of energy, material, and information sink [42]. Combining this information with the practical situation of Langzhong County, the intersection points of three or more EI corridors, as well as the intersection points of EI corridors and rivers, were identified as stepping stones (Figure 3).
If an EI corridor crosses with a traffic corridor, the migration of animals could be hindered in the crossing area and the animals are likely to be hit and killed by vehicles. Blocking and breaking the corridor has a negative impact on circulation of the whole ecological network and also poses hidden dangers to road safety. As a result, by using the intersect tool of GIS, the ecological breakpoints formed by the intersection of corridors and traffic lines were identified as strategic restoration points in Langzhong County (Figure 3).

3. Results

3.1. Ecological Sources Identification Results

In terms of quantity and spatial distribution, the edge of the study area was the dominant type, accounting for 36.44% of the area in the foreground (forest land, grassland, and water area). As the transition area of the core area, it mainly exhibited the edge effect. The core area was the area that provided a biological habitat and ecological services, accounting for 28.26% of the foreground, mainly distributed in the northeast of the research area and the county boundary. The bridge area accounted for 7.99% of the foreground area, and its quantity was low and mainly distributed in the north of the study area, which was not conducive to the diffusion and exchange of organisms and substances in the south. In general, the ecological landscape pattern in the study area was highly fragmented, the connectivity between patches was poor, the quantity of core and bridge areas was small, and the distribution was significantly uneven. The south and central regions of the study area were in urgent need of ecological restoration (Table 3).
The core patches with large areas (excluding Jialing River and its tributaries) and high dPC Values were selected as the ecological sources and 50 core patches were chosen by integrating a field land-use comparison (Table 4). When viewing the spatial distribution, the ecological sources in Langzhong County were unevenly distributed, mainly located in the northeast and southwest edge areas of Langzhong County with the main land use being forest land and water areas. Moreover, the overall layout was scattered and fragmented and there was lack of corridor connection between patches. Furthermore, it was dominated by the construction of county towns in the central part of the county and there were scarce ecological sources in the surrounding areas (Figure 4).

3.2. Construction of Comprehensive Resistance Surface and Extraction of Potential Ecological Corridors

According to the results of resistance surface construction (Figure 5), the areas with higher resistance values in the study area were distributed in the central region, showing a decreasing trend from the central region to surrounding regions. Most of the land in this area was for construction and the human disturbance factors were strong. The areas with low resistance value were mainly distributed in mountainous and hilly areas with abundant woodland and wetland resources. According to the results of the potential corridor paths analysis (Figure 6), the distribution areas of path network secrets were mainly in the southeast corner and southwest region of the county. However, the number of paths was large and too redundant to be directly applied in practice, so further classification and optimization were needed.

3.3. Selection of Important Ecological Corridors

Using Formula (5), the interaction strengths between different ecological sources in the study area were calculated (Table 5). The larger the value, the stronger the interaction strength between ecological sources, the easier the transfer of materials and energy, and the greater the importance of corridor construction between sources. When considering construction costs, potential corridors with gravity values greater than 3.2 were chosen as important corridors. Finally, a total of 94 corridors (Figure 7 and Table 6) with an overall length of 678.47 km were selected, including the corridor between ecological sources No. 27 and No. 28. Such a corridor was an important corridor, which could ensure the connectivity of the regional landscape. Moreover, it had high feasibility due to its large ecological attraction, short distance, low construction cost, small landscape resistance, and convenient material and energy transmission. After screening, important corridors were mainly distributed in the southwest corner of Langzhong County and the middle of the eastern part of the Jialing River, according to linear and net connections mostly, accompanied by linear connections locally. Nevertheless, in the important-corridor network, there was a lack of a large-span corridor running along the east–west direction of the whole region. Moreover, there was no corridor connecting with other ecological sources in the ecological source No. 18. Hence, the network needed to be further optimized.

3.4. EI Network Optimization

3.4.1. Supplements to Important Ecological Corridors

To ensure the good closure and connectivity of the EI network and smooth ecological flow in the eastern and western areas of Langzhong County, 10 potential path corridors with high gravity values, including those connecting ecological source No. 18 with ecological sources No. 2, No. 20, and No. 26 and those connecting ecological source No.47 with ecological sources No. 38 and No. 29, were selected as supplements to the important corridors (Figure 8). As for the optimized EI network, the index α increased from 0.43 to 0.432, β increased from 1.709 to 1.81, and γ increased from 0.591 to 0.625. Through optimization, network connectivity was also improved. Moreover, within the network, there were more corridors connected by a single node and the flow process of material, energy, and information was more efficient and stable.

3.4.2. Identification of Stepping Stones and Ecological Breakpoints

In order to enhance the success rate of species migration, protect biodiversity, and enhance material and energy flow, nine long-distance corridor stepping stones, nine land-based ecological corridor intersection stepping stones, and six land-based and water-based corridor intersection stepping stones were identified (Figure 9). Stepping stones were mainly distributed along the Jialing River and in the eastern part of the county where the corridor density was low, which helped to improve landscape connectivity. Eighteen ecological breakpoints were identified where the El corridor was cut by expressways, railways, national highways, and provincial highways (Figure 9). The breakpoints were concentrated in the northern and southwestern corners of the county, mainly cut off by railways and expressways and these needed to be repaired through the construction of targeted biological bridges.

4. Discussion and Suggestions for Ecological Pattern Optimization

4.1. Gradual Construction of EI Network Based on Importance

During the actual corridor restoration, prior consideration should be given to the ecological sources with larger areas and greater patch importance, namely the corridors with high gravity values and nearby stepping stones and breaking points should be repaired preferentially. According to our results, EI corridors were classified according to a gravity model. Through the quantile classification method in GIS, the ecological corridors were divided into three grades (Figure 10). The classification of EI networks in Langzhong County had Circle layer characteristics, with the primary corridors located in the area with dense ecological sources, the secondary corridors radiating outward around the primary corridors, and the third-level and fourth-level corridors mainly connecting with long-distance patches to form an outer ring. Considering the importance of the corridors, a gradual construction mode is suggested to apply to ecological restoration with corridor width considered. According to relevant studies, when the width of an ecological corridor reaches 30–120 m, the needs of animal and plant migration and species transmission can be satisfied [43]. Moreover, the width of corridor buffers should be selected based on current land-use conditions, thereby avoiding the excessive proportion of construction land and cultivated land in corridors. During the actual construction of EI networks, there may arise conflicts between land planning and utilization and the construction of potential ecological corridors, as well as other conflicts. Hence, reasonable measures should be taken to construct ecological network spaces in accordance with the practical situation.
As for EI network planning and design, the land used is recommended to be dominated by forest land and supplemented by grassland, thus forming a three-dimensional vegetation system of forests, shrubs, and grasses. This forest network has high connectivity and is convenient for the migration and transformation of the population and nutrients in the system. Furthermore, it has greater buffering and stability characteristics in regard to changes in the external environment. Hence, the ecological function of the system is enhanced and the protection function of the forest network is promoted [44]. Moreover, the EI network embedded in the farmland matrix will not only block wind and sand and conserve water, but also provide shade for rural recreational activities. The selection of plant types and planting modes was suggested to be determined according to the lighting, shading, and wind proofing needs of crops, forming various types of ecological corridors such as dense forest belts, sparse forest belts, shrubs, and grass belts (Figure 11).
At the intersections of ecological corridors and water systems, it is necessary to strengthen wetland construction, increase the scale of green space, and design shoals and ponds. Additionally, the area of the intersection of ecological corridors and ecological corridors themselves must be expanded, thereby forming small and medium-sized habitats. As for ecological breakpoints, connectivity should be repaired by building underground passages, tunnels, flyovers, etc. (Figure 12).

4.2. Proposal of the Management and Control Strategy of Regional Ecological Patterns

Based on the results of EI network analysis and by integrating the county development pattern, it is proposed to construct Langzhong County’s regional ecological pattern with three vertical and two horizontal ecological belts, four ecological control districts, and six clusters of EI networks (Figure 13). Furthermore, different ecological management and control measures should be taken at the four districts as follows.
(1) Livable town construction area: Attention should be paid to the correlation between the ecological patches inside and outside construction lands, and the urban green space system should be integrated with the county’s ecological structure. Furthermore, the utilization rate of land in built-up areas needs to be improved scientifically. Additionally, the living environment and land-use efficiency need to be optimized. (2) Western eco-tourism development area: The development of afforestation, artificial grasslands, and grassland improvement should be encouraged actively. As for existing sloping farmlands, positive measures should be taken to encourage the gradual transformation from farmland to forests and grasslands or to stimulate the building of terraces. Moreover, natural scenery resources with cultural heritage resources (including some ancient villages, religious deposits, ancient buildings, etc.) should be combined in the region. The cultural heritage and its surrounding scenery form a unique landscape. It is necessary to preserve and integrate the cultural landscape in the EI network construction. On this basis, the slow-moving greenway can be designed to connect the cultural heritage sites in series to form eco-tourism routes. (3) Northeastern ecological protection area: It is necessary to focus on ecological environment protection, maintain the relative stability of habitats, and repair the long-span corridor fault zone. (4) Southeastern ecological restoration area: It is necessary to concentrate on the restoration of EI corridor networks separated by patches of agricultural land, attach importance to the remediation and restoration of cross-ecological nodes between cultivated land and forest land, and maintain the quantity of farmland and basic soil fertility. Moreover, it is forbidden to cultivate crops on steep slopes with a slope greater than 25°. Furthermore, it is advocated to prepare land for afforestation on slopes, nurture young forests, and reclaim economic trees such as camellia oleifera and tung trees. In addition, soil and water conservation measures must be taken to prevent soil erosion and ecological rural tourism should be developed by combining ancient towns and temples.

5. Conclusions

In view of ecological space optimization and control, there is a relatively clear pattern and framework in top-level design (including double evaluation of provincial land space and delineation of an ecological red line) and bottom-level implementation (involving land remediation measures and key ecological restoration projects). Nevertheless, identification of ecological restoration units, spatial layout of ecological facilities, and control methods in the middle level are still under discussion. By constructing the county EI network, better guidance can be provided to site selection, implementation, and construction of ecological restoration projects. To reduce subjective interference in ecological source selection and determine the optimal path and spatial position of ecological corridors, this paper considered Langzhong County, Sichuan Province as the study area, used MSPA and the MCR-Gravity Model in building the EI network of Langzhong County, and proposed strategies for ecological source protection, corridors, and stepping-stone construction as well as regional ecological pattern restoration in Langzhong County. This paper has the objectives of optimizing the ecological background of Langzhong County, protecting the biodiversity of the county, and enhancing the ecosystem services, which has direct significance to ecological security of the middle and upper reaches of the southwest river basin.
The study conclusions are as follows:
This study recommends plans to protect 50 ecological sources, mainly located in the northeast and southwest marginal areas of Langzhong County. The land-use types give priority to woodland supplemented by grassland and cultivated land. A total of 105 ecological corridors are proposed to be constructed, classified into three grades based on gravity values. The primary corridors are located in areas with dense ecological sources, the secondary corridors radiate outward around the primary corridors, and the third-level and fourth-level corridors mainly connect with long-distance patches to form an outer ring. Moreover, this study recommends plans to construct nine stepping-stone patches in long-distance corridors, nine stepping stones at the intersections of land ecological corridors, and six stepping stones at the intersections of land and water corridors (by planting wetlands and designing shoals and deep ponds for upgrading), thereby improving the success rate of species migration, protecting biodiversity, and enhancing the smoothness of material and energy flow. Additionally, this study recommends plans to repair 18 ecological breakpoints of EI corridors cut off by highways, railways, national highways, and provincial highways and restore connectivity by constructing underground passages, tunnels, and flyovers. Generally, it proposes protective countermeasures according to a regional ecological pattern with three vertical and two horizontal ecological belts, four ecological control districts, and six clusters of EI networks.
As for this study, there are still several aspects for further discussion as follows: (1) Different study scales have different influences on the results. To maintain small patches with good connectivity, this study adopts a study granularity of 30 × 30 m based on the related literature [45], and future studies at different scales and granularities need to be conducted. (2) This study focuses on the spatial distribution of an EI network. Corridor width should be considered in future planning and design. A buffer zone with an appropriate width should be built according to corridor route selection. Additionally, the current ecological space can be fully utilized, thus improving construction efficiency. (3) The study on the analysis and evaluation of farmland quality and supply service capacity is still shallow. Hence, it is necessary to further explore the action mechanism and coping strategies of each ecological function of GI at the city level.

Author Contributions

All authors participated in the development of this study. Conceptualization, M.F. and W.Z.; methodology, M.F.; software, M.F.; validation, T.Z.; formal analysis, M.F.; investigation, T.Z.; resources, W.Z.; data curation, M.F.; writing—original draft preparation, M.F.; writing—review and editing, W.Z.; visualization, T.Z.; supervision, W.Z.; project administration, W.Z.; funding acquisition, W.Z. All authors have read and agreed to the published version of the manuscript.

Funding

This research was funded by the National Nature Science Foundation of China (NSFC) project (51678086).

Institutional Review Board Statement

Not applicable.

Informed Consent Statement

Informed consent was obtained from all subjects involved in the study.

Data Availability Statement

Raw data are available upon reasonable request addressed to the corresponding author.

Acknowledgments

We are thankful to the Key Laboratory of New Technology for Construction of Cities in Mountain Area, Chongqing University. The authors would like to thank the reviewers and editors for their very helpful and constructive reviews of this manuscript.

Conflicts of Interest

The authors declare no conflict of interest.

References

  1. Shan, N.; Zhou, K.X.; Pan, Y.; Tang, F.K. Research advances in design methods of biodiversity conservation corridors. Chin. J. Acta Ecologica Sinica 2019, 39, 411–420. [Google Scholar]
  2. Lindborg, R.; Helm, A.; Bommarco, R. Effect of habitat area and isolation on plant trait distribution in European forests and grasslands. Ecography 2012, 4, 356–363. [Google Scholar] [CrossRef]
  3. Qiao, Q.; Lu, M.; Yuan, H. The Concept and Practice of Ecological Infrastructure The Review and Prospect of the Related Study of Graduate School of Landscape Architecture, Peking University. Chin. J. Landsc. Archit. 2013, 2, 38–44. [Google Scholar]
  4. Liu, H.L.; Li, D.H.; Han, X.L. Review of Ecological Infrastructure: Concept and Development. City Plan. Rev. 2005, 1, 70–75. [Google Scholar]
  5. Hilty, J.; Worboys, G.L.; Keeley, A.; Woodley, S.; Tabor, G.M. Guidelines for Conserving Connectivity Through Ecological Networks and Corridors, IUCN WCPA. Best Practice Guidelines for Protected Area Managers Series (No. 30); IUCN, lnternational Union for Conservation of Nature: Gland, Switzerland, 2020. [Google Scholar]
  6. Ahern, J. From fail-safe to safe-to-fail: Sustainability and resilience in the new urban world. Landsc. Urban Plan. 2011, 100, 341–343. [Google Scholar] [CrossRef]
  7. Xu, L.; Zhang, Z.; Tan, G.; Zhou, J.; Wang, Y. Analysis on the Evolution and Resilience of Ecological Network Structure in Wuhan Metropolitan Area. Sustainability 2022, 14, 8580. [Google Scholar] [CrossRef]
  8. Zhao, W.M.; Feng, M.; Li, Y.Y.; Deng, Y. Research on Green Infrastructure Planning of Mountainous Cities From the Perspective of Ecological Civilization: Taking Jiulongpo New Town in Chonqing as an Example. Chin. J. City Plan. Rev. 2021, 45, 91–103. [Google Scholar]
  9. Knaapen, J.P.; Scheffer, M.; Harms, B. Estimating habitat isolation in landscape planning. Landsc. Urban Plan. 1992, 23, 1–16. [Google Scholar] [CrossRef]
  10. Ma, K.M.; Fu, B.J.; Li, X.Y.; Guan, W.B. The regional pattern for ecological security (RPES): The concept and theoretical basis. Chin. J. Acta Ecol. Sin. 2004, 4, 761–768. [Google Scholar]
  11. Wu, J.G. Landscape Ecology: Pattern, Process, Scale and Grade; Higher Education Press: Beijing, China, 2007. [Google Scholar]
  12. Kong, F.H.; Yin, H.W. Developing Green Space Ecological Networks in Jinan City. Acta Ecol. Sin. 2008, 4, 1711–1719. [Google Scholar]
  13. Peng, J.; Yang, Y.; Xie, P.; Liu, Y.X. Zoning for the construction of green space ecological networks in Guangdong Province based on the supply and demand of ecosystem services. Chin. J. Acta Ecol. Sin. 2017, 37, 4562–4572. [Google Scholar]
  14. Zhu, J.; Su, J.; Yin, H.W.; Kong, F.H. Xuzhou ecological network construction based on comprehensive identification of source areas and multi-scale nesting. Chin. J. J. Nat. Resour. 2020, 35, 1986–2001. [Google Scholar]
  15. Li, Q.Q.; Jin, X.B.; Zhang, X.L.; Han, B.; Li, H.B.; Zhou, Y.K. Comparison and evaluation of the ecological network construction methods based on principles of landscape ecology. Chin. J. Acta Ecol. Sin. 2023, 3, 1–13. [Google Scholar]
  16. Ferreira, J.C.; Monteiro, R.; Silva, V.R. Planning a Green Infrastructure Network from Theory to Practice: The Case Study of Setúbal, Portugal. Sustainability 2021, 14, 8451. [Google Scholar] [CrossRef]
  17. Xu, F.; Yin, H.W.; Kong, F.H.; Xu, J.G. Developing ecological networks based on mspa and the least-cost path method: Acase study in bazhong western new district. Chin. J. Acta Ecol. Sin. 2015, 35, 6425–6434. [Google Scholar]
  18. Wang, Z.; Shi, P.; Zhang, X.; Tong, H.; Zhang, W.; Liu, Y. Research on Landscape Pattern Construction and Ecological Restoration of Jiuquan City Based on Ecological Security Evaluation. Sustainability 2021, 13, 5732. [Google Scholar] [CrossRef]
  19. Budd, W.W. Land mosaics: The ecology of landscapes and regions. Landsc. Urban Plan. 1995, 36, 229–231. [Google Scholar] [CrossRef]
  20. Wang, S.; Wu, M.; Hu, M.; Fan, C.; Wang, T.; Xia, B. Promoting landscape connectivity of highly urbanized area: An ecological network approach. Ecol. Indic. 2021, 125, 107487. [Google Scholar] [CrossRef]
  21. Peng, J.; Yang, Y.; Liu, Y.; Du, Y.; Meersmans, J.; Qiu, S. Linking ecosystem services and circuit theory to identify ecological security patterns. Sci. Total Environ. 2018, 644, 781–790. [Google Scholar] [CrossRef]
  22. Yan, S.Y.; Yang, H.H.; Wang, X.H. Study on the Ecological Networks Construction in Chongqing. Chin. J. Chin. Landsc. Archit. 2018, 34, 57–63. [Google Scholar]
  23. Liu, J.J.; Chen, J.R.; Lai, Y.N.; Luo, B.Y.; Zhao, F.; Du, Q. Improvement and application for ecological networks using landscape pattern and connectivity methods. Chin. J. Chin. J. Appl. Ecol. 2019, 30, 3108–3118. [Google Scholar]
  24. Gu, F.; Huang, Y.X.; Chen, C.M.; Cheng, D.L.; Guo, J.L. Construction and optimization of ecological network for nature reserves in Fujian Province, China. Chin. J. Chin. J. Appl. Ecol. 2017, 28, 1013–1020. [Google Scholar]
  25. Wang, X.R.; Wan, R.R.; Pan, P.P. Construction and adjustment of ecological security pattern based on MSPA-MCR Model in Taihu Lake Basin. Chin. J. Acta Ecol. Sin. 2022, 42, 1968–1980. [Google Scholar]
  26. Yu, Y.P.; Yin, H.W.; Kong, F.H.; Wang, J.J.; Xu, W.B. Analysis of the temporal and spatial pattern of the green infrastructure network in Nan-jing, based on MSPA. Chin. J. Ecol. 2016, 35, 1608–1616. [Google Scholar]
  27. Zhang, X.; Wang, X.; Zhang, C.; Zhai, J. Development of a cross-scale landscape infrastructure network guided by the new Jiangnan watertown urbanism: A case study of the ecological green integration demonstration zone in the Yangtze River Delta, China. Ecol. Indic. 2022, 143, 109317. [Google Scholar] [CrossRef]
  28. Zhou, S.; Song, Y.; Li, Y.; Wang, J.; Zhang, L. Construction of Ecological Security Pattern for Plateau Lake Based on MSPA–MCR Model: A Case Study of Dianchi Lake Area. Sustainability 2022, 14, 14532. [Google Scholar] [CrossRef]
  29. Nie, W.; Shi, Y.; Siaw, M.J.; Yang, F.; Wu, R.; Wu, X.; Zheng, X.; Bao, Z. Constructing and optimizing ecological network at county and town Scale: The case of Anji County, China. Ecol. Indic. 2021, 132, 108294. [Google Scholar] [CrossRef]
  30. Vogt, P.; Riitters, K.H.; Iwanowski, M.; Estreguil, C.; Kozak, J.; Soille, P. Mapping landscape corridors. Ecol. Indic. 2007, 7, 481–488. [Google Scholar] [CrossRef]
  31. Yu, Y.P.; Yin, H.W.; Kong, F.H.; Wang, J.J.; Xu, W.B. Scale effect of Nanjing urban green infrastructure network pattern and connectivity analysis. Chin. J. Appl. Ecol. 2016, 27, 2119–2127. [Google Scholar]
  32. Saura, S.; Torne, J. Conefor Sensinode 2.2: A software package for quantifying the importance of habitat patches for landscape connectivity. Environ. Model. Softw. 2009, 24, 135–139. [Google Scholar] [CrossRef]
  33. Li, Y.Y.; Zhang, Y.Z.; Jiang, Z.Y.; Guo, C.X.; Zhao, M.Y.; Yang, Z.G.; Guo, M.Y.; Wu, B.Y.; Chen, Q.L. Integrating morphological spatial pattern analysis and the minimal cumulative resistance model to optimize urban ecological networks: A case study in Shenzhen City, China. Ecol. Process 2021, 10, 15. [Google Scholar] [CrossRef]
  34. Dai, L.; Liu, Y.; Luo, X. Integrating the MCR and DOI models to construct an ecological security network for the urban agglomeration around Poyang Lake, China. Sci. Total Environ. 2020, 754, 141868. [Google Scholar] [CrossRef] [PubMed]
  35. Liang, C.; Zeng, J.; Zhang, R.C.; Wang, Q.W. Connecting urban area with rural hinterland: A stepwise ecological security network construction approach in the urban–rural fringe. Ecol. Indic. 2022, 138, 108794. [Google Scholar] [CrossRef]
  36. Yu, Q.; Yue, D.P.; Wang, J. The optimization of urban ecological infrastructure network based on the changes of county landscape patterns: A typical case study of ecological fragile zone located at Deng Kou (Inner Mongolia). J. Clean. Prod. 2017, 163, 54–67. [Google Scholar] [CrossRef]
  37. Xie, H.W.; Zhou, N.X.; Guan, J. The construction and optimization of ecological networks based on natural heritage sites in Jiangsu Province. Chin. J. Acta Ecol. Sin. 2014, 34, 6692–6700. [Google Scholar]
  38. Zhao, M.; Zhou, Y.; Li, X.; Cao, W.; He, C.; Yu, B.; Li, X.; Elvidge, C.D.; Cheng, W.; Zhou, C. Applications of Satellite Remote Sensing of Nighttime Light Observations: Advances, Challenges, and Perspectives. Remote Sens. 2019, 11, 1971. [Google Scholar] [CrossRef]
  39. Chen, Z.A.; Kuang, D.; Wei, X.J.; Zhang, L.T. Developing ecological networks based on MSPA and MCR: A case study in Yujiang County. Chin. J. Resour. Environ. Yangtze River Basin 2017, 26, 1199–1207. [Google Scholar]
  40. Cantwell, M.D.; Forman, R. Landscape graphs: Ecological modeling with graph theory to detect configurations common to diverse landscapes. Landsc. Ecol. 1993, 8, 239–255. [Google Scholar] [CrossRef]
  41. Forman, R.T.T. Land Mosaics: The Ecology of Landscapes and Region; Cambridge University Press: Cambridge, UK, 1999. [Google Scholar]
  42. Ahern, J. Greenways as a planning strategy. Landsc. Urban Plan. 1995, 33, 131–155. [Google Scholar] [CrossRef]
  43. Yang, M.; Liao, Z.Z.; Shi, L.Y. Multi-scale ecological infrastructure planning in Xiong’an new area. Journal of Ecology, Multi-scale ecological infrastructure planning of Xiong’an New Area. Acta Ecol. Sin. 2020, 40, 7123–7131. [Google Scholar]
  44. Zeng, D.H.; Jiang, F.Q.; Fan, Z.P. Sustainable management for farmland shelterbeltss. Chin. J. Appl. Ecol. 2002, 13, 747–749. [Google Scholar]
  45. Zhang, M.L.; Qi, Y.P.; Zhang, L.; Chen, Y.; Zhou, Y.P.; Chen, Y.H.; Wang, S.T. Identification and Analysis of Ecological Nodes Based on Linkage Mapper and Granularity Inverse Method in the Middle and Northern Sections of Taihang Mountain: A Case Study of Fuping County, Hebei Province. Chin. J. J. Ecol. Rural. Environ. 2020, 36, 1569–1578. [Google Scholar]
Figure 1. Study scope, location, and general situation.
Sustainability 15 08478 g001
Figure 2. Research framework.
Sustainability 15 08478 g002
Figure 3. Identification of stepping stones and ecological breaking points.
Sustainability 15 08478 g003
Figure 4. MSPA analysis results in Langzhong (left); screening results of ecological sources in Langzhong (right).
Sustainability 15 08478 g004
Figure 5. Comprehensive landscape resistance surface.
Sustainability 15 08478 g005
Figure 6. Corridor paths generation based on MCR.
Sustainability 15 08478 g006
Figure 7. Screening EI corridors based on gravity model.
Sustainability 15 08478 g007
Figure 8. Optimized EI network in Langzhong.
Sustainability 15 08478 g008
Figure 9. Patch repair of Langzhong stepping stones (left); restoration of ecological breakpoints in Langzhong (right).
Sustainability 15 08478 g009
Figure 10. Importance classification of EI corridors in Langzhong County.
Sustainability 15 08478 g010
Figure 11. Field forest belt formed according to EI corridor design.
Sustainability 15 08478 g011
Figure 12. Design of stepping stones and ecological breaking points.
Sustainability 15 08478 g012
Figure 13. EI network and ecological pattern optimization strategy in Langzhong.
Sustainability 15 08478 g013
Table 1. Langzhong County resistance surface assignment.
Resistance FactorGrading IndexEvaluation
Slope (0.19)<8°5
8–15°10
15–25°20
25–45°60
>45°100
Land use type (0.45)woodland3
farmland100
Grasslands/shrubs30
land for construction1000
waters600
Distance from construction land (0.1)0–1000 m100
1000–3000 m70
3000–5000 m50
>5000 m5
Distance from road (0.16)0–100 m100
100–250 m60
>250 m5
Distance from water body (0.1)>2000 m100
500–2000 m50
200–500 m30
0–200 m5
Table 2. Network Connectivity Index Evaluation.
Index Meaning Formula Numerical IntervalEcological Function
α indexNetwork closure refers to the degree of loop in the network. α = L V + 1 2 V 5 Between 0 and 1 wherein 0 means there is no loop and 1 means the loop reaches its maximum.The loop can improve the connectivity of the landscape inside the network.
Β indexNetwork point-line rate refers to the average number of connections of each node in the network. β = L V Between 0 and 3 wherein the higher the value, the better the network will be from no network to tree network to grid network to the most perfect network.Reflect the complexity of the network structure: the more complex, the stronger the stability.
Γ indexNetwork connectivity refers to the degree to which all nodes in the network are connected. γ = L 3 V 2 Between 0 and 1 wherein 0 means that no nodes are connected and 1 means that nodes are connected to each other.Reflect the connectivity between nodes.
Note: In the formula, L is the number of corridors and V is the number of nodes.
Table 3. MSPA analysis results.
Classify Core Bridge Isolated IslandRing RoadGap Edge Branch
Area (km2) 80.33 22.70 23.20 0.57 0.15 103.57 53.67
Proportion28.26%7.99%8.16%0.20%0.05%36.44%18.89%
Total ratio4.287%1.212%1.238%0.031%0.008%5.527%2.864%
Table 4. The area and connectivity index of ecological sources.
Number dPCdIICdANumber dPCdIICdA
112.5713 5.2359 11.8121 262.0150 0.7183 1.1246
28.7531 2.9423 8.3307 272.0056 0.7204 2.0174
37.5980 2.5233 9.2099 281.9864 0.8638 1.3614
46.6428 2.5232 6.7820 291.9700 0.8196 3.8400
56.3297 1.5917 5.8825 301.9672 0.6028 1.7142
66.0561 1.8171 5.0226 311.9530 0.8158 1.9638
74.5897 1.4830 4.7868 321.8782 0.5190 1.4905
84.4836 2.6367 4.9240 331.8666 0.8575 1.8111
94.3996 1.8048 4.6481 341.8640 0.5888 1.7335
103.9520 1.4689 3.5555 351.7552 0.5302 0.1934
113.6897 1.3324 2.4594 361.7478 0.6072 2.5424
123.3539 0.9777 3.8112 371.7343 0.8116 1.8047
133.1726 1.5922 5.3676 381.7280 0.4988 1.3697
143.1460 0.9807 2.9235 391.6019 0.9652 2.3552
153.0956 0.7555 1.7919 401.5908 0.3359 4.0834
162.8894 1.1007 4.1120 411.4895 0.6644 1.8990
172.8560 1.4604 3.6009 421.4800 0.5922 4.6439
182.7065 1.1933 0.4352 431.4523 0.4693 0.7600
192.5753 2.1142 1.2044 441.4222 0.8828 0.1649
202.5424 0.7368 2.6312 451.4044 0.6922 0.9445
212.3721 0.7168 1.6612 461.4043 0.5171 11.0891
222.3259 0.8200 1.8066 471.3806 0.3987 9.1626
232.0462 0.8586 1.5590 481.3768 0.3988 1.1790
242.0358 0.8878 2.7451 491.3764 0.7496 1.0543
252.0304 0.8240 1.5710 501.3757 0.3325 1.0411
Table 5. Ecological sources interaction force matrix based on gravity model (partial).
Sum Term: GSource ID
Dest ID123456789...
1 2.16 1.72 236.18 36.22 1.46 3.79 14.97 2.27 ...
22.16 25.16 2.70 2.62 9.50 2.01 2.25 1.06 ...
31.72 25.16 2.25 2.20 14.48 2.00 1.78 0.74 ...
4236.18 2.70 2.25 94.13 1.89 5.69 24.50 2.93 ...
536.22 2.62 2.20 94.13 1.98 8.72 78.98 4.07 ...
61.46 9.50 14.48 1.89 1.98 2.83 1.60 0.96 ...
73.79 2.01 2.00 5.69 8.72 2.83 6.94 2.00 ...
814.97 2.25 1.78 24.50 78.98 1.60 6.94 6.66 ...
92.27 1.06 0.74 2.93 4.07 0.96 2.00 6.66 ...
.................................
Table 6. Gravity values of EI corridors selected by gravity model.
Corridor NoGravitational Value GCorridor NoGravitational Value GCorridor NoGravitational Value GCorridor NoGravitational Value G
11080.850 25109.658 4923.869 738.721
2750.717 26100.851 5023.254 747.554
3675.569 2798.244 5122.480 757.544
4619.775 2896.969 5221.776 767.433
5412.146 2994.128 5321.264 777.310
6370.888 3093.158 5421.106 786.940
7317.744 3182.449 5518.892 796.735
8313.401 3278.981 5617.098 806.662
9302.864 3375.255 5715.640 816.493
10236.178 3469.814 5814.968 826.081
11210.476 3566.016 5914.482 835.685
12199.498 3663.941 6014.178 844.257
13188.948 3757.857 6113.924 854.238
14175.693 3856.433 6213.722 864.126
15163.056 3943.183 6313.164 873.996
16156.658 4043.113 6413.154 883.791
17154.583 4136.222 6512.683 893.624
18152.772 4236.215 6612.496 903.448
19142.595 4331.646 6711.981 913.439
20139.123 4429.250 6811.727 923.351
21134.836 4525.398 6910.516 933.214
22133.172 4625.163 7010.099 943.202
23129.413 4724.726 7110.004
24120.833 4824.545 729.502
Disclaimer/Publisher’s Note: The statements, opinions and data contained in all publications are solely those of the individual author(s) and contributor(s) and not of MDPI and/or the editor(s). MDPI and/or the editor(s) disclaim responsibility for any injury to people or property resulting from any ideas, methods, instructions or products referred to in the content.

