Abstract
The asymmetric level of integration within the European Union (EU) regarding membership in the European Monetary Union (EMU) has resulted in inconsistent responses to crises such as the Great Recession of 2007–2009 and the European sovereign debt crisis of 2010–2013. Furthermore, it has led to varying outcomes of monetary and fiscal policies implemented across EU countries. This paper aims to investigate the impact of monetary and fiscal policies on economic development and employment through the inflation channel in the EU between 2007 and 2015, using Partial Least Squares Structural Equation Modeling (PLS-SEM). The results indicate that the outcomes of monetary policy have been mixed between EMU and non-EMU countries, resulting in different measures and negative spillover effects of the European Central Bank’s (ECB) policy on countries outside of the EMU. Meanwhile, the ability of fiscal policy to lower inflation and boost economic growth and employment has been limited, which means that the impact of fiscal policy on both economic development and employment and inflation has been minor. Based on the findings of this study, there should be better coordination of monetary and fiscal policies at the EU level to support the macroeconomic stability of the Union during times of crisis.
1. Introduction
The appearance of new crises, such as the Great Recession of 2007–2009 and the European sovereign debt crisis of 2010–2013, requires changes not only in the formulation of fiscal and monetary policies but also in their coordination. The impact of the global economic and financial crisis of 2007–2009 should serve as a lesson for improving general economic policy and developing mechanisms to quickly detect the first signs of potential crises [1]. Available data on monetary and fiscal trends point to significant opportunities for improving the coordination of these policies in EU economies. This view is shared by many international organizations and economic analysts. For example, the OECD [2] and the IMF [3] have highlighted in their reports that fiscal and structural policies should support an over-stretched monetary policy, provided that there is room to maneuver in the fiscal area.
Moreover, in the context of the proposed Sustainable Development Goals (SDGs), the UN emphasizes the importance of sustainable monetary and fiscal policies to enable economic recovery from global disruptions. Financial inclusion is also critical and provides a vital foundation for supporting all SDGs [4,5]. Ziolo et al. [6] found a strong link between sustainable financing models, social sustainability, environmental sustainability, and economic sustainability. SDG8 and SDG17 are particularly relevant to this issue. One of the goals of SDG8 is to maintain GDP per capita growth in line with national circumstances. Meanwhile, SDG17 aims to help developing countries achieve long-term debt sustainability through coordinated policies focused on promoting debt financing, debt relief, and debt restructuring, as well as external debt of highly indebted and underdeveloped countries, to reduce the debt burden [7].
EU members could come to a consensus on how to conduct economic policy in the event of sudden shocks in order to prepare an adequate response to current and possible future crises. While the causes of the global economic and financial crisis of 2007–2009, the debt crisis of 2010–2013, and the COVID-19 crisis differ, analyzing the implementation of economic policies in the EU during the previous period can provide useful insights for setting economic policies and coordinating their implementation. The global economic and financial crisis began in the financial sector in mid-2007 and quickly spread to all economic sectors worldwide, resulting in significant negative impacts on EU countries, especially the New Member States (NMS) such as Cyprus, the Czech Republic, Hungary, Slovenia, Estonia, Latvia, Lithuania, Malta, Poland, Slovakia, Bulgaria, Romania, and Croatia [8,9]. The impact of the subsequent economic crisis varied from country to country. This global crisis clearly demonstrated that strong regional economies such as the EU were not prepared to face new challenges. Consequently, each EU Member State attempted to deal with the crisis in its own way. The diversity of the EU economies’ characteristics, objectives, and economic environment resulted in different measures being chosen to overcome the crisis as quickly as possible.
This paper aims to analyze the impact of monetary and fiscal policies on economic development and employment through the inflation channel in the EU during the crisis period. Given the significant differences in the freedom to conduct monetary and fiscal policy between EMU and non-EMU countries, a separate analysis has been conducted for these two groups of economies. PLS-SEM methodology has been applied to an appropriate set of indicators representing monetary policy, fiscal policy, price stability (inflation), economic development, and employment.
It is important to note that previous literature has mainly focused on the EU as a whole [10,11,12,13], EMU [14,15,16,17], or on specific EU countries [18,19,20]. Moreover, most previous studies have used a variant of regression analysis [21], which is not able to analyze the effects of monetary and fiscal policies simultaneously and efficiently incorporate their indirect effects. Accordingly, this study’s contribution lies in the following:
- It provides parallel analysis for the EU, EMU, and non-EMU countries (to compare differences in policy effects).
- It employs PLS-SEM analysis, enabling the analysis of simultaneous effects of both policies together and the analysis of indirect effects (via price stability) of the economic policies implemented.
- It offers a brief discussion of ideas for a new model of economic policy coordination.
2. Literature Review
The EU’s economic policy during times of crisis has been the focus of extensive literature analyzing various aspects and implications. Most of the literature has centered on the EMU countries, particularly on the impact and efficiency of monetary policy implementation [22,23,24,25,26,27].
During crises, monetary policy implementation has been criticized by those who believe that it should have done more [23] and by those who believe that it has done too much for too long, particularly the ECB [28]. In response, the ECB adopted an extremely expansionary monetary policy to stimulate economic activity during the crisis, but its interest rate channel became inefficient when interest rates fell to very low or even zero levels. To counter this, the ECB implemented unconventional monetary policy measures and instruments, such as central bank announcements [24,29] and quantitative easing [30,31], which have proven to be more effective in conveying information to market participants about the direction of monetary policy and managing their expectations, thereby making ECB monetary policy more efficient.
However, Claeys et al. [25] argue that external factors beyond the ECB’s control have influenced the fact that low interest rates and unconventional monetary policy tools have not led to price stabilization and accelerated growth and development. This raises two important implications. First, the transmission mechanism of monetary policy to inflation may be weakened, making it more challenging for central banks to achieve their objectives. Second, monetary policy may need to be more expansionary than before to achieve the same objectives. Therefore, they suggest that the ECB should adjust the framework for monetary policy by explicitly setting rules where possible and maintaining an acceptable degree of flexibility to manage uncertainty.
Nevertheless, ensuring price stability, economic growth, and employment requires effective coordination between monetary and fiscal policies. Hence, research has shifted to some extent to the effects of fiscal policy implementation in EMU members, especially after the debt crisis [32,33,34,35,36,37,38]. Białek [33] found that some Member States have saved too much, while others, particularly those from the southern periphery, have gone to the other extreme. Greece, Portugal, Ireland, and Cyprus have not met the Maastricht criteria, forcing EMU to take appropriate measures to enable these countries to meet their obligations as EMU members [39,40,41]. Instruments such as the European Stability Mechanism and the Fiscal Compact for Stability and Growth were introduced to bridge the gap between monetary policy, conducted by the ECB, and fiscal policy, the responsibility of member governments. The financial crisis has demonstrated that it is impossible to leave these two areas of the economy in the hands of separate centers of power in the long run. Corsetti et al. [27] emphasize the importance of flexible fiscal policy, though they stress that achieving this has been challenging in the Eurozone in the past period. D’Acunto et al. stress the importance of unconventional fiscal measures to boost consumption [42]. On the other hand, conventional monetary policy, supported by automatic fiscal stabilizers, is only capable of stabilizing economic activity and prices during moderate economic shocks. However, it is insufficient to stabilize the economy during strong shocks.
According to Schnabl, the institutional framework of EMU was not designed to consider the unique function of fiscal policy in balancing asymmetric shocks within the Eurozone [43]. The Maastricht criteria only established ceilings for the budget deficit and public debt, with no mechanism developed to compensate for differing economic growth rates among member states. Moreover, individual member states’ fiscal policies were not supervised by a supranational authority with the power to control them. Therefore, creating a fiscal and banking union is critical for future progress. However, implementing this idea is heavily criticized because efforts to create a fiscal union often lack a thorough project assessment. Nonetheless, proponents argue that other advanced federations have such a centralized fiscal institution, so it should be applied in the case of EMU [44].
Dabić, on the other hand, contends that EMU survived the crisis despite significant difficulties and pessimistic predictions without leading to a transition to an economic union with supranational fiscal power [45]. According to Stawska, the EMU’s coordination of monetary and fiscal policies has been relatively effective in terms of maintaining price and monetary stability while promoting economic growth [46]. While member states’ fiscal authorities increased government spending to encourage investment, consumption, and economic recovery, the ECB kept interest rates low and utilized unconventional monetary policy measures.
Compared to the euro area, there is relatively less literature on the impact of economic policy on countries outside the EMU. Economic policies are studied either at the individual country level or relevant groups of countries, primarily the (Central and Eastern European) CEE and (South-Eastern European) SEE countries, as it is a diverse group of countries. Škare et al. tested the assumption of money neutrality in CEE economies and concluded that monetary policy could be a useful tool for macroeconomic stabilization and boosting economic activity [47]. As such, countries that have not yet joined the EMU need to consider the significant economic costs of deeper monetary integration and the willingness required to operate under a tight monetary framework. The need for further integration in the EMU is reflected in achieving nominal and real convergence among member states [48,49]. Nominal convergence refers to the convergence of nominal variables such as inflation rates, prices, interest rates, nominal wages, while real convergence pertains to the alignment of real parameters such as economic growth, employment, and productivity, among others, of less developed countries with developed economies [50].
According to Potjagailo, policymakers and central banks in non-EMU countries should respond to the expansionary monetary policy of the ECB introduced after the economic crisis only if their economies have similar conditions to the euro area [51]. However, Hajek and Horvath have found that unexpected changes in consumer prices in the euro area do not significantly affect inflation/deflation risks in countries outside the euro area [52]. On the other hand, a large body of work has addressed the spillover effect of ECB policies on countries outside the EMU [20,51]. Benecká et al. have identified significant negative effects of ECB monetary policy on growth and prices in CEE countries, with the impact on prices being greater than the impact on economic activity, which they attribute to the significant imports of CEE countries from EMU countries. As the Euro appreciates, it leads to imported inflation [20].
In contrast, some authors emphasize the importance and effectiveness of fiscal policy in non-EMU countries, with a particular focus on the analysis of fiscal policy in SEE and CEE countries [53,54,55,56]. Following the global economic crisis of 2007–2009, CEE economies used fiscal policy to boost economic growth [54]. However, public debt in these economies increased by an average of 20% of GDP due to relatively high deficits between 2000 and 2013, affecting fiscal sustainability. These countries are small and open economies with similar social and economic legacies. Most of them are young democracies with relatively weak institutions and low credit ratings. Hence, fiscal policy responses in this relatively homogeneous group of countries differ from those of developed countries [53].
In addition to SEE and CEE, some authors have analyzed monetary policy in developed EU economies that are not members of the EMU. Buscher and Gabrisch have examined interest rates in Sweden, Denmark, and the United Kingdom and have concluded that there is a high correlation between the trend of interest rates on the interbank market in these countries and the trend of EURIBOR [57]. The authors have confirmed that this dependence exists not only in times of macroeconomic stability but also in times of crisis, suggesting that the policies of the ECB significantly influence domestic interest rates. Thus, they conclude that monetary policy independence cannot be seen as an advantage of remaining outside the euro area. Using the cointegrated VAR model, Reade and Volz have shown the existence of a correlation between the trend of the market interest rate in Sweden and EURIBOR, making monetary policy in Sweden largely a copy of ECB decisions [58]. The above-mentioned diversity of economies other than EMU certainly leads to different effects. On average, however, it can be said that they are more flexible in the conduct of economic policy than the countries of the EMU.
According to the presented literature review, the following research questions are defined:
- Q1. How have monetary and fiscal policies in the EU impacted inflation, economic development, and employment through their impact on inflation?
- Q2. How have monetary and fiscal policies in the EMU impacted inflation, economic development, and employment through their impact on inflation?
- Q3. How have monetary and fiscal policies in the non-EMU impacted inflation, economic development, and employment through their impact on inflation?
To answer these questions, the following theoretical model (Figure 1) is defined:
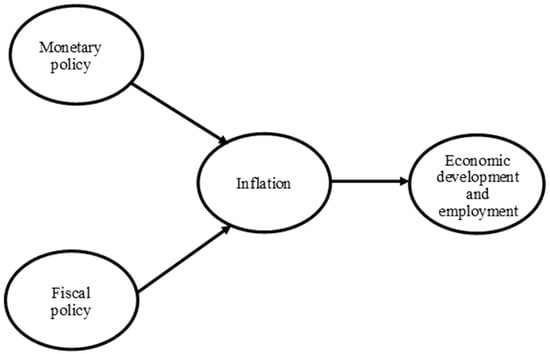
Figure 1.
Theoretical model.
3. Data and Methodology
The PLS-SEM methodology is utilized to examine suitable models that permit the use of multiple indicators for a given latent variable, model measurement errors in the observed variables, and test the relationships among the observed variables [59]. The dataset employed in this paper includes data for 28 EU countries spanning from 2007 to 2015, covering 14 variables or indicators. The details regarding the data utilized can be found in Table 1.

Table 1.
Details about Latent variables.
The set of analyzed data relates to 28 countries that were members of the EU during the observed period. These were: Austria, Belgium, Bulgaria, Croatia, Cyprus, The Czech Republic, Denmark, Finland, France, The Netherlands, Germany, Greece, Hungary, Ireland, Italy, Latvia, Lithuania, Estonia, Luxembourg, Malta, Poland, Portugal, Romania, Slovakia, Slovenia, Spain, Sweden, and the United Kingdom.
In order to gain the first insight into differences among analyzed country groups, Table 2 presents the average values of considered indicators.
Table 2.
Average values of considered indicators.
The averages of monetary policy indicators presented indicate that monetary policy was significantly more expansionary in EMU countries compared to non-EMU countries. On the other hand, the fiscal policy indicators suggest that, on average, fiscal policy in EMU countries was more restrictive than in non-EMU countries. The inflation indicators suggest that the average inflation rate in EMU countries was lower than in non-EMU countries, while average economic development and employment rates were mixed. The average GDP per capita was higher in EMU countries, while the average GDP per worker and employment rate were slightly lower in EMU countries.
4. Results and Discussion
The measurement (outer) and structural (inner) models are components of the PLS-SEM approach using SmartPLS 4 software. The structural model depicts the connections between constructs, whereas the measurement model displays interactions between the observed data and the constructions. The method developed by Hair et al. and Sarstedt & Cheah is used to access these models [74,75].
4.1. Measurement Model Assessment
Table 3 displays the values of Cronbach’s alpha (CA), composite reliability (CR), average variance extracted (AVE), and item loadings (with corresponding p values), which are utilized to evaluate the convergent validity and construct reliability of the measurement model, as outlined by Hair et al. [74].
Table 3.
Convergent validity and construct reliability of the measurement model.
Table 3 demonstrates that all item loadings are above 0.6, indicating that the structures have incorporated over 50% of the variance of the analyzed construct [76,77] and are statistically significant (p ≤ 0.05). Moreover, Cronbach’s Alpha and Composite Reliability exceed the recommended threshold of 0.7 for all constructs [78], indicating pleasant internal consistency. Additionally, the AVE values confirm convergent validity as they exceed the recommended threshold of 0.5 [74].
The next step in evaluating the measurement model pertains to discriminant validity, i.e., the degree to which one construct differs from other constructs. To test discriminant validity, the Fornell–Larcker criterion is employed [79], and the results are presented in Table 4.
Table 4.
Discriminant validity according to Fornell–Larcker Criterion.
According to the presented data in Table 4, all values are lower than diagonal values, and the Fornell–Larcker criterion is met. Considering all the presented indicators of the quality of the measurement model, it can be concluded that the model is very acceptable and that it is possible to continue with the analysis.
4.2. Structural Model Assessment
The next step in the analysis is structural model assessment, which is achieved by evaluating path coefficients obtained via the bootstrapping procedure in SmartPLS 4 software (5000 bootstrap samples were generated) and presented in Table 5.
Table 5.
Path coefficients for EMU members.
The findings presented in Table 5 reveal that the path coefficient representing the impact of monetary policy on inflation is 0.593 and is statistically significant at p ≤ 0.05. This indicates that the expansionary monetary policy introduced by the ECB did not result in an increase in inflation. Based on the indicators used, the positive path coefficient suggests that lower monetary policy indicators were associated with lower inflation indicators. This outcome can be explained by the positive influence of unconventional measures adopted in the EMU, as proposed by [24,25]. The path coefficient showing the indirect relationship between monetary policy and economic development is negative and statistically significant (−0.128), indicating that expansionary monetary policy has a positive effect on economic development and employment, ensuring an acceptable level of price stability. This means that lower levels of monetary indicators were linked to higher levels of economic development and employment indicators.
Regarding the impact of fiscal policy on inflation, the results indicate a negative path coefficient of −0.149, which is statistically significant at p ≤ 0.05. This suggests that restrictive fiscal policy (high fiscal indicator values) resulted in lower inflation in the EMU (low inflation indicator values). In contrast, the path coefficient indicating the indirect effect of fiscal policy on economic development and employment is positive (0.032), indicating that restrictive fiscal policy contributed to increased economic development and employment by controlling inflation, although the effect was minor. Despite the low path coefficients, they are statistically significant (p ≤ 0.05), indicating that fiscal policy had an impact on inflation and economic development (by lowering inflation) to some degree. These outcomes support Schnabl’s argument that relatively strict fiscal policy, coupled with ECB measures to prevent insolvency in peripheral countries within the EMU [43], has had an adverse effect on economic development within the EMU.
An identical analysis was carried out for non-EMU countries as well, and the results are shown in Table 6.
Table 6.
Path coefficients for non-EMU countries.
The results in Table 6 show that a positive and high path coefficient of 0.726 was obtained for the effect of monetary policy on inflation (which is statistically significant at the p ≤ 0.05 level), suggesting that restrictive monetary policy in countries other than EMU was not efficient at reducing inflation, as higher values of monetary indicators led to higher inflation indicators. It should be noted that the path coefficient for this relationship is the highest compared to the other path coefficients obtained for the non-EMU group. The path coefficient for the indirect relationship between monetary policy and economic development and employment is −0.292 (statistically significant at p ≤ 0.05), indicating that a restrictive monetary policy positively affects economic development and employment via a slight increase in inflation. Similar results were shown by the authors Kiseľáková et al. [17].
Analysis of the impact of fiscal policy on inflation revealed a low negative path coefficient of −0.102 (which is statistically significant at the p ≤ 0.05 level), suggesting that relatively expansionary fiscal policy led to higher inflation. A very small positive path coefficient (0.041) is obtained for the relationship, indicating the indirect effects of fiscal policy on economic development and employment (which is not statistically significant at the p > 0.05 level). Such values of path coefficients representing the impact of fiscal policy result from the fact that it is a relatively heterogeneous group of countries and that the observed countries in this group have greater autonomy in implementing fiscal policy than the countries of EMU [27].
The PLS-SEM methodology was also applied to the data at the level of the EU as a whole. The results are shown in Table 7.
Table 7.
Path coefficients for EU.
The path coefficient between monetary policy and inflation shows a positive, high, and statistically significant relationship (0.624 and p ≤ 0.05). Therefore, it can be inferred that the relatively expansionary monetary policy did not lead to an increase in inflation. Low values of monetary indicators also corresponded to low values of inflation indicators. However, the relationship between monetary policy and economic development is negative and statistically significant, suggesting that expansionary monetary policy has promoted economic development and employment to some extent, through a slight increase in inflation. These findings are in line with recent research showing that variable monetary and fiscal policies impact economic development [21].
After analyzing the effects of monetary policy, the effects of fiscal policy were investigated. The path coefficient of −0.126 (statistically significant at p ≤ 0.05) indicates that restrictive fiscal policy led to lower inflation. The indirect impact of fiscal policy through the inflation channel is represented by a very small positive and statistically significant path coefficient (0.038), indicating that fiscal policy did not support economic development and employment by ensuring sufficient price stability.
5. Conclusions
Over the past two decades, the EU has faced various challenges related to economic stability. During this time, there was a consensus that economic policy should play a stabilizing role, with monetary policy given a significant advantage over fiscal policy, which was limited to keeping government debt below acceptable levels. However, following the global economic crisis of 2008, fiscal policy measures were used more intensively, which led to new shocks for Eurozone members in 2010. Despite this, monetary policy remained the primary instrument for stabilizing the economy, although the capacity of conventional measures was soon exhausted. Central banks turned to unconventional measures to combat low inflation and low growth rates.
The study results suggest that in general, monetary policy has not achieved its purpose of reducing inflation and boosting economic activity and employment through price stability. Expansionary monetary policy in EMU did not lead to price increases due to unconventional measures and external factors, such as global trends. The applied measures had some small positive indirect effects on economic development and employment. In contrast, restrictive fiscal policy slightly reduced inflation, but the indirect effect on economic development and employment was uncertain. In non-EMU countries, restrictive monetary policy was ineffective at reducing inflation, but price increases had an indirect effect on economic development and employment. Price increases in non-EMU countries led to increased imports from EMU countries, generating import inflation. Due to exhausted capacities for implementing restrictive fiscal measures, these countries implemented relatively expansive fiscal policies, which increased prices to some extent. However, the indirect impact on economic development and employment is unclear. These results are reflected at the EU level, where more restrictive monetary policy and expansive fiscal policies have resulted in price increases and a very low indirect impact on economic development and employment compared to the EMU area.
Furthermore, the ECB still lacks an adequate role within the EU, and coordination between monetary and fiscal policy remains insufficient. This implies that the EU is not adequately prepared to face economic downturns, as evidenced by the current COVID-19 pandemic crisis. The ECB continues to pursue an expansionary monetary policy, which creates a liquidity trap and reduces the effectiveness of monetary policy. This fact highlights the importance of active fiscal management even more because multipliers are greater when interest rates are near zero. Simultaneously, flexible fiscal policy can assist with the implementation of monetary policy measures, resulting in faster and better results in terms of economic stabilization.
In conclusion, fiscal policy played an adequate role in achieving price stability, economic development, and employment. Inadequate crisis management has resulted in deterioration in economic performance, especially in EMU, and has led to political polarization between debtor countries and those with relatively more stable public finances. Despite all these factors, fiscal policy is still an underused macroeconomic stabilization tool. To accelerate the implementation of fiscal stabilization initiatives, the European Commission should modify the present fiscal rules. In particular, keeping the public debt ceiling at 60% of GDP and providing assistance to Member States that exceed this level is controversial in the face of extremely low interest rates. The European Commission’s intervention would be appropriate only when an economy generates unsustainable debt.
It is important to note that failure to implement necessary reforms in economic policy will deepen the divergence between EU member states during the current crisis. Most member states started the crisis with limited room to maneuver in terms of economic policy implementation, given that interest rates were already very low (averaging below 1%), government debt levels exceeded the Maastricht criteria, and credit ratings had significantly deteriorated. Although many politicians and economists have emphasized the significance of establishing a fiscal union, there is currently insufficient political support for such a project. Nevertheless, some form of fiscal oversight and control must be established to boost growth and employment while ensuring public debt sustainability.
There are several aspects of fiscal policy implementation that could be improved to address the spillover problem caused by exceeding the Maastricht budget deficit limit (which amounts to 3% of GDP). Currently, there is no system in place to encourage countries to produce a budget surplus or penalize countries that exceed the limit. To address this issue, certificate trading could be allowed to issue permitted debt, which would avoid the negative effects of irresponsible behavior by certain Member States in the fiscal sphere. The market mechanism would enable Member States most affected by future crises to purchase certificates issued by EMU members with advanced fiscal positions to finance expansive measures. To ensure the smooth functioning of the entire system, an independent EMU regulatory institution should be established to define certificate prices, fix debt emission quotas, and set conditions for countries to participate in this market. The role of the European Commission should be to provide investors with appropriate information about the macroeconomic situation and debt management of the debtor country.
However, the main limitation of this study is the insufficient long-term data for analyzing the impact of economic policies on inflation, economic development, and employment during the pandemic crisis. There are also many other factors that impact inflation and economic development and employment, such as supporting measures for start-ups and FDI inflow. Further research should be conducted using data from the pandemic period and considering more factors that impact inflation, economic development, and employment, such as easing of business conditions.
Author Contributions
Conceptualization, M.R.; Methodology, A.F.; Software, A.F.; Validation, A.F.; Formal analysis, I.M.; Investigation, I.M. and M.R.; Resources, T.V.; Data curation, D.P.; Writing—original draft, D.P. and T.V.; Writing—review & editing, A.J. and M.C.S. All authors have read and agreed to the published version of the manuscript.
Funding
This paper was published as part of the research program of the Faculty of Hotel Management and Tourism in Vrnjačka Banja, University of Kragujevac which is funded by the Ministry of Science, Technological Development and Innovation, Republic of Serbia.
Institutional Review Board Statement
Not applicable.
Informed Consent Statement
Not applicable.
Data Availability Statement
Not applicable.
Conflicts of Interest
The authors declare no conflict of interest.
References
- Martin, V. Twenty years since the introduction of the euro. Banking 2019, 48, 46–65. (In Serbian) [Google Scholar]
- OECD. Economic Surveys, Euro Area. June 2016. Available online: http://www.oecd.org/economy/surveys/euro-area-2016-overview.pdf (accessed on 12 October 2022).
- IMF. World Economic Outlook Report. 2022. Available online: https://www.imf.org/~/media/Websites/IMF/imported-flagship-issues/external/pubs/ft/weo/2016/02/pdf/_textpdf.ashx (accessed on 12 October 2022).
- Jia, S.; Qiu, Y.; Yang, C. Sustainable development goals, financial inclusion, and grain security efficiency. Agronomy 2021, 11, 2542. [Google Scholar] [CrossRef]
- Chitimira, H.; Warikandwa, T.V. Financial Inclusion as an Enabler of United Nations Sustainable Development Goals in the Twenty-First Century: An Introduction. In Financial Inclusion and Digital Transformation Regulatory Practices in Selected SADC Countries: South Africa, Namibia, Botswana, and Zimbabwe; Springer International Publishing: Cham, Switzerland, 2023; pp. 1–22. [Google Scholar]
- Ziolo, M.; Bak, I.; Cheba, K. The role of sustainable finance in achieving sustainable development goals: Does it work? Technol. Econ. Dev. Econ. 2020, 27, 45–70. [Google Scholar] [CrossRef]
- UN. Sustainable Development Goals. Available online: https://sdgs.un.org/goals (accessed on 3 May 2023).
- Bischof, J.; Laux, C.; Leuz, C. Accounting for Financial Stability: Bank Disclosure and Loss Recognition in the Financial Crisis. J. Financ. Econ. 2021, 141, 1188–1217. [Google Scholar] [CrossRef]
- Benlagha, N.; Hemrit, W. Does Economic Policy Uncertainty Matter to Explain Connectedness within the International Sovereign Bond Yields? J. Econ. Financ. 2021, 46, 1–21. [Google Scholar] [CrossRef]
- Verdun, A. An “Asymmetrical” Economic and Monetary Union in the Eu: Perceptions of Monetary Authorities and Social Partners. J. Eur. Integr. 1996, 20, 59–81. [Google Scholar] [CrossRef]
- Afonso, A.; Alves, J.; Balhote, R. Interactions between Monetary and Fiscal Policies. J. Appl. Econ. 2019, 22, 132–151. [Google Scholar] [CrossRef]
- Stawska, J.; Malaczewski, M.; Szymańska, A. Combined Monetary and Fiscal Policy: The Nash Equilibrium for the Case of Non-Cooperative Game. Econ. Res.-Ekon. Istraz. 2019, 32, 3554–3569. [Google Scholar] [CrossRef]
- Stawska, J. Dependencies between Variables from the Area of the Monetary and Fiscal Policy in the European Union Countries. Comparative Economic Research. Cent. East. Eur. 2021, 24, 7–25. [Google Scholar] [CrossRef]
- Bini Smaghi, L.; Casini, C. Monetary and Fiscal Policy Co-operation: Institutions and Procedures in EMU. JCMS J. Common Mark. Stud. 2000, 38, 375–391. [Google Scholar] [CrossRef]
- Durkalic, D.; Furtula, S.; Borisavljevic, K. Ranking tourism market performance in EMU countries: Results of PROMETHEE–GAIA approach. Hotel. Tour. Manag. 2019, 7, 67–76. [Google Scholar] [CrossRef]
- Bonatti, L.; Fracasso, A.; Tamborini, R. Rethinking Monetary and Fiscal Policy in the Post-COVID Euro Area; Monetary Dialogue Papers; European Parliament: Strasbourg, France, 2020. [Google Scholar]
- Kiseľáková, D.; Filip, P.; Onuferova, E.; Valentiny, T. The impact of monetary policies on the sustainable economic and financial development in the euro area countries. Sustainability 2020, 12, 9367. [Google Scholar] [CrossRef]
- Ćorić, T.; Šimović, H.; Deskar-Škrbić, M. Monetary and Fiscal Policy Mix in a Small Open Economy: The Case of Croatia. Econ. Res.-Ekon. Istraz. 2015, 28, 407–421. [Google Scholar] [CrossRef]
- Petrevski, G.; Bogoev, J.; Tevdovski, D. Fiscal and Monetary Policy Effects in Three South Eastern European Economies. Empir. Econ. 2015, 50, 415–441. [Google Scholar] [CrossRef]
- Benecká, S.; Fadejeva, L.; Feldkircher, M. The Impact of Euro Area Monetary Policy on Central and Eastern Europe. J. Policy Model. 2020, 42, 1310–1333. [Google Scholar] [CrossRef]
- Stawska, J.; Miszczyńska, K. The Impact of Monetary and Fiscal Policy Variables on the EU Economic Growth. Panel Data Analysis. Entrep. Sustain. Issues 2022, 9, 380–395. [Google Scholar] [CrossRef] [PubMed]
- Hurst, I.; Liadze, I.; Meaning, J. The Monetary and Fiscal Framework of the EMU in Times of High Debt and Constrained Interest Rates. National Institute of Economic and Social Research No. 467. 2016. Available online: https://www.niesr.ac.uk/sites/default/files/publications/DP467.pdf (accessed on 15 December 2022).
- Sandbu, M. Europe’s Orphan: The Future of the Euro and the Politics of Debt; Princeton University Press: Princeton, NJ, USA, 2017. [Google Scholar]
- Petrović, D. The importance of the announcement of the European Central Bank as an instrument of monetary policy in an environment of low interest rates. Econ. Thought Pract. 2018, 1, 315–332. (In Croatian) [Google Scholar]
- Claeys, G.; Demertzis, M.; Mazza, J. A Monetary Policy Framework for the European Central Bank to Deal with Uncertainty; Bruegel Policy Contribution No. 2018/21; European Union Bruegel Policy Contribution: Brussels, Belgium, 2018. [Google Scholar]
- Foresti, P. Monetary and fiscal policies interaction in monetary unions. J. Econ. Surv. 2017, 32, 226–248. [Google Scholar] [CrossRef]
- Corsetti, G.; Dedola, L.; Jarociński, M.; Maćkowiak, B.; Schmidt, S. Macroeconomic Stabilization, Monetary-Fiscal Interactions, and Europe’s Monetary Union. Eur. J. Pol. Econ. 2019, 57, 22–33. [Google Scholar] [CrossRef]
- German Council of Economic Experts, Executive Summary in Annual Report 2017–18. 2017. Available online: https://www.sachverstaendigenrat-wirtschaft.de/fileadmin/dateiablage/gutachten/jg201718/17-11-07_Executive_Summary.pdf (accessed on 9 October 2022).
- Ricci, O. The Impact of Monetary Policy Announcements on the Stock Price of Large European Banks during the Financial Crisis. J. Bank. Financ. 2015, 52, 245–255. [Google Scholar] [CrossRef]
- Joyce, M.; Miles, D.; Scott, A.; Vayanos, D. Quantitative easing and unconventional monetary policy–an introduction. Econ. J 2012, 122, F271–F288. [Google Scholar] [CrossRef]
- Bartkiewicz, P. Quantitative Easing: New Normal or Emergency Measure? Contemp. Econ. 2020, 14, 306–319. [Google Scholar] [CrossRef]
- Cavallo, E.A.; Fernández-Arias, E.; Powell, A. Is the Euro-Zone on the Mend? Latin American Examples to Analyze the Euro Question. J. Bank. Financ. 2014, 47, 243–257. [Google Scholar] [CrossRef]
- Białek, N. Causes of The Outbreak of the Eurozone Crises: The Role of the Usa and the European Central Bank Monetary Policy. e-Finanse 2015, 11, 47–63. [Google Scholar] [CrossRef]
- Chortareas, G.; Mavrodimitrakis, C. Strategic Fiscal Policies and Leadership in a Monetary Union. Eur. J. Pol. Econ. 2017, 47, 133–147. [Google Scholar] [CrossRef]
- Matthes, J.; Iara, A. On the future of the EMU: Is more fiscal integration indispensable? Eur. View 2017, 16, 3–22. [Google Scholar] [CrossRef]
- Bordignon, M.; Baglioni, A.S. The future of fiscal policy in the Euro Area. Ifo DICE Rep. 2018, 16, 32–37. [Google Scholar]
- Belke, A.H.; Osowski, T.U. Measuring Fiscal Spillovers in EMU and beyond: A Global VAR Approach. Scott. J. Political Econ. 2019, 66, 54–93. [Google Scholar] [CrossRef]
- De Jong, J.F.M.; Gilbert, N.D. Fiscal Discipline in EMU? Testing the Effectiveness of the Excessive Deficit Procedure. Eur. J. Pol. Econ. 2020, 61, 101822. [Google Scholar] [CrossRef]
- Fahrholz, C.; Wójcik, C. The Eurozone Needs Exit Rules. J. Bank. Financ. 2013, 37, 4665–4674. [Google Scholar] [CrossRef]
- Pelizzon, L.; Subrahmanyam, M.G.; Tomio, D.; Uno, J. Sovereign Credit Risk, Liquidity, and European Central Bank Intervention: Deus Ex Machina? J. Financ. Econ. 2016, 122, 86–115. [Google Scholar] [CrossRef]
- Carletti, E.; Colla, P.; Gulati, M.; Ongena, S. The Price of Law: The Case of the Eurozone Collective Action Clauses. Rev. Financ. Stud. 2020, 34, 5933–5976. [Google Scholar] [CrossRef]
- D’Acunto, F.; Hoang, D.; Weber, M. Managing Households’ Expectations with Unconventional Policies. Rev. Financ. Stud. 2021, 35, 1597–1642. [Google Scholar] [CrossRef]
- Schnabl, G. The Failure of ECB Monetary Policy from a Mises-Hayek Perspective; CESifo Working Paper, No. 6388; Center for Economic Studies and ifo Institute (CESifo): Munich, Germany, 2017. [Google Scholar]
- Feld, L.P.; Osterloh, S. Is a Fiscal Capacity Really Necessary to Complete EMU? Freiburger Diskussionspapiere zur Ordnungsökonomik No. 13/5. 2013. Available online: https://www.econstor.eu/handle/10419/88113 (accessed on 13 October 2022).
- Dabic, D. (Un)Limited Influence of Germany in Eurozone: Survival of Common Currency from the Perspective of Historical Institutionalism. Int. Probl. 2016, 68, 327–350. [Google Scholar] [CrossRef]
- Stawska, J. The impact of the monetary-fiscal policy mix on investments of euro area countries in the context of the financial crisis. Sci. Stud. Account. Financ. Probl. Perspect. 2012, 8, 228–236. [Google Scholar] [CrossRef]
- Škare, M.; Benazić, M.; Tomić, D. On the Neutrality of Money in CEE (EU Member) States: A Panel Cointegration Analysis. Acta Oecon. 2016, 66, 393–418. [Google Scholar] [CrossRef]
- Rughoo, A.; Sarantis, N. The Global Financial Crisis and Integration in European Retail Banking. J. Bank. Financ. 2014, 40, 28–41. [Google Scholar] [CrossRef]
- Beker-Pucar, E.; Glavaški, O. Monetary Stages and Frameworks of Emerging EU Members. Econ. Horiz. 2019, 21, 29–42. (In Serbian) [Google Scholar] [CrossRef]
- Drastichová, M. The Relations of Real and Nominal Convergence in the EU with Impacts on the Euro Area Participation. Ekon. Rev.-Cent. Eur. Rev. Econ. Issues 2012, 15, 107–122. [Google Scholar] [CrossRef]
- Potjagailo, G. Spillover Effects from Euro Area Monetary Policy across Europe: A Factor-Augmented VAR Approach. J. Int. Money Financ. 2017, 72, 127–147. [Google Scholar] [CrossRef]
- Hajek, J.; Horvath, R. International spillovers of (un) conventional monetary policy: The effect of the ECB and the US Fed on non-euro EU countries. Econ. Syst. 2018, 42, 91–105. [Google Scholar] [CrossRef]
- Arsic, M.; Nojkovic, A.; Randjelovic, S. Determinants of Discretionary Fiscal Policy in Central and Eastern Europe. Econ. Syst. 2017, 41, 367–378. [Google Scholar] [CrossRef]
- Ilzetzki, E.; Mendoza, E.G.; Végh, C.A. How big (small?) are fiscal multipliers? J. Monet. Econ. 2013, 60, 239–254. [Google Scholar] [CrossRef]
- Socol, A.G.; Feraru, R.M. The role of fiscal policy in the financial crisis. Challenges and solutions. Theor. Appl. Econ. 2017, 2, 5–20. [Google Scholar]
- Vujičić, B. EU and Central and Eastern Europe: Productivity and Convergence. Croatian National Bank. 2015. Available online: https://www.hnb.hr/-/hr-the-eu-and-cee-productivity-and-convergence (accessed on 27 September 2022). (In Croatian).
- Buscher, H.S.; Gabrisch, H. What Might Central Banks Lose or Gain in Case of Euro Adoption–a GARCH-Analysis of Money Market Rates for Sweden, Denmark, and the UK; IWH Discussion Papers No. 9/2011; Institut für Wirtschaftsforschung Halle: Halle (Saale), Germany, 2011. [Google Scholar]
- Reade, J.J.; Volz, U. Too Much to Lose, or More to Gain? Should Sweden Join the Euro? University of Birmingham Discussion Papers, 10-13; University of Oxford: Oxford, UK, 2009. [Google Scholar]
- Gadzo, S.G.; Kportorgbi, H.K.; Gatsi, J.G. Credit Risk and Operational Risk on Financial Performance of Universal Banks in Ghana: A Partial Least Squared Structural Equation Model (PLS SEM) Approach. Cogent Econ. Financ. 2019, 7, 1589406. [Google Scholar] [CrossRef]
- AMECO. Nominal Short-Term Interest Rates (ISN). Available online: https://economy-finance.ec.europa.eu/economic-research-and-databases/economic-databases/ameco-database/download-annual-data-set-macro-economic-database-ameco_en (accessed on 18 September 2017).
- AMECO. Short-Term Real, Deflator GDP (ISRV). Available online: https://economy-finance.ec.europa.eu/economic-research-and-databases/economic-databases/ameco-database/download-annual-data-set-macro-economic-database-ameco_en (accessed on 18 September 2017).
- European Central Bank. Statistical Data Warehouse, Euro Area (Changing Composition)-Money Market-Euribor 3-month-Historical Close, Average of Observations through Period-Euro, Provided by Reuters. Available online: https://sdw.ecb.europa.eu/quickview.do;jsessionid=72E9D7C78D7600328C080BCD1CDF3F6C?SERIES_KEY=143.FM.A.U2.EUR.RT.MM.EURIBOR3MD_.HSTA&start=&end=&submitOptions.x=0&submitOptions.y=0&trans=N (accessed on 10 October 2022).
- KPMG Data, Corporate Tax Rate. Available online: https://home.kpmg.com/xx/en/home/services/tax/tax-tools-and-resources/tax-rates-online/corporate-tax-rates-table.html, (accessed on 10 October 2022).
- KPMG Data. Individual Income Tax Rate. Available online: https://home.kpmg.com/xx/en/home/services/tax/tax-tools-and-resources/tax-rates-online/individual-income-tax-rates-table.html (accessed on 10 October 2022).
- Eurostat. Total Revenue from Taxes and Social Contributions, EU-28 and EA-19, % of GDP. Available online: https://ec.europa.eu/eurostat/databrowser/view/gov_10a_taxag/default/table?lang=en (accessed on 10 October 2022).
- Eurostat. General Government Expenditure by Function. Available online: https://appsso.eurostat.ec.europa.eu/nui/show.do?dataset=gov_10a_exp&lang=en (accessed on 29 October 2022).
- World Bank. General Government Final Consumption Expenditure (% of GDP). Available online: https://data.worldbank.org/indicator/NE.CON.GOVT.ZS (accessed on 12 October 2022).
- Eurostat. HICP Annual Average Rate of Change. Available online: https://appsso.eurostat.ec.europa.eu/nui/show.do?dataset=prc_hicp_mv12r&lang=en (accessed on 24 October 2022).
- World Bank. GDP Deflator. Available online: https://data.worldbank.org/indicator/NY.GDP.DEFL.ZS (accessed on 24 October 2022).
- Eurostat. Purchasing Power Parities (PPPs), Price Level Indices and Real Expenditures for ESA 2010 Aggregates [prc_ppp_ind]. Available online: https://ec.europa.eu/eurostat/web/purchasing-power-parities/data/database (accessed on 24 October 2022).
- Eurostat. Purchasing Power Parities (PPPs), Price Level Indices and Real Expenditures for ESA 2010 Aggregates, Volume Indices of Real Expenditure per Capita in PPS (EU28 = 100). Available online: http://appsso.eurostat.ec.europa.eu/nui/submitViewTableAction.do (accessed on 24 October 2022).
- Eurostat. Real Labour Productivity per Person Employed-Annual Data. Available online: https://ec.europa.eu/eurostat/web/products-datasets/product?code=tipsna70 (accessed on 16 October 2022).
- Eurostat, Employment Rate, Percentage of Total Population, from 20 to 64 Years. Available online: http://appsso.eurostat.ec.europa.eu/nui/show.do?dataset=t2020_10&lang=eng (accessed on 16 October 2022).
- Hair, J.F., Jr.; Hult, G.T.M.; Ringle, C.; Sarstedt, M. A Primer on Partial Least Squares Structural Equation Modeling (PLS-SEM); Sage Publications: Thousand Oaks, CA, USA, 2016. [Google Scholar]
- Sarstedt, M.; Cheah, J.-H. Partial Least Squares Structural Equation Modeling Using SmartPLS: A Software Review. J. Mark. Anal. 2019, 7, 196–202. [Google Scholar] [CrossRef]
- Benitez, J.; Henseler, J.; Castillo, A.; Schuberth, F. How to Perform and Report an Impactful Analysis Using Partial Least Squares: Guidelines for Confirmatory and Explanatory IS Research. Inf. Manag. 2020, 57, 103168. [Google Scholar] [CrossRef]
- Teng, L.; Tan, Q.; Ehsani, A. Assessing the Impact of Cultural Characteristics, Economic Situations, Skills and Knowledge on the Development and Success of Cloud-Based e-Learning Systems in the COVID-19 Era. Kybernetes 2021, 51, 2795–2813. [Google Scholar] [CrossRef]
- Nannally, J.C. Psychometric Theory, 2nd ed.; McGraw-Hill: New York, NY, USA, 1978. [Google Scholar]
- Fornell, C.; Larcker, D.F. Evaluating Structural Equation Models with Unobservable Variables and Measurement Error. J. Mark. Res. 1981, 18, 39. [Google Scholar] [CrossRef]

Disclaimer/Publisher’s Note: The statements, opinions and data contained in all publications are solely those of the individual author(s) and contributor(s) and not of MDPI and/or the editor(s). MDPI and/or the editor(s) disclaim responsibility for any injury to people or property resulting from any ideas, methods, instructions or products referred to in the content. |
© 2023 by the authors. Licensee MDPI, Basel, Switzerland. This article is an open access article distributed under the terms and conditions of the Creative Commons Attribution (CC BY) license (https://creativecommons.org/licenses/by/4.0/).