
Exploring Influential Factors of Free-Floating Bike-Sharing Usage Frequency before and after COVID-19

Abstract
:1. Introduction
2. Literature Review
2.1. Impact of COVID-19 Pandemic on BSS
2.1.1. Macro-System Perspective
2.1.2. Micro-User Perspective
2.2. Research Gap
3. Data
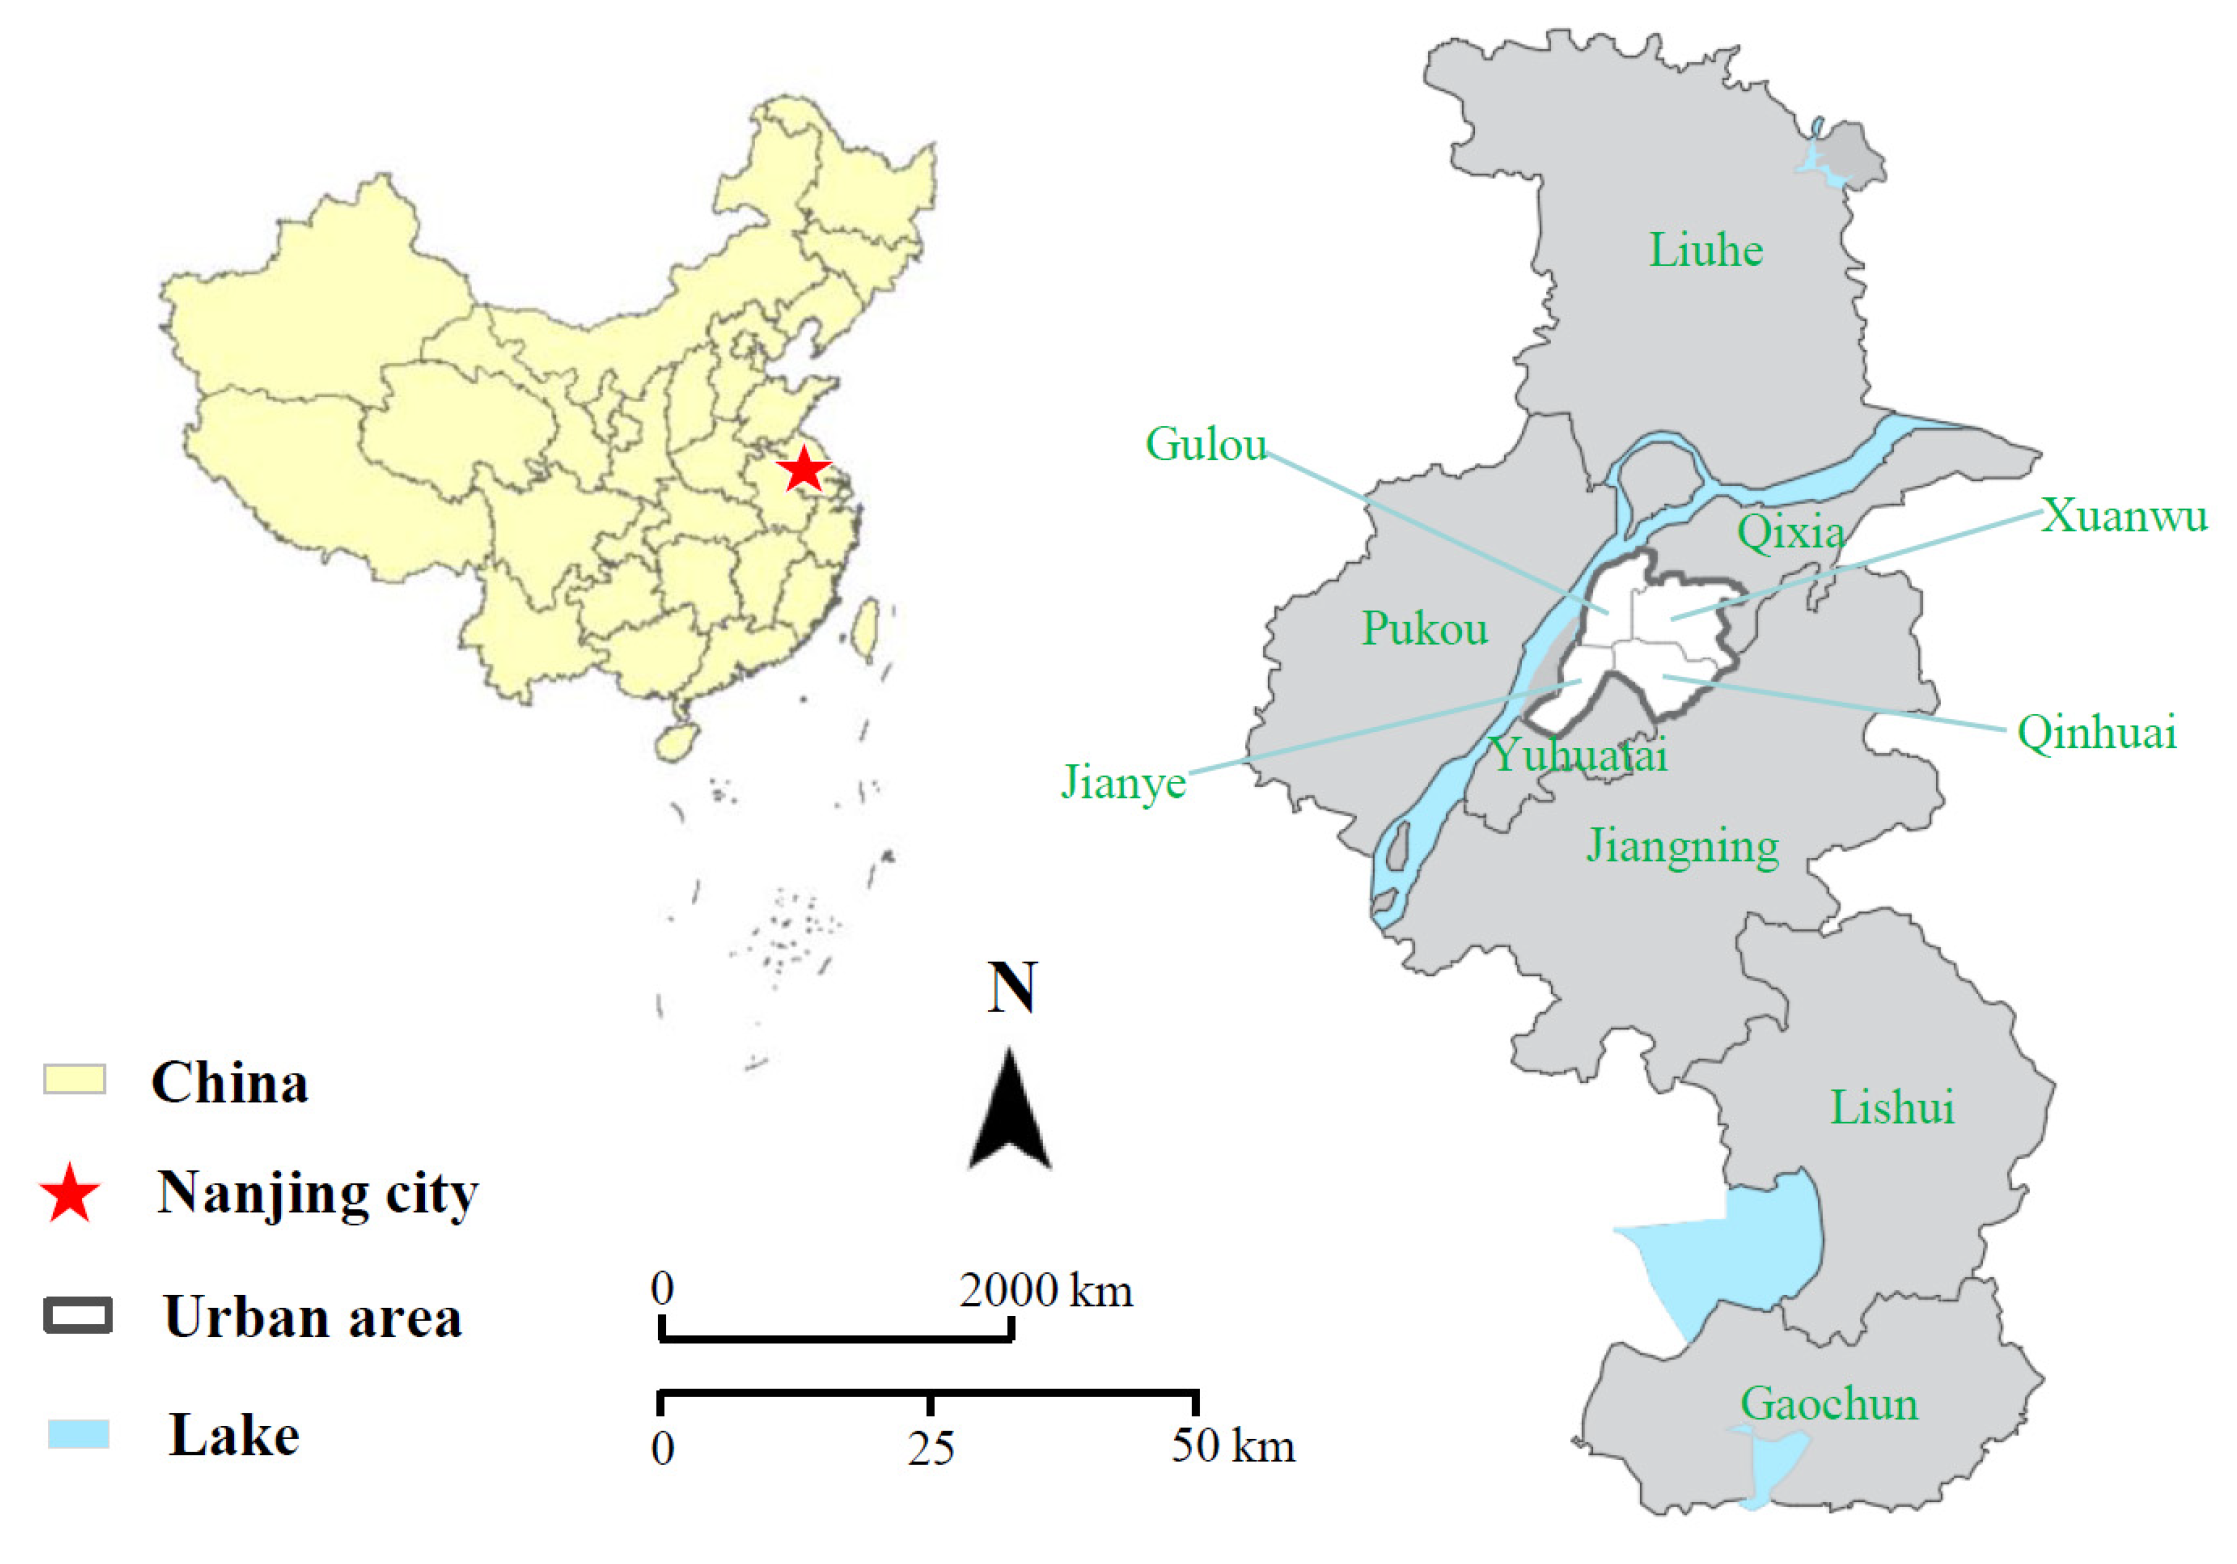
3.1. Survey Area
3.2. Data Source and Survey Design
3.3. Respondent Attributes
4. Characteristic Analysis
4.1. Weekly Travel Freqeuncy of FFBS Users before and after COVID-19
4.2. Travel Distance and Duration of FFBS Users before and after COVID-19
5. Method
5.1. Ordered Logit Model
5.2. Variable Calibration and Model Building
6. Results and Discussions
7. Conclusions
Author Contributions
Funding
Institutional Review Board Statement
Informed Consent Statement
Data Availability Statement
Acknowledgments
Conflicts of Interest
Appendix A

| Variable | Before-COVID-19 | After-COVID-19 | ||
|---|---|---|---|---|
| B | S.E. | B | S.E. | |
| Preferences | ||||
| Easy to park and pick up | 0.204 | 0.187 | 0.08 | 0.176 |
| Low travel cost | −0.06 | 0.205 | 0.366 * | 0.197 |
| Convenient payment | 0.054 | 0.201 | −0.178 | 0.182 |
| High security | 0.146 | 0.208 | −0.11 | 0.206 |
| High amenity | 0.101 | 0.162 | 0.181 | 0.163 |
| Basic attribute | ||||
| Age | 0.213 | 0.428 | −0.513 | 0.424 |
| Educational level | 0.168 | 0.22 | 0.088 | 0.211 |
| Monthly income (CNY) | 0.006 | 0.11 | 0.118 | 0.105 |
| Number of household bike(s) | 0.358 ** | 0.162 | 0.241 | 0.154 |
| Number of household e-bike(s) | −0.072 | 0.157 | −0.088 | 0.148 |
| Number of household car(s) | −0.11 | 0.185 | 0.196 | 0.179 |
| Gender | −0.347 | 0.291 | −0.031 | 0.263 |
| Occupation | 0.045 | 0.08 | 0.038 | 0.078 |
| Possess urban household registration | −0.391 | 0.286 | −0.194 | 0.284 |
| Possess driving license | 0.171 | 0.334 | −0.067 | 0.314 |
| Public bike IC card ownership | −0.003 | 0.275 | 0.162 | 0.269 |
| Travel information | ||||
| Travel duration (min) | 0.525 *** | 0.131 | 0.452 *** | 0.115 |
| Travel distance (km) | −0.026 | 0.025 | 0.001 | 0.058 |
| Geographic space | −0.042 | 0.302 | −0.143 | 0.296 |
| Substituted modes—Walking/Private bike/Public bike/E-bike/Illegal motor taxi/Others | −0.373 | 0.307 | −0.462 | 0.327 |
| Substituted modes—Bus/Subway | 0.106 | 0.284 | −0.005 | 0.305 |
| Substituted modes—Private car/Taxi | 0.182 | 0.315 | −0.267 | 0.267 |
| Travel motivation—Commuting | 0.146 | 0.333 | −0.1 | 0.409 |
| Travel motivation—Non-commuting | 0.074 | 0.305 | −0.093 | 0.378 |
| Travel time—Workday—peak hours | 0.793 ** | 0.362 | 1.499 *** | 0.497 |
| Travel time—Workday—non-peak hours | 0.392 | 0.382 | 1.825 *** | 0.517 |
| Travel time—Weekend/Holidays | 0.558 | 0.383 | 1.408 *** | 0.463 |
| Constant | −0.003 | 1.417 | −0.106 | 1.523 |
| R-squared | 0.444 | 0.471 | ||
References
- Li, H.; Zhang, Y.; Zhu, M.; Ren, G. Impacts of COVID-19 on the usage of public bicycle share in london. Transp. Res. Part A Policy Pract. 2021, 150, 140–155. [Google Scholar] [CrossRef] [PubMed]
- Ben Hassen, T.; El Bilali, H.; Allahyari, M.S. Impact of COVID-19 on food behavior and consumption in qatar. Sustainability 2020, 12, 6973. [Google Scholar] [CrossRef]
- Baker, M.A.; Sands, K.E.; Huang, S.S.; Kleinman, K.; Septimus, E.J.; Varma, N.; Blanchard, J.; Poland, R.E.; Coady, M.H.; Yokoe, D.S.; et al. The impact of coronavirus disease 2019 (COVID-19) on healthcare-associated infections. Clin. Infect. Dis. 2022, 74, 1748–1754. [Google Scholar] [CrossRef] [PubMed]
- Liu, D.; Kwan, M.-P.; Kan, Z.; Song, Y.; Li, X. Racial/ethnic inequity in transit-based spatial accessibility to COVID-19 vaccination sites. J. Racial Ethn. Health Disparities, 2022; in press. [Google Scholar] [CrossRef]
- Liu, D.; Kwan, M.-P. Integrated analysis of doubly disadvantaged neighborhoods by considering both green space and blue space accessibility and COVID-19 infection risk. PLoS ONE 2022, 17, e0273125. [Google Scholar] [CrossRef]
- Chen, Y.; Sun, X.; Deveci, M.; Coffman, D. The impact of the COVID-19 pandemic on the behaviour of bike sharing users. Sustain. Cities Soc. 2022, 84, 104003. [Google Scholar] [CrossRef] [PubMed]
- Kan, Z.; Kwan, M.-P.; Wong, M.S.; Huang, J.; Liu, D. Identifying the space-time patterns of COVID-19 risk and their associations with different built environment features in Hong Kong. Sci. Total Environ. 2021, 772, 145379. [Google Scholar] [CrossRef]
- Li, X.F.; Xu, J.C.; Du, M.Y.; Liu, D.; Kwan, M.P. Understanding the spatiotemporal variation of ride-hailing orders under different travel distances. Travel Behav. Soc. 2023, 32, 100581. [Google Scholar] [CrossRef]
- Monahan, T.; Lamb, C.G. Transit’s downward spiral: Assessing the social-justice implications of ride-hailing platforms and COVID-19 for public transportation in the US. Cities 2022, 120, 103438. [Google Scholar] [CrossRef]
- Teixeira, J.F.; Silva, C.; Sa, F.M.E. The role of bike sharing during the coronavirus pandemic: An analysis of the mobility patterns and perceptions of Lisbon’s gira users. Transp. Res. Part A Policy Pract. 2022, 159, 17–34. [Google Scholar] [CrossRef]
- Teixeira, J.F.; Silva, C.; Moura, E.S.F. The strengths and weaknesses of bike sharing as an alternative mode during disruptive public health crisis: A qualitative analysis on the users’ motivations during COVID-19. Transp. Policy 2022, 129, 24–37. [Google Scholar] [CrossRef]
- Tan, T.; Ma, J.; Yang, Z.; Zhu, M.; Zong, C.; Li, H. A study on a prediction model of e-bike expansion degree at irregular signalized intersections. Appl. Sci. 2021, 11, 6852. [Google Scholar] [CrossRef]
- Bartling, H. Bike share and user motivation: Exploring trip substitution choices among bike share users in a north american city. Int. J. Sustain. Transp. 2022; in press. [Google Scholar] [CrossRef]
- Du, M.; Cheng, L.; Li, X.; Tang, F. Static rebalancing optimization with considering the collection of malfunctioning bikes in free-floating bike sharing system. Transp. Res. Part E Logist. Transp. Rev. 2020, 141, 102012. [Google Scholar] [CrossRef]
- Kwon, K.; Akar, G. What determines modal substitution between bike-sharing and public transit? Evidence from Columbus, Ohio during the COVID-19 pandemic. Int. J. Sustain. Transp. 2023; in press. [Google Scholar] [CrossRef]
- Costa, M.; Félix, R.; Marques, M.; Moura, F. Impact of COVID-19 lockdown on the behavior change of cyclists in lisbon, using multinomial logit regression analysis. Transp. Res. Interdiscip. Perspect. 2022, 14, 100609. [Google Scholar] [CrossRef] [PubMed]
- Teixeira, J.F.; Silva, C.; Moura, E.S.F. The motivations for using bike sharing during the COVID-19 pandemic: Insights from Lisbon. Transp. Res. Part F Traffic Psychol. Behav. 2021, 82, 378–399. [Google Scholar] [CrossRef] [PubMed]
- Kim, J.; Lee, S. Determining factors affecting public bike ridership and its spatial change before and after COVID-19. Travel Behav. Soc. 2023, 31, 24–36. [Google Scholar] [CrossRef]
- Zhang, X.; Li, W.C. Effects of a bike sharing system and COVID-19 on low-carbon traffic modal shift and emission reduction. Transp. Policy 2023, 132, 42–64. [Google Scholar] [CrossRef]
- Arias-Molinares, D.; Garcia-Palomares, J.C.; Gutierrez, J. Micromobility services before and after a global pandemic: Impact on spatio-temporal travel patterns. Int. J. Sustain. Transp. 2022; in press. [Google Scholar] [CrossRef]
- Bi, H.; Ye, Z.R.; Zhang, Y.H.; Zhu, H. A long-term perspective on the COVID-19: The bike sharing system resilience under the epidemic environment. J. Transp. Health 2022, 26, 16. [Google Scholar] [CrossRef]
- Hua, M.Z.; Chen, X.W.; Cheng, L.; Chen, J.X. Should bike-sharing continue operating during the COVID-19 pandemic? Empirical findings from Nanjing, China. J. Transp. Health 2021, 23, 13. [Google Scholar] [CrossRef]
- Chen, W.D.; Liu, X.Z.; Chen, X.W.; Cheng, L.; Wang, K.L.; Chen, J.X. Exploring year-to-year changes in station-based bike sharing commuter behaviors with smart card data. Travel Behav. Soc. 2022, 28, 75–89. [Google Scholar] [CrossRef]
- Buchel, B.; Marra, A.D.; Corman, F. COVID-19 as a window of opportunity for cycling: Evidence from the first wave. Transp. Policy 2022, 116, 144–156. [Google Scholar] [CrossRef]
- Berezvai, Z. Short- and long-term effects of COVID-19 on bicycle sharing usage. Transp. Res. Interdiscip. Perspect. 2022, 15, 100674. [Google Scholar] [CrossRef]
- Shang, W.-L.; Chen, J.; Bi, H.; Sui, Y.; Chen, Y.; Yu, H. Impacts of COVID-19 pandemic on user behaviors and environmental benefits of bike sharing: A big-data analysis. Appl. Energy 2021, 285, 116429. [Google Scholar] [CrossRef] [PubMed]
- Wang, H.; Noland, R.B. Bikeshare and subway ridership changes during the COVID-19 pandemic in New York City. Transp. Policy 2021, 106, 262–270. [Google Scholar] [CrossRef]
- Bergantino, A.S.; Intini, M.; Tangari, L. Influencing factors for potential bike-sharing users: An empirical analysis during the COVID-19 pandemic. Res. Transp. Econ. 2021, 86, 11. [Google Scholar] [CrossRef]
- Jobe, J.; Griffin, G.P. Bike share responses to COVID-19. Transp. Res. Interdiscip. Perspect. 2021, 10, 100353. [Google Scholar] [CrossRef] [PubMed]
- Yu, W.; Bai, H.; Chen, J.; Yan, X.C. Analysis of space-time variation of passenger flow and commuting characteristics of residents using smart card data of Nanjing metro. Sustainability 2019, 11, 4989. [Google Scholar] [CrossRef]
- Yu, W.; Chen, J.; Yan, X.C. Space-time evolution analysis of the Nanjing metro network based on a complex network. Sustainability 2019, 11, 523. [Google Scholar] [CrossRef]
- Yu, W.; Wang, T.; Zheng, Y.; Chen, J. Parameter selection and evaluation of robustness of Nanjing metro network based on supernetwork. IEEE Access 2019, 7, 70876–70890. [Google Scholar] [CrossRef]
- Yu, W.; Bai, H.; Chen, J.; Yan, X.C. Anomaly detection of passenger od on Nanjing metro based on smart card big data. IEEE Access 2019, 7, 138624–138636. [Google Scholar] [CrossRef]
- Yin, C.; Wang, X.; Shao, C. Do the effects of ict use on trip generation vary across travel modes? Evidence from Beijing. J. Adv. Transp. 2021, 2021, 6699674. [Google Scholar] [CrossRef]
- Du, M.Y.; Cheng, L.; Li, X.F.; Yang, J.Z. Investigating the influential factors of shared travel behavior: Comparison between app-based third taxi service and free-floating bike sharing in Nanjing, China. Sustainability 2019, 11, 4318. [Google Scholar] [CrossRef]
- Li, X.; Zhang, Y.; Du, M.; Yang, J. Social factors influencing the choice of bicycle: Difference analysis among private bike, public bike sharing and free-floating bike sharing in Kunming, China. KSCE J. Civ. Eng. 2019, 23, 2339–2348. [Google Scholar] [CrossRef]
- Carroll, J.; Brazil, W.; Morando, B.; Denny, E. What drives the gender-cycling-gap? Census analysis from ireland. Transp. Policy 2020, 97, 95–102. [Google Scholar] [CrossRef]
- Du, M.; Cheng, L. Better understanding the characteristics and influential factors of different travel patterns in free-floating bike sharing: Evidence from Nanjing, China. Sustainability 2018, 10, 1244. [Google Scholar] [CrossRef]
- Li, Y.X.; Chai, Y.W.; Chen, Z.F.; Li, C.J. From lockdown to precise prevention: Adjusting epidemic-related spatial regulations from the perspectives of the 15-minute city and spatiotemporal planning. Sustain. Cities Soc. 2023, 92, 104490. [Google Scholar] [CrossRef] [PubMed]
- Khavarian-Garmsir, A.R.; Sharifi, A.; Sadeghi, A. The 15-minute city: Urban planning and design efforts toward creating sustainable neighborhoods. Cities 2023, 132. [Google Scholar] [CrossRef]
- Liu, D.; Kwan, M.-P.; Kan, Z.; Wang, J. Toward a healthy urban living environment: Assessing 15-minute green-blue space accessibility. Sustainability 2022, 14, 16914. [Google Scholar] [CrossRef]
- Du, M.Y.; Cheng, L.; Li, X.F.; Yang, J.Z. Acceptance of electric ride-hailing under the new policy in shenzhen, China: Influence factors from the driver’s perspective. Sustain. Cities Soc. 2020, 61, 102307. [Google Scholar] [CrossRef]
- Zhang, B.; Chen, S.; Ma, Y.; Li, T.; Tang, K. Analysis on spatiotemporal urban mobility based on online car-hailing data. J. Transp. Geogr. 2020, 82, 102568. [Google Scholar] [CrossRef]
- Ta, N.; Li, H.; Chai, Y.; Wu, J. The impact of green space exposure on satisfaction with active travel trips. Transp. Res. Part D Transp. Environ. 2021, 99, 103022. [Google Scholar] [CrossRef]
- Li, G.; Cheng, J. Exploring the effects of traffic density on merging behavior. IEEE Access 2019, 7, 51608–51619. [Google Scholar] [CrossRef]
- Jiang, X.H.; Tang, T.; Sun, L.H.; Lin, T.F.; Duan, X.; Guo, X.C. Research on consumers’ preferences for the self-service mode of express cabinets in stations based on the subway distribution to promote sustainability. Sustainability 2020, 12, 7212. [Google Scholar] [CrossRef]
- Wu, L.; Shen, Q.; Li, G. Identifying risk factors for autos and trucks on highway-railroad grade crossings based on mixed logit model. Int. J. Environ. Res. Public Health 2022, 19, 15075. [Google Scholar] [CrossRef] [PubMed]
- Hu, S.H.; Xiong, C.F.; Liu, Z.Q.; Zhang, L. Examining spatiotemporal changing patterns of bike-sharing usage during COVID-19 pandemic. J. Transp. Geogr. 2021, 91, 16. [Google Scholar] [CrossRef]


| Respondents (N = 127) | Percentage (%) | ||
|---|---|---|---|
| Gender | Male | 70 | 55.12 |
| Female | 57 | 44.88 | |
| Age | ≤18 | 2 | 1.57 |
| 19–40 | 111 | 87.40 | |
| 41–65 | 14 | 11.02 | |
| Level of education | Middle school or below | 7 | 5.51 |
| Senior high school | 18 | 14.17 | |
| Undergraduate school | 93 | 73.23 | |
| Graduate school or above | 9 | 7.09 | |
| Occupation | Students | 37 | 29.13 |
| Government officer | 15 | 11.81 | |
| Enterprise employee | 45 | 35.43 | |
| Teachers | 5 | 3.94 | |
| Retiree | 1 | 0.79 | |
| Others | 24 | 18.90 | |
| Income level (CNY/month) | ≤3000 | 35 | 27.56 |
| 3001–6000 | 38 | 29.92 | |
| 6001–10,000 | 37 | 29.13 | |
| >10,000 | 17 | 13.39 |
| Items | Variables | Definition and Notes |
|---|---|---|
| Travel attribute | Substituted modes—Walking/Private bike/Public bike/E-bike/Illegal motor taxi/Others | Yes = 1 No = 0 |
| Substituted modes—Bus/Subway | Yes = 1 No = 0 | |
| Substituted modes—Private car/Taxi | Yes = 1 No = 0 | |
| Travel motivation—Commuting | Yes = 1 No = 0 | |
| Travel motivation—Non-commuting | Yes = 1 No = 0 | |
| Travel duration (min) | Continuous variable | |
| Travel distance (km) | Continuous variable | |
| Travel time—Workday—peak hours | Yes = 1 No = 0 | |
| Travel time—Workday—non-peak hours | Yes = 1 No = 0 | |
| Travel time—Weekend/Holidays | Yes = 1 No = 0 | |
| Geographic space | Urban core area = 1 Suburbs = 2 | |
| Attitudes and perceptions | Easy to park and pick up | Strongly disagree = 1 Relatively disagree = 2 Not sure = 3 Relatively agree = 4 Strongly agree = 5 |
| Low travel cost | Strongly disagree = 1 Relatively disagree = 2 Not sure = 3 Relatively agree = 4 Strongly agree = 5 | |
| Convenient payment | Strongly disagree = 1 Relatively disagree = 2 Not sure = 3 Relatively agree = 4 Strongly agree = 5 | |
| High security | Strongly disagree = 1 Relatively disagree = 2 Not sure = 3 Relatively agree = 4 Strongly agree = 5 | |
| High amenity | Strongly disagree = 1 Relatively disagree = 2 Not sure = 3 Relatively agree = 4 Strongly agree = 5 | |
| Basic attribute | Gender | Males = 1 Females = 2 |
| Age | Teenagers (≤18) = 1 Adult (19~40) = 2 Middle-aged (41~65) = 3 | |
| Educational level | Middle school or below = 1 Senior high school = 2 Undergraduate = 3 Graduate or above = 4 | |
| Occupation | Student = 1 Government officer = 2 Enterprise employee = 3 Teacher = 4 Retiree = 5 Others = 6 | |
| Monthly income (CNY) | <3000 = 1 3001–6000 = 2 6001–10,000 = 3 >10,000 = 4 | |
| Possess urban household registration | Yes = 1 No = 2 | |
| Possess driving license | Yes = 1 No = 2 | |
| Public bike IC card ownership | Yes = 1 No = 2 | |
| Number of household bike(s) | 0 = 1 1 = 2 2 = 3 ≥ 3 = 4 | |
| Number of household e-bike(s) | 0 = 1 1 = 2 2 = 3 ≥ 3 = 4 | |
| Number of household car(s) | 0 = 1 1 = 2 2 = 3 ≥ 3 = 4 |
| Variable | Before COVID-19 | After COVID-19 | ||
|---|---|---|---|---|
| B | S.E. | B | S.E. | |
| Preferences | ||||
| Easy to park and pick up | 0.456 | 0.298 | 0.161 | 0.318 |
| Low travel cost | 0.171 | 0.32 | 0.886 ** | 0.385 |
| Convenient payment | 0.073 | 0.318 | −0.58 * | 0.352 |
| High security | 0.272 | 0.328 | −0.42 | 0.378 |
| High amenity | 0.258 | 0.255 | 0.588 ** | 0.29 |
| Basic attribute | ||||
| Age | 0.18 | 0.68 | −1.389 * | 0.762 |
| Educational level | 0.192 | 0.352 | −0.103 | 0.417 |
| Monthly income (CNY) | −0.059 | 0.18 | 0.008 | 0.21 |
| Number of household bike(s) | 0.4 | 0.28 | 0.233 | 0.278 |
| Number of household e-bike(s) | −0.017 | 0.256 | −0.165 | 0.274 |
| Number of household car(s) | −0.162 | 0.299 | 0.402 | 0.331 |
| Male | 0.859 * | 0.488 | 0.6 | 0.474 |
| Female | 0 a | . | 0 a | . |
| Student | −0.784 | 0.653 | −1.001 | 0.765 |
| Government officer | 0.604 | 0.873 | 1.712 ** | 0.874 |
| Enterprise employee | 0.436 | 0.635 | 1.317 * | 0.722 |
| Teacher | 0.91 | 1.128 | 1.477 | 1.197 |
| Retiree | −17.667 | 0 | −17.255 | 0 |
| Others | 0 a | . | 0 a | . |
| Possess urban household registration—Yes | 0.776 * | 0.466 | 0.527 | 0.524 |
| Possess urban household registration—No | 0 a | . | 0 a | . |
| Possess driving license—Yes | −0.464 | 0.526 | −0.236 | 0.571 |
| Possess driving license—No | 0 a | . | 0 a | . |
| Public bike IC card ownership—Yes | −0.344 | 0.452 | −0.998 ** | 0.506 |
| Public bike IC card ownership—No | 0a | . | 0a | . |
| Travel information | ||||
| Travel duration(min) | 0.958 *** | 0.229 | 1.109 *** | 0.244 |
| Travel distance(km) | −0.018 | 0.044 | −0.057 | 0.1 |
| Geographic space—Urban core area | 0.039 | 0.493 | 0.444 | 0.57 |
| Geographic space—Suburbs | 0 a | . | 0 a | . |
| Substituted modes—Walking/Private bike/Public bike/E-bike/Illegal motor taxi/Others—No | 0.543 | 0.479 | 0.399 | 0.574 |
| Substituted modes—Walking/Private bike/Public bike/E-bike/Illegal motor taxi/Others—Yes | 0 a | . | 0 a | . |
| Substituted modes—Bus/Subway—No | −0.24 | 0.452 | −1.158 * | 0.595 |
| Substituted modes—Bus/Subway—Yes | 0 a | . | 0 a | . |
| Substituted modes—Private car/Taxi—No | −0.441 | 0.505 | −0.037 | 0.469 |
| Substituted modes—Private car/Taxi—Yes | 0 a | . | 0 a | . |
| Travel motivation—Commuting—No | −0.241 | 0.554 | 0.725 | 0.74 |
| Travel motivation—Commuting—Yes | 0 a | . | 0 a | . |
| Travel motivation—Non-commuting—No | 0.021 | 0.483 | 0.744 | 0.672 |
| Travel motivation—Non-commuting—Yes | 0 a | . | 0 a | . |
| Travel time—Workday-peak hours—No | −1.119 ** | 0.559 | −2.316 *** | 0.882 |
| Travel time—Workday-peak hours—Yes | 0 a | . | 0 a | . |
| Travel time—Workday-non-peak hours—No | −0.688 | 0.609 | −3.576 *** | 0.937 |
| Travel time—Workday-non-peak hours—Yes | 0 a | . | 0 a | . |
| Travel time—Weekend/Holidays—No | −0.689 | 0.598 | −2.267 *** | 0.826 |
| Travel time—Weekend/Holidays—Yes | 0a | . | 0a | . |
| Cox and Snell | 0.469 | 0.549 | ||
| Nagelkerke | 0.490 | 0.583 | ||
| McFadden | 0.202 | 0.281 | ||
Disclaimer/Publisher’s Note: The statements, opinions and data contained in all publications are solely those of the individual author(s) and contributor(s) and not of MDPI and/or the editor(s). MDPI and/or the editor(s) disclaim responsibility for any injury to people or property resulting from any ideas, methods, instructions or products referred to in the content. |
© 2023 by the authors. Licensee MDPI, Basel, Switzerland. This article is an open access article distributed under the terms and conditions of the Creative Commons Attribution (CC BY) license (https://creativecommons.org/licenses/by/4.0/).
Share and Cite
Xie, X.; Du, M.; Li, X.; Jiang, Y. Exploring Influential Factors of Free-Floating Bike-Sharing Usage Frequency before and after COVID-19. Sustainability 2023, 15, 8710. https://doi.org/10.3390/su15118710
Xie X, Du M, Li X, Jiang Y. Exploring Influential Factors of Free-Floating Bike-Sharing Usage Frequency before and after COVID-19. Sustainability. 2023; 15(11):8710. https://doi.org/10.3390/su15118710
Chicago/Turabian StyleXie, Xinyi, Mingyang Du, Xuefeng Li, and Yunjian Jiang. 2023. "Exploring Influential Factors of Free-Floating Bike-Sharing Usage Frequency before and after COVID-19" Sustainability 15, no. 11: 8710. https://doi.org/10.3390/su15118710