Abstract
Indonesia has been striving to become the world’s largest ornamental fish exporter for the past two decades, but success has been limited. This study analyzes Indonesia’s export competitiveness and identifies the barriers encountered. A trade analysis using the UN-Comtrade database for 2012–2021 was conducted using the Revealed Comparative Advantage (RCA), Constant Market Shares (CMS), and Competitiveness Matrix formulas to evaluate the competitiveness. Qualitative data from interviews with forty-three industry stakeholders were analyzed using NVivo to evaluate export barriers. The findings revealed that Indonesia had not been optimally exporting to some of the world’s largest markets and faced various barriers, such as product quality and continuity, regulations, marketing, shipment, and other internal and external barriers. The government’s role in overcoming those barriers is crucial while maintaining environmental sustainability. We also propose a matrix model for export barrier levels consisting of export readiness, export market accessibility, export operational challenges, and dynamic export environment.
1. Introduction
The ornamental fish industry is a subset of the pet industry, commonly called a multibillion-dollar industry with a trade value between $15 and $30 billion [1]. In 2021 based on UN-Comtrade data, global trade of ornamental fish exports was valued at $379.1 million, which comprised $279.6 million in freshwater ornamental fish (FOF) exports and $99.5 million in marine ornamental fish (MOF) exports. More than five thousand three hundred FOF species are exported annually to international markets, making the ornamental fish trade one of the fastest growing in the economy [2]. For the development of FOF, breeders play the initial part. The breeder could sell their produce to collecting traders or other small traders or export directly if they have export licenses or export through transhipper services. Hobbyists typically acquire fish from retailers. Due to the limited time ornamental fish have in their packaging when shipped from one country to another, airplanes are typically used [3]. Importers typically acquire their inventory from many exporters or transhippers. For endangered species such as super red arowana, delivery is generally accompanied by a Certificate of Health, Customs, Excise, and an export permit from the Convention on International Trade in Endangered Species (CITES) [4]. Most MOFs are caught by fishermen, while aquaculture is the primary method of developing the FOF industry [5]. Because of their unique requirements, extensive up-front costs, and high production costs, MOF species are more challenging to farm than their FOF counterparts [6].
As a country with a tropical climate and one of seventeen global megadiverse countries, Indonesia is home to a wide variety of flora and fauna, including freshwater, marine fisheries, and ornamental fish, with considerable commercial significance [7]. In addition, Indonesia contains numerous indigenous ornamental fish found only in certain regions of Indonesia, such as the super red arowana and botia. Despite its natural resource wealth, Indonesia has not yet reached its full potential as the largest ornamental fish exporter, although the effort to become the world’s leading exporter has been launched since 2004 when the president inaugurated the ornamental fish development center in Bogor, which is a collaboration between the Ministry of Marine Affairs and Fisheries (KKP), the Indonesian Institute of Sciences (LIPI) and the Bogor government [8].
This research aims to assess the competitiveness of Indonesia’s ornamental fish exports and to identify the factors inhibiting exports and what should be done to overcome them so that Indonesia can realize its vision of becoming the world’s largest exporter while ensuring environmental sustainability. We also aim to propose a new conceptual model for the levels of export barriers based on the study’s findings and existing literature.
The study will hopefully be able to provide feedback for stakeholders in the ornamental fish industry, particularly policymakers whose efforts to improve the export competitiveness of ornamental fish in Indonesia have not been optimal to date. We also make a new contribution by analyzing export competitiveness using the Competitiveness Matrix formula [9], which is still rarely used in previous studies with modifications to its calculations as in the Export Product Dynamic formula [10], which has been widely used.
The next section is organized as follows. In Section 2, we provide a literature review of the ornamental fish industry in Indonesia, export competitiveness, and export barriers. Section 3 presents primary data sources and how to process secondary data to analyze Revealed Comparative Advantage, Constant Market Shares, and Competitiveness Matrix. Furthermore, Section 4 presents the results and discussion of this study. Section 5 contains conclusions and policy implications. Finally, Section 6 presents limitations and future studies.
2. Literature Review
2.1. Indonesian Ornamental Fish Industry
The ornamental fish industry in Indonesia contributes significantly to the country’s economy. Based on the Statistics Indonesia (BPS) agricultural census results, ornamental fish farmers have higher household incomes than edible fish farmers in the pond and brackish water [11]. This industry is critical in providing employment and income to local communities. The country is well known for its diverse collection of freshwater fish species, many exported with production centers in the West Java, Central Java, East Java, and West Kalimantan provinces. Although the majority of Indonesia’s ornamental fish are produced in these four provinces, not all of these provinces export, for example, the provinces of East Java and Central Java. The reason is that most exporters are located in areas close to DKI Jakarta, the capital of Indonesia. Indonesian ornamental fish export value data by province can be seen in Table 1.

Table 1.
Indonesia’s FOF export value based on province.
According to data from Fishbase, there are now four thousand eight hundred twenty-eight fish species in Indonesia, one thousand two hundred forty-eight of which are freshwater and one hundred thirty-four are endemics [12]. In addition, in other sources, Indonesia has six hundred thirty species of indigenous fish out of one thousand two hundred eighteen varieties of freshwater fish [13]. In a study undertaken by LIPI in Sumatra, seventy-three species of fish native to the island of Sumatra were identified [14]. This diversity of FOF and MOF makes Indonesia one of the exporting nations for ornamental fish. Indonesia exported freshwater ornamental fish worth $27.8 million in 2021, representing 10% of the world’s total exports of FOF; that is third place behind Japan and Singapore, and MOF worth $6.7 million that places Indonesia fourth behind Spain, the Netherlands and Sri Lanka. The export value of Indonesia’s FOF has increased by an average of 12 percent yearly since 2015. Despite having more than four thousand freshwater fish and more than six hundred marine fish, Indonesia has not been able to leverage its potential to become the world’s top ornamental fish exporter [15]. At least four hundred of the one thousand one hundred species of FOF commercially traded have been transferred from Indonesia to other nations [16]. The FOF most frequently exported include arowana, botia, betta, goldfish, guppy, discus, and tiger fish. Starfish and angelfish are the most commonly traded MOF species [17].
Table 2 shows the export value of Indonesia’s FOF from 2017 to 2021. Arowana fish (Scleropages formosus) contribute the most to exports, while other ornamental fish are challenging to detect because many are exported with the generally accepted HS code, namely HS Code 03011119 or 03011199. The table shows that Indonesia’s exports continually increased, except for 2020, when the COVID-19 pandemic began. Goldfish (Carassius auratus) and betta (Beta splendens) have had the most substantial increase in the last five years due to considerable increases in export values, although arowana fish exports have remained consistent.
Table 2.
Indonesia’s FOF export value based on HS Code, 2017–2021.
Table 3 shows the export of MOF, with the Banggai cardinal fish being the most significant contributor to exports, while all of the other fish are listed at HS code 03011910 or 03011999. Napoleon wrasse fish exports peaked in 2019 before plummeting dramatically in 2020 and 2021. Despite being a marine fish, it has been bred in Anambas because it is rarely found in nature. This species is under government protection and is listed in CITES Appendix II. It is threatened with extinction since it is also used as a luxury food [19]. The Minister of Maritime Affairs and Fisheries Decree No. 2 of 2021 designates the super red arowana and Banggai cardinal fish as national FOF and MOF mascots that must be protected, preserved, and utilized in a sustainable manner, respectively.
Table 3.
Indonesia’s marine ornamental fish export value based on HS Code, 2017–2021.
2.2. Export Competitiveness
Competitiveness is a frequently used approach in economics for understanding a country’s trade performance, and it may be examined at three different levels: national (i.e., macroeconomic), industry (i.e., branch), and business (i.e., microeconomic) [20,21,22]. On a microeconomic scale, firms participate in the domestic market by importing factors and in international markets by exporting goods. Their competitiveness is influenced by the quality of the business environment, the level of cluster development, and the complexity of company strategies and operations. Macroeconomic competitiveness, on the other hand, is primarily concerned with international trade or a broader concept that also considers the goal of improving the public’s standard of living and is influenced by fiscal and monetary policies, economic stability, social infrastructure, human resource development, and efficient political institutions [23,24].
Exports have long been regarded as a driver of economic growth. When it comes to national economic policy, most nations prioritize expanding their exports of products and services. It boosts exporting companies’ profits and growth, which in turn helps the economy of the country as a whole thrive. In addition, exporting goods can help emerging nations’ economies [25]. Export competitiveness refers to a country’s ability to compete globally through increasing export capacity, diversifying export baskets, and improving export technology [26]. In addition, many researchers have looked into export competitiveness and its relationship to economic integration and growth [27,28,29]. Factors of export competitiveness include export financing resources, supply chain, market knowledge/export marketing, corporate reputation, promotion endeavors, evaluation of export market growth, personal contact with international distributors, and proximity to the global market [30,31]. However, building export competitiveness is a time-consuming, expensive, and risky endeavor that requires substantial investments in research and development, cutting-edge technology, high-quality infrastructure, and close collaboration between businesses, universities, and research institutions [32]. Furthermore, exchange rate, capital productivity, domestic gross domestic product, labor productivity, trade liberalization, organizational characteristics, export marketing policies and efforts, transportation costs, characteristics of the firm’s environment and production technology, and firm size are some of the key determinants of export competitiveness [33]. Table 4 displays previous studies on export competitiveness in various industries.
Table 4.
Previous studies on export competitiveness.
2.3. Export Barrier
Exports contribute significantly to a country’s economic prosperity and well-being [25,44]. However, exporting is not easy because there are impediments that a firm must overcome. Generally, there are two types of export barriers: internal and external. Internal barriers are inherent to the firm and are typically related to available organizational resources or approaches to export marketing, whereas external barriers are caused by the environment in which the firm works. Export barriers can also be classified according to a domestic/foreign typology, with domestic barriers relating to problems in the manufacturing firm’s home country and foreign barriers relating to issues in foreign markets where the firm operates or intends to operate [45].
In previous research, barriers to exports are also separated into two categories: barriers for non-exporters [46] and barriers for exporters [47], each of which has various barrier characteristics concerning exports [47,48]. However, in their study, Ahmed et al. [49] found no variation in the perceptions of export restrictions between exporters and non-exporters. Non-exporters confront various challenges while selling their products to fulfill the demands or wishes of customers in other countries or during the internationalization process [50,51]. Meanwhile, the impediments for exporters include various barriers to increasing export volume or reaching a more comprehensive market region [52].
According to Kahiya [50], there are four obstacles to internal barriers: resource-related barriers, managerial-related barriers, marketing-related barriers, and knowledge-related barriers; and three obstacles to external barriers, which include: market barriers in the country of origin (home-based barriers), market barriers in destination countries (host-based barriers), and knowledge-related barriers. In another source, the OECD [53] listed ten main factors that hinder internationalization: (1) a lack of working capital to finance exports; (2) difficulty identifying business opportunities in other countries; (3) an inability to analyze the market; (4) an inability to contact overseas prospects; (5) difficulties in obtaining reliable foreign representatives; (6) a lack of managerial time to deal with internationalization; (7) insufficient and untrained employees for internationalization; (8) difficulty matching rivals’ prices; (9) lack of government assistance/incentives; and (10) high transportation costs. In another paper, Arteaga-Ortiz and Fernández-Ortiz [54] offered a four-category classification of export barriers: (1) knowledge barriers, (2) resource limits, (3) procedural barriers, and (4) exogenous inhibitions.
Aside from the previously listed barriers, other elements influence a firm’s desire to export, such as the type of industry or market conditions, company size, management skill or export experience, and export destinations [55,56]. According to Ortega [57], there are four stages of internationalization: (1) the non-exporter stage, which is not interested in exports; (2) the non-exporter stage, which is interested in exporting; (3) the novice exporter stage; and (4) the experienced exporter stage, which was later expanded into six stages by Kahiya and Dean [58] with the addition of (5) the explorer stage and (6) the semi-experienced exporter stage.
3. Materials and Methods
3.1. Data Resources
Primary data were collected using semi-structured interviews [59] with open-ended questions prepared to guide the interview process but might have been asked in a particular order or format. The interview questions were intended to elicit information about the challenges of exporting ornamental fish and suggestions for addressing those challenges. There were 43 interviewees who were ornamental fish industry stakeholders from academics, ornamental fish associations, ornamental fish communities, traders, exporters, breeders, local government, and central government officials, as shown in Table 5. The interview process took a total of 8 months to complete with face-to-face interviews and online via Zoom application and telephone for interviewees located in provinces other than Jakarta, such as West Java, East Java, Central Java, and West Kalimantan. The responses from the semi-structured interviews using the Indonesian language provided considerable data for analysis, including over 54 h of recorded transcripts utilizing the web application Salyns by Prosa.ai, which served the purpose of the study. The qualitative analysis phase of this study was undertaken using proven methods. NVivo 12 software was used to conduct a thematic analysis. Export barrier themes were identified in the analysis of interview transcripts, such as repetitions, indigenous typologies or categories, similarities and differences, and theory-related content [60]. Recognizing repeats is one of the most prevalent techniques for identifying interview themes [61].
Table 5.
Primary data sources.
3.2. Measurement of Revealed Comparative Advantage (RCA)
RCA is the ratio between the proportion of specific commodity exports to a country’s total export commodities and the proportion of certain commodities to the total export commodities of the world. If the ratio is more than 1, some commodities in that nation have a comparative advantage, and vice versa if the ratio is less than 1 [27]. The concept of comparative advantage refers to the potential of a nation to manufacture certain commodities or services not just with higher productivity, as Ricardo originally recommended, but also with greater product differentiation than other nations in a particular trading region [62]. Since the seminal work of Balassa [27], the standard method for quantifying comparative advantage has been the development of an RCA index based on trade flows. The fundamental concept is that trade flows can exhibit comparative advantage. A higher RCA index shows that the nation has a larger comparative advantage than other nations with lower RCA indexes for that product. Heckscher and Ohlin formulated the Heckscher–Ohlin or factor proportion theorem, which is frequently used to define RCA. According to this hypothesis, each nation exports goods that it manufactures “relatively better” than other nations [63]. In this context, “relatively better” means that a nation will export items whose production utilizes abundant materials since these elements are relatively less expensive than in other nations. In contrast, a nation will import goods whose production involves utilizing scarce domestic resources.
where,
- = export value of a product-i by country-j
- = total value of exports by country-j
- = world export value of product-i= total value of total world exports
If the RCA is greater than 1, then the country is specialized in that sector and has a comparative advantage for the product-i on the global market. Conversely, if the RCA is less than 1, the country is under-specialized in that sector and has a comparative disadvantage for that product on the global market.
3.3. Measurement of Competitiveness Matrix
The Competitiveness Matrix formula measures export success by analyzing the dynamic competitiveness position of Indonesian ornamental fish products in specific markets [9]. Business strength information is assessed based on the increase in a country’s market share within a particular target market, whereas market attractiveness is calculated based on the growth of a product’s demand in a specific target market. Combining market attractiveness and business strength results in four types of product positioning features to be studied. “Rising Stars”, “Declining Stars”, “Missed Opportunities”, and “Retreat” are the four categories. The most desirable product positions are labeled as “Rising Stars”, suggesting that the nation is gaining market share in rapidly increasing products and achieving an ideal market position. Losing market share for dynamic products falls under the category “Missed Opportunities”, which is the least desirable category. However, “Declining Stars” is marginally preferable to “Missed Opportunities”. The fourth category, “Retreat”, may or may not be desired, depending on whether the shift from stagnant to rising products is beneficial [64].
Changes in market share, export proportion, and specialization all contribute to the existence of three alternatives in the competitiveness matrix. The Y or vertical axis of the competitiveness matrix contains these three alternatives (Figure 1). While along the X axis is the percentage change in a country’s imports of a specific product at a given time. Positive or negative percentage change between the base and most recent years is possible. Dynamic commodities are those that undergo favorable changes over time. The market share of dynamic imports of commodities rose between the base year and the previous year. These commodities’ imports grew faster than overall imports (all commodities or the average growth of commodity imports). Stagnant commodities are those whose proportion of imports has fluctuated (or remained constant) due to stagnant commodity demand in the import market. The proportion of immovable imports has declined from the base year to the most recent year. These commodities’ imports increased at a slower rate than total imports (all commodities, or the average growth rate of commodity imports) [9].
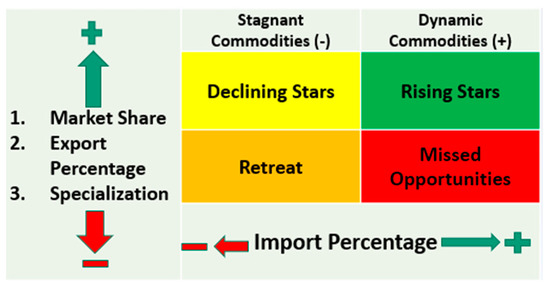
Figure 1.
Competitiveness matrix.
The analysis method applied to this research consisted of applying the Competitiveness Matrix formula [9] over a specific period and calculating the annual average value, as shown below. The formula’s method is a modification of the same approach used in the Export Product Dynamic formula, which is widely used in competitiveness research [65,66].
X-axis: changes in a country’s average import of a commodity
Y-axis:
- Changes in the market share of a product in specific markets from certain exporting countries
- Change in the percentage of exports of a product in a particular market
- Change in the specialization of a product in a particular market
- Mij = import value of a commodity of a country from one exporting country
- Mwj = import value of a commodity of a country from all exporting countries
- Mit = total import value of all commodities from one exporting country
- Mwt = total import value of all commodities from all exporting countries
- t = year-t
- T = analysis of the number of years to use
3.4. Measurement of Constant Market Share
Analysis of export growth using CMS is a technique that divides specific changes in a nation’s exports into structural components and elements of competitiveness. It is necessary to assume that the share of exports will remain constant from the base period to calculate the structural component. Any rise in exports attributable to a change in the export share is connected with relative competitiveness, even though this component may include some residual and other characteristics not often associated with a nation’s competitive position [67]. CMS decomposes a country’s overall export growth into growth impacts, composition effects, market distribution effects, and competitiveness effects. CMS is a strategy to evaluate trade patterns and trends to explain the variables underlying a country’s comparative export performance for policy formation [63,68,69]. Initially created by Tyszynski [70] and later reported by Milana [68], Fagerberg and Sollie [69], and Dieter and Englert [63], there are a variety of formulas that can be utilized to do CMS analysis. This study’s formula is based on Dieter and Englert [63] research, which employs four variables that can influence exports: the effect of global export growth, the effect of commodity composition, the effect of market distribution, and the effect of competitiveness.
CMS analysis is well-liked because of its simplicity and ease of application to available data like UN-Comtrade data. The fundamental analytical framework of CMS defines a country’s aggregate exports as the number of specific commodities exported worldwide or to specific foreign markets. These are then broken down into commodity and world trade market shares, whose fluctuations over time are a combination of these components [69]).
where,
- q = value of exports of the focus country
- Q = value of exports of the world
- s0,1 = (q/Q) = the export share of the focus country at year 0 and 1, respectively
- i = commodity
- j = importing country
- Δ = time derivate of the respective term.
4. Results and Discussion
4.1. Analysis of Indonesian Ornamental Fish Export Competitiveness
4.1.1. RCA Analysis
The comparative advantage of the Indonesian FOF industry in the global market is measured using the RCA formula. In this study, the exports of Indonesian FOF for the period of 2012–2021 were compared to those of the four other biggest exporting nations, namely Japan, Singapore, Czechia, and Thailand; and MOF were compared to Spain, Netherlands, Sri Lanka, and the Philippines. Table 6 shows the results of calculating the average RCA value for the five countries that export the most FOF. Czechia has the highest average RCA value, with a score of 7.99, followed by Indonesia, with a score of 7.88. However, upon closer examination, Indonesia has had the highest RCA value during the past five years, at 9.69. On the other hand, Japan, which had the highest export value in the previous four years, has the lowest RCA value compared to the other four nations.
Table 6.
Indonesia’s Freshwater Ornamental Fish RCA compared to other world’s top exporters.
The value of RCA in 2012–2021 for four exporting nations of MOF, namely Indonesia, Spain, the Netherlands, and the Philippines, which tend to maintain relatively stable positions, is presented in Table 7. Comparing the RCA value from 2013 to 2021, only Sri Lanka exhibits a rise in trends, as it grew by a factor of seven. Among the top five exporters, Indonesia’s RCA is ranked fourth, trailing only Sri Lanka, Spain, and the Philippines. As a result, Indonesia’s RCA can only surpass the Netherlands. Sri Lanka has the highest RCA, with an average score of 76.12 over the last ten years and 121.38 over the last five years. Spain, the world’s largest exporter of MOF, ranks second with a value of 24.32.
Table 7.
Indonesia’s Marine Ornamental Fish RCA compared to other world’s top exporters.
4.1.2. Competitiveness Matrix Analysis
The competitiveness matrix of Indonesia’s ornamental fish based on changes in market share in the ten largest FOF and MOF markets from 2012 to 2021 obtained the results presented in Table 8 and Table 9. During 2012–2021, UK and France markets were in the Rising Stars position, while China, Japan, Germany, the Netherlands, and Malaysia were in the Declining Stars position. Singapore was in the Missed Opportunities position, and the United States and Malaysia were in the Retreat position. Indonesia has not been successful in maximizing exports to the world’s largest market, the United States.
Table 8.
Competitiveness Matrix Analysis of Indonesia’s freshwater ornamental fish.
Table 9.
Competitiveness Matrix Analysis of marine ornamental fish.
Three markets were achieved in the Rising Stars position in the competitiveness matrix for Indonesia’s MOF exports in the world’s ten largest markets in 2012–2021 (Table 9). The US market is in the Declining Stars category, while six other markets are in the Retreat category. Seven out of ten world’s largest MOF markets are stagnant, with only three experiencing rapid growth. Indonesia can export at a reasonable growth rate to these three dynamic market destinations. Although some of the largest market destinations are categorized as stagnant, Indonesia should continue to export optimally to those markets, especially the United States, Italy, the Netherlands, and China.
4.1.3. CMS Analysis
The data used for CMS calculations differ from previous calculations that separated FOF and MOF. The findings were based on data from the world’s top five ornamental fish exporters. The world’s five top exporters witnessed a fall in growth from 2012 to 2015 due to a decline in the global market for ornamental fish as shown in Figure 2. The export decomposition of world growth effects from the five countries with a negative value demonstrates this. With a $12.65 million value, Singapore saw the most dramatic reduction in competitiveness effects compared to the other four countries. Only Indonesia and Spain had positive marks in the market distribution impact. These findings suggest that Indonesia and Spain may best optimize export market objectives for ornamental fish goods compared to the other three nations. Japan and Singapore have adverse commodity composition effects on export growth, while Indonesia, the Netherlands, and Spain have positive results. Spain has the highest value of export growth for commodity composition effects, with $2.33 million.
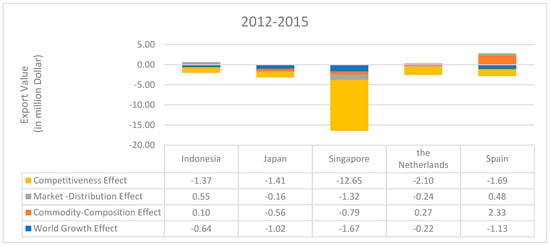
Figure 2.
Decomposition of 2012–2015 export growth of top five exporters.
In 2015–2018, Indonesia and Japan both experienced significant export growth. Meanwhile, exports in the Netherlands increased slightly, while exports in Spain decreased slightly. Singapore’s exports again experienced a significant decline, equating to $7.78 million. During this period, Indonesia and Japan achieved a remarkable dissection of the competitiveness effect. For market distribution effects, Indonesia’s exports reached a very high value of $7.91 million, as shown in Figure 3. This substantial amount results from Indonesia’s exports to China and the United States. Despite Spain’s negative export growth, the composition of its exports enables it to achieve high export values. This high value is because Spain dominates the export market for MOF. Meanwhile, for the world growth effect, all exporters experienced a decline.
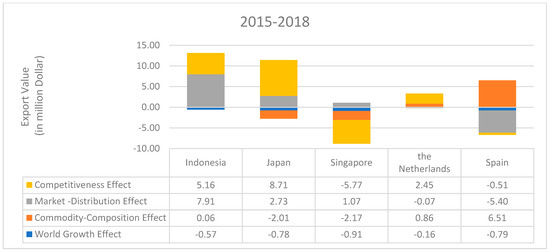
Figure 3.
Decomposition of 2015–2018 export growth of top five exporters.
In 2018–2021, export growth of the top exporting countries increased except for Spain, which fell by $0.21 million. Japan and the Netherlands experienced the most significant export increase, $15.33 million and $10.18 million, respectively. At the same time, two other countries, Indonesia and Singapore, experienced almost even export growth at $2.32 million and $2.81 million. Based on the CMS decomposition, the export growth experienced in this period was due to the effects of world growth. During 2020–2021, the global COVID-19 pandemic caused many people to stay at home in isolation. It increased the number of new ornamental fish hobbyists, and their demand grew globally [71,72]. As shown in Figure 4, Japan and Netherlands owned the most considerable decomposition for the competitiveness effect that experienced positive growth. Japan had export growth with high competitiveness of $11.22 million, while the Netherlands grew by $4.91 million. Indonesia and Spain also obtained the effect of increasing competitiveness, but the value was only $0.6 million and $1.03 million. In contrast, Singapore’s competitiveness effect decreased significantly by $8.58 million.
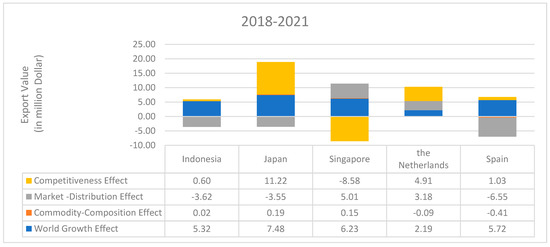
Figure 4.
Decomposition of 2018–2021 export growth of top five exporters.
4.2. Barriers to Indonesian Ornamental Fish Exports
4.2.1. Export Knowledge
To become an exporter, a company must have knowledge of the necessary regulations, certifications, and documentation, as well as where the product should be exported [73]. Many traders and breeders are unaware of the exporting procedures and destinations, so they end up selling their ornamental fish products to anyone willing to pay a specific price. As long as parties are willing to purchase their goods, they can only hope that there will always be sufficient finance to continue farming. In reality, exporting does not require them to be an exporter with an export license. They can sell their fish products abroad through exporters or transshipment companies that can assist ornamental fish businesses in exporting as long as they can find their own customers. Numerous betta breeders in Kediri, East Java, export their fish via transshipping services. Breeders can export even if they only send one or two fish through this service. They typically acquire customers through social media such as Facebook and Instagram. Those who have done exports usually gain export knowledge from their membership in an association of breeders or ornamental fish traders. This shows that network factors can also influence export knowledge, as farmers with many networks naturally find it easier to acquire export knowledge and can lower export barriers [74,75].
4.2.2. Foreign Language
Breeders and traders must communicate and understand a foreign language, notably English, to conduct business with foreign parties. English language skills are required, especially for transactions with European and United States customers. Some breeders and traders interviewed stated they were not interested in exporting because they could not understand English. In the EF English Proficiency Index 2022 report, Indonesia ranked eighty-one out of one hundred and eleven countries, significantly below Singapore at number two and Malaysia at number twenty-four. Nevertheless, Indonesia ranks higher than Thailand, which placed ninety-seventh [76]. However, this barrier might be overcome by some betta fish breeders in Kediri, East Java, who have already exported by using a mobile application such as Google Translate to communicate with foreign buyers. Therefore, if farmers are willing to learn, this language barrier can be overcome through technology. Moreover, according to Gebrewahid and Wald [25], the language barrier is no longer a significant issue.
4.2.3. Financial Capital
Financial resources are essential to the success of any business. Most ornamental fish enterprises fall under the micro-business category, meaning they need access to finance to expand their operations, purchase new brooders, and invest in marketing. Breeders or traders must sell their production fish as soon as possible to keep their businesses running and meet their families’ needs. Many breeders lack the resources to raise fish for longer than three months sustainably; as a result, fish that does not satisfy export standards is typically sold to traders within two months. However, some breeders can solve this financial difficulty by forming cooperatives. Cooperatives might take the form of savings and loan cooperatives or producer cooperatives that aid in acquiring and selling feed and ornamental fish goods.
Another barrier to becoming a direct exporter is the financial investment required to obtain company licenses and export permits. Financial issues are the most significant barrier for any company to become an exporter or even for exporters to grow their exports [44,49,77]. The government has the means to make this type of funding available, but it is not doing so for the ornamental fish industry in the same way it does for the edible fish industry.
Payments from importing companies are frequently delayed, causing exporters to incur high operational costs. Due to the importer’s payment deadline, exporters must have sufficient capital to pay dealers or collectors. However, some exporters end up delaying payment to dealers or collectors. This payment delay makes it difficult for collectors to purchase products from breeders, and it is not uncommon for traders to refuse to sell ornamental fish products to exporters. Many companies consider importer payment delays in the early stages of export development a problem, so exporters require significant initial funds [49]. To address the issue of buyer payment delays, exporters might take advantage of financing facilities now offered by the Indonesian Export Financing Institute (LPEI). However, few ornamental fish exporters employ this service, despite the fact that, according to Ling-Yee and Ogunmokun [31], export financing is one of the aspects that can increase export success.
4.2.4. Product
Quality, quantity, and continuity are three issues with Indonesian ornamental fish. Due to the poor quality of the broodstock, many breeders do not yet have high-grade ornamental fish for export. As a result, most ornamental fish are produced for the domestic market or sold to collectors. They are home-based micro-enterprises that produce on a small scale, making exports difficult. Therefore, they solely raise fish for collectors and exporters. As a result, the types demanded by the global market are frequently unavailable or difficult to find in the domestic market. Conversely, certain types of ornamental fish can flood the local market, lowering the selling price of breeders. The price drop is due to breeders being fascinated to join in developing certain types of ornamental fish that are selling well in the market, which causes these types to be overstocked.
“In reality, there is a high demand; nevertheless, many are not available when we look for it since breeders are breeding other fish”.(EX1)
The quality of ornamental fish is defined by a number of specific qualities such as size, color, fin development, sex, and health indicators such as scale loss, torn fin rays, eye injury, and parasite load [78]. The quality level of the fish commodities produced by breeders is frequently not standardized or does not meet export requirements. As a result, even for size, exporters must sometimes carry out their sorting to meet the buyer’s specifications. The quality of these ornamental fish can be regulated through the Indonesian National Standard (SNI). However, the SNI currently only includes fifteen ornamental fish species: ornamental shrimp (Caridine japonica), botia (Botia spp.), black ghost (Apteronotus albifrons), neon tetra (Paracheirodon innesi), angelfish (Pterophyllum spp.), super red arowana (Sceleropages legendrei), discus (Symphysodon sp.), rainbow (Melanotaenia sp.), rasbora (Rasbora sp.), wild betta (Betta spp.), koi (Cyprinus carpio), arowana (Sceleropages formosus), betta, goldfish (Carassius auratus), tiger fish (Datnioides sp.), and red nose (Hemigrammus spp.) [79].
“We at the Faculty of Fisheries do more research on human consumption fish, so BRBIH (Ornamental Fish Cultivation Research Center) should be encouraged to do more research to develop superior ornamental fish seeds”.(AC2)
Koi fish are the most popular ornamental fish in Indonesia. However, compared to other ornamental fish, koi fish export value is lower than goldfish or arowana. The low exports of Indonesian koi are due to the fish quality that is still inferior to Japanese koi fish, which has thus far dominated the global market. In addition, many breeders cultivate koi commodities in Blitar, which has hot weather. As a result, several exporters complained that koi products exported from Blitar had poor durability when exposed to winter, making re-exporting fish difficult.
“We once exported koi fish from Blitar, but the fish we sent all died during the winter, so we did not get any more orders”.(EX2)
In addition to the product barrier concerns mentioned above, an interesting point about the naming of super red arowana is still being debated. According to the arowana fish community, super red arowana should have a different species name and not the same as other types of arowana such as green arowana, Banjar arowana, Pinoh arowana, and golden arowana. Currently, all of these arowana species have the name Scleropages formosus or Asian arowana, which has been included in Appendix I of CITES since 1975 because it is considered a highly endangered species. In reality, super red arowana’s value is much higher than other Asian arowana. This fish is a national ornamental fish mascot that needs to be promoted to obtain a special place with a different species name, as Pouyaud et al. [80] proposed with Scleropages legendrei. However, this naming is still under debate and requires further research to make a distinct classification of this fish [81]. If this fish is scientifically proven to be different from other Asian arowana and thus has a different species name, it will significantly impact Indonesian export value. So far, Indonesian exporters have been reluctant to export other types of arowana due to the relatively low value; however, they have been equally demanding export tariffs and requirements because they have the same species name.
4.2.5. Production Technology
Farmers’ technology is still conservative, with limited production capacity. Breeders require more advanced equipment and technology to produce fish on a large scale for export rather than in small-scale production. Other exporters have utilized advanced technology to grow ornamental fish, such as goldfish. One of the interviewees, the top exporter of goldfish in Indonesia, indicated that Israel had become one of the largest exporters of goldfish, although having a smaller land area than Indonesia. Singapore employs a water-recirculating culture technology that enables ornamental fish to be cultivated and maintained in confined settings, such as using an intensive multi-tier automatic recirculation system [82].
“Our breeders’ technology is still relatively primitive. Many do not even have recirculating water facilities”.(CG3)
Botia or clown loach fish (Chromobotia macracanthus) is a beautiful ornamental fish endemic to Indonesia with a high export value and is in high demand worldwide. Nevertheless, the fish are still obtained from wild catches. The government has limited the export of wild-caught botia fish in the Minister of Maritime Affairs and Fisheries Decree No. 18 of 2020. However, due to the risk it poses to the species’ continued existence, botia cannot be continuously captured from the wild. Botia must be able to be cultivated by domestication or artificial propagation so that it is no longer dependent on nature [83].
“For sustainability concerns, we must figure out how to develop the technologies necessary to improve production by cultivating species that traditionally rely on wild-caught, such as botia or tiger fish”.(CG5)
In addition, several technologies can be applied in ornamental fish aquaculture to improve the industry’s efficiency, productivity, and sustainability, for example, recirculating aquaculture systems (RAS), biofloc technology, automated feeding systems, automated monitoring and control systems. RAS is a closed-loop system that allows for water recycling, reducing water consumption, and increasing water quality control. This technology can be applied in ornamental fish farming, especially for high-value species such as arowana and discus fish [84]. Biofloc technology is a system that utilizes microorganisms to consume and convert waste into protein-rich feed for fish [85].
4.2.6. Marketing and Promotions
Breeders and traders do not know where to find export buyers. The most important thing is that their fish are sold so that they can make money. Even if their product is export quality or will be exported in the future, they do not care. However, some breeders who have exported using transshipping services have suggested that participating in various online communities may help them attract potential purchasers. They can learn what kinds of fish are preferred by joining the group and finding out what is preferred.
Some exporters believe participating in the ornamental fish exhibition is crucial for acquiring new customers. However, participation in international ornamental fish exhibitions is too expensive. The government supports multiple shows of ornamental fish, such as Interzoo, but only for a limited number of exporters. Moreover, few exporters become members of international organizations such as OFI (Ornamental Fish International) for more global recognition. Holding domestic and international exhibits of ornamental fish is another method of marketing Indonesian ornamental fish products. However, holding an international show also demands substantial cash and government cooperation. According to the Directorate of Marketing of the Ministry of Maritime Affairs and Fisheries, the government’s funding is prioritized for edible fish over ornamental fish. Another method for identifying new markets is to conduct market intelligence, with which academics and the government can assist. However, market intelligence is rarely performed due to higher research priorities for edible fish. Regarding marketing, the government should strive toward maintaining and improving national information networks through means like holding exhibitions, employing e-commerce to bridge geographical gaps, informing businesses about export opportunities, and increasing export sales [86].
Selling pets on social media platforms such as Facebook and Instagram is forbidden. This ban prevents exporters from placing direct marketing in the media. However, exporters may still display images of fish, even if they do not intend to sell them directly.
4.2.7. Product Pricing
Breeders or traders new to exporting are unsure of what price to offer outside buyers. Therefore, when they post their fish production on social media and a potential buyer from outside inquires about the price of the fish, they sometimes use trial and error to determine bid prices. Breeders are concerned that buyers will be discouraged if the price is too high, but they also do not want the price offered to be only slightly higher than the price offered when selling domestically. This price element is also quite sensitive for long-time exporters, especially if new exporters offer very low fish prices through transshipping services. The market price of fish could fall as a result, which would be disastrous for major exporters. This pricing issue has also been discussed in several studies, especially difficulties in offering customers fair prices and matching competitors’ prices [87,88].
“We frequently use trial and error to determine the prices of betta fish that we post on social media. We suspect our price is too high when we make an offer and receive no response from potential buyers. Next time, we will try to reduce the price”.(BR1)
4.2.8. Government Support
There are numerous things that the government can do to boost exports, including directly enabling breeders to export and indirectly enabling breeders to increase the quality and quantity of products ready for export by exporters. For example, the government can socialize breeders or traders to start exporting by using transshipping services. They can also socialize breeders to use social media promotions that attract overseas buyers. Through technical assistance and incentives, this government assistance is critical to increasing exports [73]. The government can also assist with capital by providing soft loans, business equipment, or superior broodstock procurement. In fact, both the central and local governments have provided assistance to farmers in the form of equipment and breeding stock. However, this assistance does not always meet their requirements. For example, the government may provide pool equipment assistance when aquarium equipment is required, or broodstock assistance, but the quality of broodstock does not meet market needs. One government official from the local government stated that they had difficulty deciding what fish to buy and what price was appropriate for purchasing the broodstock. Many breeders, particularly those sourced from imports, have very high prices and are concerned about budget abuse if there is a problem one day. Finally, they purchased poor-quality broodstock that the farmers did not want, and many refused to give it to them.
“In terms of providing broodstock support, we in the fisheries department have limited ability to determine the quality of koi broodstock and how much to budget accordingly. Many of the broodstock that we provide as assistance to breeders end up being rejected on the reason that they are not good enough”.(LG1)
Several interviewed exporters complained about a lack of official assistance in promoting Indonesian ornamental fish items overseas. Trade attachés and Indonesian Trade Promotion Center (ITPC) should promote Indonesian Ornamental fish to assist market access, promotion, networking, and facilitation for regulation compliance in the host country. They can be export promotion agencies that significantly enhance export [89]. In addition, exporters mentioned that the government does not do enough to help them promote their products internationally by providing financial incentives to host or attend international ornamental fish shows in Indonesia, despite the fact that the government’s encouragement of trade shows is crucial to the growth of exports [90]. They also expected the government to subsidize land purchases for quarantine purposes near the airport. One of the factors studied concerning export obstacles was the absence of government incentives to expand exports [55]. Subsidies provided by the government, especially to new exporters, for instance, by lowering corporate taxes, can further promote exports [91].
4.2.9. Currency
Exporters face difficulties due to the volatile rupiah currency, mainly if regular buyers consistently delay payments. As a result, exporters sometimes keep cash flow available by delaying fish suppliers’ or collectors’ payments. Another issue related to the exchange rate is that the buyer requests payment in their currency. This request makes it difficult for small exporters who use transshipment services to export fish in small quantities because they are used to calculating the exchange rate in US dollars. Actors in the import-export business will encounter problems with this exchange rate. Increased exchange rates would harm exports while encouraging imports. Exporter maintains global market competitiveness by lowering profit margins in the face of appreciating currency [92]. However, in another paper, Pamornmast et al. [93] suggested that the exchange rate has no relationship with export competitiveness.
4.2.10. Business Environment
Many breeders only produce particular varieties of ornamental fish in response to collectors’ or exporters’ demands. Some breeders are part of exporter plasma, meaning that they are cared for by the exporters themselves. However, many of them are unaware of the actual export market quality requirements. According to many breeders, consumers’ preferences frequently shift, especially when new types of fish enter the market. This change motivates breeders to frequently alter their breeding tactics for ornamental fish to meet the market demand, resulting in an oversupply of fish on the market and low prices. Changes in market preferences make breeders increasingly reluctant to export. In addition, they are unstable because ornamental fish products are highly dependent on market demand. If production exceeds demand, prices will fall.
The export industry is highly competitive because of the prevalence of transhippers or export service providers. Breeders and traders can use transshipping services to market their ornamental fish goods to customers abroad. However, the price of fish being offered has unsettled exporters because it is lower than the standard market price that they charge their clients. Although the transshipping company has operated in Indonesia for over twenty years, its services have increased most dramatically in the last five years, as social media has made it simpler for breeders to sell their goods directly to overseas buyers online. However, many exporters have complained about the transshipping service sending fish quantities that exceed the permitted quarantine capacity. In addition, many transhippers have transported fish without first undergoing the quarantine procedure that the shipping firm was supposed to perform.
“There should be constraints on the species, and the number of fish that can use transshipping services, and these restrictions should correspond with the quarantine capacity”.(AS4)
The COVID-19 pandemic that occurred in early 2020 also affected ornamental fish businesses. Many ornamental fish businesses have closed, but some have made huge profits during the pandemic. One of our interviewees, a betta farmer, was able to own a new house and land due to the effects of the pandemic. This pandemic factor could happen again in the future and will be a challenge to export.
4.2.11. Export and Import Regulation
National export policies should be designed considering all stakeholders while preserving the sustainability and survival of species and the environment because improper government rules or policies may impede exports [44,52]. The prohibition on exporting invasive and predatory fish is one rule about which exporters have recently grumbled. Predatory fish cannot be exported from Indonesia due to the Prohibition on the Import, Cultivation, Distribution, and Export of Harmful Fish Species (PERMEN-KP No. 19 of 2020). Because of its enormous export potential, this embargo reduces the value of Indonesia’s exports. Many species of ornamental fish that are challenging to maintain in other countries may thrive in the tropical conditions of Indonesia, making the country a veritable paradise for ornamental fish cultivators. Exporters are currently negotiating with the government so that the laws for exporting predatory fish can continue to be authorized under specific conditions (such as not being sold on the local market and possessing specific certificates for ownership). Several export destination countries place a high priority on environmental sustainability. Thus, the government must be able to enact appropriate policies that safeguard the ecosystem while still maximizing Indonesia’s export potential. Environmental regulations may positively impact export competitiveness [41].
“The government’s intent to protect natural ecosystems from predatory fish is commendable. However, instead of banning the export of invasive fish, the government should take strict action against anyone who releases invasive fish into the wild. The government should still allow breeders to cultivate ornamental fish categorized as invasive with strict regulations, especially for export purposes”.(TR1)
Some exporters are concerned with the regulations governing the imposition of Non-Tax State Revenue (PNBP) expenses. These expenses are subject to the guidelines outlined in PP No. 85 of 2021, which govern the forms and rates of PNBP applicable to the Ministry of Maritime Affairs and Fisheries. Exporters do not mind paying their fair share of taxes, particularly for Indonesian-native endemic fish species. However, the exporter objected to paying PNBP prices on introduced fish species such as Brazilian arowana, which has a lower value compared to Indonesia’s super red arowana. Inconsistency in the rules set is another issue; for instance, the rules for charging fees that apply to particular types of fish are set only at certain seasons but are applied throughout the year.
Before entering the market of a particular destination country, exporters must examine the country’s regulations. To export to Brazil, for instance, a license from IBAMA (Ministry of Agriculture) is required, along with a health certificate signed by an official or institution, and a disease testing certificate based on the fish supplied [94]. Some importing countries have restrictions on importing ornamental fish from certain countries, making it difficult for Indonesian exporters to access these markets. For example, since January 2020, China has prohibited arowana imports, despite the fact that this is Indonesia’s primary export to China [95]. The high selling price of super red arowana contributes in part to the high export value of Indonesia’s ornamental fish. Indonesia has lost the possibility to market arowana due to this ban. However, exporters are still attempting to find other markets to replace the Chinese market, such as Taiwan and Hong Kong, even though lower pricing must be accepted. Similarly, several exporters stated that they could not export koi and goldfish to the United States because there is a health certificate requirement that currently cannot be fulfilled by the Fish Quarantine, Quality Control, and Fishery Product Safety Agency (BKIPM).
4.2.12. Buyer Characteristics
Buyers have different characteristics in terms of loyalty, according to exporters. Certain importers from specific countries constantly compare prices and quickly switch to other parties. Even though some parties offer lower prices, they do not move without first consulting with exporters who have been their long-term business partners. Other publications also mention buyer characteristics in terms of different sociocultural traits [88] and cultural differences [52].
“For our business, we are pleased to have committed consumers who are not readily enticed to move to other partners, despite cheaper alternatives. However, some customers always evaluate prices and ultimately purchase from competitors”.(EX5)
4.2.13. Smuggling
Some respondents, particularly super red arowana business community members and exporters, indicated that smuggling affected Indonesia’s export value. Super red arowana is an Indonesian fish species endemic to West Kalimantan Province that is on the CITES appendix list. This fish has a very high market value and exporting it requires arduous and time-consuming permits and procedures. According to government regulations, exporters may only export fish that they own. However, many of the exported products are sourced from West Kalimantan’s numerous small farmers and not from their captive breeding, and they continue to export a substantial amount of goods. These small farmers cannot export, so they sell captive fish to exporters or whoever is willing to pay. Several buyers purchase the super red arowana fish from small farmers and smuggle it into neighboring countries via land. Even though the police have made several arrests concerning this arowana fish smuggling, this activity is still ongoing [96]. Few researchers have addressed the issue of smuggling as part of export barriers in published works. According to numerous sources, smuggling results from export barriers such as high tariffs, and wildlife smuggling results from permits, specific customs, and CITES requirements [97,98]. However, whether smuggling is a barrier to exports or a result of the export barrier itself remains to be determined.
4.2.14. Shipping Cost and Procedure
Three main challenges for fish shipment in Indonesia are high shipping costs, lack of direct flights, and procedures and export services that still need improvement. In addition, due to the fragile nature of ornamental fish, the shipment problem may reduce Indonesian ornamental fish’s competitiveness compared to other exporters.
All of the exporters we interviewed complained about the high cost of logistics in Indonesia, especially the cost of shipping overseas. Logistics performance has become critical to export competitiveness [99]. According to the World Bank’s Logistics Performance Index data from 2018, Indonesia ranks forty-sixth out of one hundred sixty countries and fifth among ASEAN countries, trailing Singapore, Malaysia, Thailand, and Vietnam [100]. Indonesia’s logistics costs account for 26% of GDP, compared to 13% in neighboring nations [101]. This data suggests that compared to other Southeast Asian ornamental fish exporters such as Malaysia, Singapore, or Thailand, Indonesian ornamental fish shipping costs to market countries such as Europe or the United States will be relatively higher. Moreover, transportation expenses from one region to another or between islands will make shipping increasingly unattractive. In particular, eastern Indonesia provides a source of MOF. When deciding whether or not to import Indonesian ornamental fish, the high shipping cost is undoubtedly a factor for the importing country. Taking betta fish from Thailand will be more profitable than taking betta fish from Indonesia if the quantity taken is small. Due to the high cost of direct shipping to the United States or Europe, some Indonesian transhippers send fish to Thailand before sending it to its final destination.
Another problem with exporting ornamental fish is that they must first be transported to Banten or Jakarta because there are no direct flights from the regions where they are produced to the destination country. In order to reach their final destination, shipments of arowana fish from West Kalimantan must first pass through Jakarta. As a result, the total time and money spent by the purchaser will increase. Many breeders in West Kalimantan are frustrated by the complexity of the export process. Therefore, they sold their fish to anyone, including those who smuggled fish to Malaysia.
Export services with online systems occasionally encounter issues, and no manual replacement services are available, resulting in export cancellation. This export failure cost exporters significant money because they had to repatriate and repackage all of the fish. Another impediment is that the service time, which only occurs during certain working hours, causes exporters to arrive at the airport 12 h before departure, especially if the flight departs at dawn or early morning. This long time causes exporters to reduce fish density so that fish arrive in the destination country well and healthy, despite the fact that this time factor is one of the trade obstacles [102].
“Airport export services and customs officials should be available 24 h a day, seven days a week, and there should be a replacement using manual service if an online system fails”.(AS3)
4.3. Matrix Model for Export Barrier Levels
Although there have been many studies on export barriers, it is still rare to find studies explaining each barrier’s level. Based on the identification of export barriers above and various literature [25,44,48,54,87,88,103,104], we propose a matrix model that categorizes the export barrier levels. It consists of internal barriers for exporters and non-exporters and external barriers for exporters and non-exporters, as shown in Figure 5. Level I, or the earliest barriers, are internal barriers for non-exporters, called fundamental barriers, which are an organization’s readiness to export. The fundamental barriers relate to product factors (quality, quantity, and continuity), resources such as the ability to communicate in a foreign language, access to finance, and knowledge of export procedures and requirements. When the initial internal barriers have been passed, the organization will go through the next barrier, external barriers for non-exporters, called intermediate barriers. We defined the level II barrier as export market accessibility. Barriers at this level include competition with existing exporters, high shipping costs, difficulty obtaining export licensing processes, and difficulty finding buyers that match the seller’s conditions. If the organization has already exported, the next obstacle is increasing the value or volume of exports. At this stage, the organization must overcome more severe internal barriers called advance barriers: export operational challenges of resources and knowledge. In level III, the organization needs better-prepared human resources and marketing expertise to penetrate new markets and financial readiness to improve technology, facilities, and production capacity or increase product purchases from new suppliers. The last level of barriers is external barriers that are dynamic and uncertain, called complex barriers. These include government regulations regarding export restrictions or increases in export tariffs and barriers from importing countries that impose import bans, restrictions, or new requirements for import. In addition, factors such as changing consumer preferences, unstable exchange rates, unstable politics, and smuggling are also included in complex barriers.
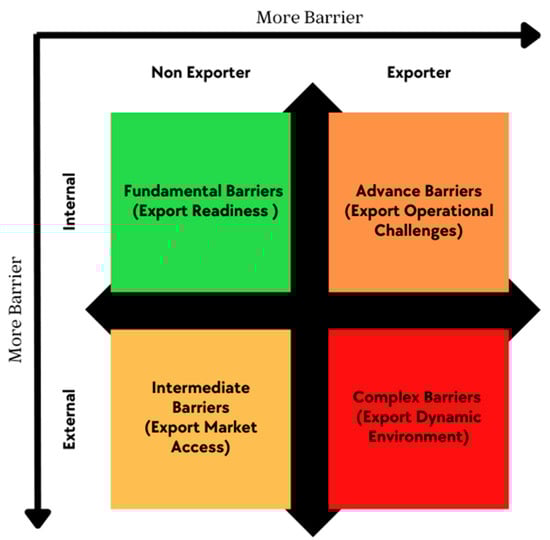
Figure 5.
Matrix model of export barriers level.
5. Conclusions and Policy Implications
The export of the Indonesian ornamental fish industry is critical as a source of foreign exchange, and those who make a living from it feel its impact even on a micro level. This paper examined the competitiveness of the Indonesian ornamental fish trade on international markets from 2012 to 2021 and came to some conclusions. First, Indonesia’s exports of FOF continue to grow at a rate of 6.6% per year, higher than the global average of 0.5% per year. However, MOF exports grew at a slower rate of 1.8% per year, trailing global export growth of 3.6% per year. Second, using the RCA approach to analyze the competitiveness of Indonesian FOF, the results indicate that Indonesia has a more significant comparative advantage than Singapore and Japan, indicating that Indonesia has the potential to be the world’s largest exporter. Indonesia’s RCA for MOF remains far below that of Sri Lanka, Spain, and the Philippines. However, Indonesia’s RCA remains higher than that of the Netherlands. Third, based on the competitiveness matrix analysis, the results show that Indonesia has not optimized the potential of FOF exports to Singapore, whose market is still growing dynamically, as well as to the world’s largest markets, the United States, China, and Japan. However, Indonesia performed well in the UK and French markets. Indonesia’s MOF exports can only do well in Hong Kong, Spain, and Germany. Finally, according to CMS analysis, the most competitive period for Indonesian ornamental fish was between 2015 and 2018, with the three time periods being 2012–2015, 2015–2018, and 2018–2021.
There are two significant factors that prevent Indonesian ornamental fish exports from becoming the largest exporter: factors preventing non-exporters, in this case, ornamental fish farmers or traders, from becoming exporters, and factors preventing exporters from increasing the volume and value of their exports. In this study, we develop a matrix model of export barrier levels that incorporates barriers for non-exporters in Level I and II. The barriers for exporters are in levels III and IV.
Level I barriers as fundamental barriers or export readiness for non-exporters include export knowledge, foreign language, financial capital, product, and technology, according to the discussed typology of export barrier levels. External barriers, such as a lack of government support, price, and business environment, are examples of Level II barriers as intermediary barriers. The barriers for exporters to enhance the volume and value of their exports are at level III (advance barriers or export operational challenges) and level IV (complex barriers or dynamic export environment barriers). Some barriers at level III may overlap with those at level I, to a slightly greater extent, for example, in the product category. At level I, product barriers take the form of fish product quality. However, at level III, the constraints in the quantity and continuity of fish products to be exported are more prominent. Similarly, level IV and level II barriers may overlap, such as lack of government support and business environment at different levels. At level II, government support is needed to reduce each barrier at level I, for example, the government provides support for access to finance, technical guidance, and broodstock assistance to improve the quality of fish production. In level IV, government support is needed to reduce barriers in level III, such as access to a wider market with promotional support by trade attachés and participation in international exhibitions. However, there are several complex barriers at level IV, such as export and import regulations, the process and cost of shipment of fish products, and smuggling. In summary, Level I and Level III barriers are categorized as internal barriers, which are all types of barriers related to organizational resources and knowledge in terms of informational, functional, and marketing [88]. On the other hand, level II and IV barriers are external barriers that relate to everything outside of the organization’s control related to procedural, government, task, and environment [73]. The higher the level, the greater the barrier for organizations to carry out the export.
Direct or indirect government assistance could overcome almost all barriers identified during the interviews. Most stakeholders agreed that the role of the government in expanding the ornamental fish industry and increasing exports is critical. Even government officials recognize the importance of their position. On the other hand, the government is aware of its current constraints and prioritizes human consumption of fish over ornamental fish. Moreover, exports can help improve the trade balance while also combating poverty and unemployment. As a result, rather than erecting new barriers, the government should assist businesses in mitigating the effects of restrictive export barriers. Furthermore, the government must develop policies and regulations that promote the long-term sustainability of the ornamental fish industry, such as regulations governing sustainable fishing practices to prevent overfishing and breeding practices and standards for ornamental fish production and export. The government should also help most micro-enterprise breeders gain greater access to financing and international markets, facilitate international trade, and increase the product’s quantity, quality, and continuity by improving breeders’ skills, resources, and broodstock. In addition, the government must implement strict quarantine and disease control measures for exporters and transhippers to ensure the health and safety of ornamental fish exports. Finally, the government must invest in better infrastructure to reduce the cost of shipping goods, including making it easier to add direct flights to major global destinations.
6. Limitations and Future Studies
This study does not purport to be exhaustive or without limitations. Due to insufficient data on the global ornamental fish trade before 2012 in the UN Comtrade, the secondary data used in this study began in 2012, limiting the analysis of Indonesia’s export competitiveness to the last ten years. Another limitation is that the six digit HS codes for ornamental fish exports taken in this research are those with codes 030110, 030111, and 030119. If other types of live fish are traded and not for consumption, but exist outside of these HS codes, they are not discussed in this study. This study’s analysis of ornamental fish export competitiveness is national in scope. In future, ornamental fish export competitiveness can be analyzed based on cluster or producing regions.
The qualitative analysis of export barriers was obtained through semi-structured interviews, identifying some barrier types based on the authors’ interpretations, which may differ from other studies. In future, a quantitative analysis can be performed to identify the most significant barriers to Indonesia’s ornamental fish export for exporters and non-exporters.
Author Contributions
Conceptualization, A.D.B.T.; methodology, A.D.B.T.; software, A.D.B.T.; formal analysis, A.D.B.T.; resources, A.D.B.T.; writing—original draft preparation, A.D.B.T.; writing—review and editing, A.D.B.T., M.H., S.J. and N.Z.; supervision, M.H., S.J. and N.Z. All authors have read and agreed to the published version of the manuscript.
Funding
This research received no external funding.
Institutional Review Board Statement
Not applicable.
Informed Consent Statement
Informed consent was obtained from all subjects involved in the study during the interview.
Data Availability Statement
The data that support the finding in this paper is openly available in 10.6084/m9.figshare.2325.
Conflicts of Interest
The authors declare no conflict of interest.
References
- FAO GLOBEFISH-Information and Analysis on World Fish Trade. Available online: https://www.fao.org/in-action/globefish/news-events/details-news/en/c/1373555/ (accessed on 29 November 2021).
- Novák, J.; Kalous, L.; Patoka, J. Modern Ornamental Aquaculture in Europe: Early History of Freshwater Fish Imports. Rev. Aquac. 2020, 12, 2042–2060. [Google Scholar] [CrossRef]
- Lim, L.C.; Dhert, P.; Sorgeloos, P. Preparation for Transport: Fish Packaging Technology. Ornam. Fish Int. 2007, 2, 25–45. [Google Scholar]
- Roberts, H.E. Fundamentals of Ornamental Fish Health, 1st ed.; A John Wiley & Sons, Ltd.: Ames, IA, USA, 2009; Volume 101, ISBN 9780813814018. [Google Scholar]
- Biondo, M.V.; Burki, R.P. A Systematic Review of the Ornamental Fish Trade with Emphasis on Coral Reef Fishes—An Impossible Task. Animals 2020, 10, 2014. [Google Scholar] [CrossRef] [PubMed]
- Pouil, S.; Tlusty, M.F.; Rhyne, A.L.; Metian, M. Aquaculture of Marine Ornamental Fish: Overview of the Production Trends and the Role of Academia in Research Progress. Rev. Aquac. 2020, 12, 1217–1230. [Google Scholar] [CrossRef]
- von Rintelen, K.; Arida, E.; Häuser, C. A Review of Biodiversity-Related Issues and Challenges in Megadiverse Indonesia and Other Southeast Asian Countries. Res. Ideas Outcomes 2017, 3, e20860. [Google Scholar] [CrossRef]
- Toro, M.; Pandia, S.; Ambudi, F. Presiden Meresmikan Pusat Pengembangan Ikan Hias-News Liputan6.Com. Available online: https://www.liputan6.com/news/read/74199/presiden-meresmikan-pusat-pengembangan-ikan-hias (accessed on 14 September 2022).
- World Bank. TradeCAN: Database and Software for a Competitiveness Analysis of Nations: User Guide; The International Bank for Reconstruction and Development/The World Bank: Washington, DC, USA, 1999. [Google Scholar]
- Destiningsih, R.; Sugiharti, R.R.; Togar Laut, L.; Nur Safiah, S.; Achsa, A. Competitiveness Identification of Fisheries Export in Indonesia. IOP Conf. Ser. Earth Environ. Sci. 2020, 530, 012017. [Google Scholar] [CrossRef]
- Ardi, I.; Prasetio, A.B.; Priyadi, A.; Johan, O.; Kusrini, E.; Fahmi, M.R.; Sukarman; Solichah, L.; Sinansari, S.; Permana, A.; et al. RAN: Riset Ikan Hias Indonesia Menuju Industri Perikanan; Balai Riset Budidaya Ikan Hias: Depok, Indonesia, 2017. [Google Scholar]
- Froese, R.; Pauly, D. FishBase—All Fishes Reported from Indonesia. Available online: https://www.fishbase.se/ (accessed on 29 November 2021).
- Hubert, N.; Kadarusman; Wibowo, A.; Busson, F.; Caruso, D.; Sulandari, S.; Nafiqoh, N.; Pouyaud, L.; Rüber, L.; Avarre, J.-C.; et al. DNA Barcoding Indonesian Freshwater Fishes: Challenges and Prospects. DNA Barcodes 2016, 3, 144–169. [Google Scholar] [CrossRef]
- Dahrudin, H.; Haryono; Wahyudwantoro, G.; Rusdianto; Utama, I.V.; Marwayana, O.N.; Mokodongan, D.F.; Sauri, S.; Priyatna, Y. Ikan Endemik Indonesia Seri Sumatera: Biologi Dan Pemanfaatannya; Sulistiono, H., Ed.; IPB Press: West Java, Indonesia, 2012; ISBN 9786232569263. [Google Scholar]
- KKP KKP Serius Garap Potensi Ikan Hias Nasional. Available online: https://kkp.go.id/djpb/artikel/12566-kkp-serius-garap-potensi-budidaya-ikan-hias-nasional (accessed on 11 December 2020).
- Kusrini, E. Budidaya Ikan Hias Sebagai Pendukung Pembangunan Nasional Perikanan Di Indonesia. Media Akuakultur 2010, 5, 109–114. [Google Scholar] [CrossRef]
- KKP Mengenal Si Cantik ’Harlequin’, Udang Endemik Dari Sulawesi Yang Terancam Punah. Available online: https://kkp.go.id/bkipm/artikel/24204-mengenal-si-cantik-harlequin-udang-endemik-dari-sulawesi-yang-terancam-punah (accessed on 3 May 2021).
- Statistik, B.P. Buletin Statistik Perdagangan Luar Negeri: Ekspor; Distribusi, D.S., Ed.; BPS RI: Jakarta, Indonesia, 2021. [Google Scholar]
- Arieta, S.; Gunawan, B.; Widya Setiabudi Sumadinata, R.; Ihsan, Y.N. Calling for Institutional Arrangements in Napoleon Wrasse Conservation and Management in Indonesia: The Anambas Islands Case. Mar. Policy 2022, 145, 105258. [Google Scholar] [CrossRef]
- Soh, B.H.; Lim, G.T.; Chua, S.Y. Competitiveness of Malaysian Fisheries Exports: A Constant Market Share Analysis. Malays. J. Econ. Stud. 2021, 58, 175–198. [Google Scholar] [CrossRef]
- Bojnec, S.; Ferto, I. Export Competitiveness of Dairy Products on Global Markets: The Case of the European Union Countries. J. Dairy Sci. 2014, 97, 6151–6163. [Google Scholar] [CrossRef] [PubMed]
- Drescher, K.; Maurer, O. Competitiveness in the European Dairy Industries. Agribusiness 1999, 15, 163–177. [Google Scholar] [CrossRef]
- Capobianco-Uriarte, M.d.l.M.; Casado-Belmonte, M.d.P.; Marín-Carrillo, G.M.; Terán-Yépez, E. A Bibliometric Analysis of International Competitiveness (1983–2017). Sustainability 2019, 11, 1877. [Google Scholar] [CrossRef]
- Delgado, M.; Ketels, C.; Porter, M.E.; Stern, S. The Determinants of National Competitiveness; National Bureau of Economic Research: Cambridge, MA, USA, 2012; p. 47. [Google Scholar]
- Gebrewahid, G.G.; Wald, A. Export Barriers and Competitiveness of Developing Economies: The Case of the Ethiopian Leather Footwear Industry. J. Afr. Bus. 2017, 18, 396–416. [Google Scholar] [CrossRef]
- Dai, Y.Y.; Yuan, Y.M.; Yuan, Y.; Zhou, Z.; Zhang, H.Y. Competitiveness of Chinese and Indonesian Tilapia Exports in the US Market. Aquac. Int. 2020, 28, 791–804. [Google Scholar] [CrossRef]
- Balassa, B. Trade Liberalisation and “Revealed” Comparative Advantage. Manch. Sch. 1965, 33, 99–123. [Google Scholar] [CrossRef]
- Vollrath, T.J. A Theoretical Evaluation of Alternative Trade Intensity Measures of Revealed Comparative Advantage. Weltwirtsch. Arch. 1991, 127, 265–280. [Google Scholar] [CrossRef]
- Mayes, D.G. The Effects of Economic Integration on Trade. JCMS J. Common Mark. Stud. 1978, 17, 1–25. [Google Scholar] [CrossRef]
- Katsikeas, C.S. Export Competitive Advantages: The Relevance of Firm Characteristics. Int. Mark. Rev. 1994, 11, 33–53. [Google Scholar] [CrossRef]
- Ling-yee, L.; Ogunmokun, G.O. Effect of Export Financing Resources and Supply Chain Skills on Export Competitive Advantages. J. World Bus. 2001, 36, 260–279. [Google Scholar] [CrossRef]
- Zhang, K.H. What Drives Export Competitiveness? The Role of Fdi in Chinese Manufacturing. Contemp. Econ. Policy 2014, 33, 499–512. [Google Scholar] [CrossRef]
- Paul, J.; Dhiman, R. Three Decades of Export Competitiveness Literature: Systematic Review, Synthesis and Future Research Agenda. Int. Mark. Rev. 2021, 38, 1082–1111. [Google Scholar] [CrossRef]
- Hongqiang, Y.; Chunyi, J.; Ying, N.; Yinxing, H. China’s Wood Furniture Manufacturing Industry: Industrial Cluster and Export Competitiveness. For. Prod. J. 2012, 62, 214–221. [Google Scholar] [CrossRef]
- Supongpan Kuldilok, K.; Dawson, P.J.; Lingard, J. The Export Competitiveness of the Tuna Industry in Thailand. Br. Food J. 2013, 115, 328–341. [Google Scholar] [CrossRef]
- Seleka, T.B.; Kebakile, P.G. Export Competitiveness of Botswana’s Beef Industry. Int. Trade J. 2017, 31, 76–101. [Google Scholar] [CrossRef]
- Bojnec, Š.; Fertő, I. The Duration of Global Agri-Food Export Competitiveness. Br. Food J. 2017, 119, 1378–1393. [Google Scholar] [CrossRef]
- Pascucci, F. The Export Competitiveness of Italian Coffee Roasting Industry. Br. Food J. 2018, 120, 1529–1546. [Google Scholar] [CrossRef]
- Narayan, S.; Bhattacharya, P. Relative Export Competitiveness of Agricultural Commodities and Its Determinants: Some Evidence from India. World Dev. 2019, 117, 29–47. [Google Scholar] [CrossRef]
- Buturac, G.; Mikulić, D.; Palić, P. Sources of Export Growth and Development of Manufacturing Industry: Empirical Evidence from Croatia. Econ. Res. Istraz. 2019, 32, 101–127. [Google Scholar] [CrossRef]
- Liu, J.; Xie, J. Environmental Regulation, Technological Innovation and Industrial Environmental Efficiency: An Empirical Study Based on Chinese Cement Industry. Int. J. Environ. Res. Public Health 2020, 17, 1427. [Google Scholar] [CrossRef]
- Mizik, T.; Szerletics, Á.; Jámbor, A. Agri-Food Export Competitiveness of the Asean Countries. Sustainability 2020, 12, 9860. [Google Scholar] [CrossRef]
- Long, Y. Export Competitiveness of Agricultural Products and Agricultural Sustainability in China. Reg. Sustain. 2021, 2, 203–210. [Google Scholar] [CrossRef]
- Okpara, J.O.; Kabongo, J.D. Export Barriers and Internationalisation: Evidence from SMEs in an Emergent African Economy. Int. J. Bus. Glob. 2010, 5, 169–187. [Google Scholar] [CrossRef]
- Leonidou, L.C. Empirical Research on Export Barriers: Review, Assessment, and Synthesis. J. Int. Mark. 1995, 3, 29–43. [Google Scholar] [CrossRef]
- Leonidou, L.C. Export Barriers: Non-Exporters’ Perceptions. Int. Mark. Rev. 1995, 12, 4–25. [Google Scholar] [CrossRef]
- Pinho, J.C.; Martins, L. Exporting Barriers: Insights from Portuguese Small- and Medium-Sized Exporters and Non-Exporters. J. Int. Entrep. 2010, 8, 254–272. [Google Scholar] [CrossRef]
- Ramaseshan, B.; Soutar, G.N. Export Barriers in the Western Australian Horticulture Industry. J. Int. Food Agribus. Mark. 1994, 6, 53–70. [Google Scholar] [CrossRef]
- Ahmed, Z.; Julian, C.; Mahajar, A.J. Export Barriers and Firm Internationalisation from an Emerging Market Perspective. J. Asia Bus. Stud. 2008, 3, 33–41. [Google Scholar] [CrossRef]
- Kahiya, E.T. Export Barriers and Path to Internationalization: A Comparison of Conventional Enterprises and International New Ventures. J. Int. Entrep. 2013, 11, 3–29. [Google Scholar] [CrossRef]
- Merino, F.; Monreal-Pérez, J.; Sánchez-Marín, G. Family SMEs’ Internationalization: Disentangling the Influence of Familiness on Spanish Firms’ Export Activity. J. Small Bus. Manag. 2015, 53, 1164–1184. [Google Scholar] [CrossRef]
- Kaleka, A.; Katsikeas, C.S. Exporting Problems: The Relevance of Export Development. J. Mark. Manag. 1995, 11, 499–515. [Google Scholar] [CrossRef]
- OECD. Top Barriers and Drivers to SME Internationalisation; Report by the OECD Working Party on SMEs and Entrepreneurship; OECD: Paris, France, 2009. [Google Scholar]
- Arteaga-Ortiz, J.; Fernández-Ortiz, R. Why Don’t We Use the Same Export Barrier Measurement Scale? An Empirical Analysis in Small and Medium-Sized Enterprises. J. Small Bus. Manag. 2010, 48, 395–420. [Google Scholar] [CrossRef]
- Suva, P.A.D.; Da Rocha, A. Perception of Export Barriers to Mercosur by Brazilian Firms. Int. Mark. Rev. 2001, 18, 589–610. [Google Scholar] [CrossRef]
- Chandra, A.; Paul, J.; Chavan, M. Internationalization Barriers of SMEs from Developing Countries: A Review and Research Agenda. Int. J. Entrep. Behav. Res. 2020, 26, 1281–1310. [Google Scholar] [CrossRef]
- Ortega, S.S. Export Barriers Insight from Small and Medium-Sized Firms. Int. Small Bus. 2003, 2426, 403–419. [Google Scholar] [CrossRef]
- Kahiya, E.T.; Dean, D.L. Export Stages and Export Barriers: Revisiting Traditional Export Development. Thunderbird Int. Bus. Rev. 2015, 58, 75–89. [Google Scholar] [CrossRef]
- DiCicco-Bloom, B.; Crabtree, B.F. The Qualitative Research Interview. Med. Educ. 2006, 40, 314–321. [Google Scholar] [CrossRef]
- Ryan, G.W.; Bernard, H.R. Techniques to Identify Themes. Field Methods 2003, 15, 85–109. [Google Scholar] [CrossRef]
- Corbin, J.; Strauss, A. Basics of Qualitative Research Fourth Edition; Sage: London, UK, 2015; ISBN 9781412997461. [Google Scholar]
- Stellian, R.; Danna-Buitrago, J. Revealed Comparative Advantages and Regional Specialization: Evidence from Colombia in the Pacific Alliance. J. Appl. Econ. 2019, 22, 349–379. [Google Scholar] [CrossRef]
- Dieter, M.; Englert, H. Competitiveness in the Global Forest Industry Sector: An Empirical Study with Special Emphasis on Germany. Eur. J. For. Res. 2007, 126, 401–412. [Google Scholar] [CrossRef]
- Nabi, I.; Luthria, M. Building Competitive Firms. Incentives and Capabilities; The World Bank: Washington, DC, USA, 2002; ISBN 0821351540. [Google Scholar]
- Fahmid, I.M.; Wahyudi; Salman, D.; Kariyasa, I.K.; Fahmid, M.M.; Agustian, A.; Perdana, R.P.; Rachman, B.; Darwis, V.; Mardianto, S. “Downstreaming” Policy Supporting the Competitiveness of Indonesian Cocoa in the Global Market. Front. Sustain. Food Syst. 2022, 6, 821330. [Google Scholar] [CrossRef]
- Nurkomariyah, S.; Firdaus, M.; Nurrochmat, D.R.; Erbaugh, J.T. Questioning the Competitiveness of Indonesian Wooden Furniture in the Global Market. IOP Conf. Ser. Earth Environ. Sci. 2019, 285, 012015. [Google Scholar] [CrossRef]
- Richardson, J.D. Constant-Market-Shares Analysis of Export Growth. J. Int. Econ. 1971, 1, 227–239. [Google Scholar] [CrossRef]
- Milana, C. Constant-Market-Shares Analysis and Index Number Theory. Eur. J. Polit. Econ. 1988, 4, 453–478. [Google Scholar] [CrossRef]
- Fagerberg, J.; Sollie, G. Reconsidered The Method of Constant Market Shares Analysis Reconsidered. Appl. Econ. 2006, 19, 37–41. [Google Scholar] [CrossRef]
- Tyszynski, H. World Trade in Manufactured Commodities, 1899–1950. Manch. Sch. 1951, 19, 272–304. [Google Scholar] [CrossRef]
- Weerasinghe, R.; Malkanthi, P. Impact of COVID-19 on the Productivity of Ornamental Fish Farmers: A Case of Ornamental Fish Farms in Colombo District in Sri Lanka. Int. J. Agric. Environ. Food Sci. 2022, 6, 545–556. [Google Scholar] [CrossRef]
- Davey, P. Pet Fish Ownership Jumps during the Pandemic Years—OATA—The Ornamental Aquatic Trade Association. Available online: https://ornamentalfish.org/pet-fish-ownership-jumps-during-the-pandemic-years/ (accessed on 8 December 2022).
- Vanegas López, J.G.; Merlos García, J.J.; Mayorga Abril, C.M. Flower Export Barriers: A Comparative Study in Colombia, Mexico and Ecuador. Lat. Am. Bus. Rev. 2017, 18, 227–250. [Google Scholar] [CrossRef]
- Milanzi, M.A. Export Barrier Perceptions in Tanzania: The Influence of Social Networks. J. Afr. Bus. 2012, 13, 29–39. [Google Scholar] [CrossRef]
- Francioni, B.; Vissak, T.; Musso, F. Small Italian Wine Producers’ Internationalization: The Role of Network Relationships in the Emergence of Late Starters. Int. Bus. Rev. 2017, 26, 12–22. [Google Scholar] [CrossRef]
- EF. EF English Proficiency Index; EF Education First: Lund, Sweden, 2022. [Google Scholar]
- Bellone, F.; Musso, P.; Nesta, L.; Schiavo, S. Financial Constraints and Firm Export Behaviour. World Econ. 2010, 33, 347–373. [Google Scholar] [CrossRef]
- Crosby, T.C.; Hill, J.E.; Martinez, C.V.; Watson, C.A.; Yanong, R.P. Grading Ornamental Fish. Edis 2006, 2006, 1–9. [Google Scholar] [CrossRef]
- Suhana; Ratna Marlianingrum, P. Ekspor Ikan Hias di Era Pandemi COVID-19:Tantangan dan Strategi; STIEMJ Press: Jakarta, Indonesia, 2021; ISBN 9786021415252. [Google Scholar]
- Pouyaud, L.; Sudarto; Teugels, G.G. The Different Colour Varieties of the Asian Arowana Scleropages Formosus (Osteoglossidae) Are Distinct Species: Morphologic and Genetic Evidences. Cybium 2003, 27, 287–305. [Google Scholar]
- Yue, G.H.; Chang, A.; Yuzer, A.; Suwanto, A. Current Knowledge on the Biology and Aquaculture of the Endangered Asian Arowana. Rev. Fish. Sci. Aquac. 2020, 28, 193–210. [Google Scholar] [CrossRef]
- Yue, G. The Ornamental Fish Industry in Singapore. J. Fish. China 2019, 43, 116–127. [Google Scholar] [CrossRef]
- Legendre, M.; Satyani, D.; Subandiyah, S.; Sudarto; Pouyaud, L.; Baras, E.; Slembrouck, J. Biology and Culture of the Clown Loach Chromobotia Macracanthus (Cypriniformes, Cobitidae): 1-Hormonal Induced Breeding, Unusual Latency Response and Egg Production in Two Populations from Sumatra and Borneo Islands. Aquat. Living Resour. 2012, 25, 95–108. [Google Scholar] [CrossRef]
- Elalouf, H.; Kaspi, M.; Elalouf, A.; Halachmi, I. Optimal Operation Policy for a Sustainable Recirculation Aquaculture System for Ornamental Fish: Simulation and Response Surface Methodology. Comput. Oper. Res. 2018, 89, 230–240. [Google Scholar] [CrossRef]
- da Cunha, L.; Besen, K.P.; Ha, N.; Uczay, J.; Skoronski, E.; Fabregat, T.E.H.P. Biofloc Technology (BFT) Improves Skin Pigmentation of Goldfish (Carassius Auratus). Aquaculture 2020, 522, 735132. [Google Scholar] [CrossRef]
- Al-Hyari, K.; Al-Weshah, G.; Alnsour, M. Barriers to Internationalisation in SMEs: Evidence from Jordan. Mark. Intell. Plan. 2012, 30, 188–211. [Google Scholar] [CrossRef]
- Kahiya, E.T. Five Decades of Research on Export Barriers: Review and Future Directions. Int. Bus. Rev. 2018, 27, 1172–1188. [Google Scholar] [CrossRef]
- Leonidou, L.C. An Analysis of the Barriers Hindering Small Business Export Development. J. Small Bus. Manag. 2004, 42, 279–302. [Google Scholar] [CrossRef]
- Lederman, D.; Olarreaga, M.; Payton, L. Export Promotion Agencies: Do They Work? J. Dev. Econ. 2010, 91, 257–265. [Google Scholar] [CrossRef]
- Hauswirth, I.A. Exhibitions as a Government Tool to Promote Exports—The Case of Germany. In Proceedings of the Exhibitions in 2.0 Years, between Internationalization and Local Development, Milan, Italy, 26 March 2012. [Google Scholar]
- Bagwell, K.; Staiger, R.W. The Role of Export Subsidies When Product Quality Is Unknown. J. Int. Econ. 1989, 27, 69–89. [Google Scholar] [CrossRef]
- Abeysinghe, T.; Yeok, T.L. Exchange Rate Appreciation and Export Competitiveness. The Case of Singapore. Appl. Econ. 1998, 30, 51–55. [Google Scholar] [CrossRef]
- Pamornmast, C.; Jermsittiparsert, K.; Sriyakul, T. Exchange Rate and Country’s Export Competitiveness: An Empirical Discourse Analysis. Asian Soc. Sci. 2013, 9, 147–156. [Google Scholar] [CrossRef]
- Sugianti, B.; Lafi, L.; Anggraeni, Y.; Japet, N.; Supardan, A. Persyaratan Ekspor Hewan Akuatik Ke Uni Eropa; KKP-BKIPM: Jakarta, Indonesia, 2014; pp. 1–45. [Google Scholar]
- Rafiq, M. China Stop Impor Arwana Super Red, Apa Upaya Pemerintah?|Kumparan.Com. Available online: https://kumparan.com/muhammad-rafiq-ii/china-stop-impor-arwana-super-red-apa-upaya-pemerintah-1wW7NaWWTvl (accessed on 6 December 2022).
- Gokko, B. Indonesia Ranks High on Legal Wildlife Trade, but Experts Warn It Hides Illegal Trade. Available online: https://www.eco-business.com/news/indonesia-ranks-high-on-legal-wildlife-trade-but-experts-warn-it-hides-illegal-trade/ (accessed on 3 February 2023).
- Blundell, A.G.; Mascia, M.B. Discrepancies in Reported Levels of International Wildlife Trade. Conserv. Biol. 2005, 19, 2020–2025. [Google Scholar] [CrossRef]
- Buehn, A.; Farzanegan, M.R. Smuggling around the World: Evidence from a Structural Equation Model. Appl. Econ. 2012, 44, 3047–3064. [Google Scholar] [CrossRef]
- Puertas, R.; Martí, L.; García, L. Logistics Performance and Export Competitiveness: European Experience. Empirica 2014, 41, 467–480. [Google Scholar] [CrossRef]
- World Bank Global Rankings 2018 | Logistics Performance Index. Available online: https://lpi.worldbank.org/international/global (accessed on 19 January 2023).
- Dinda, S.; Suharto; Assegaf, F. Government Targets Logistics Costs to Reach 17 Percent of GDP—ANTARA News. Available online: https://en.antaranews.com/news/216989/government-targets-logistics-costs-to-reach-17-percent-of-gdp (accessed on 11 December 2022).
- Hummels, D.L.; Schaur, G. Time as a Trade Barrier. Am. Econ. Rev. 2013, 103, 2935–2959. [Google Scholar] [CrossRef]
- Hutchinson, K.; Fleck, E.; Lloyd-Reason, L. An Investigation into the Initial Barriers to Internationalization Evidence from Small UK Retailers. J. Small Bus. Enterp. Dev. 2009, 16, 544–568. [Google Scholar] [CrossRef]
- Tesfom, G.; Lutz, C. A Classification of Export Marketing Problems of Small and Medium Sized Manufacturing Firms in Developing Countries. Int. J. Emerg. Mark. 2006, 1, 262–281. [Google Scholar] [CrossRef]


Disclaimer/Publisher’s Note: The statements, opinions and data contained in all publications are solely those of the individual author(s) and contributor(s) and not of MDPI and/or the editor(s). MDPI and/or the editor(s) disclaim responsibility for any injury to people or property resulting from any ideas, methods, instructions or products referred to in the content. |
© 2023 by the authors. Licensee MDPI, Basel, Switzerland. This article is an open access article distributed under the terms and conditions of the Creative Commons Attribution (CC BY) license (https://creativecommons.org/licenses/by/4.0/).