Article

Study on Rock and Surface Subsidence Laws of Super-High Water Material Backfilling and Mining Technology: A Case Study in Hengjian Coal Mine

1
College of Geoscience and Surveying Engineering, China University of Mining & Technology (Beijing), Beijing 100083, China
2
College of Mining and Geomatics, Hebei University of Engineering, Handan 056038, China
*
Author to whom correspondence should be addressed.
Sustainability 2023, 15(11), 8713; https://doi.org/10.3390/su15118713
Submission received: 18 April 2023 / Revised: 18 May 2023 / Accepted: 25 May 2023 / Published: 28 May 2023
(This article belongs to the Section Hazards and Sustainability)

Abstract

:
Research on the rock and surface subsidence laws of super-high water material backfilling and mining technology can provide a scientific basis for liberating coal resources that are deposited under buildings, railways, and bodies of water. Using field measurements, numerical simulations, and theoretical analyses to study the geological mining conditions of the Hengjian Mine in Handan, Hebei Province, this research comprehensively analyzes the dynamic and static deformation laws of rock and surface subsidence, reveals the subsidence control mechanism, complements existing studies and helps improve the feasibility of new technology in engineering practices. This study shows that rock and surface subsidence values are smaller when the super-high water material backfilling and mining technology are used, and the surface movement parameters are smaller than those of the fully caving mining method. The backfilling material supports the rock load above the mining area and suppresses the rock and surface subsidence. In addition, the super-high water backfilling material limits the height of the developing stress arch above the mining area, thus reducing the range of deformation in the rock and surface movement. In engineering practice, the development of the stress arch can be controlled by increasing the backfilling rate and the strength of the backfilling material. With the above-mentioned discoveries, this research is of great significance to the promotion and application of super-high water material backfilling and mining technology and the liberation of deposited coal resources.

1. Introduction

Energy plays a fundamental role in the survival and development of human beings [1,2]. More than half of China’s existing coal reserves cannot be safely mined because they are deposited under buildings, railways and waterbodies [3]. Meanwhile, the coal deposits under these buildings, railways and water bodies are concentrated in the relatively economically developed eastern and southern provinces of China, such as Jiangsu, Shandong, Anhui, Henan and Hebei provinces, where mining complexity is increasingly the result of the continuous scale increase in villages, which tend to be densely populated and have a complex population distribution; a similar situation exists in other coal mining countries [4,5]. At the same time, coal mining around the world inevitably causes surface subsidence, resulting in damage to surface infrastructure, making it important to ensure the safety of surface infrastructure while recovering deposited coal resources [6,7,8,9]; in addition, coal mining causes environmental damage such as the decline of groundwater, and it is worth paying attention to how coal mining can be carried out under a policy that meets environmental protection requirements [10,11,12]. Therefore, ensuring the green mining of coal resources and the sustainable development of surface infrastructure are the biggest challenges faced by the mining areas of deposited coal resources under buildings [13]. In response to resource depletion and the continued focus on green concepts, related scholars have conducted considerable research on the mining methods of coal resources under buildings, railways, and water bodies.
The three main existing surface subsidence control techniques are partial mining, coordinated mining, and backfilling mining [14]. Partial mining methods mainly include strip mining, room-and-pillar mining and thickness-limited mining. Dividing the coal seam into many formal strips, strip mining refers to the mining of some strips and the preserving of others, and the recovery rate is generally 40~50% [15,16]. The room-and-pillar mining method divides the stage or panel area into a number of rooms and pillars [17,18]. Thickness-limiting mining limits the height or total thickness of each mining operation. The latter two methods have been abandoned due to excessive coal loss. Coordinated mining is the simultaneous mining of several workings in the same seam or adjacent seams (or sub-seams) so that the resulting surface subsidence cancels each other out to achieve a reduction in surface subsidence. Backfilling mining refers to the replacement of underground mined coal seams with waste material, which backfills the space in the mined area and supports the overlying rock, thus controlling the movement of the rock and surface [19,20,21,22].
Some scholars have combined the advantages of these three mining methods and have, thus, proposed several joint classes of mining methods: strip interval filling mining [23,24,25], wide strip pillar mining [26], and “mining-backfilling-keeping” coordinated mining subsidence control technologies [27]. The general idea behind strip fill mining is strip fill mining and interval filling. The fill replaces the strip coal pillar, reducing environmental pollution and filling costs while controlling surface subsidence. The concept of full pillar mining in wide strips is to break down the surface deformation process into two stages: the wide strip-mining stage and the later full pillar-mining stage. By controlling the deformation values in the different stages, the surface can be protected, and full column mining achieved. The “mining-backfilling-keeping” method is a coordinated mining method of the partial mining, partial backfilling and partial retention of coal pillars, which mainly construct a stable joint pillar-backfilling support body with the original coal pillars as the core and several independent non-sufficient backfilling units to control the scope and height of rock deformation and damage and slow down surface movement and deformation. Among them, the related technologies of backfill mining are largely limited by backfilling materials.
The characteristics of the backfilling material in Goaf are the decisive factors of rock and surface subsidence control in backfilling technology. Traditional backfilling materials include dry backfilling with solid waste, hydraulic sand backfilling, paste backfilling, and high-water backfilling [28]. The dry backfilling of solid waste material mainly refers to the use of chemical waste, coal gangue, coal fly ash, smelting slag, and other solid accumulation of mining areas for backfilling, among which underground gangue backfilling is one of the main directions of research [29,30]. Paste backfilling is a method of processing solid waste into a toothpaste-like slurry, which is transported by gravity and pressure to the backfilling position [31,32,33,34,35]. Hydraulic sand backfilling refers to the use of a mortar pump or self-flow method, the tailing plant sand, smelter slag, crushed stone gravel, and other solid–liquid two-phase slurries that are transported to the well as a backfilling material to backfill the mining area. Because it is difficult to control the quality of the backfilling material and the backfilling process is complex, this method has been rarely used [36,37]. High-water backfilling is an inorganic gel material consisting of aluminate or sulfur aluminate rock, gypsum lime, etc., which is fast-setting and produces early strength after mixing; thus, it can be applied widely [38]. With the gradual decrease in the available backfilling materials and an increase in backfilling costs, Professor Guangming Feng of China University of Mining and Technology researched and invented super-high water backfilling material in 2008, which had the advantages of early strength and fast hardening, good flowability, adjustable initial setting time, flexible transportation, convenient extraction and no environmental pollution [39]. With so many advantages, it was regarded as an ideal backfilling material and has been widely acknowledged since its first successful adoption in the Handan mine in Hebei Province, China, in 2009.
Relevant scholars have conducted a lot of research on super-high water materials backfilling and mining technology, mainly focusing on underground mining and backfilling technology, the nature of backfilling materials, roof stability, and backfilling rate. The study of underground backfilling methods mainly includes two backfilling methods: bag backfilling and open backfilling [40]. The stress–strain intrinsic relationship of super-high-water materials has been investigated in terms of the backfilling material properties, and a mechanical model of the “backfilling body-immediate roof” was developed to analyze the effect of changes in material properties on the collapse distance of the roof [41]. Research on backfilling rates focuses on improving backfilling methods and backfilling sequences [42]. However, much research needs to be performed on super-high water backfilling materials to promote the effect of super-high water backfilling materials in engineering practice.
The study of rock and surface subsidence laws can better reflect the effect of subsidence control in super-high water material backfilling mining, and the analysis of surface subsidence factors can guide the better implementation of the coal mine backfilling process; therefore, the results of the study are of great significance to super-high water material backfilling and mining technology. However, research on surface subsidence laws and the factors influencing surface subsidence in super-high water material backfilling technology is not sufficient at present; therefore, this paper studies the subsidence law, influencing factors and subsidence control mechanism of super-high water material backfilling and mining technology.
This article is organized as follows: Section 1 describes the background to the mining of coal resources, the common methods of mining coal resources deposited under buildings, and the development of existing backfill materials. Section 2 presents the mechanical properties of the super-high water backfilling material, an overview of the study area, and the numerical simulation model parameters. Section 3 offers an analysis of the dynamic and static laws of the ground surface and rock at the working face with super-high-water backfilling and mining technology and the influence of different factors on the values of ground subsidence. Section 4 provides an analysis of the subsidence reduction mechanism and process flow for backfill mining. Section 5 serves as the conclusion of this article.

2. Materials and Methods

2.1. Super-High Water Backfilling Material

Super-high water backfilling material is a goaf backfilling material invented by Professor Feng Guangming of China University of Mining and Technology [43]. It refers to component A, which was composed of cement clinker, suspension dispersant, retarder, etc., and component B was composed of gypsum, quicklime, coagulant, etc. Water was added to these two components to form a single-component slurry, which did not condense for several hours. Once mixed, they could be quickly condensed and hardened. When the water volume reached 97%, it did not secrete water in its natural state and had a certain strength of a hard material containing water. The scanning electron microscope was used to scan and analyze the consolidation of the super-high water content material, and the results showed that the consolidation body was dominated by alumina and calcium in a reticular or needle-like pattern and that the increase in strength of the material resulted from the continuous densification of this structure.
The consolidation strength of the super-high-water material and the consolidation time of the backfilling material were the basic parameters for determining the super-high water material backfilling and mining technology [40]. The characteristic strength of the super-high water content material consolidation body changed with time, and the compressive strength curve of the consolidated body under the conditions of 91% to 97% water content with super-high-water material was plotted with time by indoor mechanical experiments (Figure 1a) [40]. Figure 1a shows that the early characteristics strength of the consolidated body of super-high water backfilling materials was obvious, and the strength increased slowly after 7 days: a property beneficial for the long-term stability of the backfilling.
After the super-high water backfilling material was used to backfill the goaf, the consolidation body supported the overlying rock, and the change in volume of the consolidation body directly affected the subsidence control effect. Figure 1b shows the variation in the volumetric strain with consolidation time for different water-to-volume ratios of the backfilling material, which indicated that the volume strain of the consolidated body of the super-high-water material after compression was small: about 0.00075~0.003 [40]. This was mainly due to the high-water content of the super-high-water material, fewer internal voids, and lower compressibility of the water as an incompressible fluid. Therefore, the volume change in the consolidated body of the super-high water backfilling material after compression in the stressed state decreased, which could benefit the backfilling of the goaf. A comprehensive analysis of the compressive strength and volumetric strain of the super-high water consolidation body basically concluded that the super-high water backfilling material was excellent.

2.2. Overview of the Study Area

The Hengjian Coal Mine is located in the northwestern part of Fu-Xing District, Handan City, Hebei Province, China, with an annual production capacity of 1,000,000 tons and convenient transportation. The 2515 working face is the first backfilling mining face of the Hengjian Coal Mine. The width of the working face is 100 m, with a continuous advancement length of 386 m and recoverable reserves of 276,000 tons. The thickness of the coal seam is 4.5 m, with a dip angle of 0–7°, which belongs to the No. 2 coal seam. The ground surface above the working face is located to the west of Zhangzhuang Village, and the ground is terraced with loess. Part of the working face area is located directly below the village, and there are no water bodies or shallow ditches on the ground surface, as shown in Figure 2.
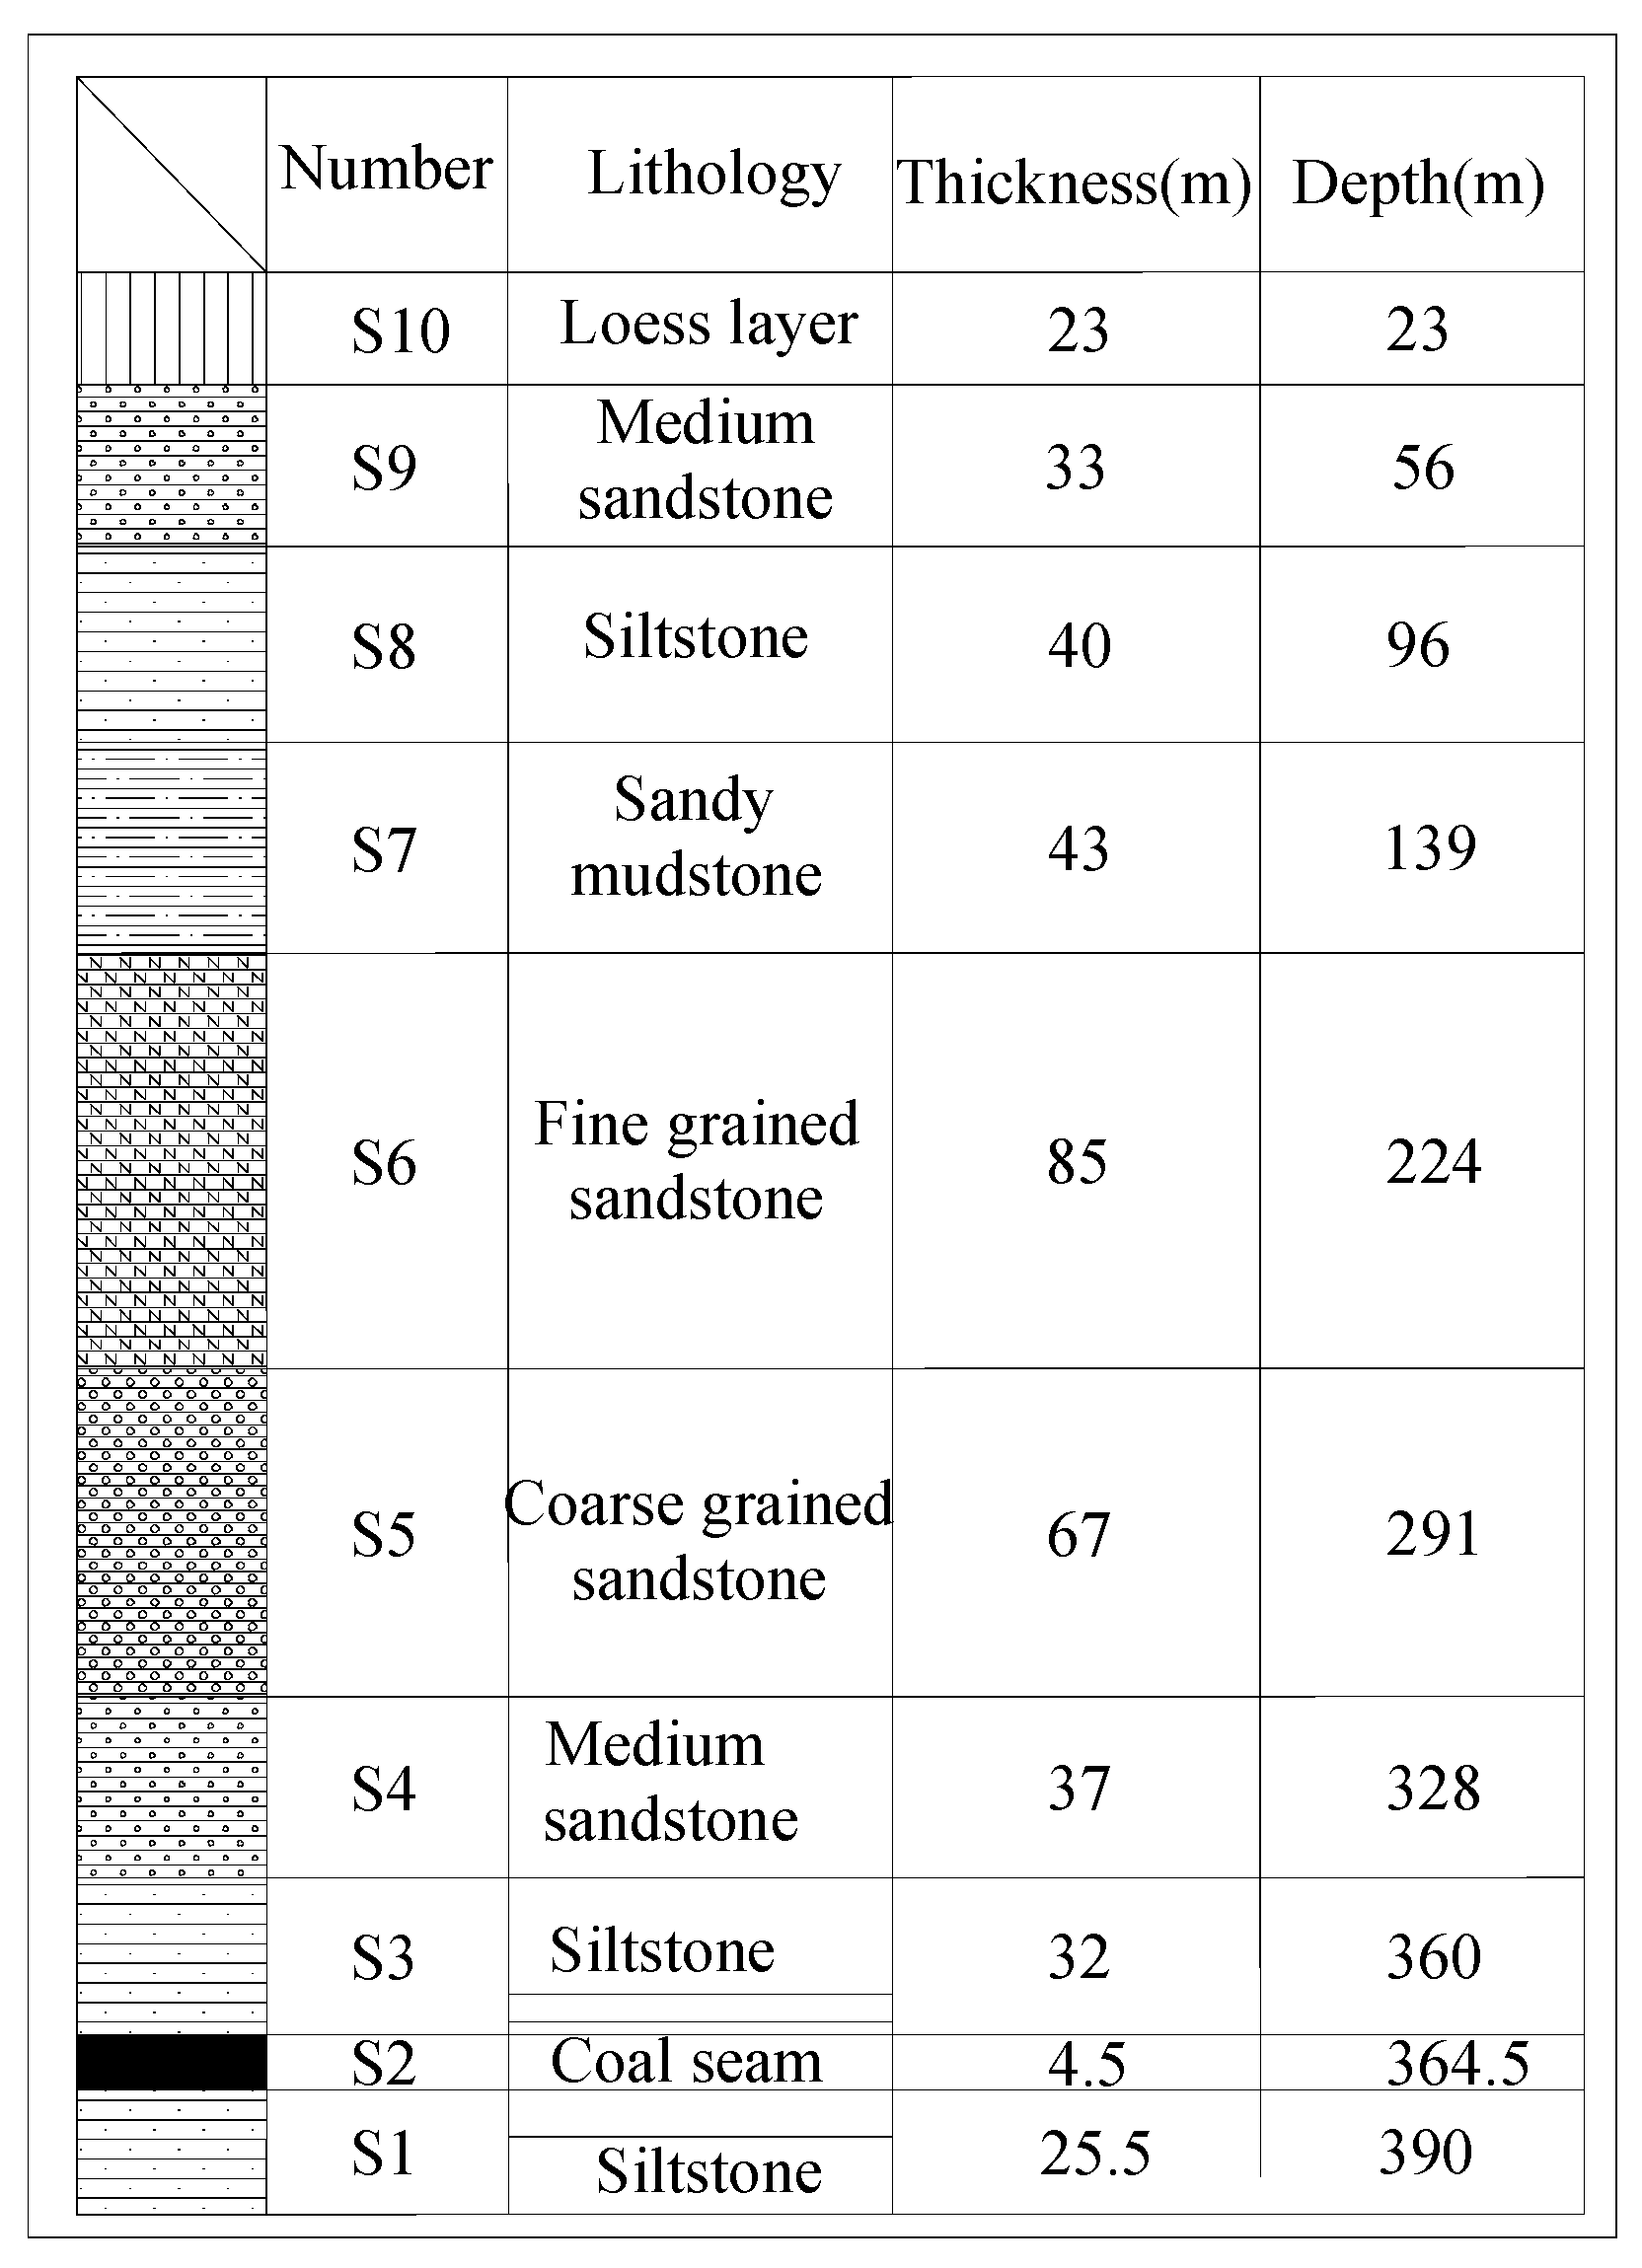
The No. 2 coal seam was relatively stable. The immediate roof of the coal seam was dark grey siltstone with an average thickness of 2.62 m, brittle, fractured, and could be easily dislodged, with local phases becoming medium-grained sandstone. The main roof is medium-grained sandstone, approximately 5.7 m thick, grey, and contained black minerals and carbonaceous strata. The upper roof was siltstone, approximately 20.12 m thick, grey-black, containing plant fossils. The immediate floor was a medium-grained sandstone, approximately 9.65 m thick, containing black minerals. The main floor was siltstone, approximately 15.85 m thick, grey, locally siliceous, and pyritic. Figure 3 shows the simplified distribution map of the overlying strata on the working face, in which rock strata less than 10 m were merged.
The 2515 working face uses a bag backfilling mining technology, whereby the slurry is guided through a pipeline to a pre-installed bag in the mining area, where it is shaped and consolidated as required. The slurry is prepared by the NJ160-4S3000 slurry preparation system on the surface; the slurry is transported to the working face by a pipeline, mixed 150 m in front of the working face, and then transported to the mining area. The 2515 working face uses a double drum coal miner to cut coal to a depth of 0.5 m, with a working mode of one team backfilling and two teams mining coal, with the miner cutting two cuts per shift and a cycle progress of 2 m.

2.3. Monitoring Method

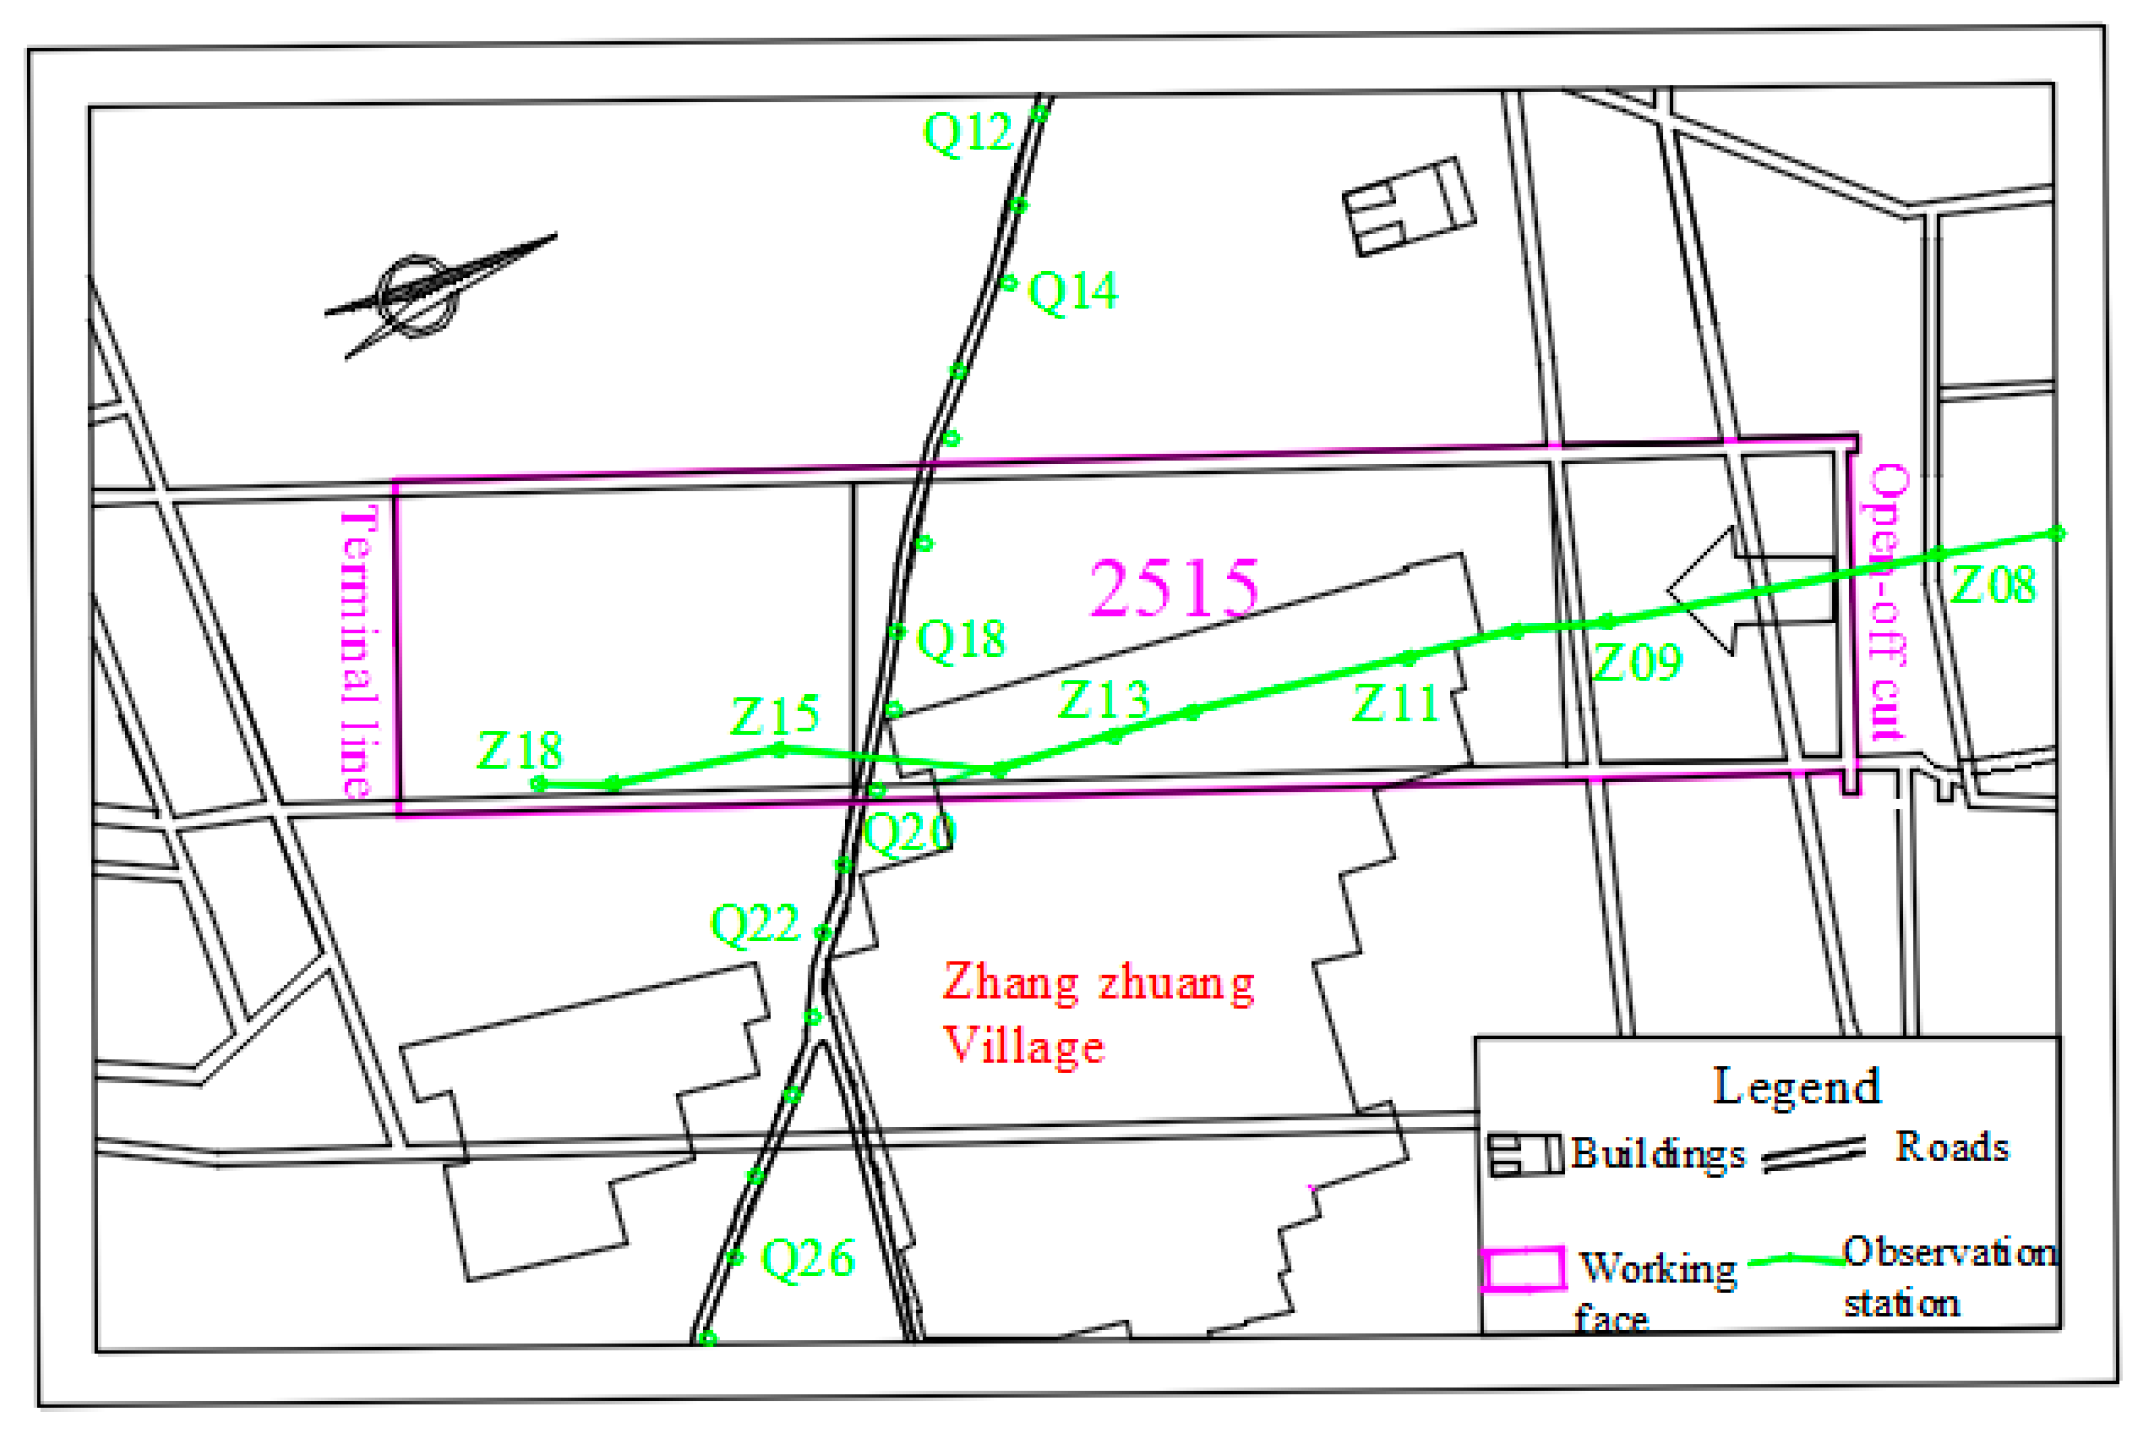
According to the geological and mining conditions of the 2515 working face of the Hengjian Mine, two observation lines of ground subsidence were laid above the 2515 working face: one is the strike observation line, and the other is the incline observation line. The strike observation line (named line Z) was arranged above the 2515 working face along the direction of the advancement of the working surface. Limited by the surface topography and the principle of facilitating long-term observation, the position of the observation line was adjusted according to the distribution of the main roads on the ground, including a total of 18 observation points of which the point number was Z1–Z18, a fixed interval of 40 m and a total length of 700 m. The incline observation line (named line Q) was set in the center of the working surface and perpendicular to the strike observation line, containing a total of 39 measurement points. The point number was Q1–Q39, the average interval was 25 m, the total length was 1000 m, and Q1 and Q39 represented the fixed points (Figure 4).
After the establishment of the 2515 surface subsidence observation lines, it was necessary to measure the surface subsidence of the working face mining before, after, and during mining. The main task of the daily survey on working face 2515 was to obtain the elevation and coordinate information on the observation station of ground movement. The main instruments used during the measurements were the RTK (real-time kinematics) and level, and the observation period of the project was 1 time/month with a cumulative total of 12 observations.

2.4. Numerical Simulation

2.4.1. Model Establishment

Numerical simulation is one of the important methods that is widely used in mine subsidence research because it is repeatable, convenient, and fast [44]. FLAC3D (Fast Lagrangian Analysis of Continua in 3 Dimensions) is mostly used to study the movement deformation of rock formations, underground roadway deformations, and the changing law of surrounding rock mining. The variables and functions defined by FLAC are relatively convenient, and the stress values of the overlying rock displacement meter can also be extracted using its own Fish language and can interact with the image post-processing software Tecplot 360 EX 2015 R1 software; therefore, the FLAC 3D 6.0 numerical simulation software was selected to study the displacement of rock formations and land surface subsidence under different conditions [45,46,47].
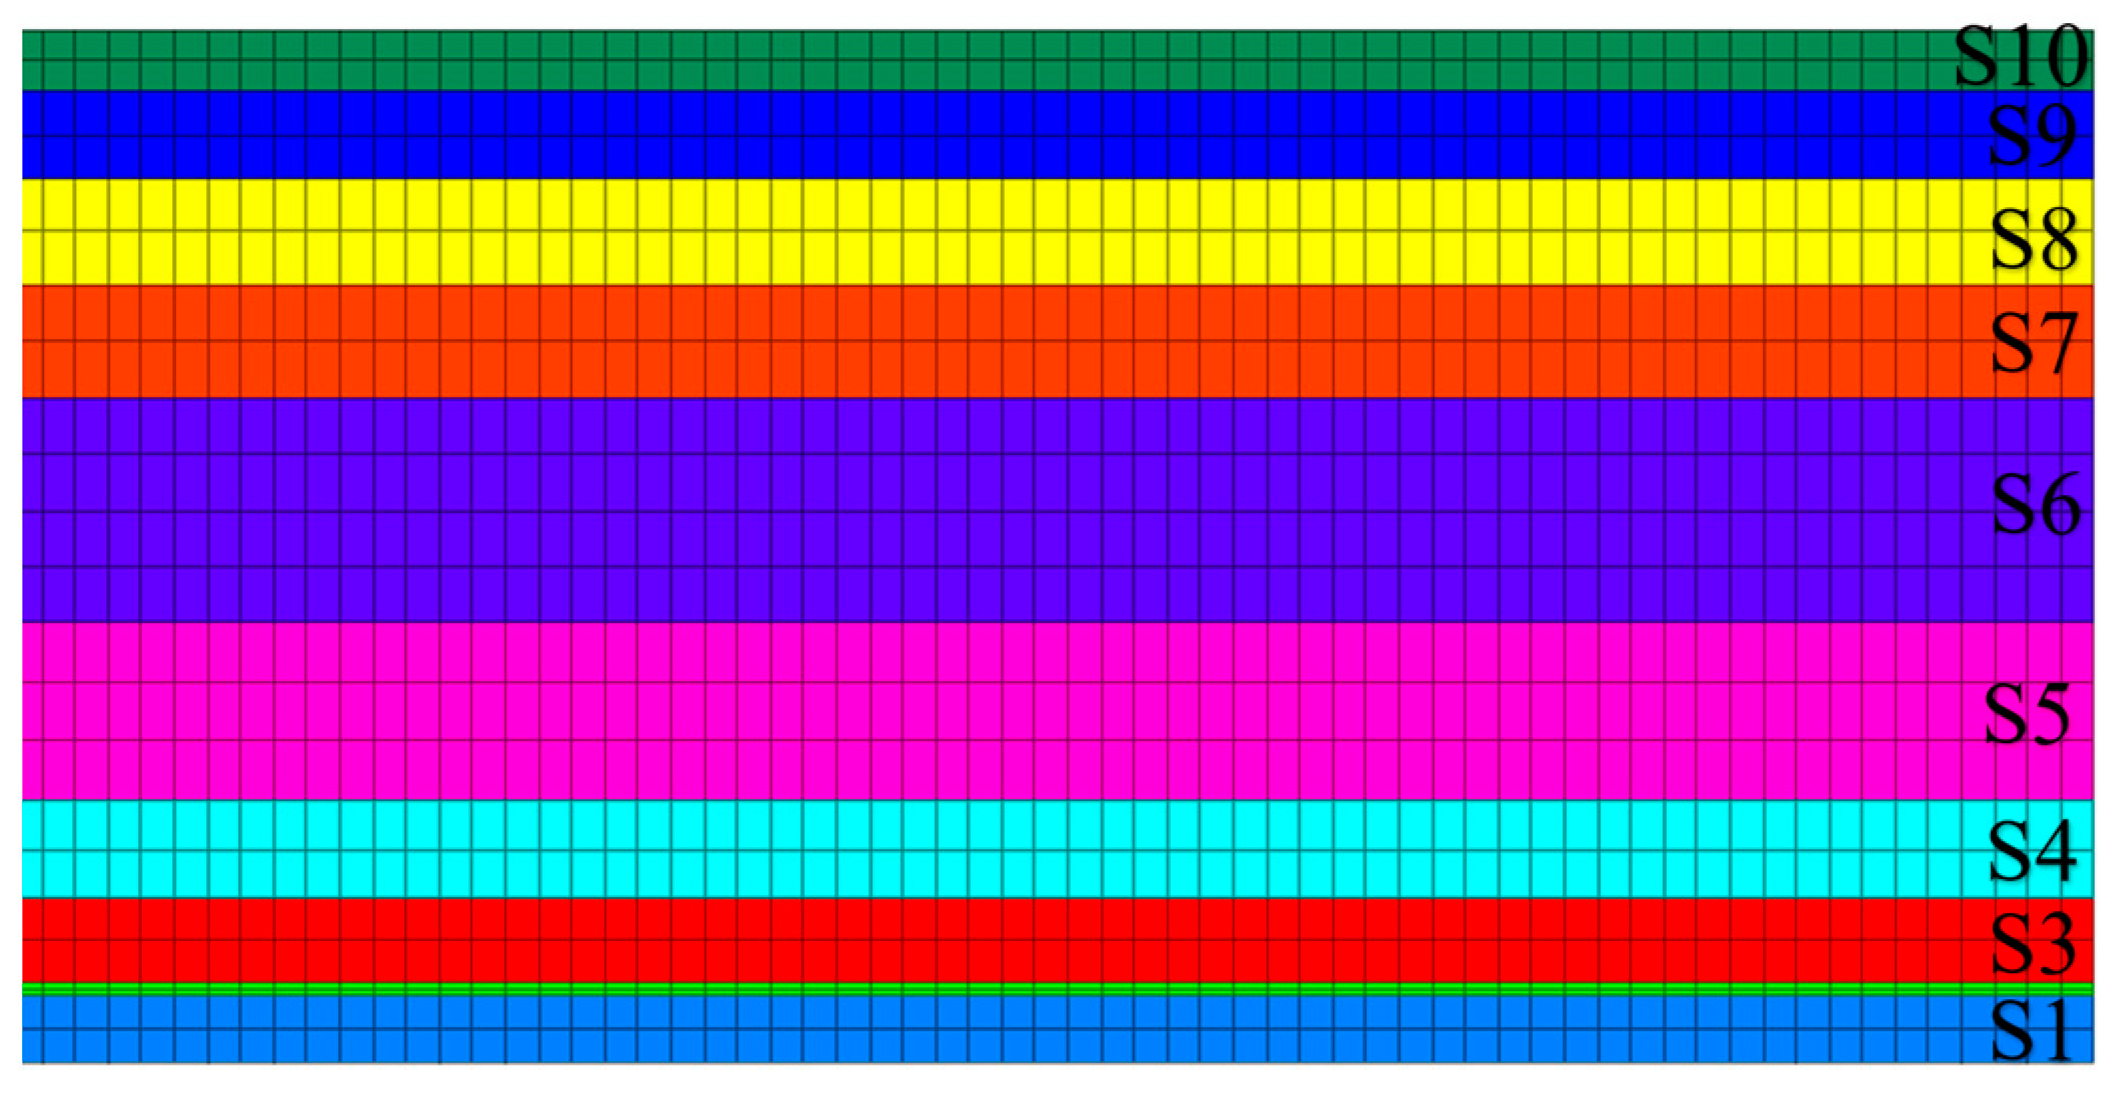
The actual mining size (386 m × 100 m × 4.5 m) of the 2515 working face was simplified. The model simulated a working face with dimensions of 400 m × 100 m × 4.5 m, leaving 400 m coal pillars at the front and behind and 505 m coal pillars at the left and right, respectively, with a simulated backfilling rate of 90%. According to the properties of the rock formations, the overlying rock of the 2515 working face model was simplified, the size of the numerical model was set to be 1500 m × 900 m × 390 m, and the model was divided into 36,400 units and 44,206 nodes. The inclination angle of the coal seam at the working face was small, and the model was a near-horizontal coal seam. During the excavation process of the underground coal seam, the damage to the coal seam and rock was mainly manifested as tensile shear and compression shear damage; therefore, the Moore–Coulomb criterion was adopted as the damaged basis of the coal seam and rock in numerical simulations. Considering the actual situation and boundary effects, the x- and y-direction displacement constraints were set at the boundary around the model, and the z-direction displacement constraints were set at the lower part, while the upper boundary of the model was a free boundary with no constraints. Because it was directly simulated to the surface, only the stresses generated by the model under the conditions of self-gravity were considered. This model does not consider the influence of structural surfaces such as joints and fissures. To improve the accuracy of the calculation, the number of layers in the z-direction was set according to the thickness of the coal rock seam. The overall numerical simulation model constructed is shown in Figure 5.
After the initial model was built, the model was calculated using the cyclic excavation and backfilling command in Fish language, where the backfilling rate could be controlled by controlling the height of the backfill after excavation to simulate different backfilling rates when the backfilling rate was 90%, this equated to excavating 4.5 m of high coal and then backfilling 4.05 m of high backfill. Each excavation step was 2.0 m, and backfilling was carried out after the excavation was complete. After each excavation and backfilling step, the model continued to excavate and backfill while the cycle continued until the model was excavated to a predetermined position. In addition, this paper compared and analyzed the subsidence laws of the rock and ground surface above the mining area of different mining methods. The simulation process of fully caving method mining lacked the backfilling process compared to super-high water material backfilling and mining technology; the rest of the conditions were the same.

2.4.2. Parameter Selection

The physical and mechanical parameters of each rock layer in the model were obtained by laboratory tests, with reference to the physical and mechanical parameters of the rock and soil mass adjacent to the working face, and finally, a set of parameters with better simulation results were obtained as the parameters of this simulation experiment. The mechanical parameters of the backfill material were derived from laboratory data in the relevant literature and were mainly used for the secondary definition of the mining space parameters after progressive mining; the process of definition was considered to simulate the process of the backfilling the working face [40,48]. The physical and mechanical parameters of the 2515 working face numerical simulation rock are shown in Table 1.

3. Results

3.1. Analysis of Measurement Results

3.1.1. Characteristics of Ground Subsidence after Mining

Figure 6 demonstrates the moving deformation trend characteristics of the subsidence profile of strike surface subsidence after mining. The maximum subsidence of the strike observation line was located at point Z9, which was 66 m from the open-off cut, with a subsidence of −0.270 m and a surface subsidence ratio of approximately 0.06. The super-high water material backfilling and mining technology significantly reduced the surface subsidence value. The subsidence of −0.269 m at point Z8 near the surface above the coal pillar was inconsistent with the rule that the subsidence above the coal pillar should be about half of the maximum subsidence value when the horizontal coal seam was mined by the fully caving method because the backfilling material supports the movement of the overlying rock, effectively preventing the breakage of the immediate roof and reducing the surface subsidence. The maximum tilt was 1.8 mm/m, and the tilt curve decreased outwards from the inflection point of the subsidence curve. The maximum curvature was −0.03 mm/m2, and this curvature curve fluctuated severely.
Figure 7 demonstrates the moving deformation trend that is characteristic of the inclined surface subsidence basin profile after mining. The maximum subsidence point of the incline observation line was located at point Q17, with maximum subsidence of −0.24 m, and the maximum subsidence value was on the district dip side of the mining area, which is consistent with the distribution pattern of the maximum subsidence of fully caving mining. The maximum tilt was 2.2 mm/m, and the maximum curvature was −0.07 mm/m2.
Field measurements showed that the distribution of the surface subsidence characteristic points for the super-high water material backfilling and mining technology was not consistently comparable to fully caving mining, but the surface movement deformation trend was essentially similar to fully caving mining. The surface tilt and curvature deformation values of super-high water material backfilling and mining technology were less than the surface I damage [49]. No obvious cracks were found on the surface during the mining period, and no structural damage occurred in the nearby village buildings. The main reason for the analysis was that super-high water material backfilling alleviated the deformation and damage of the overlying rock layers, reduced the overburdened transport, and correspondingly weakened the range and extent of surface subsidence.

3.1.2. Dynamic Variation in Ground Subsidence

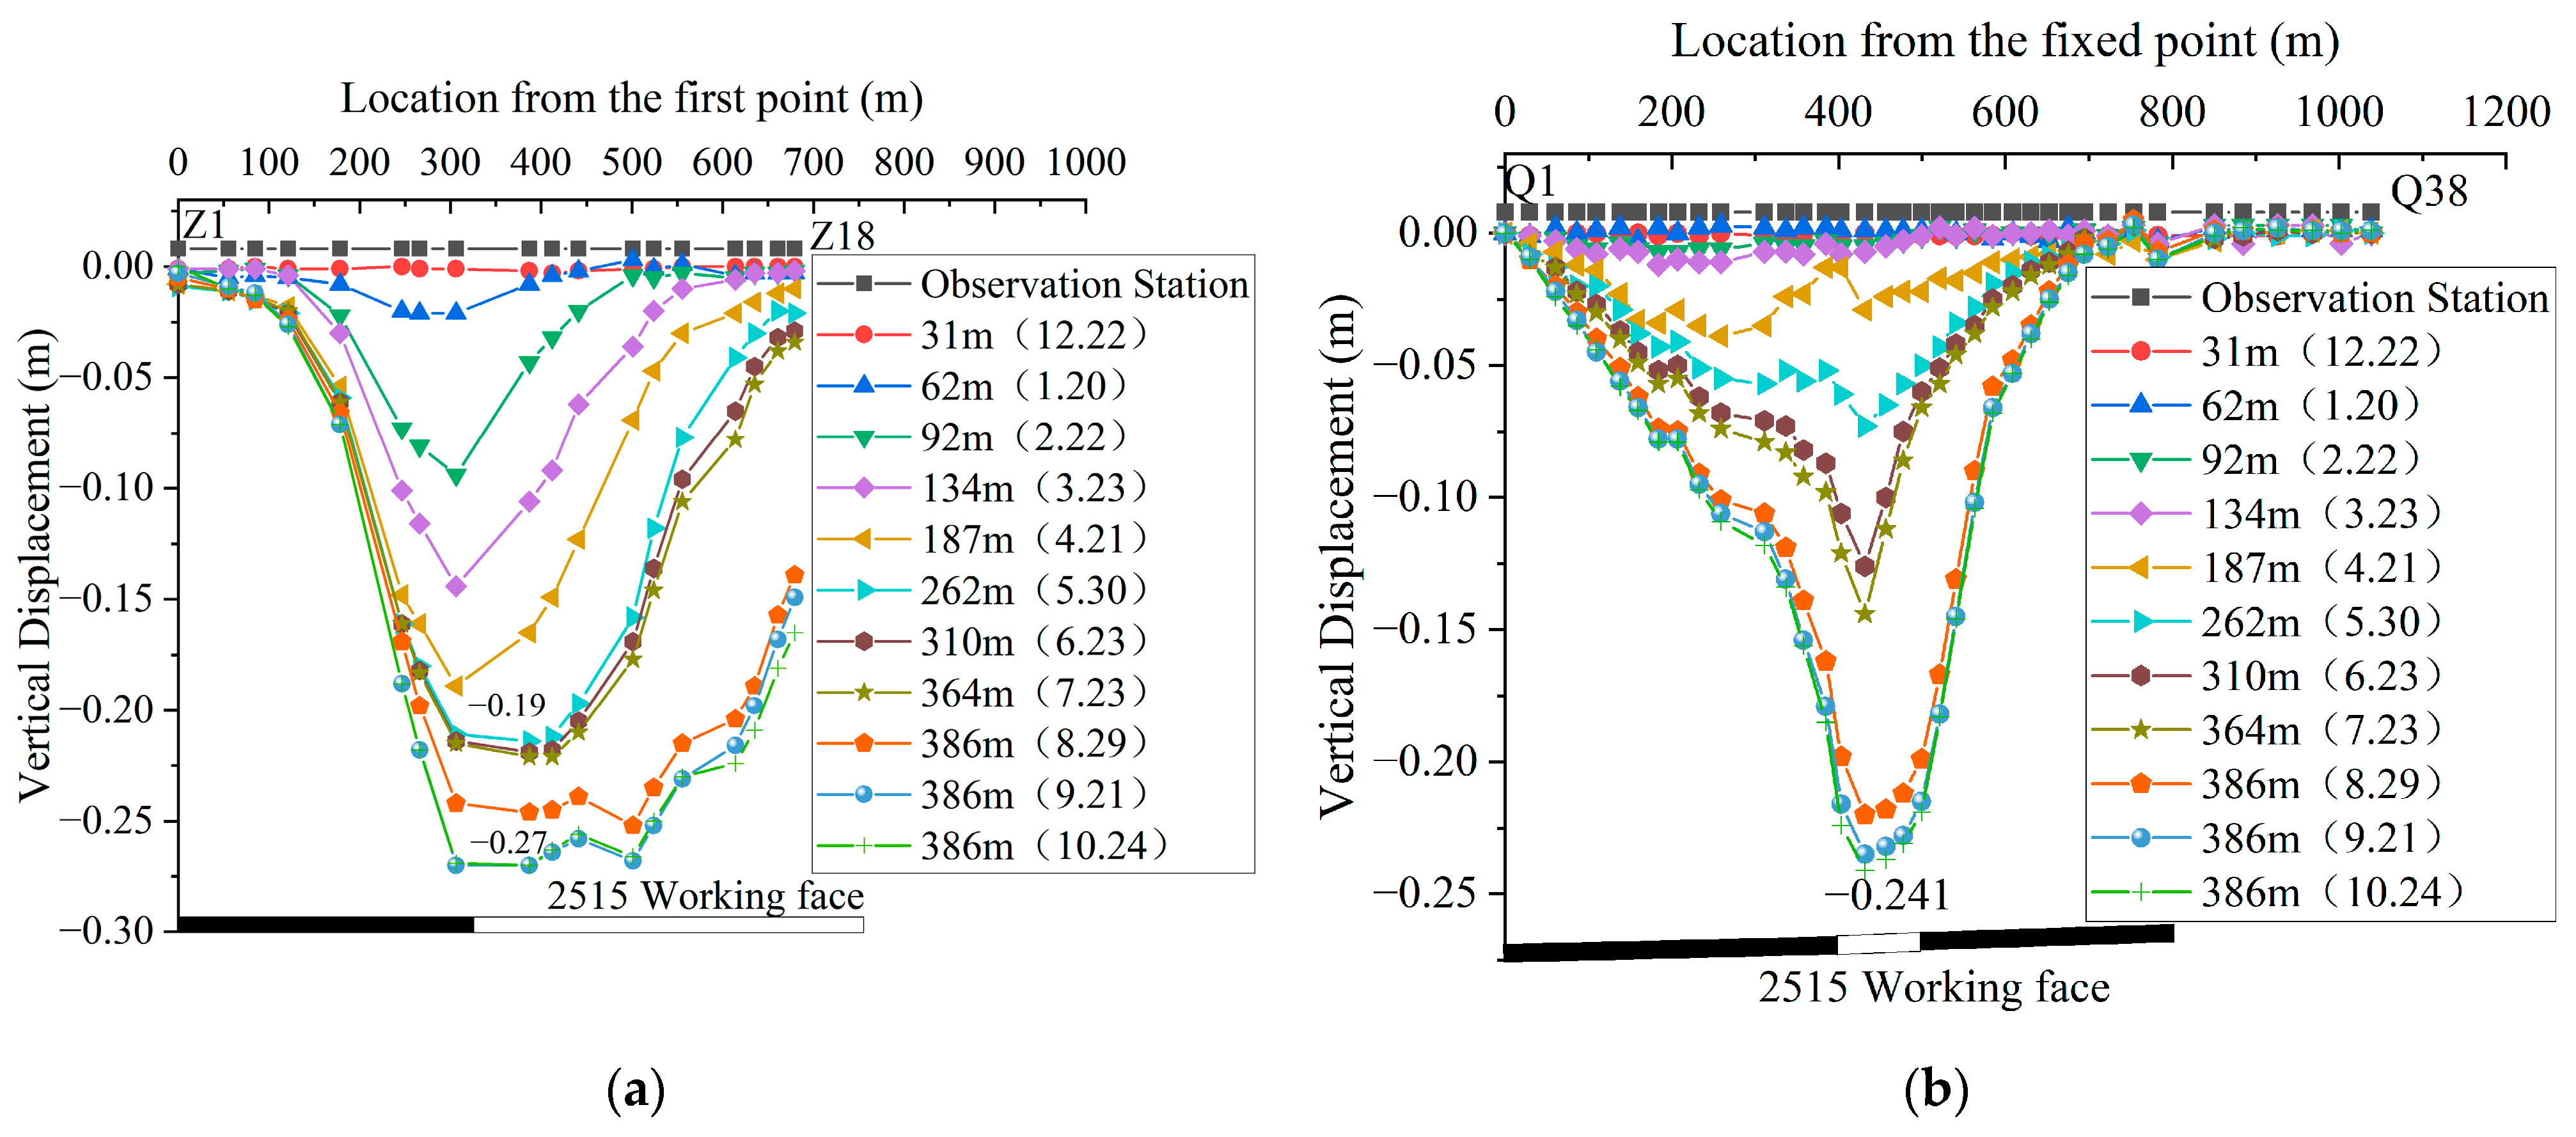
Figure 8 shows the surface subsidence process of the two profile lines of the subsidence basin during the advance of the working face. When the working face advanced to 187 m, the subsidence value of the Z8 point was the largest, with a value of −0.19 m, the maximum subsidence at the end of observation was −0.27 m (Z9), and the maximum subsidence value of the surface of the observation line increased with the increase in the advancing position of the working face. At the same time, the range of the surface subsidence basin continued to expand. Figure 7b shows that the dynamic surface movement and deformation curve in the incline direction increased with the advance of the working face, which was consistent with the regular fully caving mining method. The dynamic surface subsidence curves of different advancing positions were asymmetrical with the centers of the working face, and the shape of the subsidence curve in the dip direction appearing gentler than that in the district rise direction, which was mainly due to the influence of the adjacent old mining areas and the dip angle of the coal seam. The maximum surface subsidence value in each period was always toward the dip direction. The position of the maximum subsidence value changed with the relative position of the advancing working face, and the moving direction generally pointed to the advancing direction of the working face. On August 29, the increase in the surface subsidence curve at 386 m was greater than that of the previous periods, mainly because at 364 m, the front part of the working face support flaked and the top slab fell seriously, while the backfilling rate decreased to 88%, and the surface subsidence increased significantly.
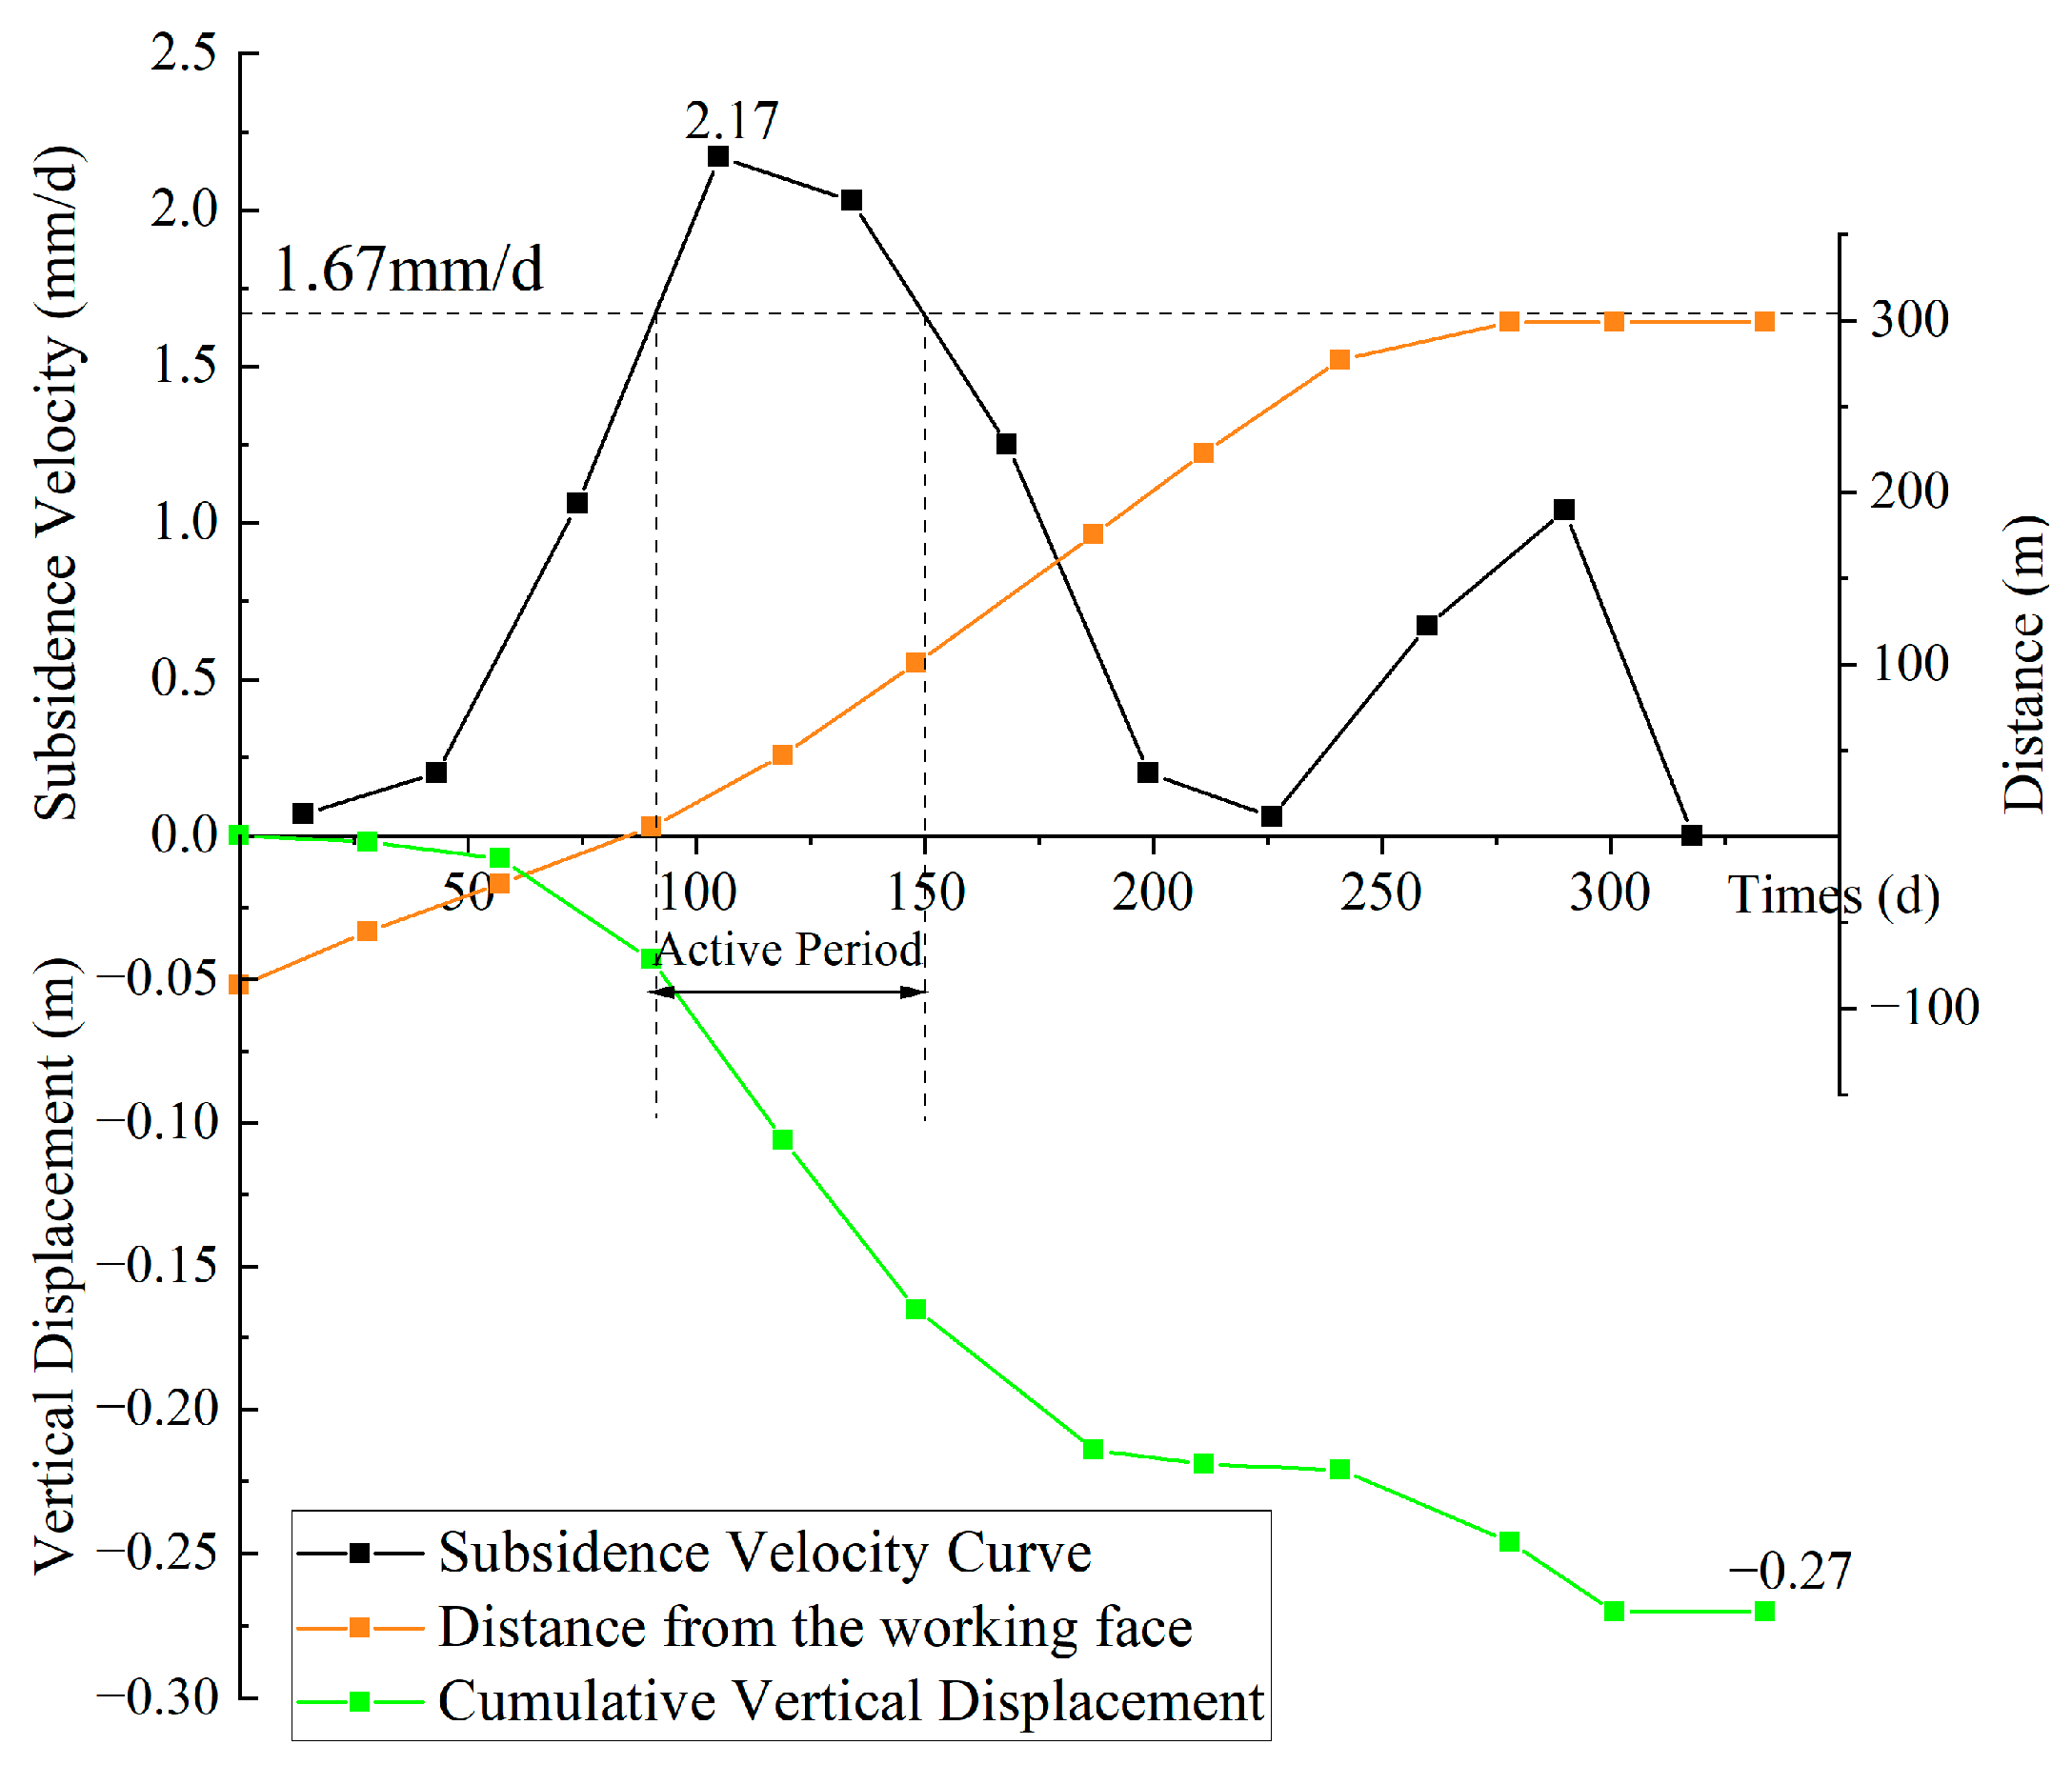
The maximum surface subsidence after the completion of the last period of observation was at point Z9, with maximum subsidence of −0.27 m. The surface subsidence velocity curve at point Z9 was plotted according to the observation data of each period (Figure 9). Figure 9 shows that with the increasing distance of the working face advancement, the surface subsidence velocity showed a trend that first increased and then decreased before increasing, which was due to the decrease in the backfilling rate on day 241. The maximum value of Z9 subsidence velocity was 2.17 mm/d, which was defined as the active period according to the surface subsidence velocity, which was greater than 1.67 mm/d [50]; the accumulated active period at point Z9 was 60 days, accounting for 18% of the total surface movement days. The accumulated surface subsidence during the active period was −120 mm, and the active period subsidence accounted for 44% of the total subsidence. The active period accounted for a smaller proportion of the total settlement than the conventional fully caving mining method under the same geological mining conditions at adjacent workings.

3.1.3. Related Parameters of Surface Movement

(1)
Factor of full extraction
The strike and inclination lengths of the 2515 working face were 386 and 100 m, respectively. The lithology was a medium-hard rock formation; the actual mining height was 4.5 m, the inclination angle was taken as 3.5°, and the average mining depth was 360 m. Based on the above-mentioned parameters and Equations (1)–(3), the factor of full extraction for the 2515 working face could be calculated as follows [49]:
n = n 1 · n 3
where n is the surface mining degree factor and n1 and n3 are the strike and incline mining degrees, respectively, which can be calculated as follows:
n 1 = k 1 · D 1 H 0
n 3 = k 1 · D 3 H 0
where k1 and k3 are the coefficients relating to the lithology of the overlying rock layers on the working face, with 0.7 for hard rock layers, 0.8 for medium-hard rock layers and 0.9 for soft rock layers. D1 and D3 are the lengths of the inclination and strike of the working face, respectively, and H0 is the average mining depth of the working face.
Based on the relevant parameters of the 2515 working face, it was calculated that the factor of full extraction was 0.43, and the strike and inclination did not reach critical mining.
(2)
Starting distance of surface subsidence
The ground subsidence basin was gradually formed during the advance of the working face. The distance of the working face advanced when the influence of underground mining activities on rock reached the surface, which was called the starting distance of the surface subsidence [50]. This starting distance was generally considered the mined length of the working face when the surface subsidence reached 10 mm, which was about 1/4 to 1/2 of the mining depth (Figure 10). The subsidence at the surface observation point was less than 5 mm when the 2515 working face advanced by 31 m, while the maximum subsidence was 21 mm when the working face advanced by 62 m. Based on the value of surface subsidence when the working face advanced by 31 m and advanced by 62 m, it could be inferred that the starting distance of the 2515 working face in super-high water material backfilling and mining technology was 55 m: far less than the 1/4 of the mining depth of the 2515 working face (360 m).
(3)
Surface subsidence factor based on measured data
In coal mining, when a critical mining condition was reached where the maximum surface subsidence value did not increase with the size of the working face, the ratio of the maximum subsidence value of the surface to the projection of the coal seam thickness in the plumb direction was called the subsidence factor [49]. The formulae for calculating the subsidence factor of the critical mining and subcritical mining conditions are shown in Equations (4) and (5).
W c m = q M cos α
W f m = q M n cos α
where Wcm is the maximum surface subsidence value under critical mining conditions, mm; Wfm is the maximum surface subsidence value under subcritical mining conditions, mm; q is the subsidence factor; M is the normal thickness of the coal seam; α is the dip angle of the coal seam; n is the coefficient of mining subsidence, and could be calculated in the same way as Equation (1).
Based on the measured maximum subsidence of −0.27 m on the surface of the 2515 working face, a coal seam inclination of 5° and an n of 0.43 meant that the subsidence factor could be calculated as approximately 0.14.

3.2. Analysis of Numerical Simulation Results

3.2.1. Rock Strata Movement Processes

(1)
Stress distribution variation laws
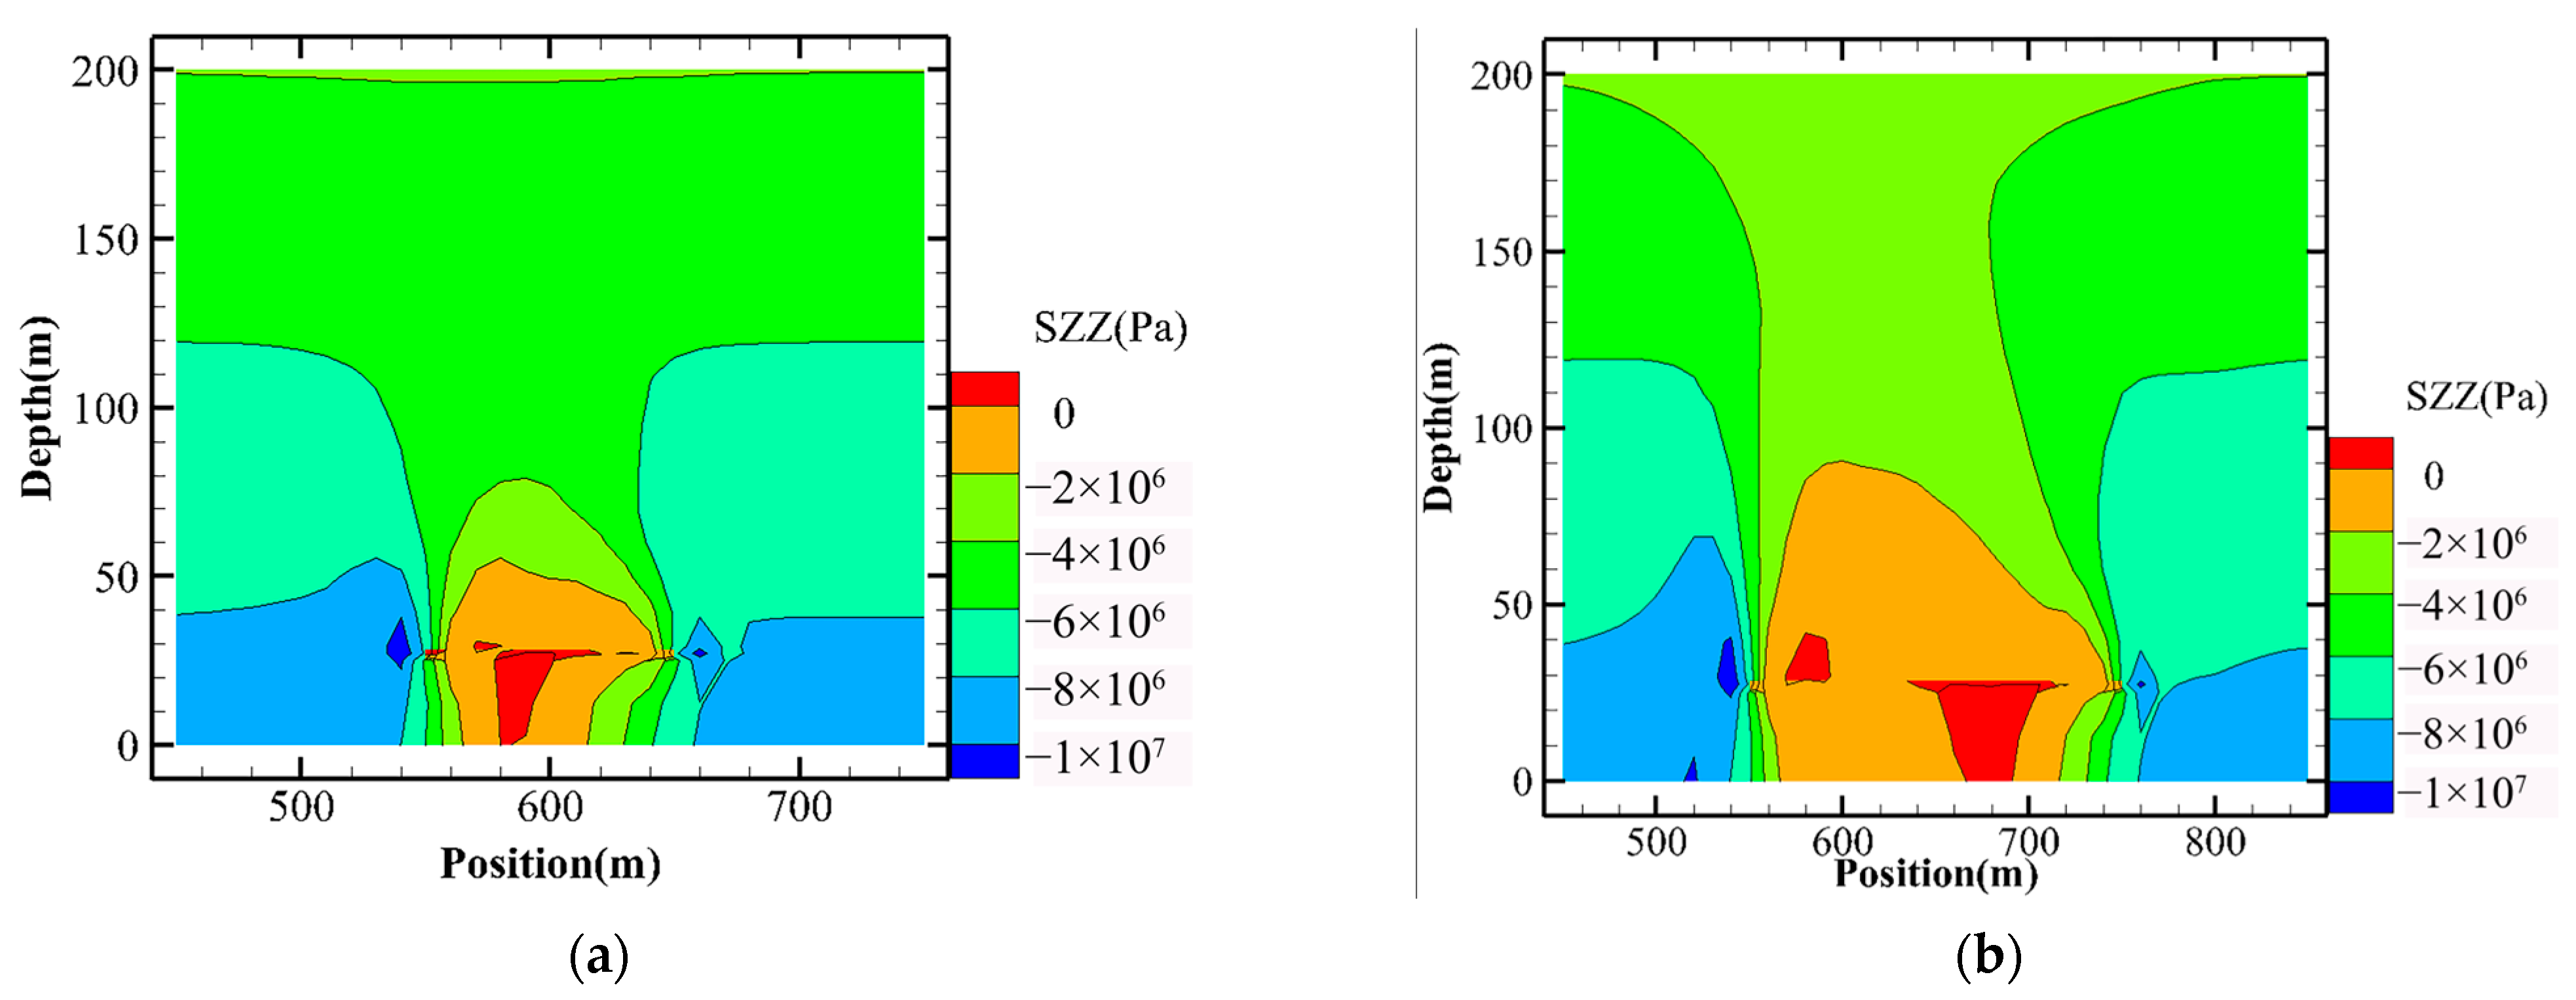
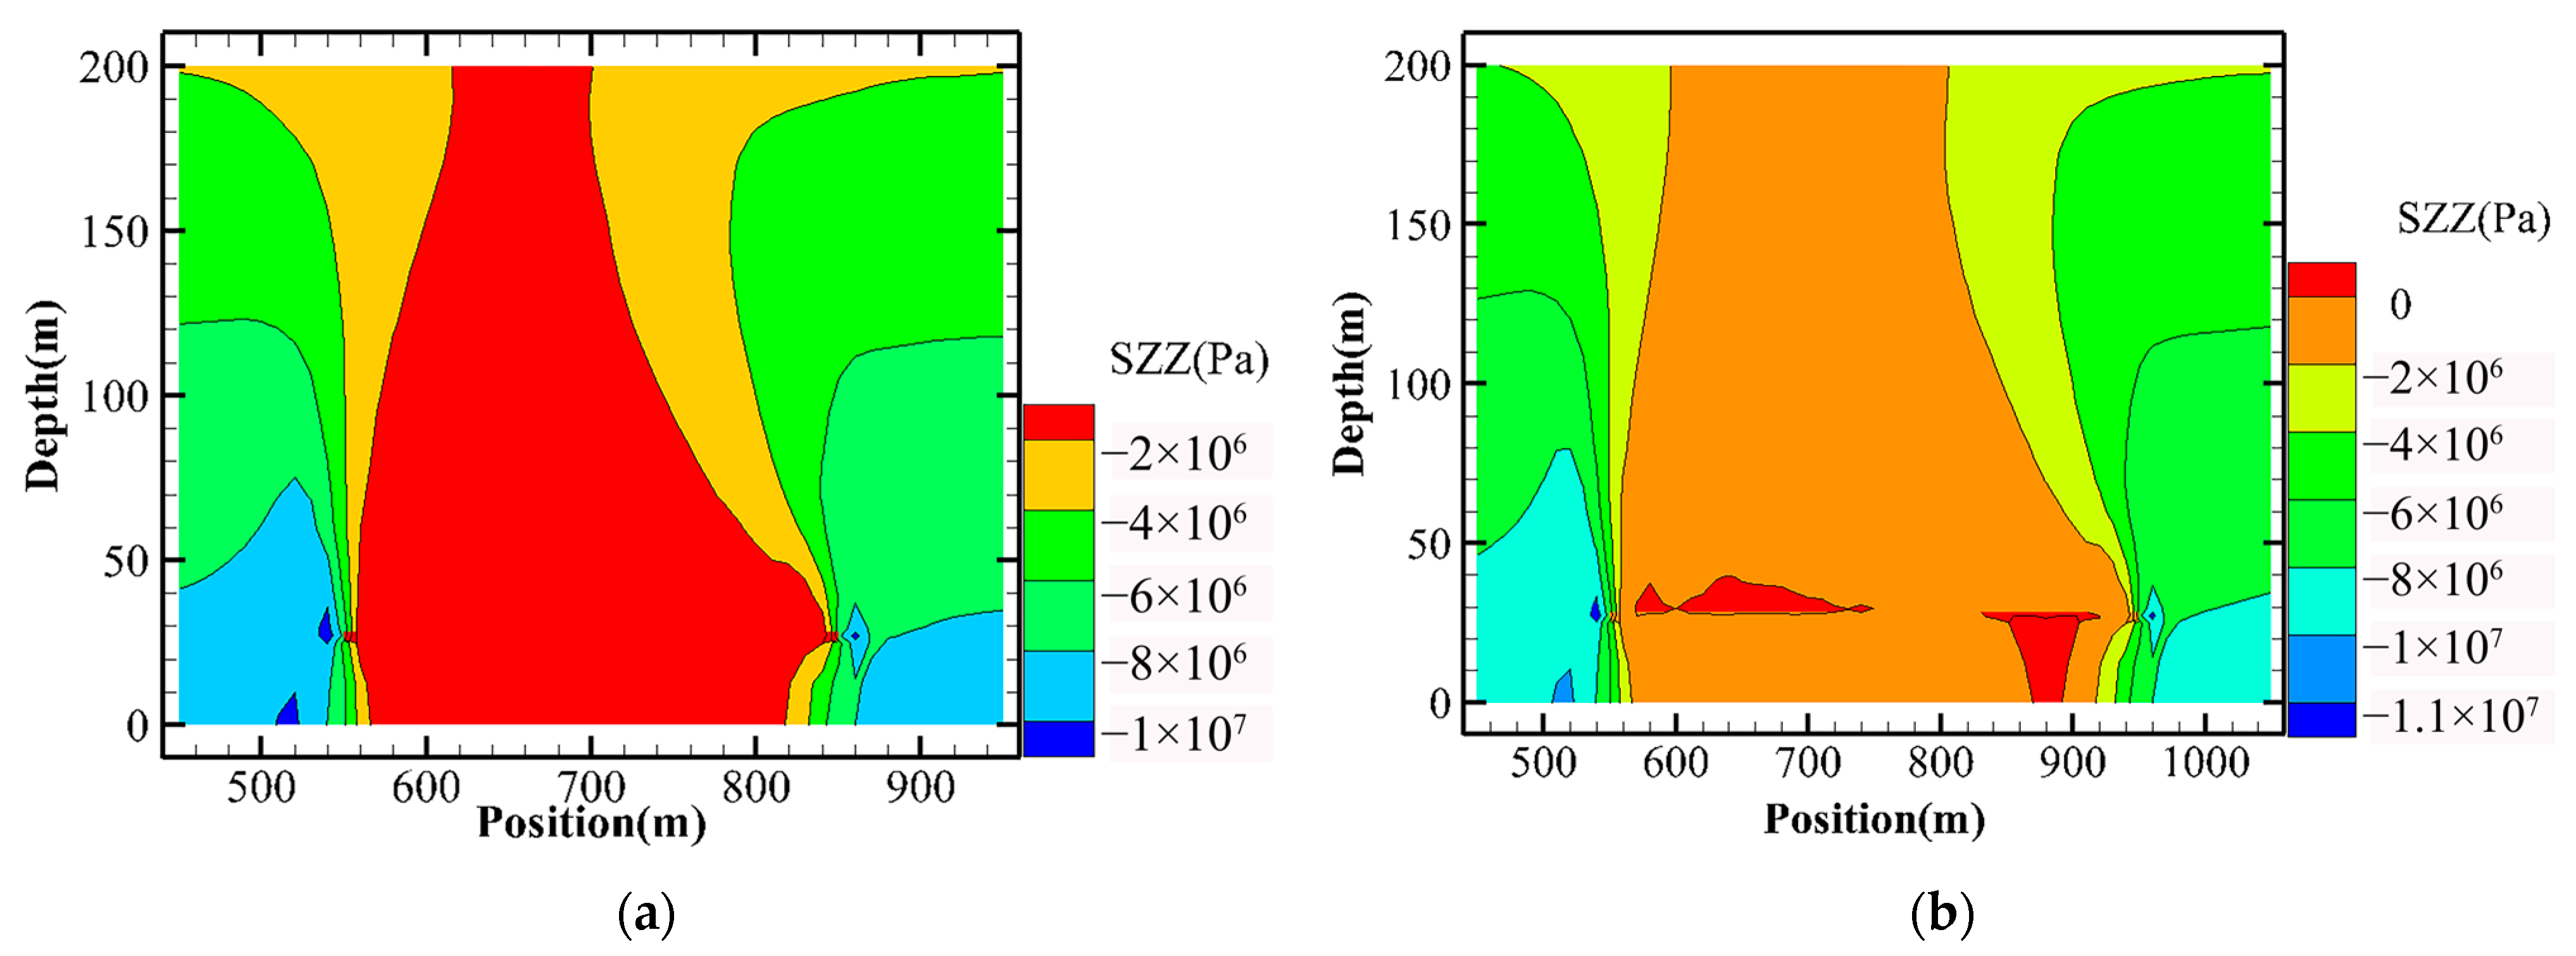
Figure 11 and Figure 12 show that stress concentrations occurred on both sides of the coal pillar during super-high water material backfilling. Meanwhile, the peak stresses on both sides of the coal pillar were 10.12 MPa, 10.58 MPa, 10.81 MPa and 11.12 MPa for the backfilling distances of 100 m, 200 m, 300 m, and 400 m, respectively, indicating that the peak stresses on both sides of the coal pillar increased with the increasing backfilling distance of the working face, and as the stress concentration phenomenon became more obvious. The extent of the stress-relaxation area of the overlying rock layer in the Goaf also increased with the advanced distance of the working face, and the stress distribution changed from elliptical to saddle-shaped as the backfilling distance increased.
In the direction of the coal pillar on both sides of the mining area, a certain range of low and high-stress areas appeared, and the stresses showed a gradually increasing trend from both sides of the extraction area to the central area. This trend change became more obvious with the increase in the backfilling distance, indicating that with the increase in the backfilling distance, the backfilling material in the extraction area would be gradually compacted, the degree of compactness would increase, and the resistance of the backfilling material to the subsidence of the overlying rock was enhanced. In addition, most of the overburden stress was carried by the coal pillar and the backfilling material far away from the mining area, while the backfilling material near the coal pillar was not compacted by the overburden rock, and a certain range of low-stress areas appeared.
(2)
Vertical displacement variation in overlying strata
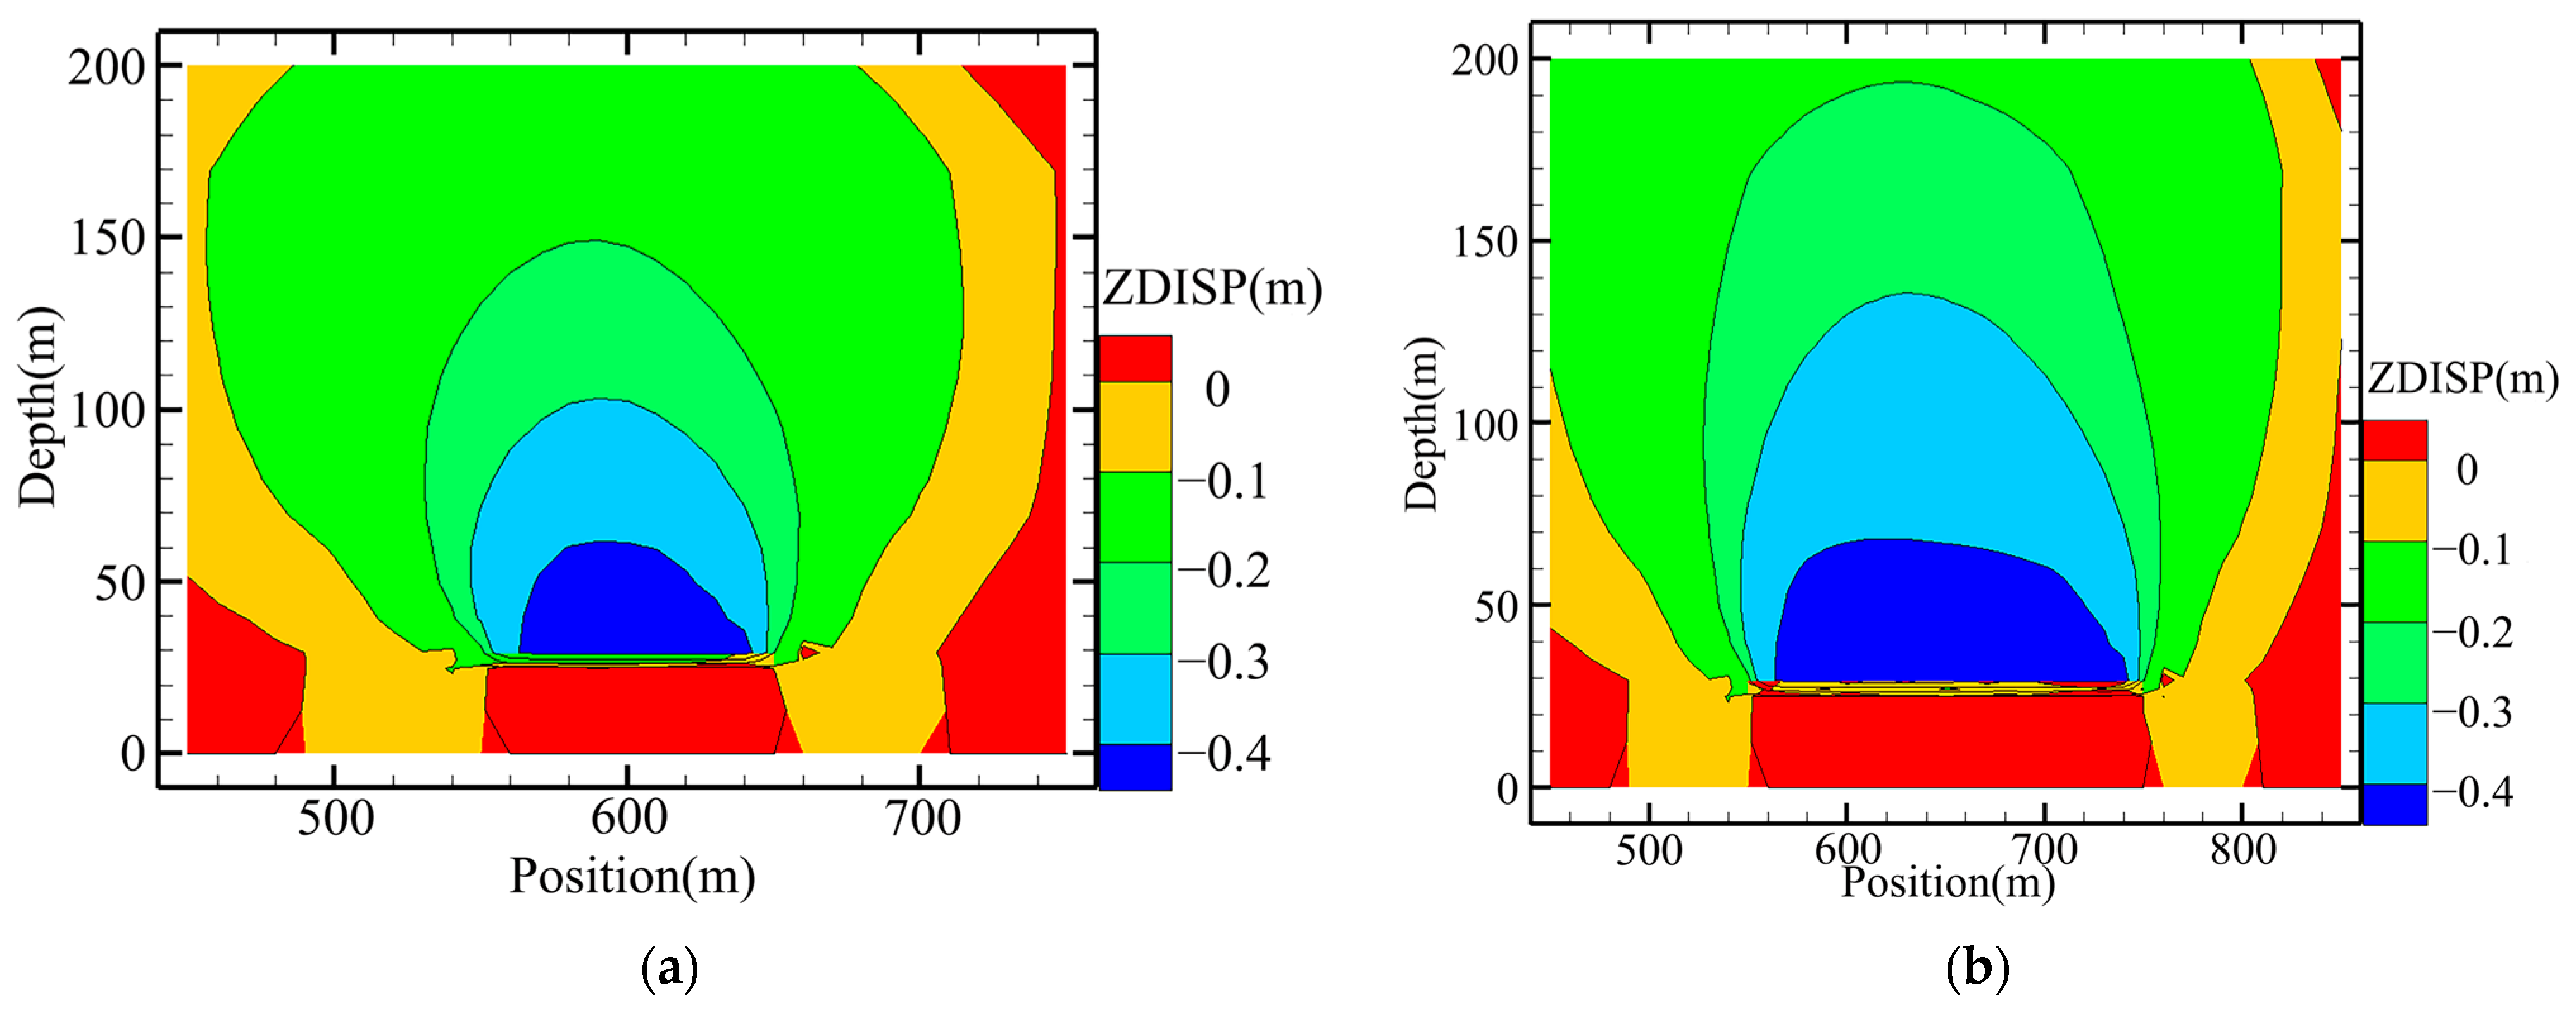
Figure 13 and Figure 14 show that the maximum subsidence of the overlying rock was in the middle of the Goaf in the backfilling mining method, indicating that the coal pillar on both sides of the mining area was significantly more supportive of the overlying rock than the backfilling material. The maximum values for the movement of the immediate roof in the mining area were approximately 0.415 m, 0.426 m, 0.440 m, and 0.449 m when the advancing distance was 100 m, 200 m, 300 m, and 400 m, respectively, indicating that the subsidence of the roof layer in the mining area gradually increased as the backfilling distance increased. In the vertical direction, the overlying rock movement decreased with the increasing distance from the coal seam, but the range of rock movement increased significantly, and eventually, the rock transport was transferred to the surface, forming a subsidence basin on the surface.

3.2.2. Comparison of Mining Methods

In order to illustrate the effect of the backfill material on the rock above the mining area, numerical simulations were used to compare the distribution of stresses and displacements in the rock above the mining area at the 2515 working face using the super-high water material backfilling and mining technology and the fully caving method, respectively. It should be noted that in actual engineering practice, only one out of the super-high water material backfilling and mining technology or the full caving method could be selected for implementation.
(1)
Stress distribution comparison results
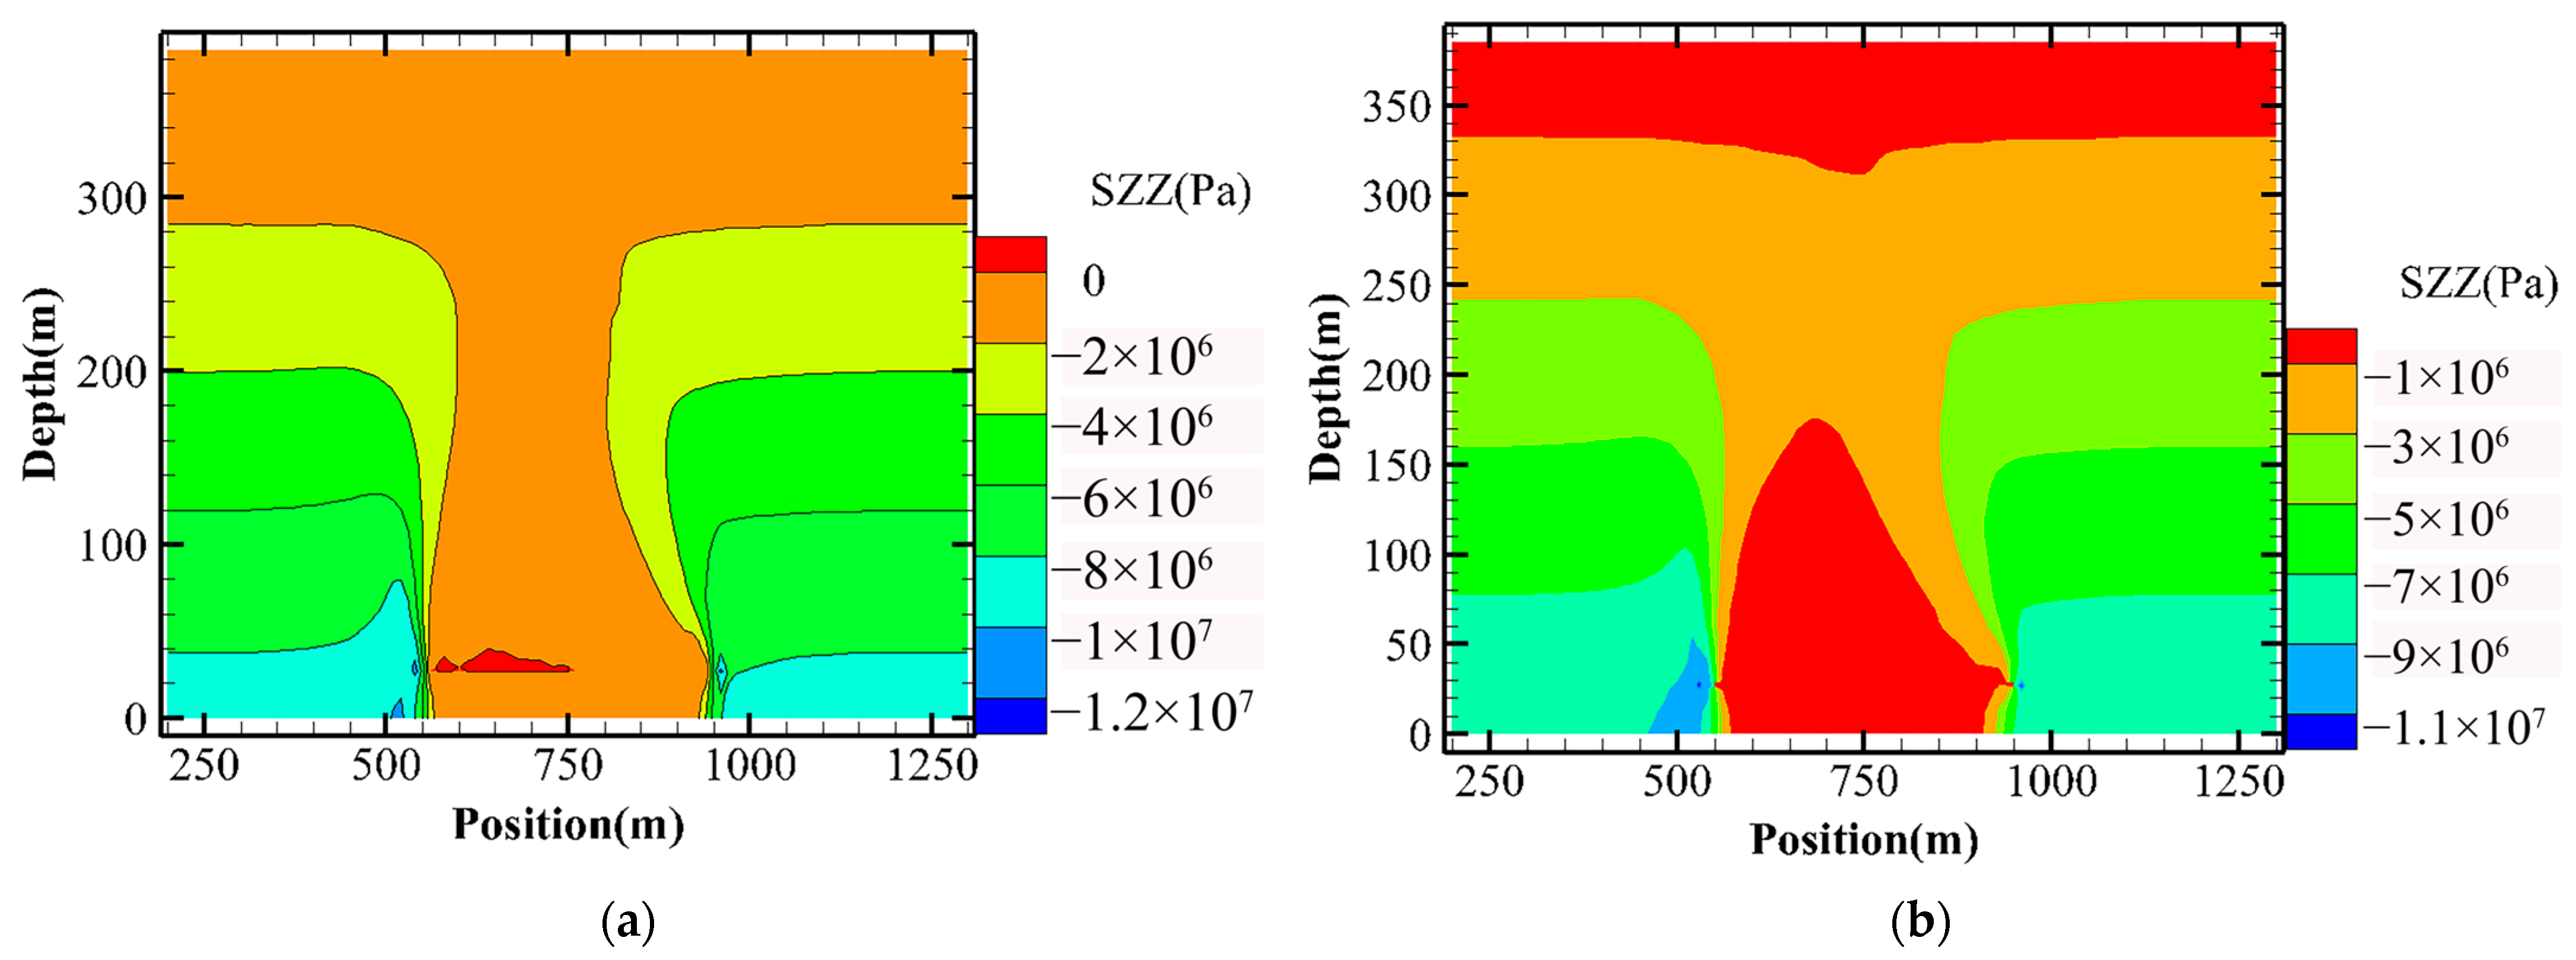
When the mining of the working face was complete, the overlying rocks formed a large range of stress arch shapes; the distribution pattern was symmetrical, the stress reduction zone was formed in the surrounding rocks of the top and bottom rock of the working face, and the stress increase in the zone appeared near the coal pillar of the working face, as is shown in Figure 15. By using the fully caving mining method, the width of the support pressure zone in the direction of the working face advanced by 80 m, and the original rock stress equilibrium was restored 150 m ahead of the working face advancing position (Figure 15a). With the super-high water material backfilling and mining technology, when the backfilling rate was 90%, the width of the support pressure zone in the direction of the working face advancement was 40 m, and the original rock stress equilibrium was restored 100 m ahead of the working face advancing position. The height of the stress arch of backfilling mining was lower than that of the fully caving mining method, which showed that the backfilling material bore part of the load of the overlying rock, and the ability to bear the load was less than the coal pillar (Figure 15b).
(2)
Comparison results of overlying rock movement
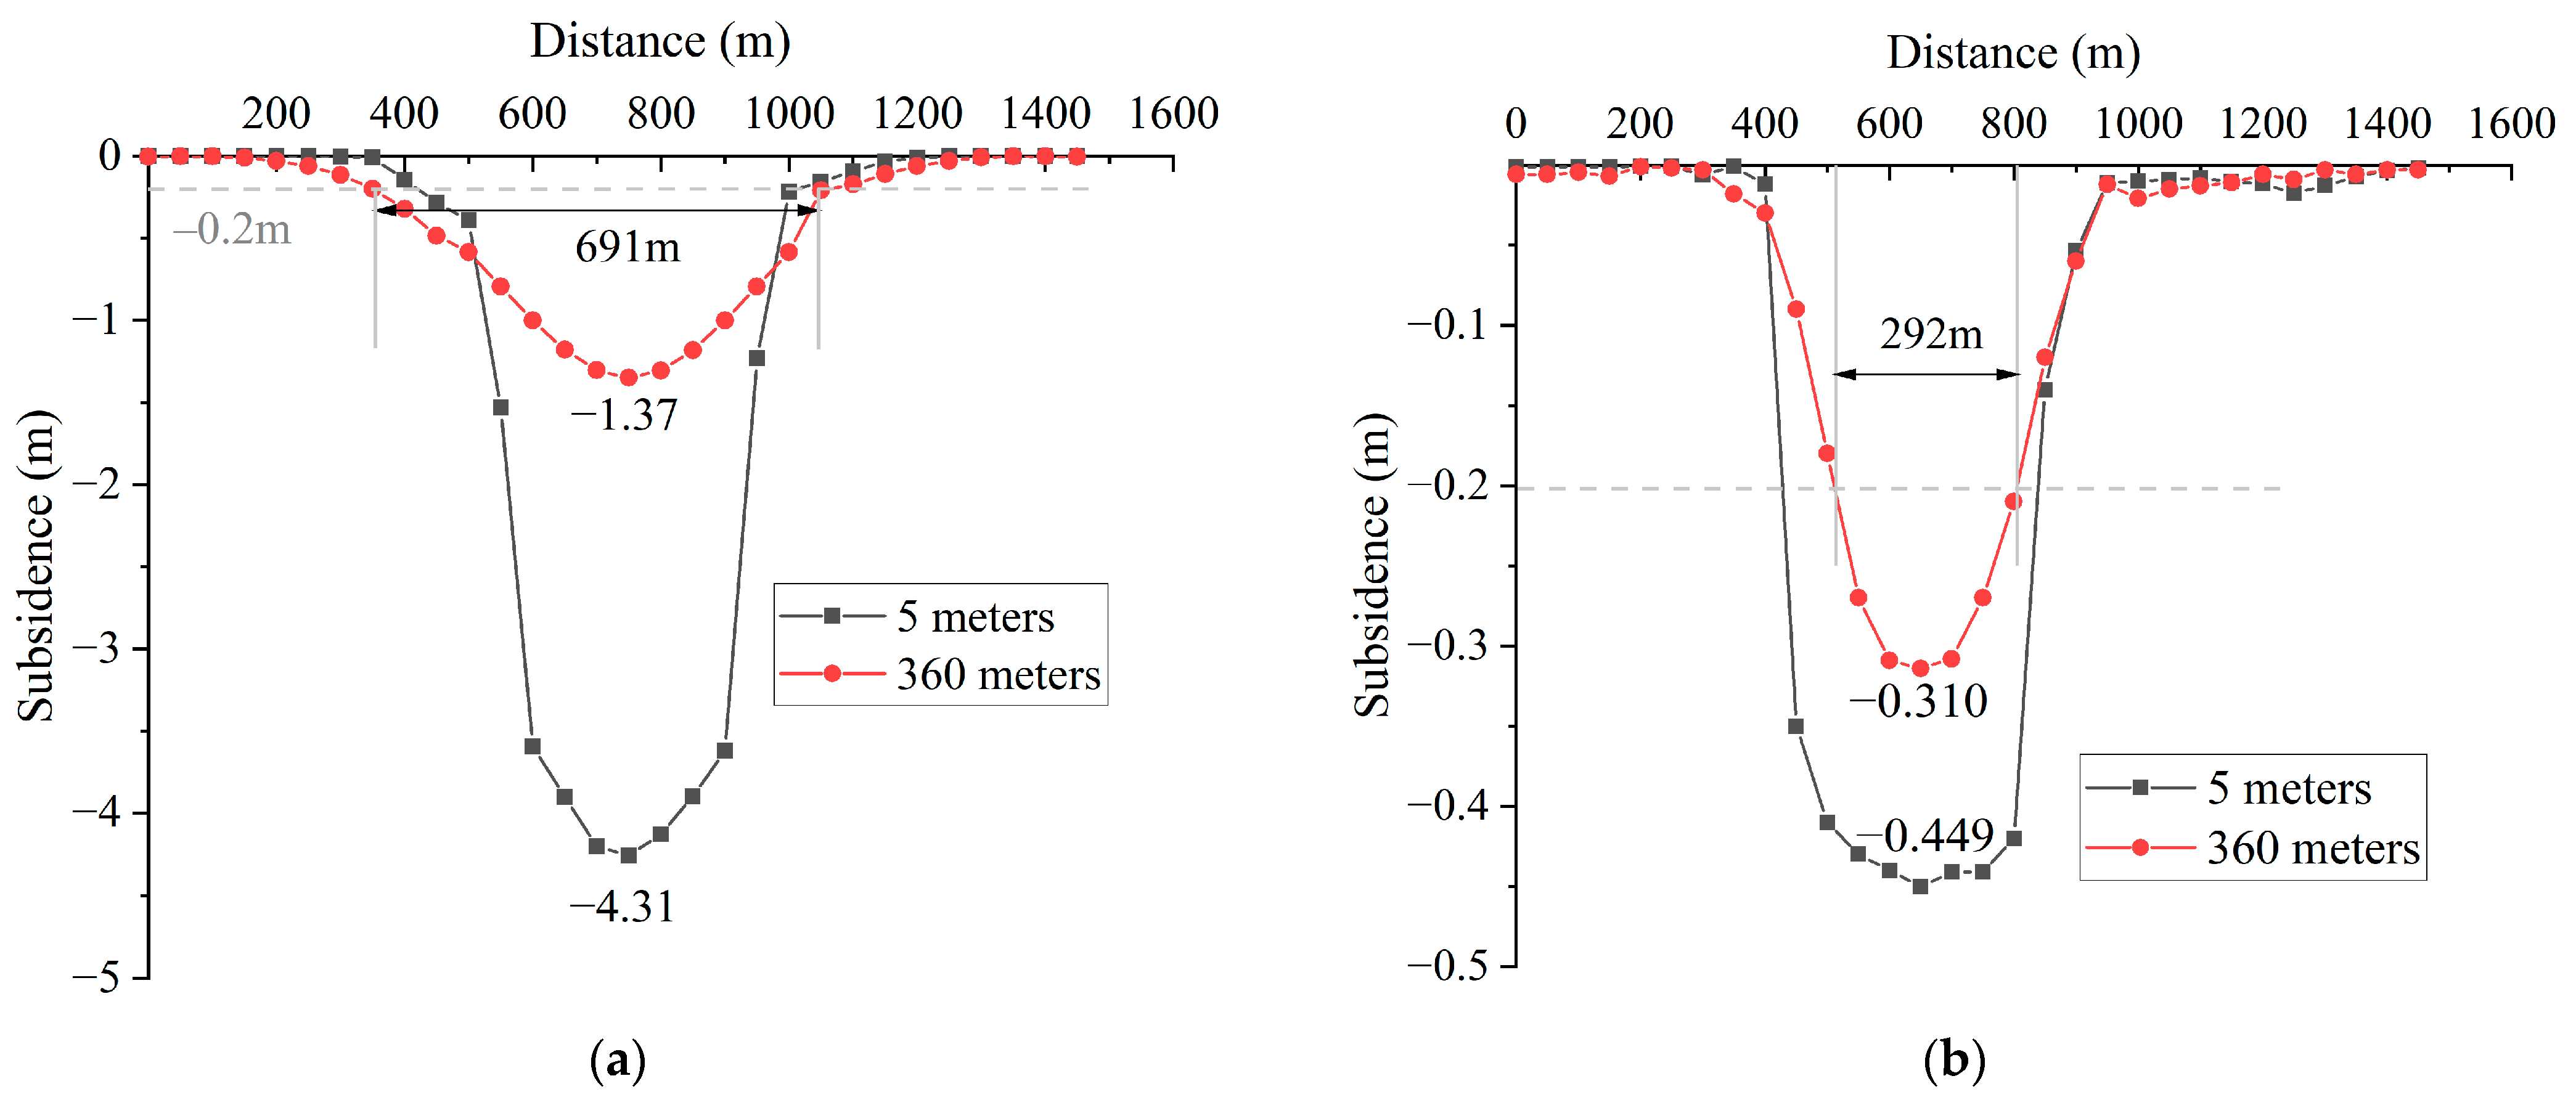
Figure 16 shows that the maximum subsidence value at 5 m from the coal seam roof was about −4.31 m when mining by the fully caving mining method, and the subsidence value decreased as the distance from the coal seam increased, but the surface subsidence range gradually increased, and the maximum surface subsidence was about −1.37 m after all the coal seam mining disturbance was propagated to the surface. When mining by the super-high water material backfilling and mining technology, the maximum subsidence at 5 m from the coal seam roof was about −0.449 m, which was 89% less than that of the fully caving mining method. The maximum subsidence value of different rock strata decreased from the working face to the surface, and the maximum surface subsidence was about −0.276 m, which indicated that the overlying rock was effectively supported by the backfilling material. In order to compare the extent of the surface subsidence basin between the two different mining methods, the influence range of −0.2 m in surface subsidence was selected for comparison: the influence range along the surface strike profile by the super-high water material backfilling technology was about 292 m; the subsidence influence range of surface by fully caving mining method was about 691 m, and the subsidence range was significantly larger than that of the super-high water material backfilling and mining technology.

3.2.3. Analysis of Influencing Factors

(1)
Analysis of working condition factors
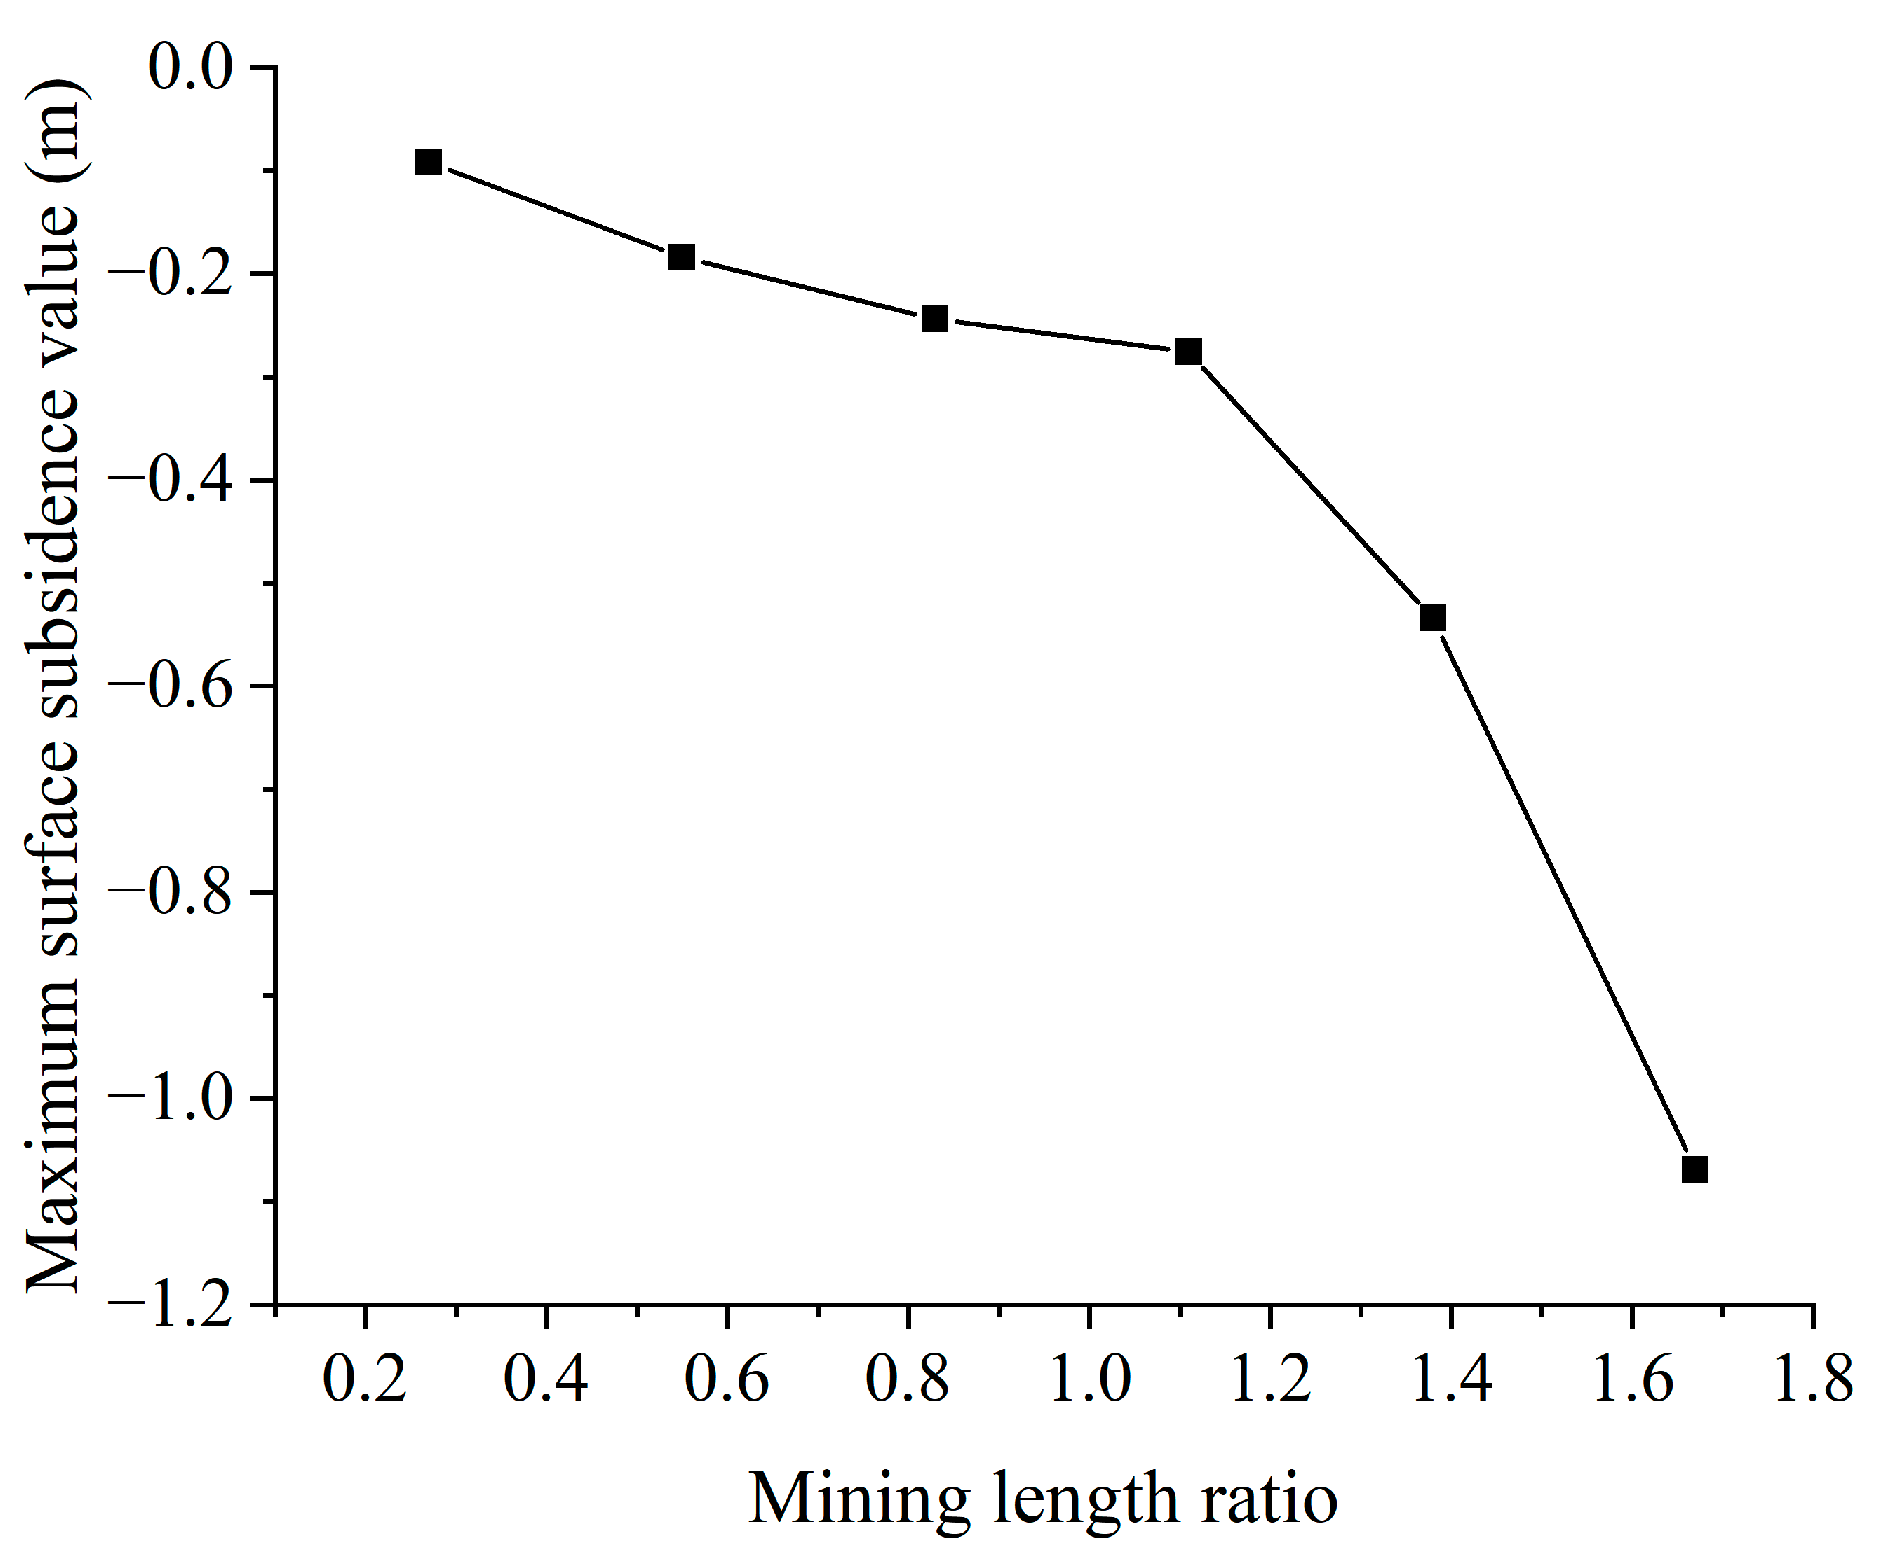
The geological mining factors that affected the surface subsidence included seam thickness, dip angle, depth, working face size, roof management methods, working face advancement speed, etc. As the coal seam conditions were basically the same in the same mine, it was important to analyze the influence of the working face size factor on the maximum surface subsidence value. Considering the mining dimensions of the adjacent workings in the area and the mining master plan for strip mining, this section of the workings mining dimensions study only considered the relationship between the different advance distances and the maximum surface subsidence values. Using the basic conditions of the 2515 working face as the initial value, the mining lengths of 200 m, 300 m, 400 m, 500 m, and 600 m were selected, and the ratio of different mining lengths to the mining depth was calculated, and the curve of different mining length ratios (mining length/mining depth) as a function of the maximum value of surface subsidence was plotted (Figure 17). Figure 17 shows that as the mining length ratio increased, the maximum surface subsidence value increased. Additionally, when the ratio was greater than 1.2, the maximum surface subsidence value increased more. Different functions were selected for fitting, and it was eventually found that the Boltzmann function was a better fit (Equation (6)). By applying the fitted function, the corresponding working face dimensions could be better calculated from the surface subsidence values.
y = 0.31 + 0.746 1 + e ( x 1 75.18 ) 4.19   ( R 2 = 0.98 )
where x1 is the ratio of the working face advancing direction length to mining depth; y is the maximum surface subsidence of working face mining.
(2)
Analysis of backfilling material factors
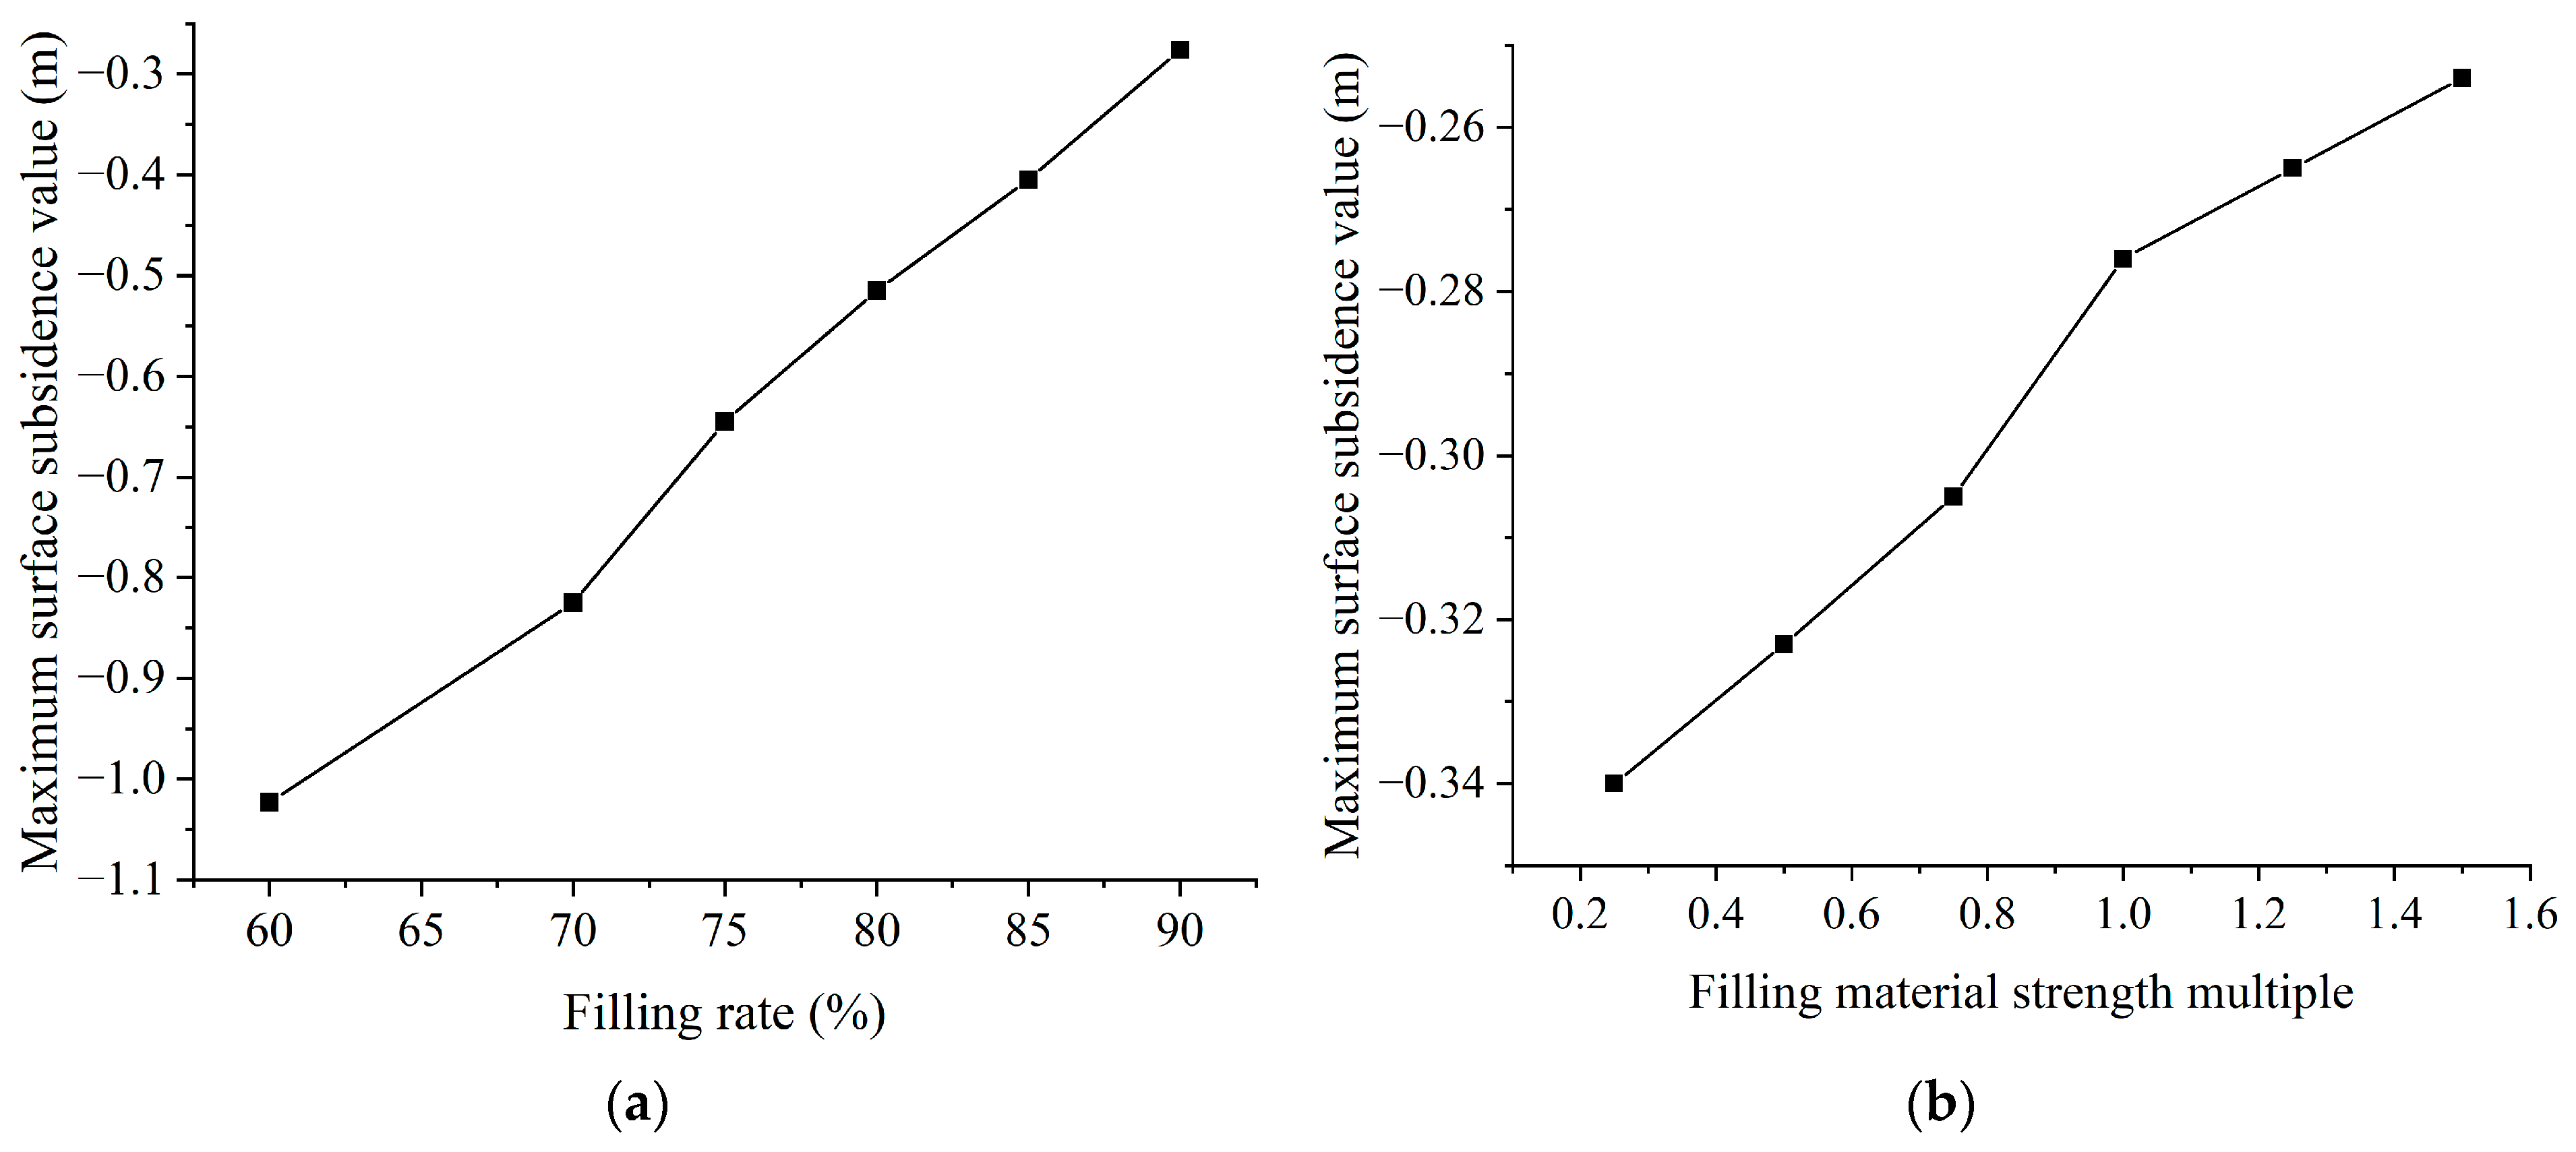
When using super-high water material backfilling and mining technology for coal mining, the influence of the backfilling rate and the strength of the backfilling material on the surface subsidence control effect was more significant; therefore, it was important to study the backfilling rate and the strength of the backfilling material to guide the backfilling engineering site. Using the working face 2515 as a basic geological mining condition, the maximum surface subsidence values were calculated under 60%, 70%, 75%, 80%, 85% and 90% backfilling rate conditions, and the subsidence curves in Figure 18a were plotted and fitted as a function (Equation (7)). Figure 18a shows that the maximum surface subsidence value decreased with the increasing backfilling rate; in the existing geological mining conditions of the Hengjian Mine, the backfilling rate of the super-high water backfilling material should be no less than 75%. Meanwhile, the maximum surface subsidence values were also calculated for 0.5, 0.75, 1.0 and 1.25 times the modulus of elasticity of the backfilling material. The curves were plotted and fitted as a function. Figure 18b shows that the strength of the backfilling material should be increased as much as possible in super-high water material backfilling and mining technology.
y = 2.291 0.018 × x 2 + 0.005 × x 2 2   ( R 2 = 0.96 )  
where x2 is the backfilling rate of working face; y is the maximum surface subsidence of working face mining.
y = 0.387 0.071 x 3   ( R 2 = 0.99 )
where x3 the strength ratio of different backfilling material; y is the maximum surface subsidence of working face mining.

4. Discussion

4.1. Analysis of Subsidence Reduction Mechanism

During the process of coal mine resource exploitation, underground mining disturbances broke the original stress equilibrium state of the rock mass, causing destruction, damage, and the deformation of the rock mass above the working face, accompanied by changes and redistribution of stresses within the rock mass. These effects were transmitted and extended layer by layer, thus affecting a larger range of rock mass until the stresses reached a new equilibrium state, causing changes in the rock stress and deformation in the area disturbed by excavation. Therefore, a rock structure effect problem was detected in the mining subsidence process, and Dai used an arch structure to describe the process in a compensatory manner [51]. This article analyses the rock structure of the super-high water material backfilling and mining technology based on the equilibrium structure of the mining rock mass.
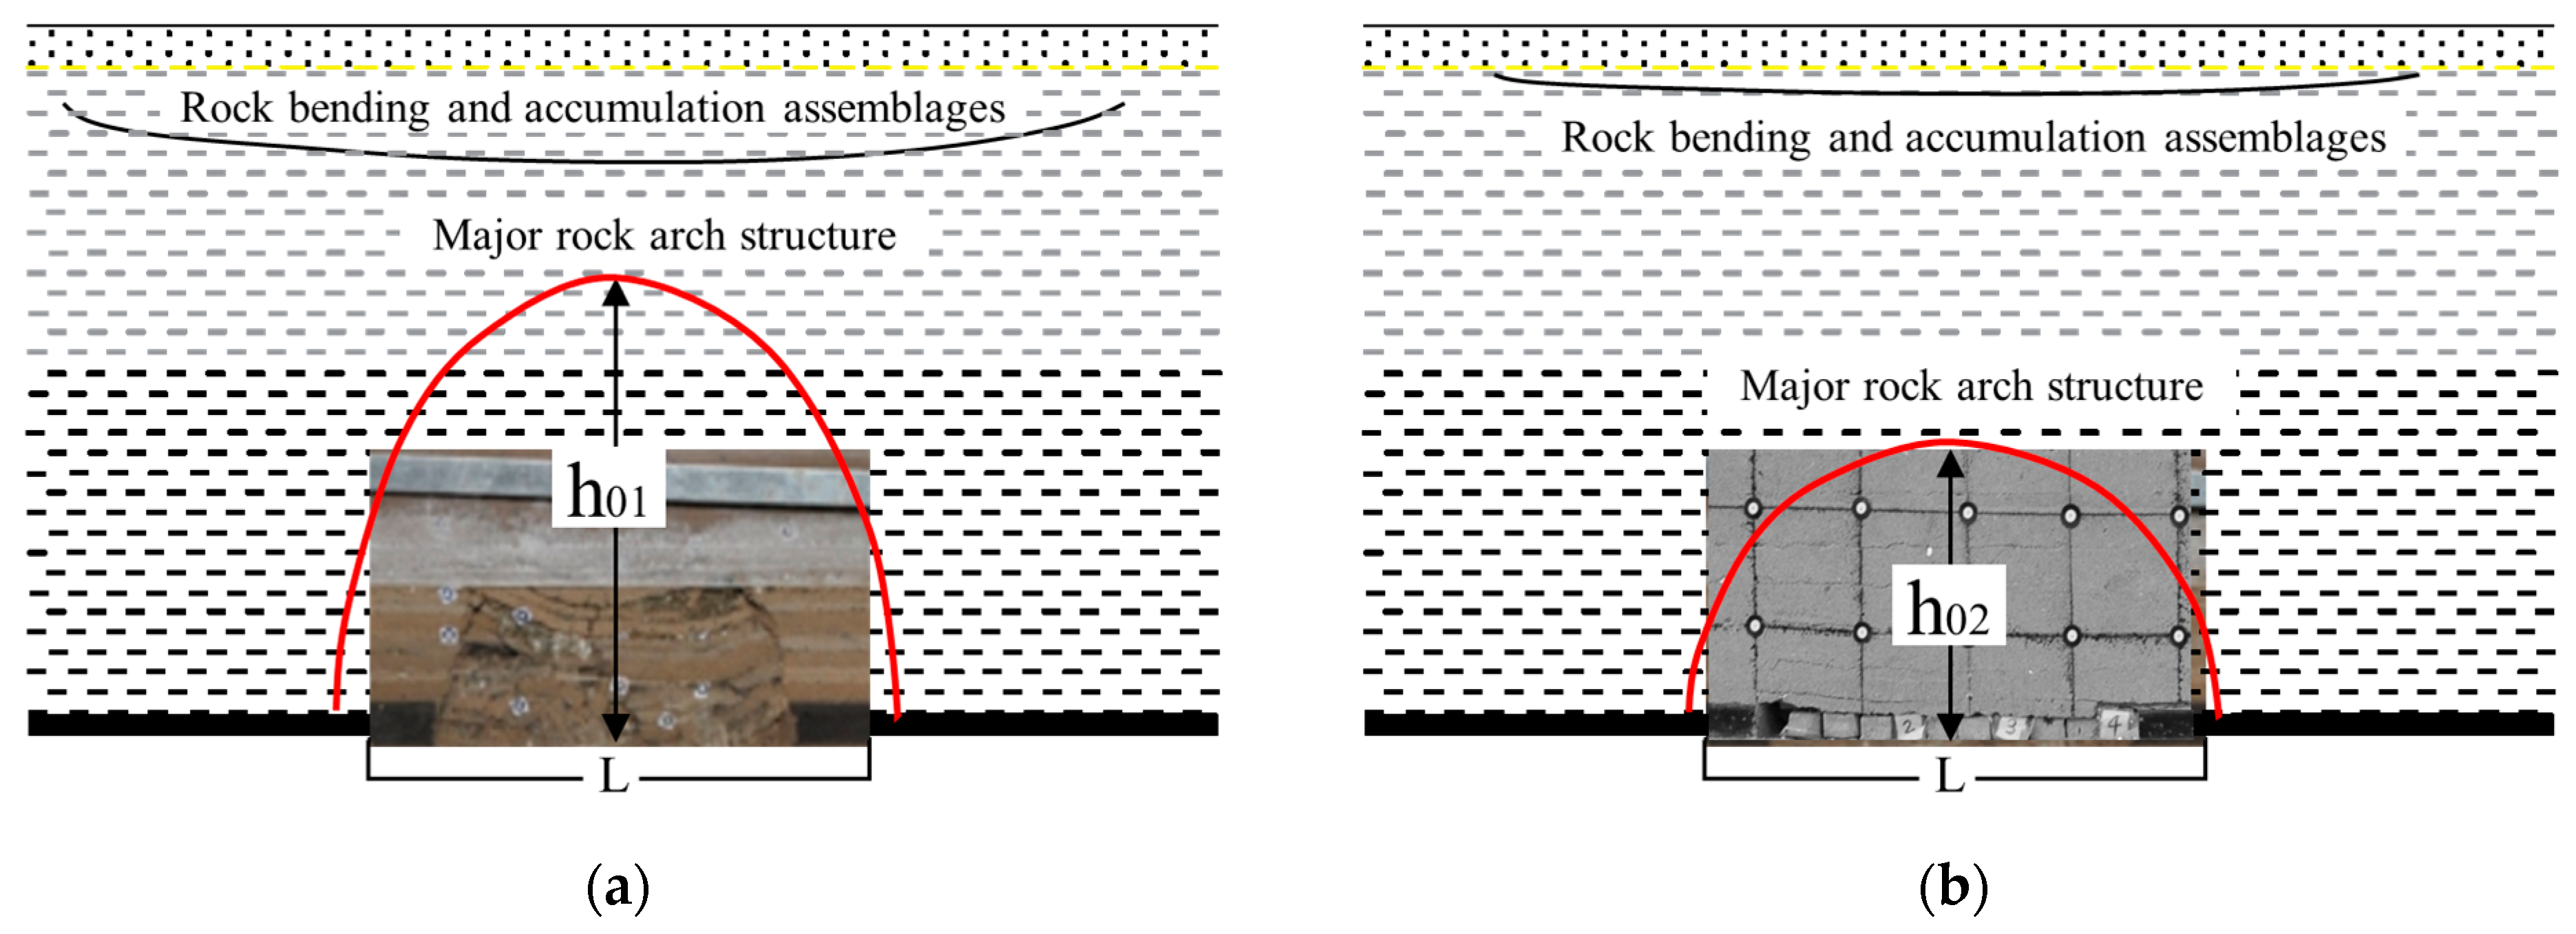
If the 2515 working face is mined by the fully caving mining method, according to the nature of the rock formation above the working face, the height of the main arch developed would be about 150 m, which is less than the depth of the bedrock mined at the working face. Additionally, the surface was affected by mining to form the rock bending and accumulation assemblages, which belonged to the class I equilibrium structure of the mined rock mass, and the rock structure is shown in Figure 19a. After the mining of the 2515 working face was complete, the overlying rock structure was arch-shaped distribution, the front and rear arch feet were located on both sides of the solid coal, and the overlying rock load was mainly carried by the main rock arch.
When the 2515 working face adopted the backfill mining technology of super-high water material, the space of the mined coal seam was effectively replaced by the super-high water material. The remaining space was composed of the subsidence of the roof, the space where the backfilling material did not touch the roof and the compression of the backfilling material; the space where the backfilling body did not touch the roof was the main influencing factor. The average backfilling rate of the 2515 working face was about 90%; therefore, it could be concluded that the space where the backfilling material did not touch the roof was about 0.45 m, which was significantly lower than the fully caving mining method (Figure 19b). Backfill mining with super-high-water material can be used to reduce the effective mining height of the coal seam extracted from the working face, inhibit the fracture and fragmentation of the roof rock and limit the development height of the developing height of the main arch. The coal pillars on both sides of the mining void area of the working face were located at a reduced distance from the foot of the arch compared to the fully caving mining method. As a result, the mining impact was transferred from the coal extraction space to the surface by super-high water material backfilling and mining technology was reduced and the corresponding extent of the rock and surface movement and deformation values were significantly reduced. The control of the effective mining height was the main reason for a significant reduction in the subsidence of the backfilling mining of super-high-water material.

4.2. Analysis of the Process Flow

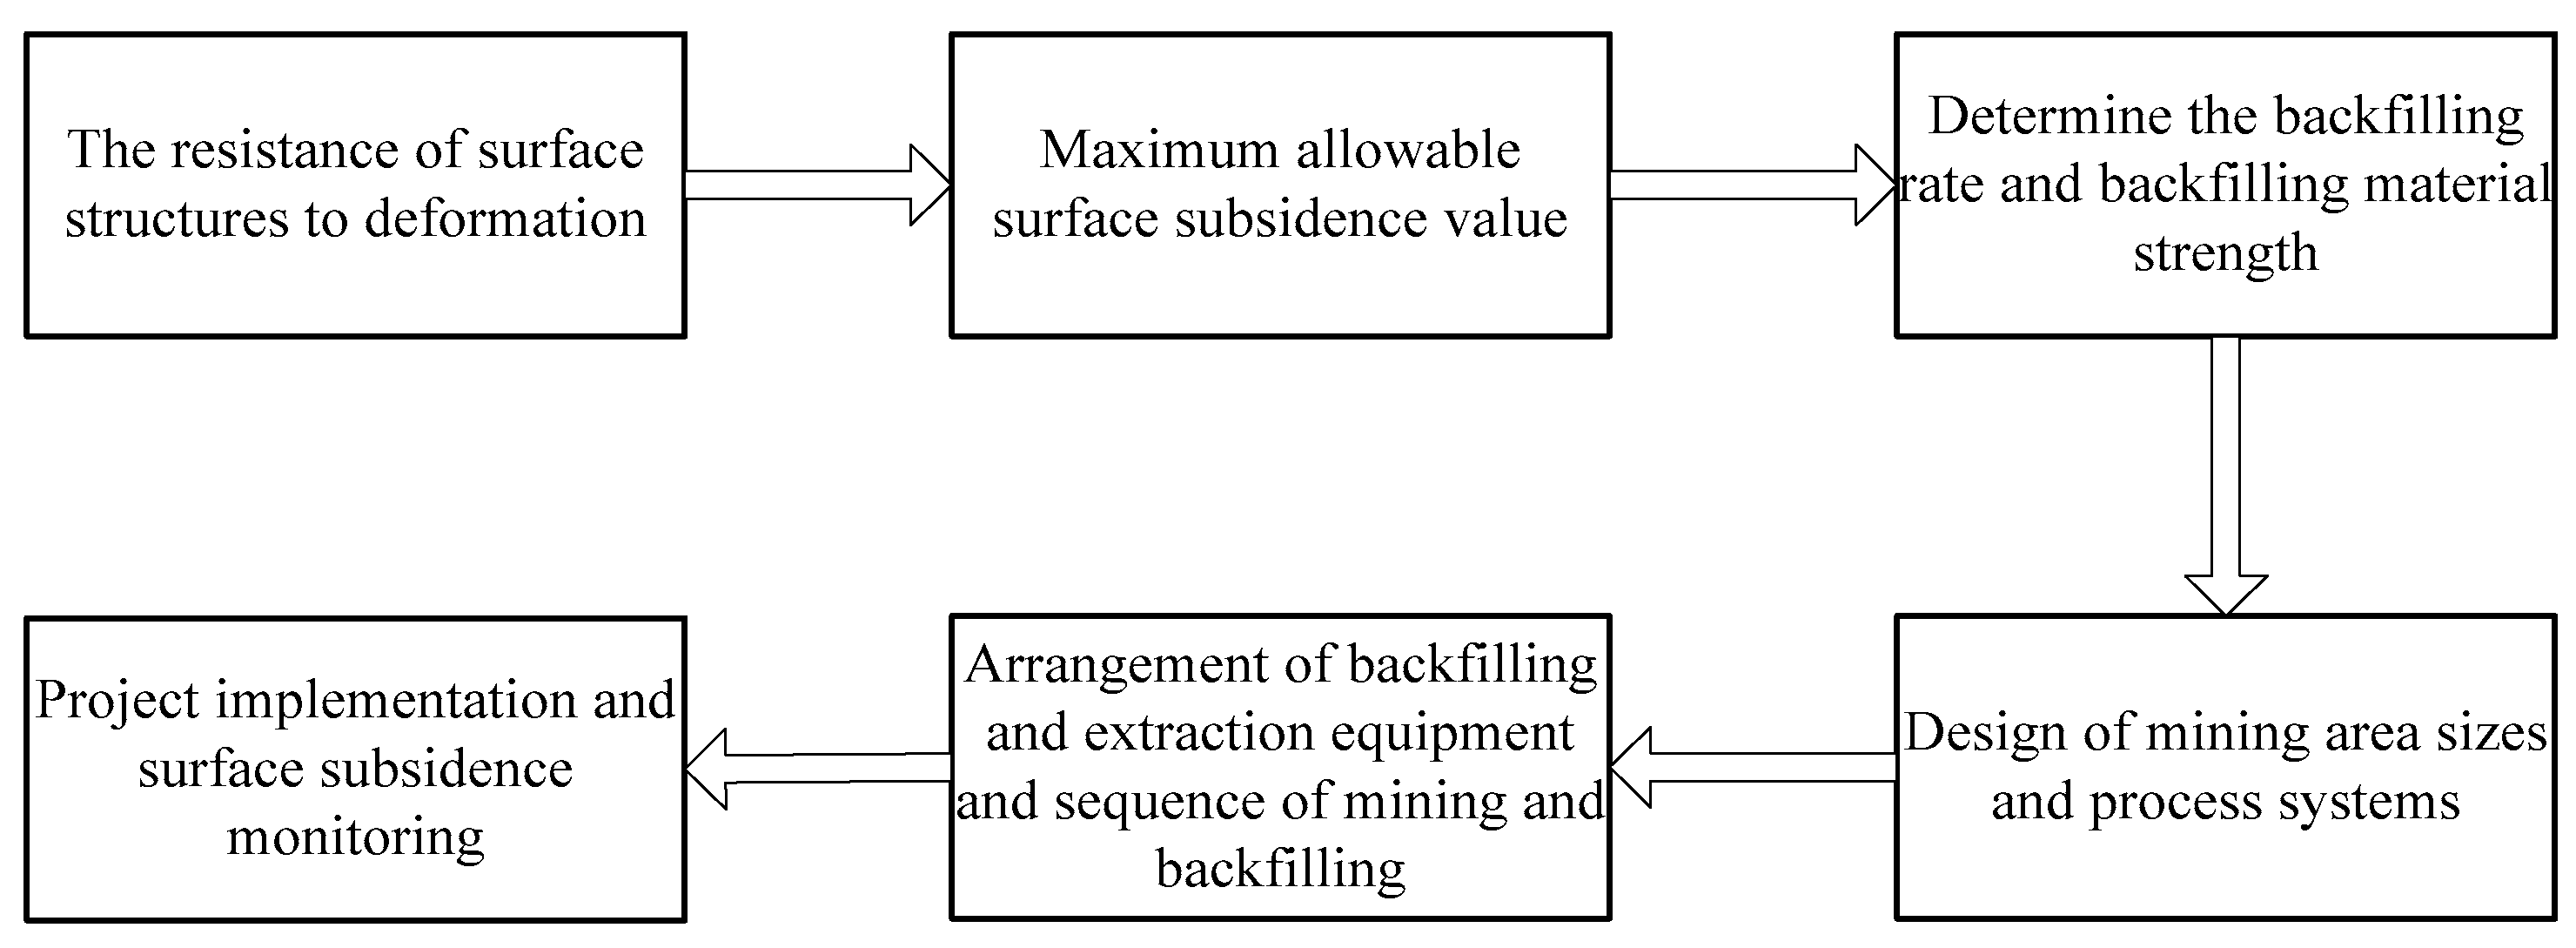
Based on the field measurements of surface movement at the 2515 working face of the Hengjian Mine, it was concluded that the surface movement could be effectively mitigated by the backfilling mining of super-high water material to achieve the mitigation of underground mining disturbance and a reduction in the extent of surface subsidence damage. Combining the numerical simulations of super-high water material backfilling and mining technology and analysis of the surface subsidence reduction mechanism, the process flow of super-high water material backfilling and mining technology is presented (Figure 20), and some of the components are highlighted.
(1) Based on the geological mining conditions of the mining face and the protection level of the buildings, the corresponding backfilling rate and backfilling material strength should be calculated according to the surface subsidence reduction effect, and the strength of the backfilling material should be increased as much as possible.
(2) Material composition is an important factor affecting material properties. Super-high water material is composed of components A and B. Therefore, if component A changes, it is necessary to adjust the ratio of B material and various auxiliary materials accordingly to ensure that the strength of the backfilling material is stable.
(3) In the design of the working face mining area, the mining size should not be too large. As shown in the numerical simulation results for working face 2515, when the length of the working face was greater than 1.4 times the mining depth, the maximum surface settlement increasesd significantly, so the ratio of the backfilling surface area to the mining depth, which should be controlled during the design of the backfilling working face.
(4) During the implementation of the project, high-frequency and high-precision settlement monitoring should be carried out on the surface so as to monitor the backfilling effect in real-time and dynamically adjust the backfilling parameters and backfilling process.

4.3. Analysis of Research Results and Future Works

(1) Backfill mining has received widespread attention as an effective mining method for liberating coal resources deposited under buildings, railways and water bodies, but the development of backfill mining technology is limited by the difficulty of obtaining backfill materials and the high environmental impact of existing backfill materials. The research of super-high water material backfilling and mining technology is of great significance for liberating deposited coal resources.
(2) Super-high water materials have been successfully applied in many mining areas in China since their appearance in 2008, but there are few studies on the rock and surface movement laws and the influencing factors and subsidence control mechanism of super-high water material backfilling and mining technology. The research in this paper bridges this lack of existing research on super-high water material backfilling and mining technology.
(3) Through the study of rock and surface subsidence laws, surface subsidence control influencing factors and the subsidence control mechanisms of super-high water material backfilling and mining technology, this paper proposes a process flow for the implementation of super-high water material backfilling and mining technology, which can better guide the implementation of super-high water material backfilling and mining technology in practical applications and ensure the sustainable development of coal resources.
(4) The simulation of the stress distribution and displacement distribution during the implementation of the super-high water material backfilling and mining technology should be consistent with the engineering implementation process as far as possible. In the implementation of super-high water material backfilling and mining technology, the strength of the early backfilling body can increase with the advancement of the working face, and the strength of the backfilling material at different locations from the advancement of the working face can change accurately with the advancement in time. Accordingly, the displacement of the rock and the surface can then also change; in addition, in the actual mining process, when the working face advances 364 m, the backfilling rate can be greatly affected due to the broken roof plate and serious flake help in front of the frame. The above factors were not considered in the numerical simulations and should be taken into account in future research. In addition, future consideration should be given to how to improve the numerical simulation tools to guide the whole process of engineering implementation.

5. Conclusions

Investigating the rock and surface subsidence laws and surface subsidence reduction mechanism of the Hengjian Coal Mine, 2515 working face using super-high water material backfilling and mining technology through field measurements, numerical simulations, and theoretical analysis, this article proposes a process flow for the engineering implementation of super-high water material backfilling and mining technology. This research complements existing research on super-high water material backfilling and mining technology and promotes the feasibility of mining deposited coal resources. The following conclusions were reached from the systematic analysis:
(1) The surface subsidence and deformation values of the super-high water material backfilling and mining technology are small, and the surface movement parameters are special. The maximum surface subsidence of the 2515 working face of the Hengjian coal mine using this technology was 0.27 m, with a surface subsidence coefficient of 0.14; the active period at the point of maximum subsidence value accounted for 18% of the total movement time, which was less than that of the adjacent working face using the full-caving method.
(2) The super-high water backfilling material supports the rock load above the mined area and inhibits the extent and degree of rock and surface movement. At a distance of 400 m, the top slab at 5 m from the working face was 89% less subsided by the super-high water material backfilling and mining technology than by the fully caving method.
(3) The super-high water backfilling material limits the height of the development of the stress arch above the mining area, and the development of the stress arch should be controlled in engineering practice by increasing the backfilling rate and the strength of the backfilling body. The adoption of super-high water material backfilling and mining technology could help reduce surface subsidence and liberate the deposited coal resources.

Author Contributions

Conceptualization, M.L.; methodology, Y.Y.; formal analysis H.D.; investigation, Z.Z.; writing—original draft preparation, M.L.; funding acquisition, Y.Y. All authors have read and agreed to the published version of the manuscript.

Funding

This research was funded by the Fundamental Research Funds for the Central Universities (2021YQDC09), and the National Natural Science Foundation of China (grant numbers 51574242 and 51404272).

Institutional Review Board Statement

Not applicable.

Informed Consent Statement

Not applicable.

Data Availability Statement

The data used to support the findings of this study are available from the corresponding author upon request.

Conflicts of Interest

The authors declare no conflict of interest.

References

  1. Ajayi, S.A.; Ma, L.; Spearing, A.J.S. Ground Stress Analysis and Automation of Workface in Continuous Mining Continuous Backfill Operation. Minerals 2022, 12, 754. [Google Scholar] [CrossRef]
  2. Black, D.J. Review of coal and gas outburst in Australian underground coal mines. Int. J. Min. Sci. Technol. 2019, 29, 815–824. [Google Scholar] [CrossRef]
  3. Magidi, M.; Hlungwani, P.M. Development or destruction? Impacts of mining on the environment and rural livelihoods at Connemara Mine, Zimbabwe. S. Afr. Geogr. J. 2023, 105, 157–178. [Google Scholar] [CrossRef]
  4. Jiang, N.; Wang, C.; Pan, H.; Yin, D.; Ma, J. Modeling study on the influence of the strip filling mining sequence on mining-induced failure. Energy Sci. Eng. 2020, 8, 2239–2255. [Google Scholar] [CrossRef]
  5. Lacey, J.; Malakar, Y.; McCrea, R.; Moffat, K. Public perceptions of established and emerging mining technologies in Australia. Resour. Policy 2019, 62, 125–135. [Google Scholar] [CrossRef]
  6. Marian, D.P.; Onica, I.; Marian, R.; Floarea, D. Finite Element Analysis of the State of Stresses on the Structures of Buildings Influenced by Underground Mining of Hard Coal Seams in the Jiu Valley Basin (Romania). Sustainability 2020, 12, 1598. [Google Scholar] [CrossRef]
  7. Abdallah, M.; Verdel, T. Behavior of a masonry wall subjected to mining subsidence, as analyzed by experimental designs and response surfaces. Int. J. Rock. Mech. Min. 2017, 100, 199–206. [Google Scholar] [CrossRef]
  8. Kapusta, A.; Szojda, L. The role of expansion joints for traditional buildings affected by the curvature of the mining area. Eng. Fail. Anal. 2021, 128, 105598. [Google Scholar] [CrossRef]
  9. Prakash, A.; Kumar, A.; Verma, A.; Mandal, S.K.; Singh, P.K. Trait of subsidence under high rate of coal extraction by longwall mining: Some inferences. Sādhanā 2021, 46, 216. [Google Scholar] [CrossRef]
  10. Archundia, D.; Prado-Pano, B.; González-Méndez, B.; Loredo-Portales, R.; Molina-Freaner, F. Water resources affected by potentially toxic elements in an area under current and historical mining in northwestern Mexico. Env. Environ. Monit. Assess. 2021, 193, 236. [Google Scholar] [CrossRef] [PubMed]
  11. Kopeć, A.; Trybała, P.; Głąbicki, D.; Buczyńska, A.; Owczarz, K.; Bugajska, N.; Kozińska, P.; Chojwa, M.; Gattner, A. Application of Remote Sensing, GIS and Machine Learning with Geographically Weighted Regression in Assessing the Impact of Hard Coal Mining on the Natural Environment. Sustainability 2020, 12, 9338. [Google Scholar] [CrossRef]
  12. Bakhtavar, E.; Mahmoudi, H. Development of a scenario-based robust model for the optimal truck-shovel allocation in open-pit mining. Comput. Oper. Res. 2020, 115, 104539. [Google Scholar] [CrossRef]
  13. Bozhanova, V.; Korenyuk, P.; Lozovskyi, O.; Belous-Sergeeva, S.; Bielienkova, O.; Koval, V. Green Enterprise Logistics Management System in Circular Economy. Int. J. J. Math. Eng. Manag. Sci. 2022, 7, 350–363. [Google Scholar] [CrossRef]
  14. Chen, S.; Yin, D.; Cao, F.; Liu, Y.; Ren, K. An overview of integrated surface subsidence-reducing technology in mining areas of China. Nat. Hazards 2016, 81, 1129–1145. [Google Scholar] [CrossRef]
  15. Sroka, A.; Knothe, S.; Tajdus, K.; Misa, R. Underground exploitations inside safety pillar shafts when considering the effective use of a coal deposit. Gospod. Surowcami Miner. 2015, 31, 93–110. [Google Scholar] [CrossRef]
  16. Jaiswal, A.; Shrivastva, B.K. Stability analysis of the proposed hybrid method of partial extraction for underground coal mining. Int. J. Rock. Mech. Min. 2012, 52, 103–111. [Google Scholar] [CrossRef]
  17. Skrzypkowski, K. Decreasing Mining Losses for the Room and Pillar Method by Replacing the Inter-Room Pillars by the Construction of Wooden Cribs Filled with Waste Rocks. Energies 2020, 13, 3564. [Google Scholar] [CrossRef]
  18. Zingano, A.; Weiss, A. Subsidence over room and pillar retreat mining in a low coal seam. Int. J. J. Min. Sci. Technol. 2019, 29, 51–57. [Google Scholar] [CrossRef]
  19. Yilmaz, E.; Yilmaz, E. Sustainability and Tailings Management in The Mining Industy: Paste Technology. Mugla J. Sci. Technol. 2018, 4, 16–26. [Google Scholar] [CrossRef]
  20. Hefni, M.; Ahmed, H.A.M.; Omar, E.S.; Ali, M.A. The Potential Re-Use of Saudi Mine Tailings in Mine Backfill: A Path towards Sustainable Mining in Saudi Arabia. Sustainability 2021, 13, 6204. [Google Scholar] [CrossRef]
  21. Mashifana, T.; Sithole, T. Clean production of sustainable backfill material from waste gold tailings and slag. J. Clean. Prod. 2021, 308, 127357. [Google Scholar] [CrossRef]
  22. Hefni, M.A. The potential use of pumice in mine backfill. Exp. Results 2020, 1, e56. [Google Scholar] [CrossRef]
  23. Luo, C.; Liu, P.; Jia, Y.; Chen, Z.; Gao, F.; Huang, X. Study on overlying strata migration law of strip interval filling mining. Sci. Prog. -Uk 2023, 106, 39628441. [Google Scholar] [CrossRef] [PubMed]
  24. Smoliński, A.; Malashkevych, D.; Petlovanyi, M.; Rysbekov, K.; Lozynskyi, V.; Sai, K. Research into Impact of Leaving Waste Rocks in the Mined-Out Space on the Geomechanical State of the Rock Mass Surrounding the Longwall Face. Energies 2022, 15, 9522. [Google Scholar] [CrossRef]
  25. Ghirian, A.; Fall, M. Coupled thermo-hydro-mechanical-chemical behaviour of cemented paste backfill in column experiments. Eng. Geol. 2014, 170, 11–23. [Google Scholar] [CrossRef]
  26. Guo, W.; Wang, H.; Chen, S. Coal pillar safety and surface deformation characteristics of wide strip pillar mining in deep mine. Arab. J. Geosci. 2016, 9, 137. [Google Scholar] [CrossRef]
  27. Dai, H.; Guo, J.; Yan, Y.; Li, P.; Liu, Y. Principle and application of subsidence control technology of mining coordinately mixed with backfilling and keeping. J. China Coal Soc. 2014, 8, 1602–1610. [Google Scholar]
  28. Rankine, R.; Pacheco, M.; Sivakugan, N. Underground Mining with Backfills. Soils Rocks 2007, 30, 93–101. [Google Scholar] [CrossRef]
  29. Mo, S.; Canbulat, I.; Zhang, C.; Oh, J.; Shen, B.; Hagan, P. Numerical investigation into the effect of backfilling on coal pillar strength in highwall mining. Int. J. Min. Sci. Technol. 2018, 28, 281–286. [Google Scholar] [CrossRef]
  30. Ohenoja, K.; Pesonen, J.; Yliniemi, J.; Illikainen, M. Utilization of Fly Ashes from Fluidized Bed Combustion: A Review. Sustainability 2020, 12, 2988. [Google Scholar] [CrossRef]
  31. Al-Moselly, Z.; Fall, M.; Haruna, S. Further insight into the strength development of cemented paste backfill materials containing polycarboxylate ether-based superplasticizer. J. Build. Eng. 2022, 47, 103859. [Google Scholar] [CrossRef]
  32. Saedi, A.; Jamshidi-Zanjani, A.; Darban, A.K. A review of additives used in the cemented paste tailings: Environmental aspects and application. J. Env. Environ. Manag. 2021, 289, 112501. [Google Scholar] [CrossRef]
  33. Behera, S.K.; Mishra, D.P.; Singh, P.; Mishra, K.; Mandal, S.K.; Ghosh, C.N.; Kumar, R.; Mandal, P.K. Utilization of mill tailings, fly ash and slag as mine paste backfill material: Review and future perspective. Constr. Build. Mater. 2021, 309, 125120. [Google Scholar] [CrossRef]
  34. Yamaguchi, K.; Tomiyama, S.; Igarashi, T.; Yamagata, S.; Ebato, M.; Sakoda, M. Improvement in pH and Total Iron Concentration of Acid Mine Drainage after Backfilling: A Case Study of an Underground Abandoned Mine in Japan. Minerals 2021, 11, 1297. [Google Scholar] [CrossRef]
  35. Behera, S.K.; Ghosh, C.N.; Mishra, K.; Mishra, D.P.; Singh, P.; Mandal, P.K.; Buragohain, J.; Sethi, M.K. Utilisation of lead-zinc mill tailings and slag as paste backfill materials. Env. Environ. Earth Sci. 2020, 79, 389. [Google Scholar] [CrossRef]
  36. Paul, B.; Gupta, A.K. Comparative analysis of different materials to be used for backfilling in underground mine voids with a particular reference to hydraulic stowing. Int. J. Oil Gas Coal Technol. 2017, 15, 425. [Google Scholar] [CrossRef]
  37. Cheskidov, V.I.; Reznik, A.V. Features of Hydraulic Fill Formation in Mining Water-Bearing Lignite Deposit. J. Min. Sci. 2019, 55, 273–279. [Google Scholar] [CrossRef]
  38. Sun, Y.; Xie, S.; Wu, C.; Cui, J.; Chen, D.; Guo, F.; Jiang, Z.; Ren, Y.; Lu, W. Influence of the ultra-fine fly ash dosages on the mechanical properties of the sulfoaluminate cement-based high water backfilling material. Sci. Rep. 2023, 13, 1564. [Google Scholar] [CrossRef] [PubMed]
  39. Ding, Y.; Feng, G.; Wang, C. Experimental research on basic properties of superhigh-water packing material. J. China Coal Soc. 2011, 36, 1087–1092. [Google Scholar]
  40. Sun, C. Backfilling Mining Technology with Super High-Water Material; Science Press: Beijing, China, 2017; pp. 9–41. [Google Scholar]
  41. Wang, X.; Sun, C.; Zhang, D.; Li, Y.; Xu, M.; Guan, K. Experimental study on engineering characteristics of super-high water filling body. J. Min. Saf. Eng. 2014, 31, 852–856. [Google Scholar]
  42. Wang, X.; Zhang, D.; Sun, C.; Wang, Y. Surface subsidence control during bag filling mining of super high-water content material in the Handan mining area. Int. J. Oil Gas. Coal T 2016, 1, 87–102. [Google Scholar] [CrossRef]
  43. Feng, G. Research on the Super High-Water Packing Material and Filling Ming Technology and Their Application. Ph.D. Thesis, China University of Mining and Technology, Xuzhou, China, 2009. [Google Scholar]
  44. Vu, T.T.; Do, S.A. Determination of the rock mass displacement zone by numerical modeling method when exploiting the longwall at the Nui Beo Coal Mine, Vietnam. Min. Miner. Depos. 2023, 17, 59–66. [Google Scholar] [CrossRef]
  45. Tuncay, D.; Tulu, I.B.; Klemetti, T. Verification of 3D Numerical Modeling Approach for Longwall Mines with a Case Study Mine from the Northern Appalachian Coal Fields. Min. Metall. Explor. 2021, 38, 447–456. [Google Scholar] [CrossRef]
  46. Parmar, H.; Yarahmadi Bafghi, A.; Najafi, M. Impact of ground surface subsidence due to underground mining on surface infrastructure: The case of the Anomaly No. 12 Sechahun, Iran. Env. Environ. Earth Sci. 2019, 78, 409. [Google Scholar] [CrossRef]
  47. Emad, M.Z.; Mitri, H.; Kelly, C. Dynamic model validation using blast vibration monitoring in mine backfill. Int. J. Rock. Mech. Min. 2018, 107, 48–54. [Google Scholar] [CrossRef]
  48. Xu, Z. Research on the Application of Super-High Water Material Backfilling and Mining Technology under Long-Walled Working Face Conditions. Masters’s Thesis, Kunming University of Science and Technology, Kunming, China, 2022. [Google Scholar]
  49. Hu, B.; Zhang, H.; Shen, B. Code for Coal Pillar Preservation and Press Coal Mining of Buildings, Water Bodies, and Main Tunnels; China Coal Industry Publishing House: Beijing, China, 2017; pp. 1–3. [Google Scholar]
  50. He, G.; Yang, L.; Ling, G.; Jia, F.; Hong, D. Ming Subsidence; China University of Mining and Technology Press: Xuzhou, China, 1991; pp. 29–31. [Google Scholar]
  51. Dai, H. Classification Method of Balanced arch Structure of Mining Rock Mass. CN Patent Application No. 201710262816.5, 29 January 2019. [Google Scholar]
Figure 1. Curves of the mechanical properties of the consolidation of super-high-water materials with time for different water volumes: (a) Curve of the compressive strength of super-high water consolidation bodies with consolidation time; (b) Volume strain versus consolidation time for super-high water material consolidation.
Sustainability 15 08713 g001
Figure 2. The geographical location of the working face 2515. (a) HeBei Province. (b) Fuxing Country. (c) Working face.
Sustainability 15 08713 g002
Figure 3. Simplified diagram of the drill hole column of working face 2515.
Sustainability 15 08713 g003
Figure 4. Diagram of the layout of the observation line above the 2515 working face.
Sustainability 15 08713 g004
Figure 5. Schematic diagram of the numerical simulation model.
Sustainability 15 08713 g005
Figure 6. Surface movement deformation curve in strike direction after mining: (a) Surface subsidence curve; (b) Surface tilt curve; (c) Surface curvature curve.
Sustainability 15 08713 g006
Figure 7. Surface movement deformation curve in incline direction after mining: (a) Surface subsidence curve; (b) Surface tilt curve; (c) Surface curvature curve.
Sustainability 15 08713 g007
Figure 8. Dynamic surface movement deformation curves: (a) Strike surface subsidence curve; (b) Inclined surface subsidence curve.
Sustainability 15 08713 g008
Figure 9. The subsidence velocity and subsidence curve of the maximum surface subsidence observation point (Z9).
Sustainability 15 08713 g009
Figure 10. The formation process of the surface subsidence basin diagram. When the working face advanced to the positions of 1,2,3 and 4, after the surface movement was stable, the dynamic surface subsidence basins W1, W2, W3, and W4 were formed at each position. Among them, W1 was the subsidence basin where the mining influence affected the surface for the first time during the advanced process of the working face.
Sustainability 15 08713 g010
Figure 11. Stress distribution curves for different advancing distances on the working face 2515: (a) Mining face advances 100 m; (b) Mining face advances 200 m.
Sustainability 15 08713 g011
Figure 12. Stress distribution curves for different advancing distances on the working face 2515: (a) Mining face advances 300 m; (b) Mining face advances 400 m.
Sustainability 15 08713 g012
Figure 13. The displacement distribution curve of rock strata at different advancing distances in the 2515 working face: (a) Mining face advances 100 m; (b) Mining face advances 200 m.
Sustainability 15 08713 g013
Figure 14. The displacement distribution curve of rock strata at different advancing distances in the 2515 working face: (a) Mining face advances 300 m; (b) Mining face advances 400 m.
Sustainability 15 08713 g014
Figure 15. Rock stress distribution curve of different mining methods in 2515 working face: (a) Stress distribution curve by fully caving mining; (b) Stress distribution curve by super-high water material backfilling and mining technology.
Sustainability 15 08713 g015
Figure 16. The displacement curve of overlying strata under different mining methods: (a) Displacement distribution curve by fully caving mining; (b) Displacement distribution curve by super-high water material backfilling and mining technology.
Sustainability 15 08713 g016
Figure 17. The distribution curve of the relationship between the mining length ratio (different mining lengths/mining depth) of the working face and maximum surface subsidence.
Sustainability 15 08713 g017
Figure 18. The distribution curve of the relationship between backfilling material factors and maximum surface subsidence: (a) The relationship curve between different backfilling rates and maximum surface subsidence; (b) The relationship curve between the strength ratio of different backfilling material and the maximum value of surface subsidence.
Sustainability 15 08713 g018
Figure 19. Different mining methods in the Goaf overlying strata movement diagram: (a) The fully caving mining method; (b) The method of super-high water material backfilling and mining technology. In addition, h01 and h02 are the heights of development of the main rock arch structures using different mining methods, respectively.
Sustainability 15 08713 g019
Figure 20. The backfilling mining process of super-high-water material in Hengjian Coal Mine.
Sustainability 15 08713 g020
Table 1. Rock physical and mechanical parameters of the 2515 working face.
LithologyDensity
(kg/m3)
Bulk Modulus
(MPa)
Shear Modulus
(MPa)
Tensile Strength
(MPa)
Cohesion
(MPa)
Friction Angle
(°)
Loess layer1650166270.0260.0324
Medium sandstone20286956361.41.3332
Siltstone228011885132.12.831
Sandy mudstone23479163441.82.030
Fine grained sand23008334863.14.230
Coarse grained sand21368576924.75.736
Medium sandstone22867815512.72.333
Siltstone248012125122.02.632
Coal seam14507772051.01.227
Siltstone261212235252.12.832
Filling material13508335350.80.927
Disclaimer/Publisher’s Note: The statements, opinions and data contained in all publications are solely those of the individual author(s) and contributor(s) and not of MDPI and/or the editor(s). MDPI and/or the editor(s) disclaim responsibility for any injury to people or property resulting from any ideas, methods, instructions or products referred to in the content.