Article

Professional Training in Beekeeping: A Cross-Country Survey to Identify Learning Opportunities

1
CERNAS Research Centre, Polytechnic Institute of Viseu, 3504-510 Viseu, Portugal
2
CECAV, Animal and Veterinary Research Center, University of Trás-os-Montes e Alto Douro, Quinta de Prados, Apartado 1013, 5000-801 Vila Real, Portugal
3
Norwegian Beekeepers Association, 2040 Kløfta, Norway
4
Institute of Agricultural and Environmental Sciences, Estonian University of Life Sciences, 51014 Tartu, Estonia
5
Eosa Estrategia y Organización SA, 36202 Vigo, Spain
6
Bio-Distretto Cilento, 84052 Salerno, Italy
7
Tera Tehnopolis, 31000 Osijek, Croatia
*
Author to whom correspondence should be addressed.
Sustainability 2023, 15(11), 8953; https://doi.org/10.3390/su15118953
Submission received: 21 April 2023 / Revised: 24 May 2023 / Accepted: 31 May 2023 / Published: 1 June 2023

Abstract

:
Habitat loss, climate change, and other environmental degradations pose severe challenges to beekeepers. Therefore, this sector needs to rely on updated information so that the intervening actors can deal with the problems. In this context, and assuming that professional training can greatly help those acting in the beekeeping sector, this work intended to investigate the gaps in the updated knowledge of beekeepers and how these can be filled through lifelong learning. The research was conducted in seven European countries (Croatia, Estonia, Finland, Italy, Norway, Portugal, and Spain). The data were collected through a questionnaire survey translated into the native languages of all participating countries. The results revealed that the topics of highest interest are apiary health and pest control and the management of the colonies throughout the year. The beekeepers update their knowledge through family, complemented by professional training, with participants preferring in-person courses as well as, in the workplace or in internships. The learning methodologies they consider most useful are project-based learning and learning through gamification. The videos and paper books or manuals are particularly valued as learning materials, and practical exercises are considered the most helpful assessment format. Finally, considering the effect of sociodemographic variables on the learning experiences and preferences of beekeeping actors, it was observed that the country was the most influential of the variables under study. In conclusion, this work revealed valuable information that should be used to design professional training actions to help the professionals in the beekeeping sector enhance their competencies and be better prepared to manage their activities successfully.

1. Introduction

Beekeeping is a key sector from multiple perspectives. Sustainability is one of the relevant aspects linked with the roles of bees and, consequently, beekeeping activities. Bees are important pollinators for many crops and plants. It is estimated that bees and other pollinators are responsible for one-third of the food we eat. By maintaining healthy bee populations through beekeeping, the pollination of crops is ensured, leading to greater food security and more sustainable agriculture. On the other hand, bees play a critical role in maintaining biodiversity by pollinating wildflowers and other plants. This helps to maintain healthy ecosystems and support other wildlife. Keeping bees helps support local biodiversity and contributes to the preservation of ecosystems. Bee products such as honey, beeswax, propolis and royal jelly have antimicrobial properties. By using these products and other natural beekeeping techniques, beekeepers can reduce the need for synthetic pesticides and other chemical treatments that can harm the environment and human health. Finally, in the social sustainability dimension, beekeeping can provide sustainable livelihoods for people in rural and urban areas. It can be a low-cost, low-impact form of agriculture practised on a small scale. By providing a source of income and livelihood, beekeeping can help support local communities and contribute to sustainable development [1,2,3,4,5,6].
Beekeepers face many challenges in maintaining their apiaries in good equilibrium, increasing productivity, enhancing performance, and being more competitive in the context of globalization. Since many beekeepers’ businesses are of a small dimension and greatly contribute to the social development of rural populations, providing them with proper training is essential to help them cope with the sector’s challenges. Investing in lifelong learning (LL) and professional training (PT) might make the difference between a successful business or a failure [7,8,9].
The human s capacity to learn and accumulate knowledge from a wide amount of information that is considered relevant is enormous. The human brain’s capacity to learn and accumulate knowledge is closely related to synaptic plasticity, which refers to the ability of the connections between neurons, called synapses, to change in response to experience. When learning new things or acquiring new information, the human brain forms new connections between neurons or strengthens existing ones, which is known as synaptic potentiation. This allows for people to encode and store new information in long-term memory. Synaptic plasticity is influenced by various factors, including the frequency, intensity, and duration of neuronal activity, as well as the age, genetics, and environmental factors of the individual. Thus, the capacity of the human brain to learn and accumulate knowledge is intimately linked to the ability of its synapses to adapt and change in response to experience, which is a fundamental aspect of synaptic plasticity. With increased learning and experience, more connections are formed in the brain, strengthening and accumulating more knowledge over time. It is the synaptic plasticity of the brain that enables it to learn new representations as well as to eliminate previously learned information, constituting a foundation for shaping memory and learning that culminates in the LL process [10,11,12,13,14].
LL refers to the ongoing and voluntary pursuit of knowledge and skills throughout one’s life, beyond traditional classroom education. It is an attitude and approach to learning that recognizes that learning is not just limited to formal education but can take place through a variety of experiences and activities such as work, hobbies, personal interests, and social interactions. LL is becoming increasingly important in today’s rapidly changing world, where new technologies, information, and industries are constantly emerging. It allows individuals to adapt to changing circumstances, keep up with the latest trends and developments, and improve their personal and professional prospects. LL involves a commitment to personal development and self-improvement, and can bring numerous benefits, such as increased knowledge, improved job performance, better social and communication skills, increased confidence, and a sense of personal fulfilment. LL encompasses different analytic perspectives: the social organization of learning and individual learning. These indicate the way in which past definitional concerns related to formal, non-formal and informal learning. The recognition of learning outcomes must be modern and consider eventually contrasting viewpoints, in the European context as well as from the global perspective [15,16,17,18].
PT encompasses the process of building knowledge, skills and competencies, either on an individual person or in a group or team. PT can have a significant impact on an individual’s personal and professional development, as well as on his organization/company. Some of the key impacts of professional training are improved job performance, career advancement, increased job satisfaction and motivation and enhanced organizational performance. Overall, PT can have a positive impact on both individuals and organizations, leading to improved job performance, career advancement, job satisfaction, and organizational performance. Effective training improves not only knowledge and skills but also attitudes and resilience [19,20,21,22].
The beeB project—Foster for beekeeping bridges through innovative and participative training, which was approved by the European Union under Ref. 2019-1-PT01-KA202-060782, aims to contribute to the technical training of beekeepers and other agents involved in the beekeeping sector, as well as providing appropriate tools in mobile-learning (m-learning) contexts, to improve beekeepers’ ability to manage their businesses successfully. The project team integrates six partners from different European countries and encompasses the identification of needs and the development of training opportunities, facilitating beekeepers’ access to distance learning courses, platforms and content. In this context, the aim of this work was to identify the needs of those acting in the beekeeping sector and understand how these needs can be fulfilled through lifelong learning. Additionally, differences will be identified according to the country or other sociodemographic variables of the participants. These elements will offer valuable information for the design of courses and other learning tools that will be easily available for use by all stakeholders in the beekeeping sector to enhance their knowledge and skills.

2. Materials and Methods

2.1. Instrument Used for the Research

The questionnaire used for the present research was divided into six sections:
I.
Experience in beekeeping (10 questions);
II.
Training needs (3 questions);
III.
Experience in beekeeping training activities (3 questions);
IV.
Use of distance learning technologies and tools (3 questions);
V.
Distance learning tools (4 questions);
VI.
Sociodemographic characterization (6 questions).
The questionnaire was first produced in Portuguese and validated through a pre-test with 50 participants through direct interviews. The final instrument was then obtained after this pre-test. Before general application, the questionnaire was translated into the native languages in the seven countries where the data were collected, following a back-translation methodology.
This research paper is focused on professional training and its relationship with the sociodemographic variables, addressing questions from parts II–VI.

2.2. Data Collection

The survey was applied to beekeepers in different countries (Croatia, Estonia, Finland, Italy, Norway, Portugal, Spain) as a part of the project Beeb—Foster for beekeeping bridges through innovative and participative training (2019-1-PT01-KA202-060782), approved and developed by the Polytechnic Institute of Viseu, as leading partner.
The sample was selected from all the potentially interested people in the different countries included in the study. The target group comprised people linked to the beekeeping sector, either beekeepers, academia members, or those dealing with bee products’ transformation and commercialization, as examples. This also included people who participated in activities other than beekeeping, those who recently engaged in this sector or those who have beekeeping as a complementing activity to their other principal activities.
The questionnaire was delivered in paper form, face-to-face, during training or dissemination events organized by beekeepers’ associations or companies in each country. Additionally, online tools were used to complement the data collection and reach a wider audience among those connected with the beekeeping sector.
A total of 313 valid responses were obtained considering the whole set of countries. In the case of variable age, cases in which the participants did not indicate their age were excluded. For variable sex, cases where the participants identified themselves explicitly with men or women were considered. In the case of variable education, and due to the very low representativeness of the group basic school (only 3%), basic classes plus secondary school were merged into a single class.

2.3. Data Analysis

The non-parametric tests U-Mann–Whitney and Kruskal–Wallis were used to compare quantitative variables between two groups or three or more groups, respectively. Non-parametric tests were used in the present study due to the low number of cases in some groups, inequality of group dimensions and non-verification of normality distribution. Chi-square tests were used to test the differences between some categorical variables. For all data analysis, the software SPSS, from IBM Inc. (version 28), was used, complemented by Excel 2016. The level of significance considered was 5%.

3. Results

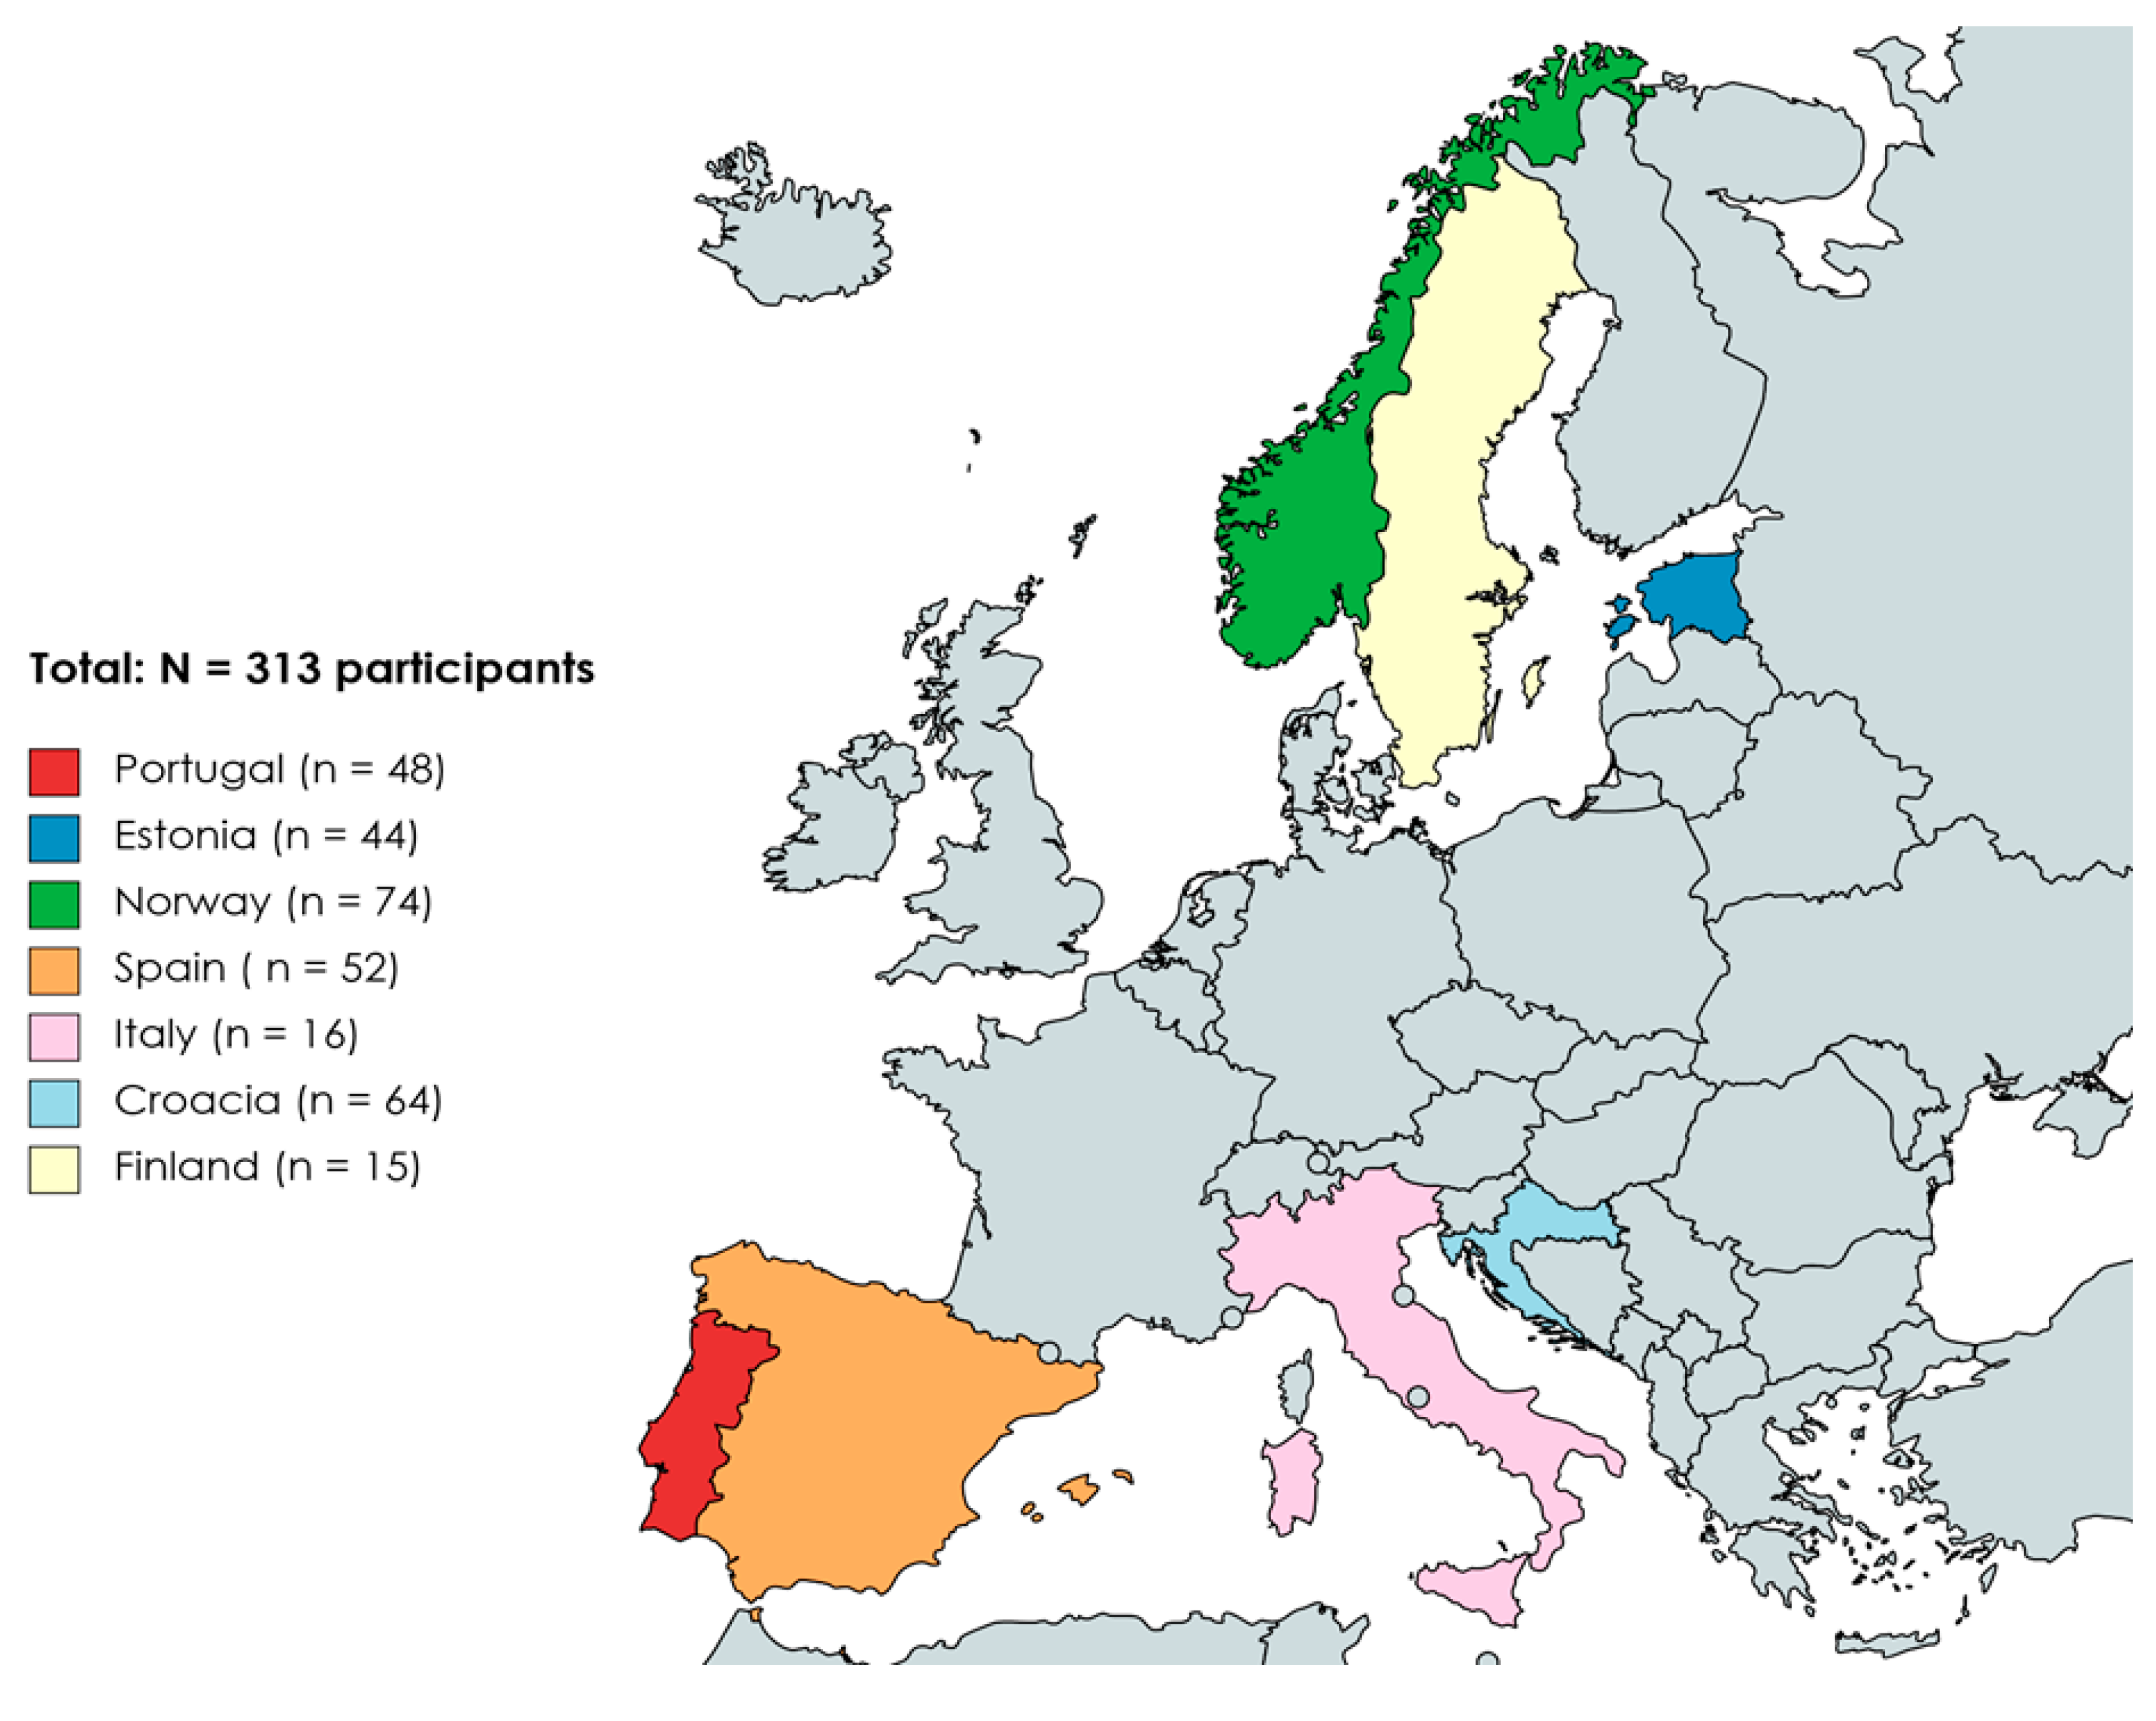
3.1. Sample Characterization

Data were collected from six European countries participating in the European Erasmus+ project beeB (Foster for beekeeping bridges through innovative and participative training/Ref. 2019-1-PT01-KA202-060782), namely: Croatia, Estonia, Finland, Italy, Norway, Portugal, and Spain. Figure 1 shows how the participants were distributed among the countries included in this study. The percentages varied from 5% for participants from Finland (n = 15 out of 313 participants) to 24% for participants from Norway (n = 74 out of 313).
Figure 2 shows that most of the participants in the survey (68%) had ages ranging from 31 to 59 years old, followed by those aged over 60 years (18%), and the class under 30 years had a lower expression (9%). The majority were male (74%), with only about one-fourth (23%) females. Concerning the education level, 59% had a university degree, 35% had completed secondary school, and only 3% had a very low level of education (basic school). Concerning the income, the distribution by classes was more even, with 38% having an income between 15 and 50 thousand euros per year, 25% having an income lower than 15 thousand EUR/y and 23% over 50 thousand EUR/y.

3.2. Access to the Internet in the Apiaries

The participants were questioned about whether they had access to internet in their apiaries, with the results presented in Figure 3. No significant differences were found between countries regarding access to the internet in the apiaries. Nevertheless, most participants in Italy (92.3%) and Finland (91.7%) have internet in all apiaries. Portugal and Spain are the countries with less internet access in the apiaries (69.8% and 68.6%, respectively). Considering all data (countries), mean access to the internet covers 78.9% of the apiaries.

3.3. Use of Technologies and Purposes

The participants were questioned about how frequently they use mobile devices in their beekeeping activities, with the results presented in Table 1. Significant differences were found between countries for the frequency of utilization of mobile devices. Italy (62.5%), Croatia (61.7%) and Finland (58.3%) were the countries where the daily frequency of utilization of mobile devices was higher. Significant differences were also encountered between age groups for the frequency of utilization of mobile devices for beekeeping activities, with percentage of participants using them daily increasing as age decreased. Finally, the frequency of utilization of mobile devices was also found to vary significantly according to income, with increased daily usage for lower incomes.
Table 2 shows the results of cross-tabulation between the sociodemographic variables and the reasons why the beekeepers use their mobile devices in beekeeping activities. Again, countries were shown to have significant differences for all the possible usages, while age and sex were variables that did not lead to significant differences. However, significant differences were found for the variable income, just like country. A higher income is associated with a higher percentage of utilization of mobile devices for all the tested reasons. Finally, significant differences were found between participants with a university degree from those with up to a secondary school education in the use of mobile devices to ‘Take pictures’, ‘Make videos’ and ‘Use apps’.

3.4. Previous Knowledge and Experience in Training Activities

The results in Figure 4 show the mean value for the importance attributed to the different sources of information in previous knowledge. For the sources of information, the scale varied from 1 (most important) to 3 (least important), and the results indicated that the most important source was ‘Family’, with a mean score closest to 1, while the least important was ‘Seminars’, with the highest mean score of 1.55.
Table 3 presents the results of the non-parametric statistical tests performed on the relations between the considered variables and the level of importance attributed to the sources of information in beekeeping. The results reveal that significant differences were found between countries for all sources of information’. For the other variables, differences were observed between groups for some of the sources of information.
Table 4 presents the results for cross-tabulation between the variables accounting for part experience in training in beekeeping and the sociodemographic variables under study. The results indicated significant differences between those who already participated in training activities and those who did not, according to country (higher participation in Norway—93.2%—and lower in Croatia—58.3%), age (higher percentage for older participants—83.6%—and lower for younger—51.7%), and income (higher participation for higher income—93.0%—and lower for lower income—71.1%). Regarding participation as a trainee, significant differences were found according to country, education, and income (a higher percentage of participants were trainees in Estonia, with a university education and high income). Concerning the participation as trainer/coordinator, significant differences were found for country and age (higher percentage of participants from Portugal and Estonia and in the age group of 60+ years (Table 4).

3.5. Identification of Training Needs

The respondents were asked to classify several topics for possible training modules according to their level of interest on a scale from 1 (little interest) to 5 (much interest). Figure 5 presents the average scores for each option, calculated as the mean value of the classifications attributed by all participants. The topics considered of the highest global interest were ‘Apiary health and pest control’, followed by ‘Colony management throughout the year’. Topics of the lowest interest are ‘Organic production mode’ and ‘Beehive production’.
The results in Table 5 show that country is the variable for which significant differences were found for a higher number of training topics in beekeeping. Topics such as ‘Beehive production’, ‘Organic production mode’ and ‘Food management’ showed significant differences between countries, with p < 0.001, but topics such as ‘Meliferous flora’, ‘Apiary Installation’, ‘Production of bee products other than honey’, ‘Hygiene, health and safety at work in beekeeping’, ‘Legislation’, and ‘Business skills’ had a p-value below the significance level (p < 0.05). Additionally, the variable sex showed significant differences for many topics, five. Regarding age, significant differences were found for three of the topics, and income revealed differences for two topics. On the other hand, no significant differences were found between the participants with a university education and those with a secondary school education for any of the topics considered (Table 5).
The results in Figure 6 present the mean value for the interest attributed to the different forms of training activities on a scale varying from 1 (little interest) to 5 (much interest). The results indicate that the activities carried out in person are preferred by the participants, with the highest means score (3.94), while the distance training received the lowest score (3.06).
Table 6 shows the results for the tests of group differences in training mode for the sociodemographic variables considered and reveals that country differences were statistically significant in all cases, i.e., for all types of training modes investigated. Higher means ranks were found for the ‘In person’ mode in Portugal (MR = 153.78), for the ‘At distance’ mode in Italy (MR = 167.44), for the ‘Mixed’ mode in Italy (MR = 152.75) and for more practical modes in Estonia (MR = 132.71 for the ‘In work place/internship’ mode). With respect to sex, significant differences were found for the ‘At distance’ and ‘Mixed’ modes. Finally, for education level, significant differences were encountered only for the ‘At distance’ mode, with this being preferred by people with a university degree.

3.6. Preferred Tools for Distance Learning

When enquired whether the participants preferred digital or printed information about beekeeping for the purpose of lifelong learning and training activities, 177 said they preferred digital, and 136 preferred printed information. Countries where a higher number of participants prefer digital materials include Croatia (n = 44 against 17 who prefer printed), Finland (n = 9 against 5), Italy (n = 10 against 6), Portugal (n = 25 against 21) and Spain (n = 37 against 15). Contrarily, in Estonia and Norway, a higher number of participants prefer printed materials.
The participants’ opinions about the usefulness of learning methodologies, materials, and assessment forms are presented in Figure 7. The mean scores were obtained as an average of all participants, and the measurement scale ranged from 1 (little useful) to 5 (very useful). The results indicate that project-based learning was the methodology considered most useful by the participants (mean score of 4.21), followed by the use of games and other challenges through gamification (means score of 3.82). The short courses were the least valued by the participants (with the lowest mean score of 2.44). With respect to the learning supports, the most valued were ‘Videos’ and ‘Books/Paper manuals’, with mean scores of 4.03 and 4.00, respectively. Strangely, the ‘Educational games’ came in last (with a mean score of 2.28), being considered a less useful learning support, somehow contradicting the results of the previous question, where gamification was a much-valued learning methodology. Finally, concerning the assessment formats, the ‘Practical exercises’ obtained the highest mean score (3.95), while ‘Paper tests/questionnaires’ obtained the lowest score (3.11) (Figure 7).
Table 7 and Table 8 present the results obtained for the non-parametric tests performed to investigate possible significant differences between the groups regarding the sociodemographic variables studied in relation to the usefulness of learning methodologies, supports, and assessment formats. For the learning methodologies (Table 7), significant differences were observed between countries for practically all options, except for ‘Monitoring of pilot farms’. For example, Italian participants attributed the lowest level of usefulness to ‘Group work’ (MR = 40.94) or ‘Forum/Chat’ (MR = 46.41), while attributing the highest usefulness to gamification (MR = 193.38) and to ‘Short courses’ (MR = 166.19). The differences according to age were only significant for ‘Field visits’ and for ‘Short courses’ (both options rated as less useful by older participants). Differences according to sex were also encountered for the same two learning methodologies, ‘Field visits’ and ‘Short courses’, which were preferred by female participants (mean ranks of 148.92 and 154.18, respectively). For education level, significant differences were found only for ‘Gamification’, with this methodology considered more useful by participants with a university degree (MR = 148.03). Finally, for the classes of income, significant differences were observed only for ‘Lectures’ and ‘Short courses’, with these being less valued by participants with the highest level of income (mean ranks of 95.28 and 92.63, respectively).
The results in Table 8 show that, once again, country differences were the most relevant, with significant differences for practically all analyzed learning supports and also for most of the assessment formats considered. While participants from Italy scored with ‘E-books’, ‘Technical leaflets’ and ‘Educational games’ as most useful (mean ranks of 159.09, 215.78 and 182.06, respectively), participants form Croatia rates attributed the highest mean scores to ‘Interactive platforms’, ‘Videos’ and “Specific programs or apps’ (mean ranks of 153.60, 162.22 and 148.22, respectively). Age differences were significant for some of the learning supports, specifically ‘E-books’ and ‘Educational games’, which were less valued by older people (mean ranks of 105.81 and 95.52, respectively). The older participants also attributed lower usefulness to the assessment based on ‘Tasks/reports’ (MR = 103.27). Regarding sex, significant differences were found for some learning methodologies, such as ‘Interactive platforms’, ‘Books/Paper manuals’, and ‘Educational games’, with all these being more valued by female participants (mean ranks of 154.95, 162.52 and 140.69, respectively). The level of education showed significant differences only for ‘E-books’, with the highest level of usefulness assigned by participants with a university degree. Finally, significant differences were observed according to income for the ‘Educational games’, which were less valued by participants with the highest income level (MR = 89.49).

4. Discussion

Education constitutes a privileged way to increase productivity and competitiveness in multiple business areas, including beekeeping. LL is relevant not only from the professional but also from the personal point of view, providing opportunities for self-development and continuous improvement. Allying LL with PT allows for a constant, or at least a regular, valorization of the individual and their skills and competencies, providing tools to become more resilient and successful in all areas of professional development. e-Learning takes the lead and will continue to play a prevailing role in the construction of educational management systems and related learning environments [19,23].
The integration of information technology (internet and other resources) and mobile devices used for learning (m-learning) with conventional education can have a significant impact on the improvement in LL capacity. It has been recommended that, particularly for rural environments, training programs for mobile education should address four main challenges related to the practical nature of the courses and specificity of learning environments, namely: scarce educational space and limited equipment; instructors and technicians with developed applied skills but without proper pedagogical support; the under-relevance attributed to parallel and additional experiences; unsatisfactory class management by the instructors and technicians. The agricultural sector and its related activities, such as beekeeping, are major contributors to the economies of many countries. Beekeeping, in particular, contributes through the great importance of bees as pollinators and regulators of biodiversity and ecosystems, and assumes an even greater role in global sustainability. Hence, a great challenge for the organizations teaching in this area might involve changes in the pedagogical methods adopted to address the needs and wishes of the students [24,25].
Despite the massive possibilities of distance learning methodologies having been acknowledged for many decades, it is also true that, until the year 2020, with the outbreak of COVID-19 pandemic, teaching methods continued to follow a mostly traditional approach based on in-person teaching inside a classroom. The pandemic brought an urgent need to shift rapidly from in-person learning systems to distance learning, supported by technology and digital content, causing an evolution not only in the technology itself but also in the didactic and pedagogical domains. Therefore, at present, professionals are more adapted to distance learning and innovative learning methodologies, as well as assessment formats [26,27,28].
Fischer et al. [23] describe a framework for reconsidering education, including novel components such as learning-on-demand or problem-based learning. The design of innovative learning approaches for the digital era entails meticulousness in designing learning experiences and evaluating them as a way to understand what effectively works, how it works, and why it works. The design of digital learning experiences is supported by multiple dimensions related to how learners interact with the digital tools they use, their learning environments, or services. These also relate to the pedagogical foundations leading to the established learning goals, the necessary activities to achieve those goals, and the chosen forms of assessment. Finally, it is necessary to investigate how learners interact with other peers and with instructors [29].
Distance learning tools for PT are particularly useful for active professionals, given their lack of time. Still, professionals feel a need to improve their knowledge, skills and competencies as a way to improve and expand their businesses and increase competitiveness, in addition to their natural desire to broaden their knowledge on certain topics [30,31,32,33].
Beekeeping is a complex activity once beekeepers manage upwards of 10,000 individual honeybees in a single colony. Honeybees are highly sensitive to environmental and seasonal changes and vulnerable to a range of diseases and pests. This makes beekeeping an activity that requires specialized skills and knowledge to ensure the health and productivity of honeybees [34].
In this work, beekeepers showed a preference for training needs on “Apiary health and pest control” and ‘Colony management throughout the year”. It can be explained by the high number of honeybee colonies lost every year and the beekeeper’s will to increase the productivity of their apiaries. Gray et al. [35] showed that Spain was the European country with the highest rate of colonies lost in the winter of 2019/2020, with 36.5%, followed by Slovenia (28.9%) and Portugal (22.5%). Varroosis is the most prevalent worldwide disease of honey bees, and an important cause of beehive loss, with a high economic impact on beekeeping activity [36]. Increasing beekeepers’ knowledge of these two issues is crucial to improving beehives’ productivity and, consequently, beekeepers’ income.
Jacques et al. [37] highlighted beekeeper background and apicultural practices as the major drivers of honey bee colony losses and reinforced the need for beekeeper training to promote the best beekeeping practices. The research suggests that access to beekeeping training could be an important mechanism influencing honey productivity and beekeeping incomes [38,39,40].
Regarding training activities, beekeepers prefer “in person” courses, followed by “in workplace/internship”, to b-learning or e-learning courses. Beekeeping requires mostly practical training, which can explain beekeepers’ preference for training that is carried out “in person”, rather than b-learning or e-learning. However, the classical modes of teaching cause beekeepers to fall into a passive learning pattern and increase the gap between the practice and theory [41].
Schouten and Caldeira [40] recommend that beekeeping training focus on practical skills’ development over classroom theory-based activities. Concerning the preferred tools for distance learning, beekeepers prefer knowledge-based projects, followed by gamification, as learning methodologies. The preferred learning materials were videos and books. Finally, the preferred assessment form was based on practical exercises. E-learning involves online instruction without any face-to-face contact, and beekeepers can learn at their own pace with online resources [42]. Training through e-learning can be engaging and interactive, using videos, presentations, chat, library, and assessments, with the goal of maximizing the learner’s experience in the beekeeping learning process [41].
Beekeeping training can be delivered in a range of modes, in-person, e-learning or b-learning. Independent of beekeepers’ preferences, training is important to improve their knowledge and skills. According to Schouten and Lloyd [43], the learning programs should be adjusted in developing countries, considering the strong necessity of beekeeping knowledge and the limited conditions required to enable the implementation of bee management in the colonies.
Education and learning are important means of supporting the knowledge needed to improve beekeeping management and create value-added hive products due to the new techniques and technology being adopted [44,45]. Even in more developed beekeeping structures, evolution, research, and innovation are only possible with LL, which is provided by different formal and informal modalities [46]. In a study conducted in Nagano, Japan, by Uchiyama et al. [47], it was found that tacit knowledge within the family promotes explicit knowledge in an ageing society, leading to a relatively large number of bee colonies and a perception of the necessary ecological conditions for sustainable beekeeping. In fact, beekeepers’ environmental knowledge remains the backbone of the activity’s sustainability [48].

5. Conclusions

The results of this study indicated valuable directions to implement proper professional training for actors in the beekeeping sector. The topics of highest interest include the health of apiaries and control of pests affecting the apiaries and bee colonies, or the management of the colonies throughout the year, with different specifications according to the season. The beekeepers seek new information mostly through family but also through professional training, and the preferred forms of training include in-person courses, workplace training or internships. The learning methodologies they consider most useful include project-based learning and learning through gamification and related tools. With respect to the learning supports, videos and paper books or manuals are particularly valued, and the assessment format rated as most valuable is practical exercises. Another inveistigated aspect was the effect of sociodemographic variables on the learning experiences and preferences of beekeeping actors, and in this respect, it was observed that the country was the most influential of the investigated factors.
The construction of courses adapted for mobile learning with adequate forms of assessment of the learning outcomes allows for the continuous updating of information, creation of knowledge, and development of skills that beekeepers consider essential for their activities. They want to take part in PT in topics they find crucial; therefore, the curriculum development needs to adapt to this reality. However, they find distance learning to be a useful means of training, but they recognize that complementing this with practical activities is necessary to achieve success, since these blended learning approaches bring together the best of the different approaches.

Author Contributions

Conceptualization, R.P.F.G.; methodology, R.P.F.G. and J.O.; software, R.P.F.G.; validation, R.P.F.G.; formal analysis, R.P.F.G.; investigation, R.P.F.G., C.A.C., H.E.C., B.D., R.R., R.K., L.T., S.B., E.B., I.S., M.O., C.C. and J.O.; resources, C.A.C.; data curation, R.P.F.G.; writing—original draft preparation, D.T.C., P.C., J.O., C.C. and R.P.F.G.; writing—review and editing, R.P.F.G.; visualization, R.P.F.G.; supervision, R.P.F.G.; project administration, C.A.C.; funding acquisition, C.A.C. All authors have read and agreed to the published version of the manuscript.

Funding

This research was funded by project beeB—Foster for beekeeping bridges through innovative and participative training (ref. ERASMUS+ 2019-1-PT01-KA202-060782). The APC was funded by FCT—Foundation for Science and Technology, I.P., within the scope of the project Ref. UIDB/00681/2020.

Institutional Review Board Statement

This research was implemented taking care to ensure all ethical standards and followed the guidelines of the Declaration of Helsinki.

Informed Consent Statement

Informed consent was obtained from all subjects involved in the study.

Data Availability Statement

Data are available from the first author (R.P.F.G.) upon reasonable request.

Acknowledgments

This work was developed under project beeB—Foster for beekeeping bridges through innovative and participative training (ref. ERASMUS+ 2019-1-PT01-KA202-060782). The authors would also like to acknowledge support from the FCT—Foundation for Science and Technology, I.P., within the scope of the project Ref. UIDB/00681/2020, as well as the CERNAS Research Centre and the Polytechnic Institute of Viseu.

Conflicts of Interest

The authors declare no conflict of interest.

References

  1. Abro, Z.; Kassie, M.; Tanga, C.; Beesigamukama, D.; Diiro, G. Socio-Economic and Environmental Implications of Replacing Conventional Poultry Feed with Insect-Based Feed in Kenya. J. Clean. Prod. 2020, 265, 121871. [Google Scholar] [CrossRef]
  2. De Meio Reggiani, M.C.; Villar, L.B.; Vigier, H.P.; Brignole, N.B. An Evolutionary Approach for the Optimization of the Beekeeping Value Chain. Comput. Electron. Agric. 2022, 194, 106787. [Google Scholar] [CrossRef]
  3. Malkamäki, A.; Toppinen, A.; Kanninen, M. Impacts of Land Use and Land Use Changes on the Resilience of Beekeeping in Uruguay. For. Policy Econ. 2016, 70, 113–123. [Google Scholar] [CrossRef]
  4. Sillman, J.; Uusitalo, V.; Tapanen, T.; Salonen, A.; Soukka, R.; Kahiluoto, H. Contribution of Honeybees towards the Net Environmental Benefits of Food. Sci. Total Environ. 2021, 756, 143880. [Google Scholar] [CrossRef]
  5. Armstrong, A.; Brown, L.; Davies, G.; Whyatt, J.D.; Potts, S.G. Honeybee Pollination Benefits Could Inform Solar Park Business Cases, Planning Decisions and Environmental Sustainability Targets. Biol. Conserv. 2021, 263, 109332. [Google Scholar] [CrossRef]
  6. Fijen, T.P.M.; van Bodegraven, V.; Lucassen, F. Limited Honeybee Hive Placement Balances the Trade-off between Biodiversity Conservation and Crop Yield of Buckwheat Cultivation. Basic Appl. Ecol. 2022, 65, 28–38. [Google Scholar] [CrossRef]
  7. Guiné, R.P.F.; Mesquita, S.; Oliveira, J.; Coelho, C.; Costa, D.T.; Correia, P.; Correia, H.E.; Dahle, B.; Oddie, M.; Raimets, R.; et al. Characterization of Beekeepers and Their Activities in Seven European Countries. Agronomy 2021, 11, 2398. [Google Scholar] [CrossRef]
  8. El Agrebi, N.; Steinhauer, N.; Tosi, S.; Leinartz, L.; de Graaf, D.C.; Saegerman, C. Risk and Protective Indicators of Beekeeping Management Practices. Sci. Total Environ. 2021, 799, 149381. [Google Scholar] [CrossRef]
  9. Sperandio, G.; Simonetto, A.; Carnesecchi, E.; Costa, C.; Hatjina, F.; Tosi, S.; Gilioli, G. Beekeeping and Honey Bee Colony Health: A Review and Conceptualization of Beekeeping Management Practices Implemented in Europe. Sci. Total Environ. 2019, 696, 133795. [Google Scholar] [CrossRef]
  10. Abbott, L.F.; Nelson, S.B. Synaptic Plasticity: Taming the Beast. Nat. Neurosci. 2000, 3, 1178–1183. [Google Scholar] [CrossRef]
  11. Gryshchuk, V.; Weber, C.; Loo, C.K.; Wermter, S. Go Ahead and Do Not Forget: Modular Lifelong Learning from Event-Based Data. Neurocomputing 2022, 500, 1063–1074. [Google Scholar] [CrossRef]
  12. Parisi, G.I.; Kemker, R.; Part, J.L.; Kanan, C.; Wermter, S. Continual Lifelong Learning with Neural Networks: A Review. Neural Netw. 2019, 113, 54–71. [Google Scholar] [CrossRef] [PubMed]
  13. Baghel, M.S.; Singh, B.; Dhuriya, Y.K.; Shukla, R.K.; Patro, N.; Khanna, V.K.; Patro, I.K.; Thakur, M.K. Postnatal Exposure to Poly (I:C) Impairs Learning and Memory through Changes in Synaptic Plasticity Gene Expression in Developing Rat Brain. Neurobiol. Learn. Mem. 2018, 155, 379–389. [Google Scholar] [CrossRef] [PubMed]
  14. Goto, A. Synaptic Plasticity during Systems Memory Consolidation. Neurosci. Res. 2022, 183, 1–6. [Google Scholar] [CrossRef]
  15. Evans, K.; Kersh, N. Lifelong Learning beyond Initial Schooling. In International Encyclopedia of Education, 4th ed.; Tierney, R.J., Rizvi, F., Ercikan, K., Eds.; Elsevier: Oxford, UK, 2023; pp. 520–529. ISBN 978-0-12-818629-9. [Google Scholar]
  16. Irfan, M.; Jiangbin, Z.; Iqbal, M.; Masood, Z.; Arif, M.H.; Hassan, S.R. ul Brain Inspired Lifelong Learning Model Based on Neural Based Learning Classifier System for Underwater Data Classification. Expert Syst. Appl. 2021, 186, 115798. [Google Scholar] [CrossRef]
  17. Colosimo, A.L.; Badia, G. Diaries of Lifelong Learners: Information Seeking Behaviors of Older Adults in Peer-Learning Study Groups at an Academic Institution. Libr. Inf. Sci. Res. 2021, 43, 101102. [Google Scholar] [CrossRef]
  18. Huang, K.; Ma, X.; Song, R.; Rong, X.; Li, Y. Autonomous Cognition Development with Lifelong Learning: A Self-Organizing and Reflecting Cognitive Network. Neurocomputing 2021, 421, 66–83. [Google Scholar] [CrossRef]
  19. Ekúndayò, O.T.; Tuluri, F. Learner Management Systems and Environments, Implications for Pedagogy and Applications to Resource Poor Environments. In E-Learning Standards and Interoperability; IGI Global: Hershey, PA, USA, 2011; Chapter 25; pp. 499–525. ISBN 9781616927899. [Google Scholar]
  20. Segret, J.A.L.; García, M.C. The Management of the Human Resources and the Quality of the Services. In Encyclopedia of Human Resources Information Systems: Challenges in e-HRM; IGI Global: Hershey, PA, USA, 2009; Volume 2, pp. 632–639. [Google Scholar]
  21. Bhavsar-Burke, I.; Dilly, C.K.; Oxentenko, A.S. How to Promote Professional Identity Development and Support Fellows-In-Training Through Teaching, Coaching, Mentorship, and Sponsorship. Clin. Gastroenterol. Hepatol. 2022, 20, 2166–2169. [Google Scholar] [CrossRef]
  22. Garzón-Artacho, E.; Sola-Martínez, T.; Romero-Rodríguez, J.-M.; Gómez-García, G. Teachers’ Perceptions of Digital Competence at the Lifelong Learning Stage. Heliyon 2021, 7, e07513. [Google Scholar] [CrossRef]
  23. Fischer, G.; Lundin, J.; Lindberg, O.J. The Challenge for the Digital Age: Making Learning a Part of Life. Int. J. Inf. Learn. Technol. 2022, 40, 1–16. [Google Scholar] [CrossRef]
  24. Guiné, R.P.F.; Costa, D.V.T.A.; Correia, P.M.R.; Costa, C.A.; Correia, H.E.; Castro, M.; Guerra, L.T.; Seeds, C.; Coll, C.; Radics, L.; et al. Designing Training in Organic Farming on a Multinational Basis. Int. J. Inf. Learn. Technol. 2016, 33, 99–114. [Google Scholar] [CrossRef]
  25. Guiné, R.; Costa, D.; Correia, P.; Costa, C.; Correia, H.; Castro, M.; Guerra, L.; Seeds, C.; Coll, C.; Radics, L.; et al. Professional Training in Organic Food Production: A Cross-Country Experience. Int. J. Inf. Learn. Technol. 2017, 34, 259–273. [Google Scholar] [CrossRef]
  26. Segbenya, M.; Bervell, B.; Minadzi, V.M.; Somuah, B.A. Modelling the Perspectives of Distance Education Students towards Online Learning during COVID-19 Pandemic. Smart Learn. Environ. 2022, 9, 13. [Google Scholar] [CrossRef]
  27. Segbenya, M.; Anokye, F.A. Challenges and Coping Strategies among Distance Education Learners: Implication for Human Resources Managers. Curr. Psychol. 2022, 29, 1–15. [Google Scholar] [CrossRef] [PubMed]
  28. Yorkovsky, Y.; Levenberg, I. Distance Learning in Science and Mathematics—Advantages and Disadvantages Based on Pre-Service Teachers’ Experience. Teach. Teach. Educ. 2022, 120, 103883. [Google Scholar] [CrossRef]
  29. Jahnke, I. Quality of Digital Learning Experiences—Effective, Efficient, and Appealing Designs? Int. J. Inf. Learn. Technol. 2022, 40, 17–30. [Google Scholar] [CrossRef]
  30. Farida, I.; Setiawan, D. Business Strategies and Competitive Advantage: The Role of Performance and Innovation. J. Open Innov. Technol. Mark. Complex. 2022, 8, 163. [Google Scholar] [CrossRef]
  31. Lee, K.; Choi, H.; Cho, Y.H. Becoming a Competent Self: A Developmental Process of Adult Distance Learning. Internet High. Educ. 2019, 41, 25–33. [Google Scholar] [CrossRef]
  32. Mahdavinejad, M.; Ghasempourabadi, M.; Ghaedi, H.; Nikhoosh, N. Formal Architectural Education and Training Professional Technicians (Case Study: Iran). Procedia Soc. Behav. Sci. 2012, 51, 454–458. [Google Scholar] [CrossRef]
  33. Shen, C.-C.; Yeh, C.-C.; Lin, C.-N. Using the Perspective of Business Information Technology Technicians to Explore How Information Technology Affects Business Competitive Advantage. Technol. Forecast. Soc. Change 2022, 184, 121973. [Google Scholar] [CrossRef]
  34. Adams, E.C. How to Become a Beekeeper: Learning and Skill in Managing Honeybees. Cult. Geogr. 2018, 25, 31–47. [Google Scholar] [CrossRef]
  35. Gray, A.; Adjlane, N.; Arab, A.; Ballis, A.; Brusbardis, V.; Bugeja Douglas, A.; Cadahía, L.; Charrière, J.-D.; Chlebo, R.; Coffey, M.F.; et al. Honey Bee Colony Loss Rates in 37 Countries Using the COLOSS Survey for Winter 2019–2020: The Combined Effects of Operation Size, Migration and Queen Replacement. J. Apic. Res. 2022, 62, 204–210. [Google Scholar] [CrossRef]
  36. De Carolis, A.; Newmark, A.J.; Kim, J.; Cazier, J.; Hassler, E.; Pietropaoli, M.; Robinette, C.; Formato, G.; Song, J. Results of an International Survey for Risk Assessment of Honey Bee Health Concerning Varroa Management. Appl. Sci. 2023, 13, 62. [Google Scholar] [CrossRef]
  37. Jacques, A.; Laurent, M.; Consortium, E.; Ribière-Chabert, M.; Saussac, M.; Bougeard, S.; Budge, G.E.; Hendrikx, P.; Chauzat, M.-P. A Pan-European Epidemiological Study Reveals Honey Bee Colony Survival Depends on Beekeeper Education and Disease Control. PLoS ONE 2017, 12, e0172591. [Google Scholar] [CrossRef] [PubMed]
  38. Aksoy, A.; Demir, N.; Bilgiç, A. A Study on Identifying the Effectiveness of the Beekeeping Grants Provided by IPARD Program: Examples of Erzurum, Kars and Agri Provinces. Custos E @Gronegócio Line 2018, 14, 269–283. [Google Scholar]
  39. Duah, H.K.; Segbefia, A.Y.; Adjaloo, M.K.; Fokuo, D. Income Sustainability and Poverty Reduction among Beekeeping Value Chain Actors in the Berekum Municipality, Ghana. Int. J. Dev. Sustain. 2017, 6, 667–684. [Google Scholar]
  40. Schouten, C.N.; Caldeira, J. Improving the Effectiveness of Beekeeping Training: A Case Study of Beekeeping Instructors in Fiji. Bee World 2021, 98, 57–62. [Google Scholar] [CrossRef]
  41. Momoh, J. Development of E-Learning Platform for Beekeepers. SEEM Res. Dev. J. 2013, 2, 63–72. [Google Scholar]
  42. Gupta, S.B.; Gupta, M. Technology and E-Learning in Higher Education. Int. J. Adv. Sci. Technol. 2020, 29, 1320–1325. [Google Scholar]
  43. Schouten, C.N.; Lloyd, D.J. Considerations and Factors Influencing the Success of Beekeeping Programs in Developing Countries. Bee World 2019, 96, 75–80. [Google Scholar] [CrossRef]
  44. Vapa-Tankosić, J.; Miler-Jerković, V.; Jeremić, D.; Stanojević, S.; Radović, G. Investment in Research and Development and New Technological Adoption for the Sustainable Beekeeping Sector. Sustainability 2020, 12, 5825. [Google Scholar] [CrossRef]
  45. Seifollahi, N. Investigating the Impact of knowledge Management Dimensions on Value Chain in Beekeeping Industry (Case Study: Ardebil Province). Iran. J. Agric. Econ. Dev. Res. 2018, 49, 797–804. [Google Scholar] [CrossRef]
  46. Čavlin, M.; Prdić, N.; Ignjatijević, S.; Vapa Tankosić, J.; Lekić, N.; Kostić, S. Research on the Determination of the Factors Affecting Business Performance in Beekeeping Production. Agriculture 2023, 13, 686. [Google Scholar] [CrossRef]
  47. Uchiyama, Y.; Matsuoka, H.; Kohsaka, R. Apiculture Knowledge Transmission in a Changing World: Can Family-Owned Knowledge Be Opened? J. Ethn. Foods 2017, 4, 262–267. [Google Scholar] [CrossRef]
  48. Maderson, S. There’s More Than One Way To Know A Bee: Beekeepers’ Environmental Knowledge, and Its Potential Role in Governing for Sustainability. Geoforum 2023, 139, 103690. [Google Scholar] [CrossRef]
Figure 1. Geographical location of the countries included in the study and the corresponding number of participants.
Sustainability 15 08953 g001
Figure 2. Sociodemographic characterization of the participants.
Sustainability 15 08953 g002
Figure 3. Country frequencies for access to internet in the apiaries (Chi-square test (level of significance p < 0.05); p = 0.135).
Sustainability 15 08953 g003
Figure 4. Level of importance of the sources of information.
Sustainability 15 08953 g004
Figure 5. Level of interest in training subjects in beekeeping.
Sustainability 15 08953 g005
Figure 6. Level of interest according to the type of training activity.
Sustainability 15 08953 g006
Figure 7. Rating the usefulness of learning methodologies, supports, and assessment formats.
Sustainability 15 08953 g007
Table 1. Group differences for frequency of mobile devices utilization.
VariableGroupPercentage and Significance
Frequency of Utilization of Mobile Devices for
Beekeeping Activities
Daily1-2x/Week1-2x/MonthVery
Sporadically
Never
CountryPortugal37.227.918.67.09.3
Estonia10.813.55.456.813.5
Norway10.025.720.034.310.0
Spain50.013.98.327.80.0
Italy62.56.30.012.518.8
Croatia61.73.38.323.33.3
Finland58.325.08.38.30.0
Sig. 1<0.001
Age18–30 y50.020.84.225.00.0
31–59 y37.817.010.627.76.9
60+ y20.414.324.528.612.2
Sig. 10.040
SexFemale25.015.612.531.315.6
Male38.917.212.326.15.4
Sig. 20.054
EducationSecondary40.014.39.528.67.6
University32.918.013.028.08.1
Sig. 20.712
IncomeLow52.18.55.626.87.0
Medium35.617.312.527.96.7
High15.427.718.532.36.2
Sig. 10.001
1 Chi-square test (level of significance p < 0.05). 2 Fisher’s exact test (level of significance p < 0.05).
Table 2. Group differences for motivations to use mobile devices.
VariableGroupPercentage and Significance
Take PicturesMake VideosDo ResearchUse AppsBrowse Specialized Platforms
NoYesNoYesNoYesNoYesNoYes
CountryPortugal36.163.975.025.022.277.863.936.158.341.7
Estonia0.0100.00.0100.00.0100.00.0100.00.0100.0
Norway0.0100.06.393.82.897.28.391.710.090.0
Spain35.364.762.937.131.468.671.428.645.754.3
Italy0.0100.023.176.923.176.923.176.946.253.8
Croatia22.477.655.244.851.748.377.622.463.836.2
Finland0.0100.00.0100.00.0100.00.0100.00.0100.0
Sig. 1<0.001<0.001<0.001<0.0010.014
Age18–30 y12.587.537.562.518.281.857.942.168.431.6
31–59 y17.882.245.055.024.675.459.540.549.150.9
60+ y15.684.460.040.040.060.065.035.050.050.0
Sig. 10.7920.3130.1460.8800.294
SexFemale10.989.135.164.924.375.751.948.161.538.5
Male18.281.848.651.426.173.961.438.650.849.2
Sig. 20.2370.1941.0000.3940.390
EducationSecondary25.974.159.041.030.969.168.931.556.543.5
University9.290.835.065.024.175.951.848.246.353.7
Sig. 20.0020.0020.3260.0360.254
IncomeLow16.183.952.547.540.060.072.727.367.332.7
Medium22.777.347.552.526.973.155.144.945.554.5
High4.195.920.879.28.391.738.961.637.562.5
Sig. 10.0170.0270.0030.0210.023
1 Chi-square test (level of significance p < 0.05). 2 Fisher’s exact test (level of significance p < 0.05).
Table 3. Group differences for the level of importance of the sources of information.
Percentage and Significance
VariableGroupSources of Information
FamilyOther
Beekeepers
Professional Training/CoursesBooksSeminarsInternet
CountryPortugal32.0064.5065.8355.5021.5043.95
Estonia35.05134.56115.50112.5346.3688.66
Norway46.30124.5397.77123.9452.1797.68
Spain32.0064.5063.0055.5021.5040.50
Italy50.10101.5897.5090.0045.7973.25
Croatia32.0064.5063.0055.5021.5040.50
Finland70.00113.1363.00139.0052.1793.33
Sig. 1<0.001<0.001<0.001<0.001<0.001<0.001
Age18–30 y29.5068.7799.1074.0028.0052.56
31–59 y34.5889.2478.7881.6127.1153.70
60+ y29.50101.5480.9583.2841.7275.44
Sig. 10.3010.0220.2190.7190.0170.008
SexFemale39.79102.5890.82104.9729.3660.42
Male32.7486.1178.7475.7230.1557.36
Sig. 20.0300.0190.058<0.0010.8980.628
EducationSecondary32.8679.0979.5069.0627.3051.77
University36.0496.5781.8089.1533.5761.24
Sig. 20.2600.0060.6980.0020.1010.072
IncomeLow29.1166.9368.9754.6127.8342.39
Medium25.5974.4167.7071.6127.6446.85
High35.17101.1983.3591.5035.8379.06
Sig. 10.420<0.0010.042<0.0010.245<0.001
1 Kruskal–Wallis test (level of significance p < 0.05). 2 U-Mann–Whitney test (level of significance p < 0.05).
Table 4. Group differences for participation in training activities.
VariableGroupPast Experience
(Percentage and Significance)
Already
Participated in
Training Activities
Role:
Trainee
Role:
Trainer/Coordinator
NoYesNoYesNoYes
CountryPortugal8.391.777.322.70.0100.0
Estonia16.783.30.0100.00.0100.0
Norway6.893.211.888.263.636.4
Spain32.068.048.151.982.717.3
Italy31.368.831.368.893.86.3
Croatia41.758.38.691.477.122.9
Finland20.080.058.341.78.391.7
Sig. 1<0.001<0.001<0.001
Age18–30 y48.351.750.050.065.035.0
31–59 y19.380.728.471.657.742.3
60+ y16.483.630.669.438.161.9
Sig. 10.0010.1180.047
SexFemale22.577.520.779.365.334.7
Male20.979.134.465.651.948.1
Sig. 20.7430.0540.107
EducationSecondary23.576.540.659.453.746.3
University20.479.623.876.255.244.8
Sig. 20.5640.0050.893
IncomeLow28.971.139.160.956.943.1
Medium23.176.937.462.651.748.3
High7.093.013.686.458.741.3
Sig. 10.0030.0010.667
1 Chi-square test (level of significance p < 0.05). 2 Fisher’s exact test (level of significance p < 0.05).
Table 5. Group differences for the level of interest in training subjects in beekeeping.
VariableGroupMean Rank and Significance
Bee BiologyBeehive ProductionApiary Health and Pest
Control
Organic Production ModeMeliferous FloraApiary InstallationColony Management throughout the YearProduction of Bee Products Other Than HoneyFood ManagementReproductive Management/
Queens Production
Hygiene, Health and Safety at Work in BeekeepingLegislationBusiness Skills
CountryPortugal142.62201.49176.81164.65173.38166.15167.33158.71181.07157.84174.40174.43165.68
Estonia119.75122.25158.72136.78114.98404.43127.96126.34112.93138.23136.30129.76155.47
Norway147.42114.97146.5496.05151.62136.44156.68118.71154.90150.38132.01157.47128.50
Spain122.00142.68133.63151.81130.69146.75128.02130.20138.58142.83122.12112.68118.60
Italy182.22204.59155.94229.50171.91167.25138.03141.84108.06114.53116.41142.81174.28
Croatia145.83130.09149.18180.03149.77157.30153.66166.38165.46145.87167.06153.58165.15
Finland116.04177.08131.23126.35111.73116.73143.69145.38102.27154.12147.65117.08169.77
Sig. 10.082<0.0010.180<0.0010.0080.0050.1580.013<0.0010.6420.0060.0070.010
Age18–30 y145.67165.18146.47162.80148.75166.25128.03143.74148.43127.05130.29128.11154.39
31–59 y137.85141.01145.00142.18141.49138.95144.30137.69142.00140.73140.53143.00145.89
60+ y109.77117.73141.62123.13129.81111.45135.85113.59133.47138.87137.95137.38123.24
Sig. 10.0350.0280.9470.0830.5130.0070.4900.0860.6800.6780.8020.6200.132
SexFemale156.50133.16153.51160.45160.28153.42160.77133.82144.13153.51154.93162.47146.06
Male129.40143.45145.55137.06137.01134.58138.59135.40143.96137.54136.64136.21143.34
Sig. 20.0120.3550.4480.0380.0350.0890.0400.8810.9880.1390.0960.0180.807
EducationSecondary129.48130.25143.62142.91139.25135.26132.32125.71148.87134.94146.08137.08143.11
University138.32146.06148.32141.43142.90139.74149.81139.46139.42144.62136.16145.03143.74
Sig. 20.3530.1040.6110.8790.7040.6400.0650.1410.3330.3140.3000.4130.949
IncomeLow123.26131.60132.91154.21138.94138.50131.52124.40139.96128.19136.56122.52134.79
Medium115.33132.30130.28133.39118.64119.22122.75121.69119.63124.00125.44122.12131.66
High120.38105.92128.2484.38123.94113.84130.84107.92127.28125.27108.75135.8211.40
Sig. 10.7350.0350.917<0.0010.1530.0870.6330.2830.1690.9250.0580.3970.100
1 Kruskal–Wallis test (level of significance p < 0.05). 2 U-Mann–Whitney test (level of significance p < 0.05).
Table 6. Group differences for preferences in training mode.
VariableGroupMean Ranks and Significance
In PersonAt DistanceMixedIn Workplace/
Internship
CountryPortugal153.78103.4285.88136.54
Estonia122.89106.65127.38132.71
Norway103.08122.85114.98123.72
Spain117.2586.65122.5584.10
Italy123.91167.44152.75116.94
Croatia135.51129.72128.83110.51
Finland102.82130.41118.0093.00
Sig. 10.0070.0020.0170.015
Age18–30 y129.18116.92107.2495.39
31–59 y116.75114.12113.59112.57
60+ y115.50103.73113.31122.63
Sig. 10.6990.6150.9150.276
SexFemale130.66138.78131.79123.75
Male117.26105.89110.01111.42
Sig. 20.174<0.0010.0250.198
EducationSecondary120.1096.55108.86111.66
University119.13123.91118.18115.45
Sig. 20.9100.0020.2790.656
IncomeLow109.27100.18106.38105.75
Medium116.1899.11106.26104.03
High99.87115.20101.59103.97
Sig. 10.2430.2170.8710.981
1 Kruskal–Wallis test (p < 0.05). 2 U-Mann–Whitney test (p < 0.05).
Table 7. Group differences for the level of usefulness of different learning methodologies.
VariableGroupMean Rank and Significance
Group WorkGames/Challenges
(Gamification)
InternshipsMonitoring of Pilot FarmsField VisitsBased in ProjectsLecturesForum/ChatShort CoursesLong Courses
CountryPortugal130.34149.65140.58153.01129.26161.87158.47120.76133.19140.14
Estonia169.98135.42107.61136.18124.58107.71123.86146.88109.7991.57
Norway135.88160.39121.42133.21113.16123.02106.43128.16111.80125.31
Spain139.41159.95154.04126.13141.22164.62147.15178.30122.88136.64
Italy40.94193.38105.2587.6683.72137.8499.2546.41166.1969.33
Croatia137.7584.08168.13150.50171.23151.19166.02135.58156.46135.92
Finland150.57153.87115.33154.27131.83161.20127.80104.36142.63155.18
Sig. 1<0.001<0.001<0.0010.064<0.0010.001<0.00981<0.0010.005<0.001
Age18–30 y120.66132.81119.14132.34124.75162.84141.98136.36150.34104.17
31–59 y137.80136.49136.15133.97136.51134.28135.69132.92132.04122.34
60+ y124.09138.62121.00137.57107.65135.35117.56115.1798.05131.21
Sig. 10.3350.9470.2850.9410.0480.1400.2490.2810.0020.257
SexFemale149.67152.89149.19146.60148.92152.69142.67142.88154.18133.63
Male132.20136.37130.57134.55127.46137.34133.81129.86122.71122.40
Sig. 20.1040.1230.0860.2600.0460.1430.4070.2200.0030.290
EducationSecondary136.58118.80133.36133.08122.88136.05136.48131.25127.01124.10
University131.61148.03130.39134.56132.71138.37130.00128.44126.20121.48
Sig. 20.5990.0020.7520.8740.2890.7990.4880.7620.9290.770
IncomeLow113.55115.83122.95118.97122.66132.21128.74121.75137.60113.84
Medium129.04117.24119.49120.21122.77126.79129.62121.24117.68112.14
High111.98138.49108.59118.89101.54109.1395.28106.3392.63105.77
Sig. 10.1770.0820.4300.9890.0890.0950.0030.299<0.0010.752
1 Kruskal–Wallis test (level of significance p < 0.05). 2 U-Mann–Whitney test (level of significance p < 0.05).
Table 8. Group differences for the level of usefulness of different learning supports and assessment formats.
VariableGroupMean Rank and Significance
Learning SupportsAssessment Formats
e-Books
(Electronic Books)
Interactive PlatformsBooks/
Paper Manuals
Technical LeafletsEducational GamesVideosSpecific Programs or AppsOnline Response TestsTasks/ReportsPaper Tests/
Questionnaires
Practical ExercisesOral Tests
CountryPortugal122.66139.03115.88159.03122.31129.42131.84120.58112.42140.28138.47111.08
Estonia121.53109.62151.7758.3894.86154.5393.56135.66135.68130.39170.34142.22
Norway119.61124.98154.83135.92106.82130.34115.81158.88132.85146.41124.52125.88
Spain127.04150.55136.20138.4276.26151.26137.11123.50145.96109.88162.50126.17
Italy159.09143.84132.88215.78182.0689.69120.81131.16115.5676.0085.2268.19
Croatia157.51153.60136.07144.71133.68162.22148.22132.27135.17144.81134.37142.80
Finland128.00125.35153.19129.08131.46154.08115.62146.04117.21158.00133.64111.77
Sig. 10.0640.0830.233<0.001<0.0010.0180.0130.1970.4530.0050.0010.006
Age18–30 y116.69128.23131.86138.37136.45125.79122.73107.83115.48125.61143.19142.30
31–59 y136.94136.97139.61134.66116.11142.78126.36139.26135.27133.99139.44121.13
60+ y105.81116.65127.50112.6795.52126.63108.31118.92103.27113.29118.76112.95
Sig. 10.0200.2380.5470.1540.0370.2550.3260.0480.0160.2150.1870.204
SexFemale135.95154.95162.52137.16140.69149.58135.83150.54141.44134.95150.57124.12
Male130.81130.61134.26133.67108.97138.93122.84131.82127.54133.01135.85125.98
Sig. 20.6350.0290.0090.7460.0010.3200.2110.0810.1820.8540.1650.855
EducationSecondary115.90124.12133.86135.57115.94132.64118.72116.40122.04129.86137.85125.32
University136.94138.38139.73129.85113.70142.21126.26144.83131.60130.90134.88119.87
Sig. 20.0240.1310.5300.5430.7980.3040.3780.0020.2980.9110.7500.544
IncomeLow115.60122.94122.94131.51123.13127.14116.16105.50109.22122.65124.17111.72
Medium123.60122.81120.29114.22101.93127.35110.26123.60116.79112.34127.09116.54
High107.32108.10129.31114.0989.49115.22112.34130.85118.11120.65113.1796.90
Sig. 10.2970.3260.6860.1990.0060.4600.8380.0730.6830.5420.4000.156
1 Kruskal–Wallis test (level of significance p < 0.05). 2 U-Mann–Whitney test (level of significance p < 0.05).
Disclaimer/Publisher’s Note: The statements, opinions and data contained in all publications are solely those of the individual author(s) and contributor(s) and not of MDPI and/or the editor(s). MDPI and/or the editor(s) disclaim responsibility for any injury to people or property resulting from any ideas, methods, instructions or products referred to in the content.

