Article

Life Cycle Assessment of a Domestic Wastewater Treatment Plant Simulated with Alternative Operational Designs

Sanitary Engineering Department, Faculty of Engineering, Alexandria University, Alexandria 21544, Egypt
*
Author to whom correspondence should be addressed.
Sustainability 2023, 15(11), 9033; https://doi.org/10.3390/su15119033
Submission received: 15 March 2023 / Revised: 27 May 2023 / Accepted: 30 May 2023 / Published: 2 June 2023
(This article belongs to the Special Issue Industrial Wastewater Treatment and Recycling)

Abstract

:
Life cycle assessment (LCA) is a powerful tool to evaluate the environmental impacts of domestic wastewater treatment plant (WWTP) operations. It involves a thorough evaluation of the main characteristics or components of the environment, human health, and resources. However, the literature to date is still lacking analysis on the widely varied designs and operational conditions of full-scale WWTPs. The aim here was to integrate analyses such as LCA, greenhouse gas (GHG) emissions, and energy consumption, when considering the environmental impacts of a full-scale WWTP, which can provide practical outputs to aid decision-making on optimum designs and operational conditions. The Russtmiya domestic WWTP, located in Iraq, was considered as the case study. Three operational alternatives were proposed as solutions to improve the WWTP’s performance, as follows: (1) conventional activated sludge with sand filter (CAS), (2) conventional activated sludge with sand filter and nitrogen removal (CAS-N), and (3) membrane bioreactor (MBR). The operation of such alternatives was investigated through modeling and simulation using GPS-X 8.0.1 software. The energy consumption of each alternative was estimated via GPS-X, while the GHG emissions were estimated using three different methods according to the intergovernmental panel on climate change (IPCC), the United States Environmental Protection Agency (USEPA), and GPS-X software. The OpenLCA software (1.10.3) was used to measure all impact categories at both the midpoint and endpoint levels using various methods. As a conclusion, comparing the three proposed alternatives indicated that: (1) the MBR alternative provided the lowest energy consumption and moderate GHG emissions, and (2) the CAS alternative provided the best environmental performance, particularly in aspects such as ozone depletion, global warming, and climate change, where the lowest GHGs emission values had the major contribution.

1. Introduction

The treatment of domestic wastewater is one of the crucial issues facing Iraq’s environmental systems. Currently, not all Iraqis have access to services for wastewater treatment. Only ten out of eighteen governorates in Iraq are equipped with wastewater treatment facilities [1]. Wastewater treatment plants (WWTPs) are managed to mitigate environmental degradation by eliminating pollutants from wastewater before its discharge [2]. To a certain degree, it is possible for pollutants present in effluent to be discharged into the atmosphere, including emissions of greenhouse gases (GHGs) [3].
Before the construction of WWTPs according to a certain design and operation, studies such as life cycle assessment (LCA) are essential to make sure it will not hurt the environment. LCA examines environmental factors and quantifies the potential effects of WWTPs over the course of their entire lives in a variety of categories, including resource use, the impact on climate change, water pollution, waste production, etc. Although WWTPs induce direct positive environmental effects, they also have negative environmental impacts because they require much energy to run the wastewater infrastructure and treatment facilities [4]. Compliance with environmental regulatory requirements and technology costs should be considered [5], among other factors such as location, socioeconomic conditions, and regional and global environmental impacts. For this, LCA tools are frequently employed using a variety of software, including Semipro, OpenLCA, Gabi, Umberto, and others [6].
OpenLCA is a well-known and user-friendly software program that enables the user to consider all of the LCA stages [7,8]. This tool also has the benefit of giving users the option to work with various databases. Experts endorse OpenLCA because of its user friendliness and original database [9]. LCA can contribute to the optimization of operational parameters in WWTPs and meet the requirements outlined in ISO 14040, thereby providing acceptable access to the optimal decision [10]. The use of LCA ensures that all effects on the environment are examined and compared within the LCA framework of different types of WWTPs [11]. The LCA methodology enables the quantification of the effects of the entire system under study by considering a variety of GHG emissions, energy consumption, and material inputs and outputs throughout its life cycle [12,13,14]. Previous studies have established a series of methodologies to estimate the GHG emissions from WWTPs, such as those by the United States Environmental Protection Agency (USEPA), the intergovernmental panel on climate change (IPCC), and GPS-X software [15,16]. In addition, the ECAM tool software was used to evaluate the sustainability of WWTPs in terms of energy efficiency and GHG emissions [17]. The results indicated that a WWTP sustainability assessment should be implemented as a significant tool to assist through introducing low-energy, low-carbon management techniques as well as being useful for policy suggestions. A study considering a Swedish WWTP was used to develop dynamic models for GHG emissions, energy consumption, operational costs, and LCA [18,19], where the results showed how important LCA and plant-wide mechanistic models are for understanding how plants work and what effects they might have on the environment. Integrating LCA and WWTP dynamic models showed that optimization of WWTP operations can reduce their GHG emissions [20]. Another study showed that LCA can be used to compare the environmental effects of several types of WWTPs. This highlights the significance of including LCA in the design of a WWTP. Further, previous studies highlighted the impacts of WWTP GHG emissions, energy consumption, and carbon footprints on the environment via LCA [21,22,23,24,25,26,27,28].
However, to date, LCA studies on full-scale WWTP-related design/operational alternatives are still limited despite their significant impacts on decision-making regarding environmental conservation and moving toward the sustainable development goals (SDGs). Different designs of WWTPs based on many technical/economic/social factors exist, which can indeed affect the potential strategies to improve performance. For this purpose, analyzing existing WWTP designs and suitable alternatives for improvement, via simulation, would provide practical and accurate outputs for the decision-making stage. Thus, the goal of this study was to conduct an LCA using OpenLCA for a domestic WWTP (the Russtmiya WWTP, as a case study) by combining the environmental impacts of GHG emissions and energy consumption, using the tools from USEPA, IPCC, and GPS-X software. Simulated outputs from three proposed alternatives to improve the performance of a WWTP, using GPS-X software, were then assessed to emphasize the key role of such analyses when optimizing the operation/design of WWTPs.

2. Materials and Methods

2.1. The Case-Study WWTP

One of Iraq’s first wastewater treatment facilities is the Russtmiya WWTP, which serves almost a third of Baghdad’s population. According to earlier studies, however, the effectiveness of treating pollutants has deteriorated. Overflow and inadequate capacity are significant challenges at the wastewater treatment plant in Baghdad [29,30]. Due to the growth and increasing population density of Baghdad, it was necessary to construct an extension to the WWTP, officially known as the new Russtmiya WWTP [31]. The plant’s design capacity is 475,000 m3/d. A 407,000 square meter land area was created to contain three parallel processing units. The biological treatment at the Russtmiya WWTP depended on activated sludge [29]. The effluent characteristics of the wastewater to be treated at the Russtmiya WWTP and the Iraqi standard are shown in Table 1.

2.2. Examined Operational Alternatives

This study focused on the extension of the Russtmiya WWTP (namely the “new Russtmiya WWTP”) in Baghdad to evaluate the prospective LCA of the suggested treatment methods and assist the decision-makers in selecting the best method with the lowest environmental impact assessment. An empirical equation was used for the design sizing of the proposed alternatives, then the design and effluent quality were checked according to Iraqi standards using GPS-X 8.0.1 [32]. The emission of GHGs and energy consumption were estimated by GPS-X, and finally the LCA was evaluated using OpenLCA for each alternative. The proposed frameworks to achieve this objective were (1) activated sludge with slow sand filters (CAS), (2) activated sludge with nitrogen removal and sand filter (CAS-N), and (3) membrane bioreactor (MBR) [33], as also presented in Figure 1.

2.3. Estimation of GHG Emissions and Energy Consumption

Direct GHG emissions, such as carbon dioxide, methane, and nitrous oxide, are generated and released in sewers and WWTPs during the biological treatment of wastewater and sewage sludge [34]. There are numerous methods to estimate GHG emissions, and the following are the three methods used in this study. First, GPS-X was used for calculating direct N2O and CO2 emissions to determine the carbon footprint of three different types of WWTP. The ideal model for estimating greenhouse gases is Mantis 3, the method used in the program is according to scope 3 emissions, and the unit used was CO2eq [30]. Second, the standard method by the IPCC, established in 2006, was considered [35]. Third, the method provided by the USEPA was considered. Given that USEPA believes that carbon from bio-genic sources in aerated tanks may contribute to the greenhouse effect and that reducing carbon from sustainable sources may delay its emission cycle and even global warming, an adopted method from the IPCC protocol was considered to estimate CO2 emissions [36].
Likewise, the energy consumption of various activities employed in WWTPs, including aeration, mixing, and pumping, was estimated using the GPS-X software. An included tool was used to determine how much energy each process unit uses.

2.4. LCA Considerations and Software

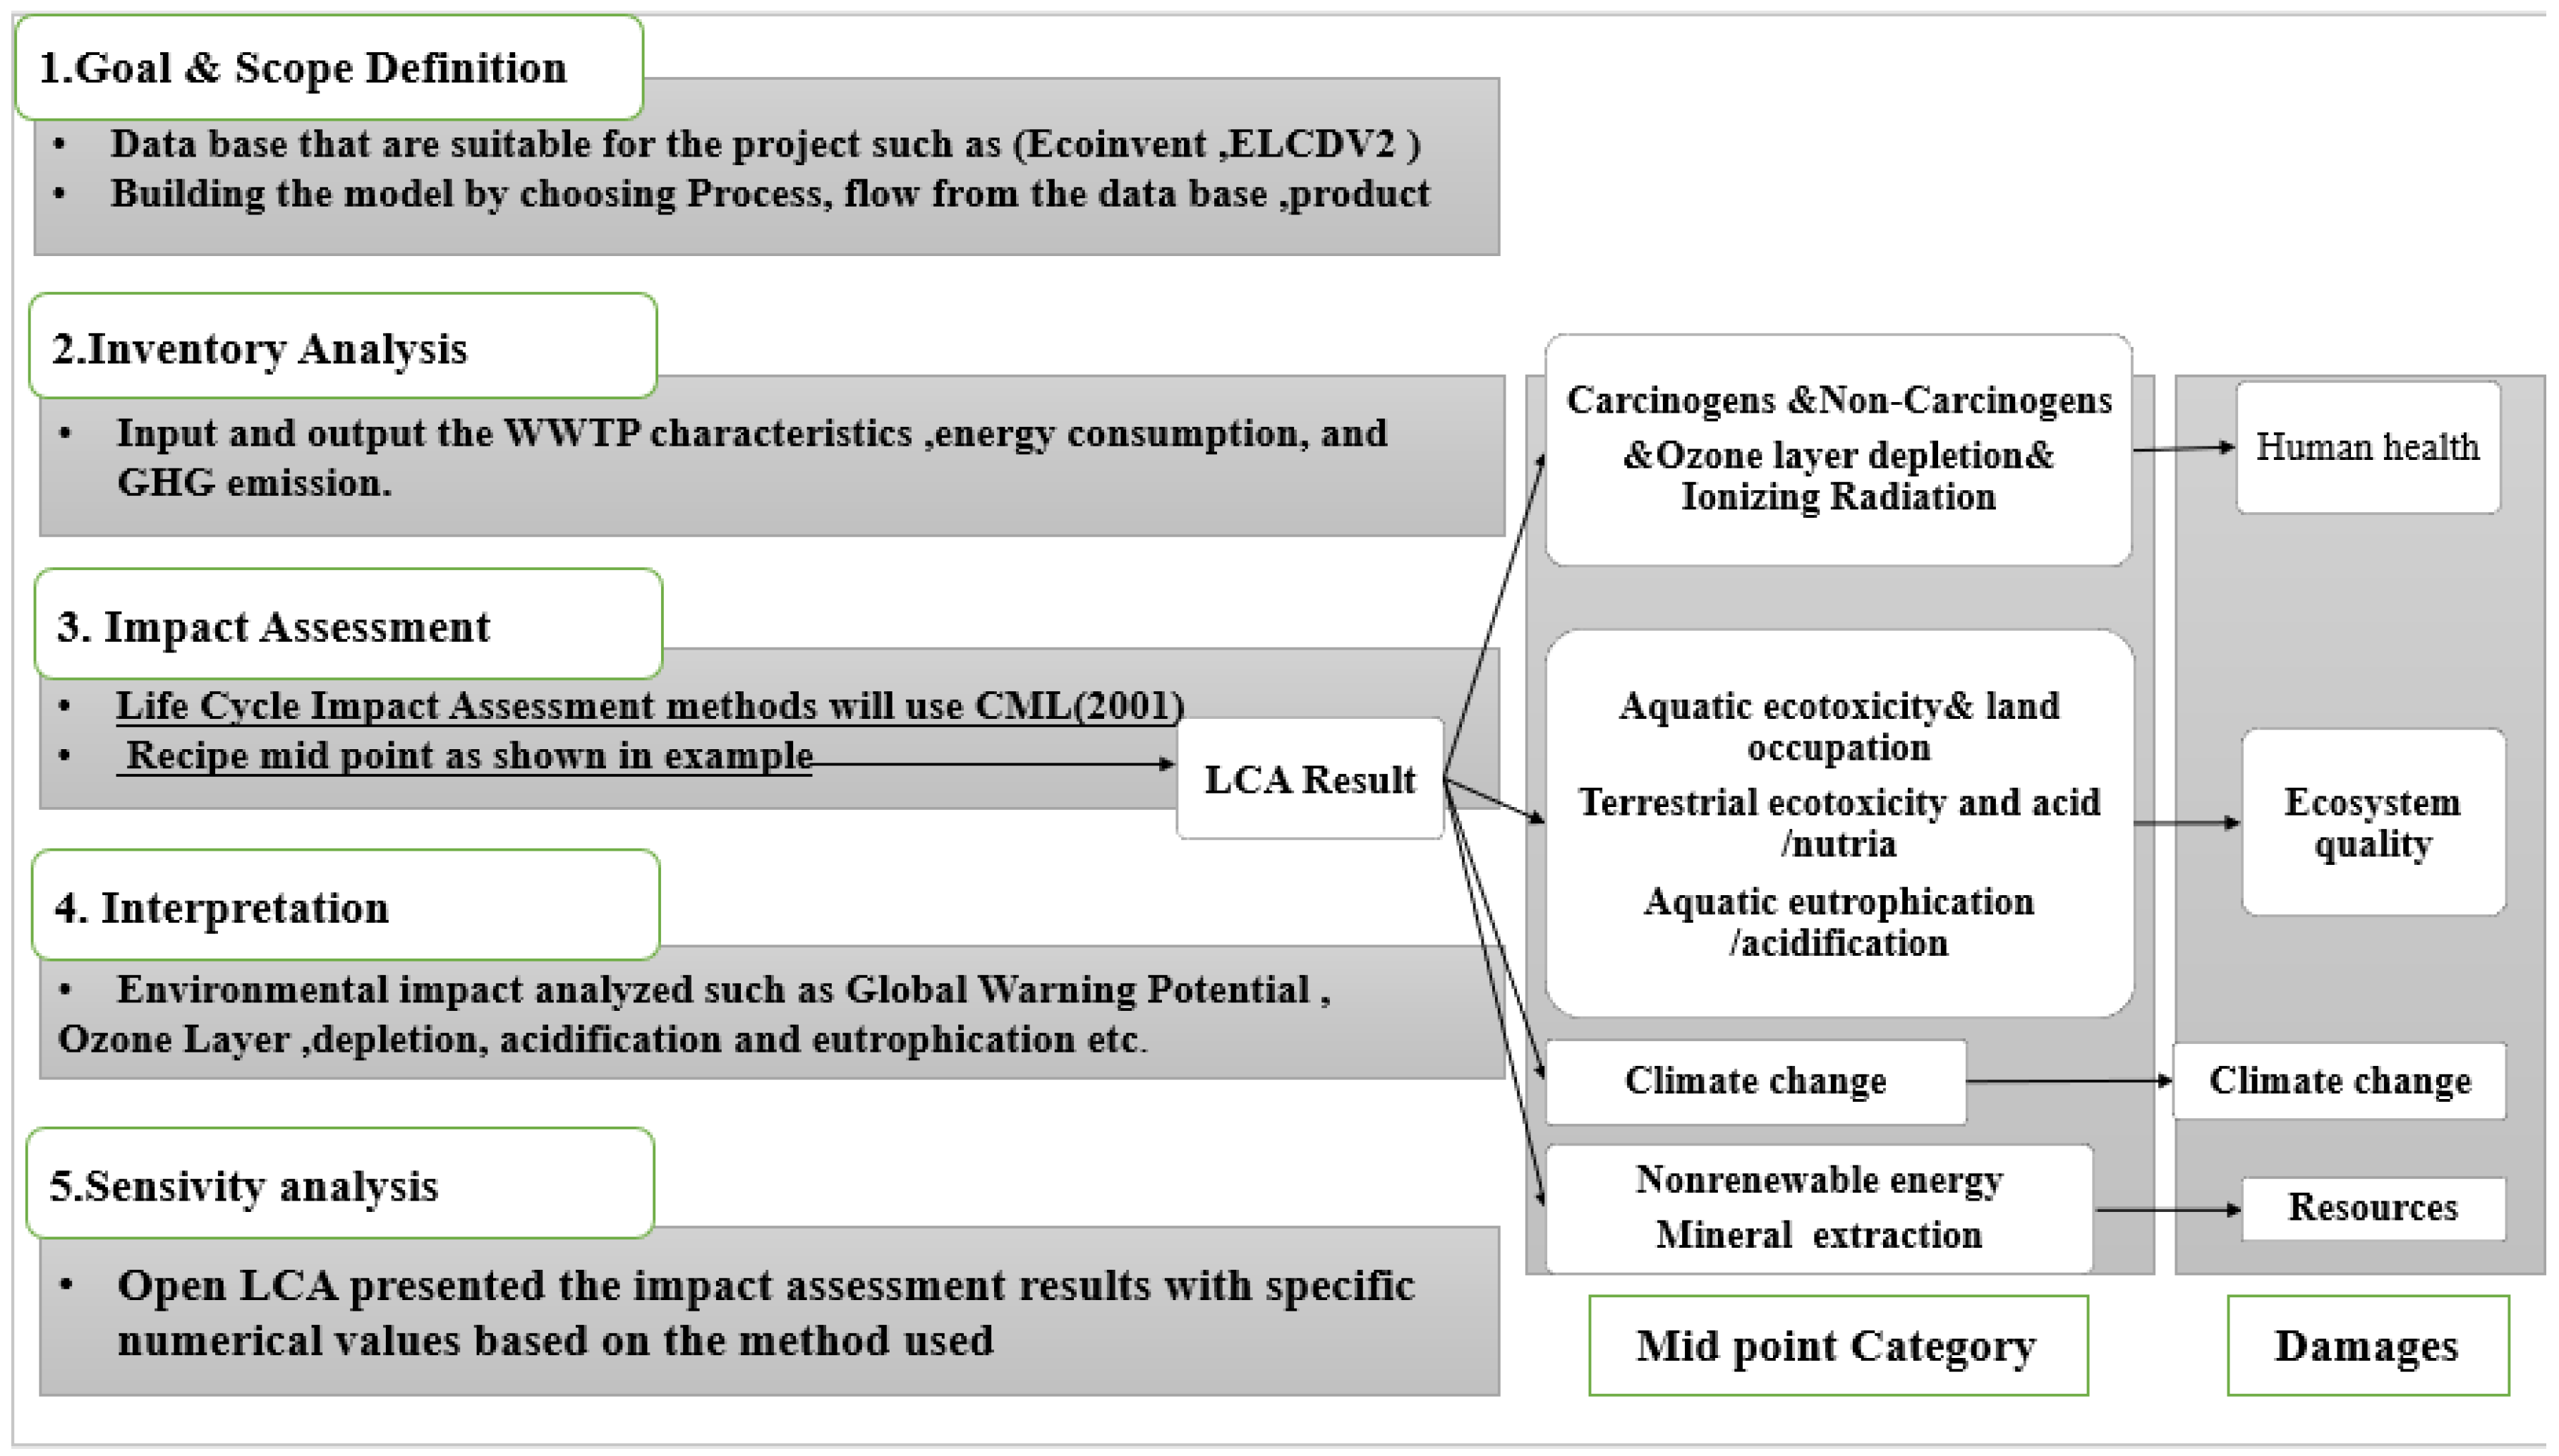
To evaluate how substantially the life cycle affects the way LCA results are translated into linked environmental effects and damage from a WWTP, an assessment of impacts and damage was created. The results of the LCA can be combined into an understandable, user-friendly unit using this practical tool, which is helpful for planners [19]. The OpenLCA program was used to investigate the LCA of the WWTP [37,38]. The program looked at the results of an OpenLCA application that used different methods to figure out the advantages and disadvantages of the Russtmiya WWTP. The open LCA program was used to analyze the LCA of the WWTP according to methods of LCA (HTP 100 ReCiPe, Global warming IMPACT 2002+, climate change GWP20 (ReCiPe), CML2001, Boulay et al 2011 (Human Health) [39], Pfister et al 2010 (ReCiPe) [40], and CMhuman Toxicity) [41]. The stages of the LCA analysis of the studied WWTP, the mid-point categories, and damages listed in the LCA results are presented in Figure 2.

3. Results and Discussion

The findings of the study were split into four categories. The three design options for the new Russtmiya WWTP extension are listed in the first section. Three approaches were used in the second portion of the computation of GHG emissions from the WWTP (IPCC, USEPA, and GPS-X). Third was the energy consumption of the WWTP during operation. In the last section, the OpenLCA program’s LCA of the WWTP evaluated each proposed alternative.

3.1. First Alternative: Conventional Activated Sludge with Sand Filter (CAS)

3.1.1. Result of the Preliminary Design of Russtmiya WWTP

The initial purpose of this work was to design a CAS utilizing guidelines. The parameters of wastewater that were used for the empirical design of the proposed alternative (CAS) were acquired from the WWTP that handles sewage for Baghdad, Iraq. The majority of the design requirements and equations were collected from main references in WWTP [42] for CAS. Designs for a certain guideline were developed by defining influent wastewater characteristics, specifying operating preferences (e.g., DO and MLSS concentrations in the reactors), and selecting and setting the effluent criteria. Reactor volumes, air blower capacity, and pumping capacity were the design outputs. Table 2 provides a summary of the CAS alternative’s architecture [43,44].

3.1.2. Estimation of GHG Emissions

Figure S1 below illustrates the outcomes of the three GHG estimation approaches. CO2 emissions differed by 143,227.5 t-CO2/m3 between GPS-X and the USEPA, 3606.4 t-CO2/m3 between the IPCC and the USEPA, and 9106.9 t-CO2/m3 between GPS-X and the IPCC. According to the results of the three methods for calculating GHG emissions (CO2, N2O), GPS-X calculated the greatest quantity. This is because the most recent edition of GPS-X calculates all sectors, including sludge treatment. In contrast to research done for the Alexandria WWTP using an older version of the program, the USEPA method gave the highest value in a previous evaluation [45].

3.1.3. Energy Consumption

GPS-X 8.0 estimates the energy consumption of processes such as aeration, mixing, and pumping. It is an extremely useful tool. During the operational phase of the WWTP, Figure 3 displays the schematic energy consumption of the alternate activated sludge with a sand filter. Each aeration tank uses 2314.54 kilowatt hours of electricity per day, on top of the 389.29- kilowatt hours of electricity per day used by the influent and the 201.6 kilowatt hours of electricity per day used by the digestor.
Regarding the percentage of energy required by each component of the WWTP during operation of one line of the WWTP, 81.7% of the energy consumed was used for the aeration tanks, 10.3% was used for mixing, and 5.6% was used for pumping.

3.1.4. LCA for the Alternative

The conclusions of the LCA analysis performed as part of the open LCA program utilizing diverse approaches are presented in Table S1. The table illustrates how the alternative CAS impacts a variety of categories, such as human toxicity, stratospheric ozone depletion, climate change, air odors, global warming, ionizing radiation, and aquatic eco-toxicity, with the least influence on ionizing radiation, ecosystem quality, abiotic resource depletion, and human health [46].

3.2. Second Alternative: Conventional Activated Sludge with Sand Filter and Nitrogen Removal (CAS-N)

3.2.1. Results of the Preliminary Design of Russtmiya WWTP

The primary objective of this study was to construct the proposed alternative to CAS-N using guidelines. The wastewater parameters used in the empirical design of the CAS-N were acquired from the WWTP that processes Baghdad, Iraq’s sewage. The majority of design requirements and equations were acquired according to Metcalf and Eddy (2003) [42]. In order to determine the designs for a specific guideline, influent wastewater parameters, operational preferences (e.g., DO and MLSS concentrations in the reactors), and effluent requirements were defined. Reactor volumes, air blower capacity, and pumping capacity were the design outputs, 3500 was the MLVSS used to design a complete-mix activated sludge operation with or without a denitrification system. The findings of the proposed alternative’s (CAS-N) preliminary design are presented in Table 3 below.

3.2.2. Estimation of GHG Emissions

Figure S2 displays three methods for estimating GHG in CAS-N. The GPS-X and USEPA methods disagreed by 176,165.8 t-CO2/m3, the IPCC and USEPA methods by 6322.1 t-CO2/m3, and the disparities due to N2O were 20,580.9 t-CO2/m3 for the GPS-X and USEPA methods and 12,657.1 t-CO2/m3 for the IPCC method. The IPCC method had the lowest value of all of the estimated options because it does not count carbon dioxide in its calculations.

3.2.3. Energy Consumption

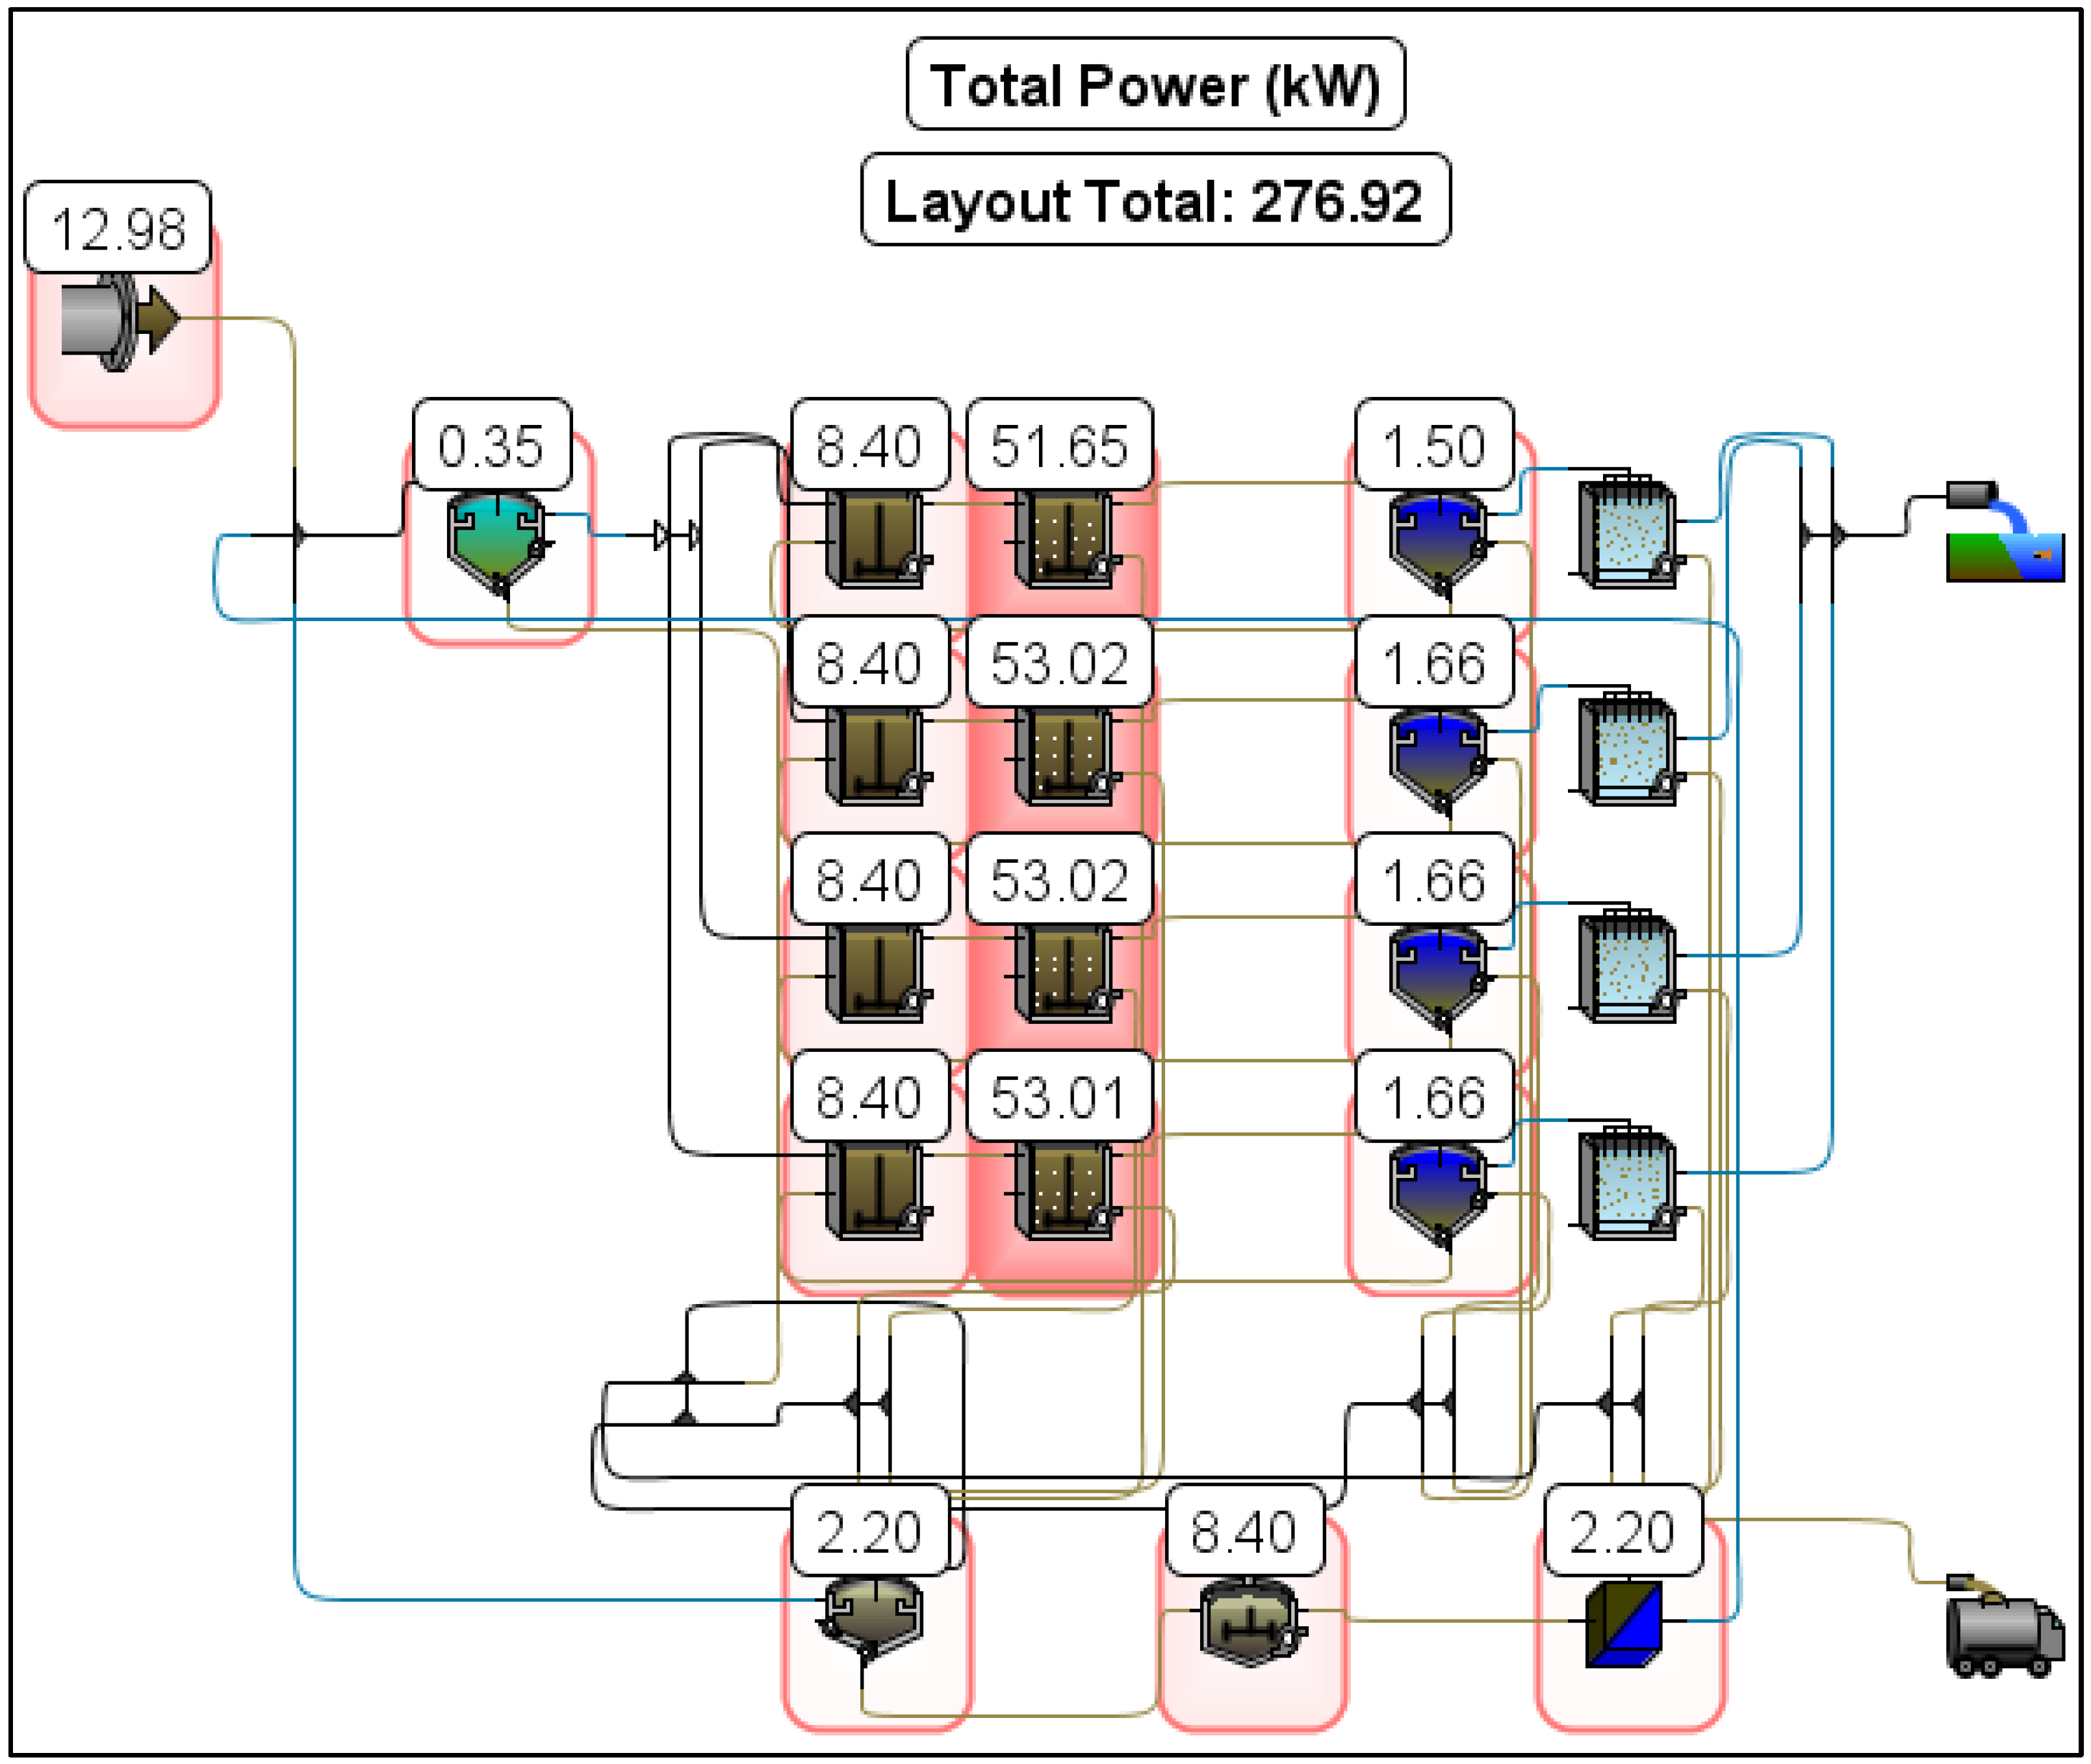
GPS-X 8.0 estimates the energy required for aeration, mixing, pumping, and other processes. Figure 4 depicts the alternative CAS-N schematic’s energy consumption during the WWTP’s operational period. Each nitrification tank’s daily energy consumption was 1239.35 kilowatt-hours. The influent then needed 301.43 kWh per day, while the denitrification tank and digester each used 201.9 kWh per day. Among the proportions of energy consumed by each component of the WWTP while it was operational, the energy required for aeration was 64.6%, mixing was 26.5%, and pumping, which used the least amount of energy, was at 5.7%, according to the configuration of one line of a WWTP and the pie chart below.

3.2.4. LCA for the Alternative

The effects of CAS-N on climate change, human toxicity, stratospheric ozone depletion, and other categories were depicted using various approaches based on the results of the LCA study. The OpenLCA program uses various methods of analysis to determine the environmental impact of suggested treatment methods, as shown in Table S2. Depletion of abiotic resources, ozone depletion, marine eutrophication, ecosystem quality, and human health have small effects. Climate change, global warming, airborne odors, aquatic eco-toxicity, and other causes, on the other hand, have major effects.

3.3. Third Alternative: Membrane Bioreactor (MBR)

3.3.1. Result of the Preliminary Design of Russtmiya WWTP

The primary objective of this study was to develop guidelines for the proposed alternative MBR. The characteristics of wastewater employed in the empirical design of the MBR were acquired from the WWTP in Baghdad, Iraq, which treats sewage. The majority of the design requirements and equations were acquired from WWTP-related sources (Park et al., 2015 for MBR). In order to determine the designs for a specific guideline, influent wastewater parameters, operational preferences (e.g., DO and MLSS concentrations in the reactors), and effluent requirements were defined. Reactor volumes, air blower capacity, and pumping capacity were the design outputs. Because the membrane was utilized as a filter in aeration tanks as opposed to gravity sedimentation tanks, the bioreactor was smaller than in CAS procedures. The MBR system was designed using an MLVSS of 8000 mg/L. The results of the preliminary MBR design for the proposed alternative are provided in Table 4.

3.3.2. Estimation of GHG Emissions

Figure S3 describes the results of the three approaches used to estimate GHG in MBR. In terms of CO2 emissions, the difference between GPS-X and the USEPA methods was 177,921.65 tCO2/m3, the difference between the IPCC and USEPA methods was 4375.35 tCO2/m3, and the difference resulting from N2O was −20,093.1 tCO2/m3 for GPS-X and the USEPA methods, compared to 17,147 tCO2/m3 for the IPCC method. The MBR treatment process produced the smallest amount of N2O and CO2 emissions due to its low running energy needs and efficient design.

3.3.3. Energy Consumption

Based on the MBR’s energy consumption, GPS-X 8.0 determined the energy required for aeration, mixing, pumping, and other tasks. Figure 5 depicts a schematic of energy consumption during the WWTP’s operational period. Each aeration tank consumed 830.62 kilowatt-hours of power every day. The digester, therefore, consumed 201.9 kwh/d, whilst the influent consumed 389.29 kwh/d. Regarding the percentages of energy consumed by each component of the WWTP’s operation phase, energy use was influenced by aeration power (58%), mixing power usage (24%), and pumping power usage (11.9%).

3.3.4. LCA for the Alternative

The LCA study in the OpenLCA program used various methods of analysis to determine the environmental effects of suggested treatment procedures. Table S3 displays the consequences of MBR in many categories, such as human toxicity, stratospheric ozone depletion, climate change, and other factors. Climate change, resources, ecosystem quality, human health, and terrestrial eco-toxicity were the large-impact factors. Ionizing radiation, depletion of abiotic resources, ozone depletion, photochemical oxidation (summer smog), and marine eutrophication were the low-impact factors.

3.4. Comparison between the Three Alternatives

3.4.1. Estimation of GHG Emissions

CO2 emissions are not considered in the IPCC’s approach [47]. There is limited literature available that presents comprehensive data on GHG emissions from receiving water. However, the emission factor (EF) used in the calculation was based on the guidelines provided by the Intergovernmental Panel on Climate Change (IPCC), as reported by Zhuang et al. (2020) [48,49].CO2 emissions were equivalent in value in CAS, CAS-N, and MBR due to the USEPA’s methodology not focusing on the type of operation [38] Other nations, including the United States and China, emit the same quantity of GHG kgCO2/m3 from WWTPs, ranging from 0.12 to 0.2 kg-CO2/m3 [49]. The GPS-X program calculation of GHG emissions had the highest value because version 8.01 of GPS-X also accounts for NO2 emissions and emissions from the sludge treatment phase. The MBR method is appropriate in terms of GHG emissions since it has lower emissions, particularly of N2O gases. In China, various treatment methods pertaining to industrial WWTPs have been explored. The results indicated that among the alternatives studied, namely oxidation ditch membrane bioreactor (MBR), sequencing batch reactor (SBR), anaerobic–anoxic-oxic (AAO), and anaerobic-oxic (AO), the latter two exhibited the lowest GHG emissions [48]. Figure 6 below compares the three proposed alternatives to the three methods (IPCC, USEPA, and GPS-X) and reveals that the GPS-X program CAS-N has the highest GHG estimation value, while the CAS with sand filter has the lowest; for USEPA and IPCC, the difference between the proposed alternatives is minimal.
Figure 7 compares the three proposed alternatives based on their emissions of CH4, N2O, and CO2. Based on the comparison, the alternative CAS-N had the greatest CO2 and N2O emissions, while the alternative CAS had the lowest emissions. From this comparison, MBR had the lowest N2O emissions and the highest CH4 emissions, whereas CAS-N had the highest overall emissions; sludge production in CAS-N was the highest, and lowest in CAS.

3.4.2. Energy Consumption

Due to the WWTP consumption of diffuser air, the aeration phase in the pie chart had the largest consumption. According to the GPS-X estimates, the MBR used the smallest amount of energy, and the activated sludge with sand filter (CAS) consumed the most energy during operation of the WWTP. Activated sludge activities consumed 0.30 to 0.60 kWh/m3 of energy [45]. Based on information from a previous study, Iraq consumes the same amount of energy as China, Austria, and Iran, which are 0.26, 0.33, and 0.30 kW/m3, respectively [45]. The alternative MBR was the least energy-consuming during operation, consuming just 1896.7 kWh per day (58%); this merely indicates that it emits fewer greenhouse gases because of its energy consumption. Figure 8 illustrates the contrast due to the energy consumption, in kWh/m3 per day, of the proposed alternatives; the alternative CAS with sand filter consumed the most energy, while the alternative MBR consumed the least.

3.4.3. LCA

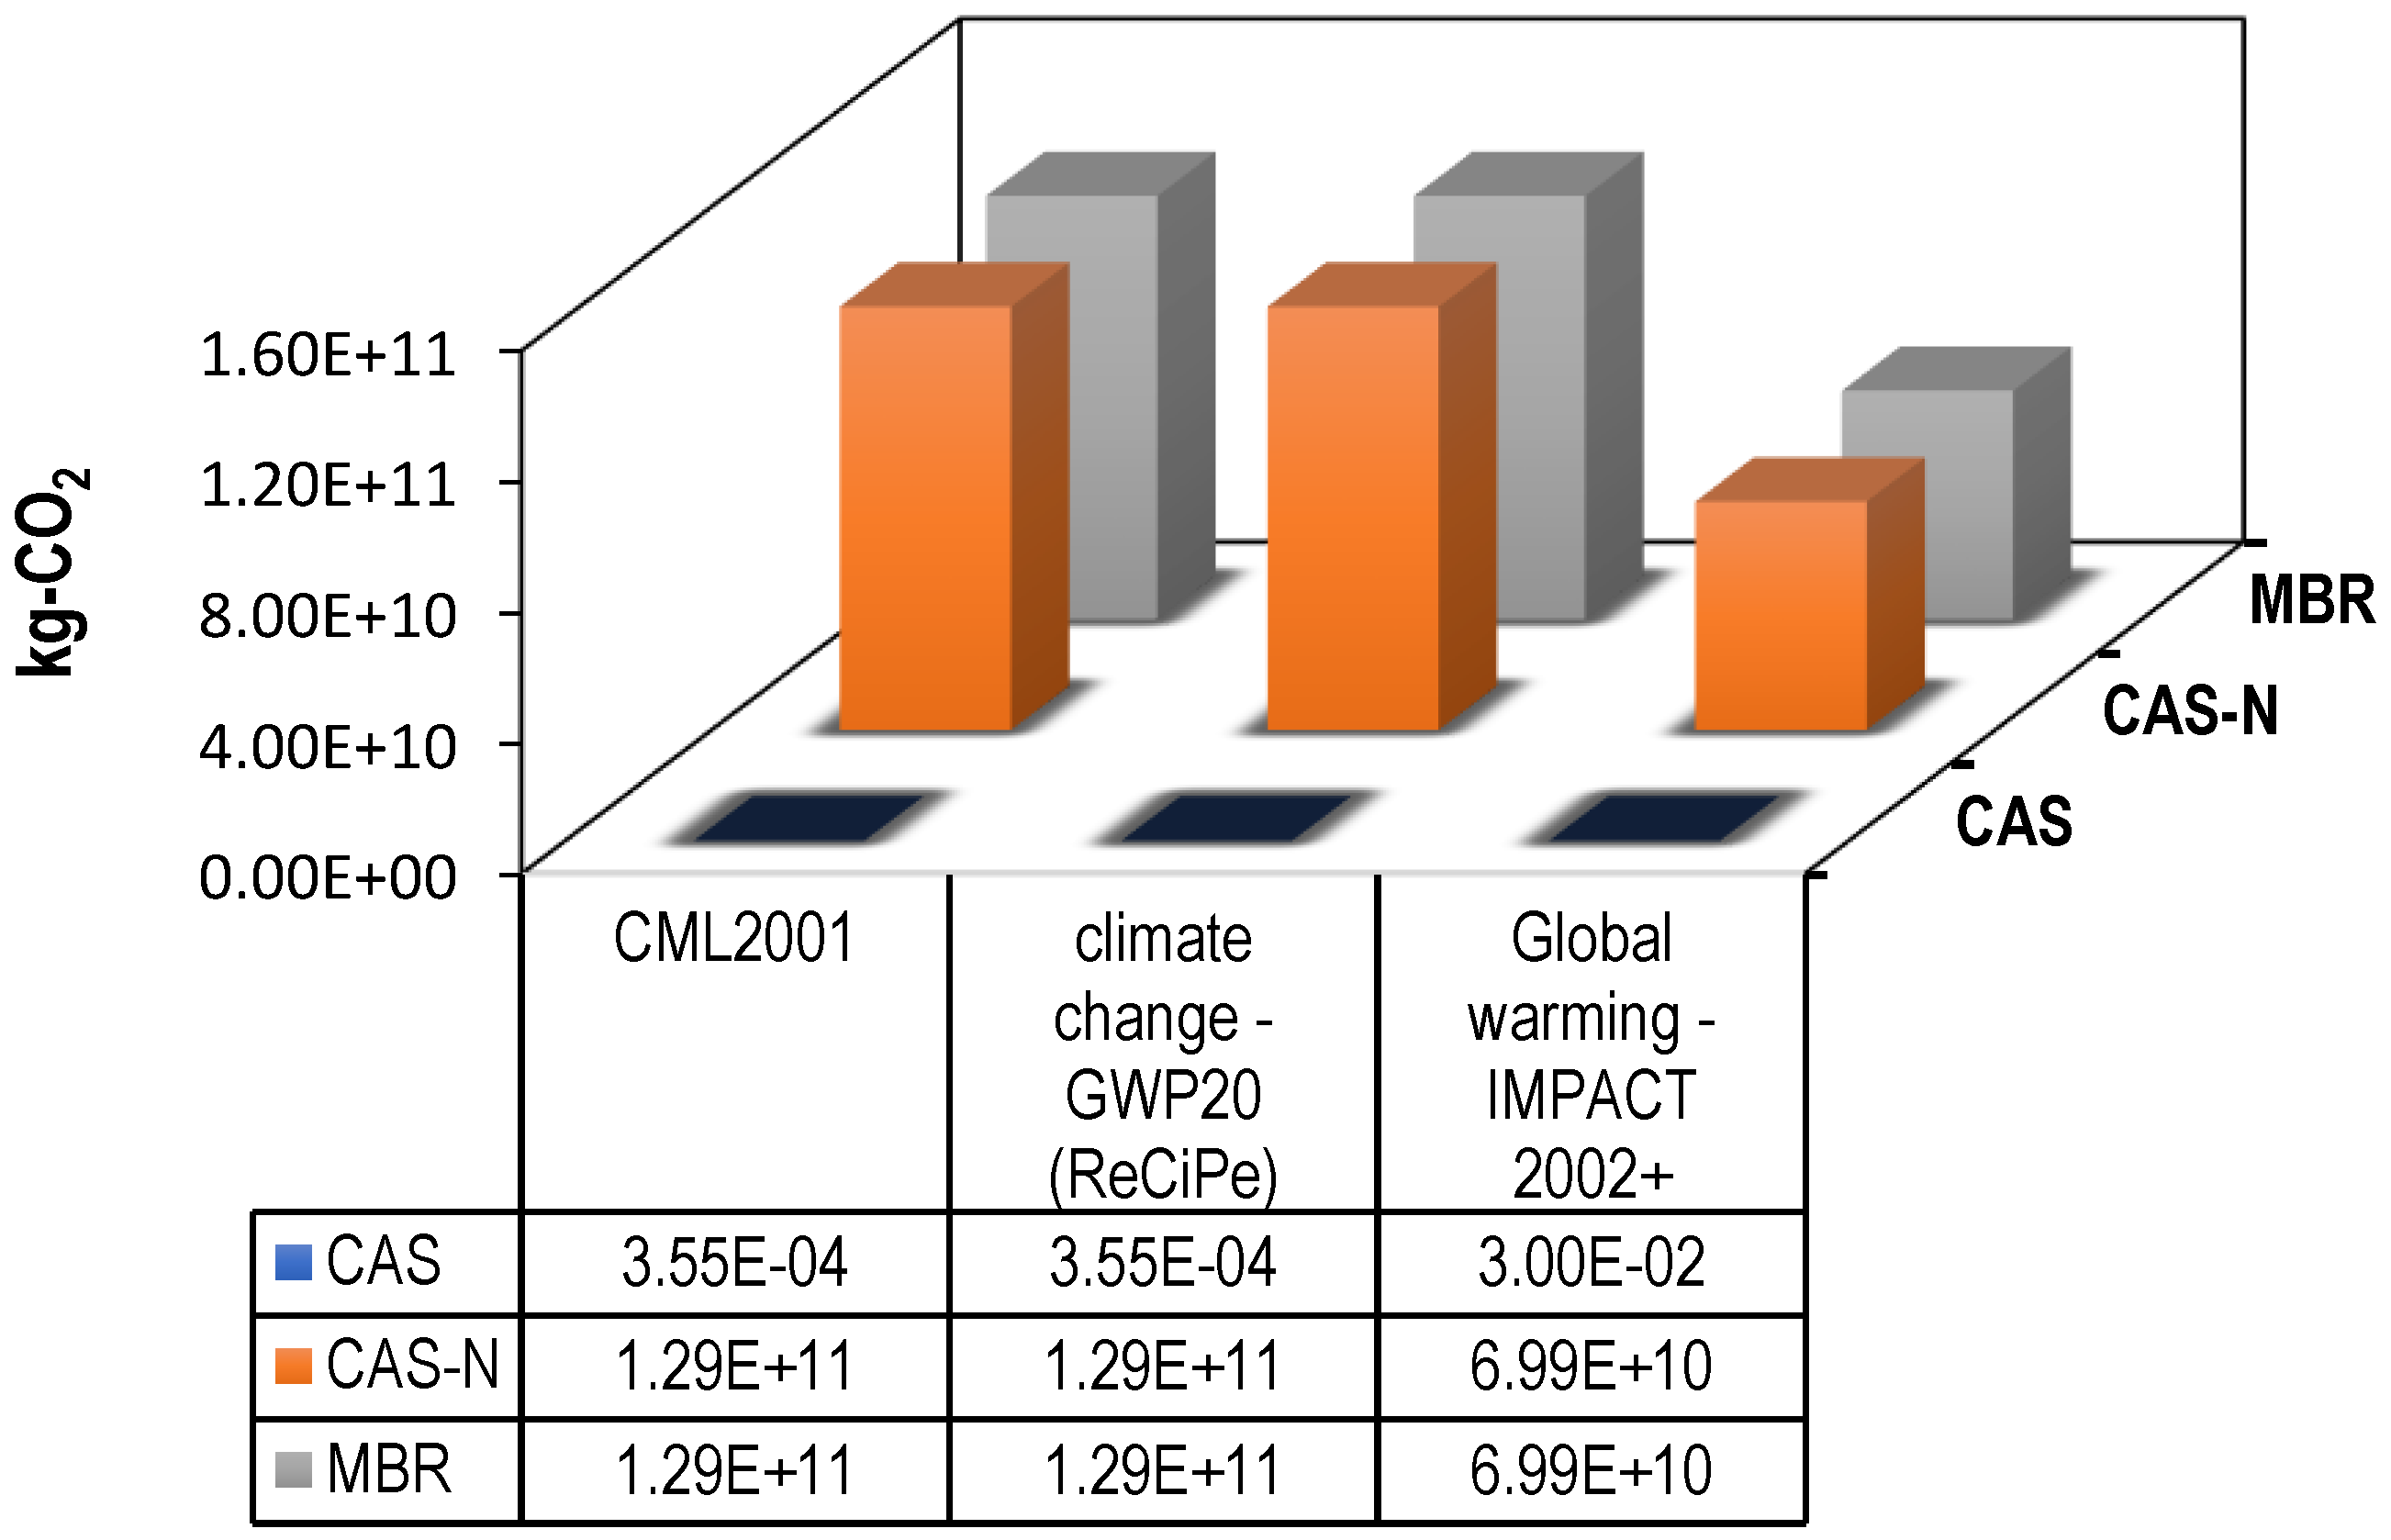
The four categories of damage are listed as follows: resource depletion, ecosystem type, climate change, and human health. There are various damage categories within each one, and they are all quantified in the same units. The analysis of the three suggested options revealed that CAS with a sand filter has the least effect on climate change, global warming, and human health. Due to MBR treatment methods, stratospheric ozone depletion has less of an effect than the depletion of non-living resources [3]. According to these approaches, Figure 9 compares the effect of WWTP emissions (kg/CO2 per year) based on the LCAs of climate change (CML 2001), climate change (GWP 20) (ReCiPe), and global warming (IMPACT 2002+) for the three proposed alternatives. MBR and CAS-N had the highest value, whereas CAS had the lowest. The negative value of environmental impact results implies that their impact on the environment decreases over time.
Figure 10 displays a comparison of the three recommended alternatives according to the LCA-based effects of emissions on human health: human toxicity (HTP 20a, CML 2001, HH), distribution (Boulay et al. 2011 (Human Health) and Pfister et al. 2010 (ReCiPe) models), and human toxicity (HTP 20a, CML 2001, HH) (HTP 100, RECIPE). The results for toxicity to humans show that these methods produce carcinogens (IMPACT 2002+) and non-carcinogens (IMPACT 2002+) (kg 1,4-dichlorobenzene (1,4-DB) equivalent). ReCiPe for CML-2001 human toxicity, non-carcinogens (IMPACT 2002+): CAS-N and MBR had the highest value among the majority of techniques, while the proposed alternative had the lowest value.
Comparing the results with the study on the investigation of LCA on the WWTP through the implementation of IFAS-MBR, MBR-RO, and A2O treatment techniques revealed the presence of GHG emissions and significant adverse effects on human health in the IFAS-MBR system. Based on the findings, it is noteworthy that the IFAS-MBR and MBR-RO setups exhibited the lowest levels of environmental impact and energy consumption, respectively [50]. Another LCA study of the WWTP during construction found that global warming, nonrenewable energy, and respiratory inorganics had the greatest environmental impact potential because of steel and cement (phase of construction), plant operations, electricity use, chemical storage, pipes and plastic use, and Najaf WWTP emissions [51].
Another study used LCA to monitor WWTP operations and improve efficiency showed how wastewater treatment may harm the environment. WWTPs’ environmental implications can be categorized. Human toxicity, ozone depletion, respiratory impacts, photochemical oxidation, and ionizing radiation affect human health. Another study examined how wastewater treatment might affect ecosystem quality. Climate change (72.8%), mineral and fossil resource depletion (0.3%), and photochemical oxidation of ozone (0.2%) were the biggest worldwide impacts (73.2%). Soil eutrophication (0.7%) and acidification (0.6%) had fewer regional impacts. Local implications depend on environmental factors near the pollution source (freshwater ecotoxicity, 2.9%; and ionization radiation, 8.1%) [52].

4. Conclusions

Conducting LCAs for different WWTP designs allows for a comprehensive evaluation of their environmental impacts, including their GHG emissions. By identifying emission sources and implementing targeted strategies, the design and operation of WWTPs can be optimized, which would globally contribute to achieving the SDGs. Particularly in this work, OpenLCA was successfully used to analyze the environmental impacts of a full-scale running domestic WWTP simulated (using GPS-X software) with three proposed operational alternatives to improve its performance, i.e., CAS, CAS-N, and MBR. The analysis included GHGs emissions, energy consumption, and other influent and effluent parameters. The results emphasized that the principal source of GHG emissions was the energy consumption in the aeration-related operational phases of the WWTP. In addition, the conducted analyses, using IPCC, USEPA, and GPS-X software, showed that the alternatives CAS and MBR had the lowest GHG emissions (177,025 and 183,413 t-CO2/m3, respectively), whereas CAS-N had the highest value, of 221,738 t-CO2/m3. However, the alternative CAS showed the lowest impacts on human health, using different estimation models of LCA (i.e., 3.55 × 10⁴ 1,4-DB (CMhuman toxicity), −1.04 × 10⁻⁷ (Boulay et al., 2011 (ReCipe)), 7.69 × 10⁻¹⁰ (Pfister et al., 2010 (ReCipe)), and 1.60 × 10⁻⁴ (HTP100 (ReCiPe)), compared with the alternatives CAS-N and MBR. Additionally, the alternative CAS had the lowest influence on aquatic eco-toxicity, of 8.31 × 10⁻² kg- Tri ethylene Glycol in water (according to IMPACT 2002+). Finally, it can be emphasized here that proper decision-making regarding domestic WWTP designs and operations can be achieved via integrating LCA and simulation tools, particularly to reduce the potential environmental consequences.

Supplementary Materials

The following supporting information can be downloaded at: https://www.mdpi.com/article/10.3390/su15119033/s1, Figure S1. The result of N2O and CO2 to the CAS. * CAS (conventional activated sludge). Figure S2. The result of N2O and CO2 to the CAS-N. * CAS-N (conventional activated sludge with nitrogen removal) with sand filter. Figure S3. The result of N2O and CO2 to the MBR. Table S1: The outcome of the open LCA program’s LCA analysis of the CAS (conventional activated sludge) for various methods. Table S2: The outcome of the open LCA program’s LCA analysis of the CAS-N (conventional activated sludge with nitrogen removal with sand filter for various methods. Table S3: The outcome of the open LCA program’s LCA analysis of the MBR for various methods.

Author Contributions

Conceptualization, D.M.A., M.T.S. and M.F.; Methodology, D.M.A., M.T.S., M.M. and M.F.; Software, D.M.A.; Validation, D.M.A.; Formal analysis, D.M.A. and M.F.; Investigation, D.M.A. and M.F.; Resources, D.M.A.; Data curation, D.M.A. and M.F.; Writing—original draft, D.M.A. and M.F.; Writing—review & editing, M.T.S., M.M. and A.E.; Supervision, M.T.S., M.M. and A.E. All authors have read and agreed to the published version of the manuscript.

Funding

This research received no external funding.

Conflicts of Interest

The authors declare no conflict of interest.

Abbreviations

GHGGreenhouse Gases
WWTPWastewater Treatment Plant
LCALife Cycle Assessment Impact
CASConventional Activated Sludge
CAS-NConventional Activated Sludge with Nitrogen Removal
MBRMembrane Bioreactor
BODBiochemical Oxygen Demand
CH4Methane
CO2Carbon Dioxide
CO2eqCarbon Dioxide Equivalent
CODChemical Oxygen Demand
GPS-XGeneral Purpose Simulator
ODOxidation Ditch
SBRSequencing Batch Reactor
AAOAnaerobic–Anoxic-Oxic
AOAnaerobic-Oxic
IFASIntegrated Fixed Activated Sludge
IPCCThe Intergovernmental Panel on Climate Changes
USEPAThe United States Environmental Protection Agency
N2ONitrous Oxide

References

  1. Ministry of Planning/Central Organization for Statistics and Information Technology (COSIT); Ministry of Municipalities and Public Works; Ministry of Environment; Baghdad Municipality; Ministry of Planning/Statistics Office of the Kurdistan Region; Ministry of Municipalities of the Kurdistan Region; Ministry of Environment of the Kurdistan Region; In cooperation with UNICEF. Environmental Survey in Iraq 2010: Water-Sanitation-Municipal Services. Available online: https://reliefweb.int/report/iraq/environmental-survey-iraq-2010-water-sanitation-municipal-services-detailed-report (accessed on 12 August 2021).
  2. Wanjiru, E.; Xia, X.; Xia, X. Optimal Energy-Water Management in Urban Residential Buildings through Grey Water Recycling. Sustain. Cities Soc. 2017, 32, 654–668. [Google Scholar] [CrossRef] [Green Version]
  3. Gallego-Schmid, A.; Tarpani, R.R.Z. Life Cycle Assessment of Wastewater Treatment in Developing Countries: A Review. Water Res. 2019, 153, 63–79. [Google Scholar] [CrossRef] [PubMed] [Green Version]
  4. Mathematics, A. Rice Straw Utilisation for Bioenergy Production. Energies 2016, 15, 5542. [Google Scholar]
  5. Rashid, S.S.; Harun, S.N.; Hanafiah, M.M.; Razman, K.K.; Liu, Y.Q.; Tholibon, D.A. Life Cycle Assessment and Its Application in Wastewater Treatment: A Brief Overview. Processes 2023, 11, 208. [Google Scholar] [CrossRef]
  6. Iswara, A.P.; Farahdiba, A.U.; Nadhifatin, E.N.; Pirade, F.; Andhikaputra, G.; Muflihah, I.; Boedisantoso, R. A Comparative Study of Life Cycle Impact Assessment Using Different Software Programs. In Proceedings of the IOP Conference Series: Earth and Environmental Science; IOP Publishing: Bristol, UK, 2020; Volume 506, p. 012002. [Google Scholar]
  7. OpenLCA Nexus: The Source for LCA Data Sets. Available online: https://nexus.openlca.org/database/ecoinvent (accessed on 26 September 2022).
  8. OpenLCA. OpenLCA Is a Free, Professional Life Cycle Assessment (LCA) and Footprint Software with a Broad Range of Features and Many Available Databases, Created by GreenDelta since 2006. Available online: https://www.openlca.org/ (accessed on 26 September 2022).
  9. Delre, A.; ten Hoeve, M.; Scheutz, C. Site-Specific Carbon Footprints of Scandinavian Wastewater Treatment Plants, Using the Life Cycle Assessment Approach. J. Clean. Prod. 2019, 211, 1001–1014. [Google Scholar] [CrossRef]
  10. Aleisa, E.; Al-Mutiri, A. Life Cycle Assessment for Tertiary Wastewater Treatment and Reuse versus Seawater Desalination. IOP Conf. Ser. Earth Environ. Sci. 2022, 1026, 012001. [Google Scholar] [CrossRef]
  11. Corominas, L.; Flores-Alsina, X.; Snip, L.; Vanrolleghem, P.A. Comparison of Different Modeling Approaches to Better Evaluate Greenhouse Gas Emissions from Whole Wastewater Treatment Plants. Biotechnol. Bioeng. 2012, 109, 2854–2863. [Google Scholar] [CrossRef]
  12. Ahmed, M.T. Life Cycle Analysis in Wastewater: A Sustainability Perspective. In Waste Water Treatment and Reuse in the Mediterranean Region; Springer: Berlin/Heidelberg, Germany, 2010; pp. 125–154. [Google Scholar]
  13. Larrey-Lassalle, P.; Catel, L.; Roux, P.; Rosenbaum, R.K.; Lopez-Ferber, M.; Junqua, G.; Loiseau, E. An Innovative Implementation of LCA within the EIA Procedure: Lessons Learned from Two Wastewater Treatment Plant Case Studies. Environ. Impact Assess. Rev. 2017, 63, 95–106. [Google Scholar] [CrossRef]
  14. Kyung, D.; Kim, M.; Chang, J.; Lee, W. Estimation of Greenhouse Gas Emissions from a Hybrid Wastewater Treatment Plant. J. Clean. Prod. 2015, 95, 117–123. [Google Scholar] [CrossRef]
  15. Yerushalmi, L.; Ashrafi, O.; Haghighat, F. Reductions in Greenhouse Gas (GHG) Generation and Energy Consumption in Wastewater Treatment Plants. Water Sci. Technol. 2013, 67, 1159–1164. [Google Scholar] [CrossRef]
  16. Mamais, D.; Noutsopoulos, C.; Dimopoulou, A.; Stasinakis, A.; Lekkas, T.D. Wastewater Treatment Process Impact on Energy Savings and Greenhouse Gas Emissions. Water Sci. Technol. 2015, 71, 303–308. [Google Scholar] [CrossRef] [PubMed]
  17. Fighir, D.; Teodosiu, C.; Fiore, S. Environmental and Energy Assessment of Municipal Wastewater Treatment Plants in Italy and Romania: A Comparative Study. Water 2019, 11, 1611. [Google Scholar]
  18. Arnell, M.; Rahmberg, M.; Oliveira, F.; Jeppsson, U. Multi-Objective Performance Assessment of Wastewater Treatment Plants Combining Plant-Wide Process Models and Life Cycle Assessment. J. Water Clim. Chang. 2017, 8, 715–729. [Google Scholar] [CrossRef]
  19. Lehtinen, H.; Saarentaus, A.; Rouhiainen, J.; Pitts, M.; Azapagic, A. A Review of LCA Methods and Tools and Their Suitability for SMEs List of Contents; Europe Innova Eco-Innovation BioChem: Manchester, UK, 2011. [Google Scholar]
  20. Nguyen, T.K.L.; Ngo, H.H.; Guo, W.S.; Chang, S.W.; Nguyen, D.D.; Nghiem, L.D.; Nguyen, T.V. A Critical Review on Life Cycle Assessment and Plant-Wide Models towards Emission Control Strategies for Greenhouse Gas from Wastewater Treatment Plants. J. Environ. Manag. 2020, 264, 110440. [Google Scholar] [CrossRef] [PubMed]
  21. Awad, H.; Alalm, M.G.; El-Etriby, H.K. Environmental and Cost Life Cycle Assessment of Different Alternatives for Improvement of Wastewater Treatment Plants in Developing Countries. Sci. Total Environ. 2019, 660, 57–68. [Google Scholar] [CrossRef] [PubMed]
  22. Piao, W.; Kim, Y.; Kim, H.; Kim, M.; Kim, C. Life Cycle Assessment and Economic Efficiency Analysis of Integrated Management of Wastewater Treatment Plants. J. Clean. Prod. 2016, 113, 325–337. [Google Scholar] [CrossRef]
  23. Gallego, A.; Hospido, A.; Moreira, M.T.; Feijoo, G. Environmental Performance of Wastewater Treatment Plants for Small Populations. Resour. Conserv. Recycl. 2008, 52, 931–940. [Google Scholar] [CrossRef]
  24. Préndez, M.; Lara-González, S. Application of Strategies for Sanitation Management in Wastewater Treatment Plants in Order to Control/Reduce Greenhouse Gas Emissions. J. Environ. Manag. 2008, 88, 658–664. [Google Scholar] [CrossRef]
  25. Siddiqi, A.; Anadon, L.D. The Water–Energy Nexus in Middle East and North Africa. Energy Policy 2011, 39, 4529–4540. [Google Scholar] [CrossRef]
  26. Zappone, M.; Fiore, S.; Genon, G.; Venkatesh, G.; Brattebø, H.; Meucci, L. Life Cycle Energy and GHG Emission within the Turin Metropolitan Area Urban Water Cycle. Procedia Eng. 2014, 89, 1382–1389. [Google Scholar] [CrossRef] [Green Version]
  27. Cornejo, P.K.; Zhang, Q.; Mihelcic, J.R. Quantifying Benefits of Resource Recovery from Sanitation Provision in a Developing World Setting. J. Environ. Manag. 2013, 131, 7–15. [Google Scholar] [CrossRef] [PubMed]
  28. Lorenzo-Toja, Y.; Vázquez-Rowe, I.; Chenel, S.; Marín-Navarro, D.; Moreira, M.T.; Feijoo, G. Eco-Efficiency Analysis of Spanish WWTPs Using the LCA+ DEA Method. Water Res. 2015, 68, 651–666. [Google Scholar] [CrossRef]
  29. Abeer, A.; Al-Sakini, Y. Rustumiya Sanitation Project and Its Effects on Polluting Diyala River. Adab. Al-Basrah 2016, 2016, 243–268. [Google Scholar]
  30. Alanbari, M.A.; Al-Ansari, N.; Altaee, S.A.; Knutsson, S. Application of Simapro7 on Karbala Wastewater Treatment Plant, Iraq. J. Earth Sci. Geotech. Eng. 2014, 4, 55–68. [Google Scholar]
  31. Al-Rawi, S.M. Contribution of Man–Made Activities to the Pollution of the Tigris within Mosul Area/IRAQ. Int. J. Environ. Res. Public Health 2005, 2, 245–250. [Google Scholar] [CrossRef] [Green Version]
  32. Hydromantis Inc. GPS-X Technical Reference 2018; Hydromantis Inc.: Hamilton, ON, Canada, 2018. [Google Scholar]
  33. Arroyo, P.; Molinos-Senante, M. Selecting Appropriate Wastewater Treatment Technologies Using a Choosing-by-Advantages Approach. Sci. Total Environ. 2018, 625, 819–827. [Google Scholar] [CrossRef]
  34. Henze, M.; Gujer, W.; Mino, T.; Matsuo, T.; Wentzel, M.C.; Marais, G.V.R.; Van Loosdrecht, M.C.M. Activated Sludge Model No.2d, ASM2d. Water Sci. Technol. 1999, 39, 165–182. [Google Scholar] [CrossRef]
  35. IPCC Publications—IPCC-TFI. 2006 IPCC Guidelines for National Greenhouse Gas Inventories. Available online: https://www.ipcc-nggip.iges.or.jp/public/2006gl/ (accessed on 25 September 2022).
  36. U.S. Environmental Protection Agency|US EPA. Available online: https://www.epa.gov/ (accessed on 26 September 2022).
  37. Water and Wastewater Treatment Modeling and Simulation Software|Hydromantis. Available online: https://www.hydromantis.com/ (accessed on 26 September 2022).
  38. Plassmann, K.; Norton, A.; Attarzadeh, N.; Jensen, M.P.; Brenton, P.; Edwards-Jones, G. Methodological Complexities of Product Carbon Footprinting: A Sensitivity Analysis of Key Variables in a Developing Country Context. Environ. Sci. Policy 2010, 13, 393–404. [Google Scholar] [CrossRef]
  39. Boulay, A.M.; Bulle, C.; Bayart, J.B.; Deschenes, L.; Margni, M. Regional Characterization of Freshwater Use in LCA: Modeling Direct Impacts on Human Health. Environ. Sci. Technol. 2011, 45, 8948–8957. [Google Scholar] [CrossRef]
  40. Pfister, S.; Saner, D.; Koehler, A. The environmental relevance of freshwater consumption in global power production. Int. J. Life Cycle Assess. 2011, 16, 580–591. [Google Scholar] [CrossRef] [Green Version]
  41. Bartram, D.; Michael, D.S.; Ebie, Y.; Farkaš, J.; Gueguen, C.; Peters, M.G.; Zanzottera, N.M.; Karthik, M. Emissions Scenarios; IPCC: Tokyo, Japan, 2019. [Google Scholar]
  42. Eddy, M. Wastewater Engineering: Treatment and Reuse; McGraw-Hill Book Co.: New York, NY, USA, 2003. [Google Scholar]
  43. Abd El Mooty, M.; Kansoh, R.; Abdulhadi, A. Challenges of Water Resources in Iraq. J. Waste Water Treat. Anal. 2016, 7, 260. [Google Scholar] [CrossRef]
  44. Al-Zuhairi, M. Evaluation for Future Baghdad Wastewater Treatments Plants Efficiency. J. Tech. 2008, 21, A14–A23. [Google Scholar]
  45. Drechsel, P.; Qadir, M.; Wichelns, D. Wastewater: An Economic Asset in an Urbanizing World; Springer: Dordrecht, The Netherlands, 2015; pp. 1–282. [Google Scholar] [CrossRef]
  46. Zang, Y.; Li, Y.; Wang, C.; Zhang, W.; Xiong, W. Towards More Accurate Life Cycle Assessment of Biological Wastewater Treatment Plants: A Review. J. Clean. Prod. 2015, 107, 676–692. [Google Scholar] [CrossRef]
  47. Abdelmoula, S.; Sorour, M.T.; Moustafa, M.; Fayed, M. Estimating Greenhouse Gases Emissions from Large Wastewater Treatment Plants Using Different Methods-(Case Study: Alexandria, Egypt). In Proceedings of the Eighth International Conference on Advances in Bio-Informatics, Bio-Technology and Environmental Engineering-ABBE 2019, Birmingham, UK, 23–24 April 2019. [Google Scholar]
  48. Guo, D.; Li, B.; Yu, W.; Han, J.; Zhou, Y.; Ye, Z.; Wu, X. Revisiting China’s Domestic Greenhouse Gas Emission from Wastewater Treatment: A Quantitative Process Life-Cycle Assessment Science of the Total Environment Revisiting China’s Domestic Greenhouse Gas Emission from Wastewater Treatment: A Quantitativ. Sci. Total Environ. 2023, 876, 162597. [Google Scholar] [CrossRef] [PubMed]
  49. Zhuang, H.; Guan, J.; Leu, S.-Y.; Wang, Y.; Wang, H. Carbon Footprint Analysis of Chemical Enhanced Primary Treatment and Sludge Incineration for Sewage Treatment in Hong Kong. J. Clean. Prod. 2020, 272, 122630. [Google Scholar] [CrossRef]
  50. Hajar, A. Life Cycle Assessment of Wastewater Treatment Systems. Environ. Resour. Res. 2022, 10, 41–50. [Google Scholar] [CrossRef]
  51. Al-Anbari, M.A.; Altaee, S.A.; Kareem, S.L. Using Life Cycle Assessment (LCA) in Appraisal Sustainability Indicators of Najaf Wastewater Treatment Plant. Egypt. J. Chem. 2022, 65, 513–519. [Google Scholar] [CrossRef]
  52. Csicsaiová, R.; Stanko, Š.; Dubcová, M. Usage of the Life Cycle Assessment Method for Environmental Impact Assessment of Wastewater Treatment Plant. Pollack Period. 2019, 14, 151–160. [Google Scholar] [CrossRef]
Figure 1. Diagram of the wastewater treatment plant (WWTP) and the operational alternatives proposed in the current study.
Sustainability 15 09033 g001
Figure 2. The stages of life cycle assessment (LCA) analysis using OpenLCA software.
Sustainability 15 09033 g002
Figure 3. The GPS-X related layout for energy consumption in kilowatt hours per day (kWh/d) of the first alternative CAS (conventional activated sludge with sand filter) during operation of one line of treatment.
Sustainability 15 09033 g003
Figure 4. The GPS-X related layout for energy consumption in kilowatts (kW) of the second alternative: CAS-N (conventional activated sludge with sand filter and nitrogen removal) of one line of treatment.
Sustainability 15 09033 g004
Figure 5. The GSP-X related layout for the third alternative, i.e., membrane bioreactor (MBR), for energy consumption in kilowatt hours per day (kWh/d) during operation of one line of treatment.
Sustainability 15 09033 g005
Figure 6. The resulting total emissions of GHGs from the proposed alternatives according to the IPCC, USEPA, and GPS-X methods. CAS, conventional activated sludge with sand filter; CAS-N, conventional activated sludge with sand filter and nitrogen removal unit; MBR, membrane bioreactor.
Sustainability 15 09033 g006
Figure 7. Comparison of the three proposed alternatives according to GHG emissions assessed with GPS-X. CAS, conventional activated sludge with sand filter; CAS-N, conventional activated sludge with sand filter and nitrogen removal unit; MBR, membrane bioreactor.
Sustainability 15 09033 g007
Figure 8. Energy consumption (kWh/m3) of proposed alternatives for the Russtmiya WWTP (as a case study). CAS, conventional activated sludge with sand filter; CAS-N, conventional activated sludge with sand filter and nitrogen removal unit; MBR, membrane bioreactor.
Sustainability 15 09033 g008
Figure 9. Climate change and global warming indicators (i.e., CO2 emissions) for the three proposed alternatives (CAS, CAS-N, and MBR), using three different methods. CAS, conventional activated sludge with sand filter; CAS-N, conventional activated sludge with sand filter and nitrogen removal unit; MBR, membrane bioreactor.
Sustainability 15 09033 g009
Figure 10. A comparison between the proposed alternatives using various LCA program results. CAS, conventional activated sludge with sand filter; CAS-N, conventional activated sludge with sand filter and nitrogen removal unit; MBR, membrane bioreactor.
Sustainability 15 09033 g010
Table 1. Specifications of influent and effluent of the Russtmiya WWTP according to Iraqi effluent standards.
IndicatorInfluentEffluent Standards
Discharge (m3/day)450,000
pH7.366.5–8
Temperature (°C)22<35
BOD (mg/L)264<40
COD (mg/L)450<100
TSS (mg/L)30060
TDS (mg/L)1217
Nitrate (mg/L)6.650
Phosphate (mg/L)17.63
Sulphate (mg/L)448400
Chloride (mg/L)664600
Source: Northern Russtmiya WWTP; standards according to Alanbari et al. [30].
Table 2. The outcomes of the alternative CAS (conventional activated sludge with sand filter) design proposed for the Russtmiya WWTP.
The Included Units for Phase OneCAS
Pretreatment
ScreeningNumber of screenings100
Area of each channel screen, m210 m2
Aerated grit chamberNumber of tanks5
Volume of each tank, m3239 m3
Primary treatment
Number of tanks5
Diameter, m40 m
Secondary treatment
Aerobic tankNumber of tanks15
Volume of each tank, m32794 m3
MLVSS, mg/L3500
F/M ratio, gBOD5/g day0.31 gBOD5/g MLVSS d
Required oxygen kg O2/d36,998.17 kg O2/d
Solid retention time day6
Secondary sedimentation tankNumber of tanks15
Diameter, m40 m
Efficiency of BOD removal with sand filter96.7%
Table 3. The outcomes of the alternative CAS-N (conventional activated sludge with sand filter and nitrogen removal) design proposed for the Russtmiya WWTP.
The Included Units for Phase OneCAS-N
Pretreatment
ScreeningNumber of screenings100
Area of each channel screen, m210 m2
Aerated grit chamberNumber of tanks5
Volume of each tank, m3239 m3
Primary treatment
Number of tanks5
Diameter, m40 m
Secondary treatment
Anoxic tankNumber of tanks20
Volume of each tank, m31042 m3
MLVSS, mg/L2221.27 mg/L
F/M ratio, gBOD5/g day0.95 g BOD5/g day
Aerobic tankNumber of tanks20
Volume of each tank, m33155 m3
MLVSS, mg/L3500
F/M ratio, gBOD5/g day0.2 gBOD5/g MLVSS ·d
Required oxygen kg O2/d75,457,608.78 Kg O2/d
Solid retention time day10
Secondary sedimentation tankNumber of tanks20
Diameter, m35 m
Efficiency of BOD removal with sand filter97%
Table 4. The outcomes of the alternate MBR design suggested for the Russtmiya WWTP.
The Included Units for Phase OneMBR
Pretreatment
ScreeningNumber of screenings100
Area of each channel screen, m210 m2
Aerated grit chamberNumber of tanks5
Volume of each tank, m3239 m3
Primary treatment
Number of tanks5
Diameter, m40 m
Secondary treatment
Anoxic tankNumber of tanks15
Volume of each tank, m31389 m3
MLVSS, mg/L2120.3 mg/L
F/M ratio, gBOD5/g day0.9 g/g day
Aerobic tankNumber of tanks15
Volume of each tank, m33037 m3
MLVSS, mg/L8000
F/M ratio, gBOD5/g day0.2 gBOD5/g MLVSS ·d
Required oxygen kg O2/d286,459.2 kg O2/d
Solid retention time day20
Immerged membraneNumber of membrane tanks75
Volume of each tank, m3220.5
Total membrane area m2744,053.6 m2
Aeration requirement m3/h388,824.88 m3/h
Design flux, L/m2h14 L/m2 h
Efficiency of BOD removal with sand filter99%
Disclaimer/Publisher’s Note: The statements, opinions and data contained in all publications are solely those of the individual author(s) and contributor(s) and not of MDPI and/or the editor(s). MDPI and/or the editor(s) disclaim responsibility for any injury to people or property resulting from any ideas, methods, instructions or products referred to in the content.