Article

Novel Application of MnO2–H2O2 System for Highly Efficient Arsenic Adsorption and Oxidation

1
State Key Laboratory of Urban Water Resource and Environment, Harbin Institute of Technology, Harbin 150090, China
2
The Architectural Design and Research Institute, Harbin Institute of Technology, Harbin 150090, China
*
Author to whom correspondence should be addressed.
Sustainability 2023, 15(11), 9080; https://doi.org/10.3390/su15119080
Submission received: 1 April 2023 / Revised: 15 May 2023 / Accepted: 1 June 2023 / Published: 4 June 2023

Abstract

:
A novel manganese dioxide–hydrogen peroxide (MnO2–H2O2) system was developed for effective Arsenic (As) removal. Under the specified conditions of no external mechanical stirring, a trace H2O2 concentration of 0.015 wt%, and a MnO2 concentration of 25 mg/L, high removal efficiency (88%) of As (100 µg/L) was achieved by the MnO2–H2O2 system within 30 min, which differs from conventional adsorption processes that require external mechanical stirring and conventional arsenite (As (III)) oxidation–adsorption processes that require high quantities of oxidants (such as ozone) and specially synthesized adsorbents/catalysts. The high removal efficiency of As (III) by the MnO2–H2O2 system was attributed to the turbulent conditions precipitated by the extensively generated oxygen (O2) from the catalytic decomposition of H2O2, the efficient adsorption of As on the surface of MnO2, and the effective generation of reactive radicals including hydroxyl and superoxide radicals (•OH and •O2). Moreover, the MnO2 adsorbents before and after As removal were characterized systematically, and the generated radicals were verified using electron spin resonance (ESR). The results showed that the formation of inner-sphere surface complexes by the surface hydroxyl groups of MnO2 particles and As was responsible for the effective As adsorption process, and the oxidation of As (III) to arsenate (As (V)) was achieved via the generated radicals. The influences of representative environmental factors on As removal performance and the application of the MnO2–H2O2 system in river water and ground water were further studied and tested. In conclusion, the MnO2–H2O2 system offers several advantages, including low cost, ease of operation, and strong environmental adaptability, making it highly promising for practical water treatment applications.

1. Introduction

As one of the major heavy metal pollutants in water, Arsenic (As) has been listed in the standards for water quality globally and monitored strictly to ensure the safety of drinking water. Due to the high toxicity and carcinogenicity of As, the World Health Organization (WHO) has set the maximum contaminant level (MCL) for As in drinking water to 10 µg/L [1,2]. Inorganic arsenate (As (V)) and arsenite (As (III)) are the main species of As existing in natural water, between which more attention has been paid to As (III), which demonstrates higher mobility and toxicity [3,4]. Due to the fact that As (III) is normally present in water in a nonionized form as H3AsO3 [5], it is difficult to remove using commonly used adsorbents as a result of the lack of electrostatic interaction [6,7]. One effective way to achieve efficient As removal is the transformation of As (III) to As (V). It is widely known that As (V) is the dominant form of As under alkaline conditions [8]; however, it is generally not feasible to transform As (III) into As (V) via pH adjustment, especially for large-scale drinking water treatment and the in situ treatment of surface and ground water. The other way to achieve this transformation is by oxidizing As (III) into As (V) and allowing subsequent adsorption [9]. The oxidation–adsorption process has proven to be an easily achievable and applicable method for As removal [10,11,12]. Many methods based on this mechanism have been developed, such as the combination of oxygenation or ozonation with adsorbents or membranes [13,14] and the application of specific adsorbents with oxidation capacity [15,16,17,18].
When compared to various synthesized adsorbents designed specifically for oxidation–adsorption purposes, such as titanium-based composites with photocatalytic properties [19,20] and Fe-based composites capable of initiating Fenton-like reactions [17,21], the commonly used compound manganese dioxide (MnO2) offers distinct advantages. MnO2, serving as both an oxidant and an adsorbent for As (III), demonstrates notable benefits, including high stability, low cost, and ease of operation [22,23]. These characteristics make MnO2 a favorable choice for practical applications. Previous studies have shown that the oxidation of As (III) by MnO2 takes place heterogeneously on the surface of MnO2. This process results in the release of both dissolved As (V) and Mn (II) into a solution under acidic conditions (shown in reaction 1) [24]. In addition, the adsorption of As (V) occurs through the formation of a surface complex between As (V) and the hydroxyl groups present on the surface of MnO2 (shown in reaction 2) [22]:
MnO2 + H3AsO3 + 2H+ = Mn2+ + H3AsO4 + H2O
2Mn-OH + H3AsO4 = (MnO)2AsOOH + 2H2O
where Mn-OH represents the surface hydroxyl group on MnO2, and (MnO)2AsOOH represents the complex formed by As (V) and MnO2.
It is important to highlight that MnO2 not only acts as an adsorbent and oxidant but also possesses catalytic properties suitable for the generation of reactive free radicals, including hydroxyl and superoxide radicals (•OH and •O2), through the catalytic decomposition of hydrogen peroxide (H2O2) [25,26]. Additionally, the abundant generation of oxygen (O2) in the MnO2–H2O2 system creates turbulent conditions, thereby promoting better contact between MnO2-based composites and pollutants and enhancing the dispersion of the reactive radicals [27,28]. Owing to these advantages, the MnO2–H2O2 system has been used in various applications in the field of environmental engineering, such as membrane cleaning, iron chelate degradation, and the removal of organic pollutants [28,29,30,31,32]. As can be gleaned from the above discussion, the oxidation of As (III) to As (V) plays a crucial role in the effective removal and detoxification of As. It is a fact that the oxidation capacity of MnO2 itself is not strong, which may limit the overall performance of As removal. So, it is reasonable to speculate that a system containing a stronger oxidant may be capable of more effective As removal. In this study, the ability of the MnO2–H2O2 system to remove As was investigated for the first time. The experimental results demonstrated that excellent As removal could be achieved under the following conditions: a trace amount of H2O2, no additional mechanical stirring, and the use of a short reaction time. Moreover, the removal of As was also conducted in river water and groundwater to verify the feasibility of the MnO2–H2O2 system.

2. Materials and Methods

2.1. Materials

Chemicals including potassium permanganate (KMnO4), manganese sulfate tetrahydrate (MnSO4·4H2O), disodium hydrogen arsenate heptahydrate (Na2HAsO4·7H2O), sodium arsenite (NaAsO2), 5,5-dimethyl-1-pyrroline-N-oxide (DMPO), methanol (CH3OH), sulfuric acid (H2SO4), sodium hydroxide (NaOH), sodium chloride (NaCl), calcium chloride (CaCl2), magnesium chloride (MgCl2), disodium hydrogen phosphate (Na2HPO4), sodium silicate (Na2SiO3), sodium bicarbonate (NaHCO3), and hydrogen peroxide (H2O2, 30 wt%) were of reagent grade and used directly without any additional purification. Both membrane filters and syringe filters with 0.45μm pore size were used for MnO2 synthesis and sample preparation.

2.2. Experimental Procedures

MnO2 particles were synthesized via the commonly occurring reaction between KMnO4 and MnSO4:
3MnSO4·4H2O + 2KMnO4 = 5MnO2 + K2SO4 + 2H2SO4 + 10H2O
The details of the synthesis procedures are as follows: A mixture containing MnSO4 (0.15 M) and KMnO4 (0.1 M) was stirred continuously for 2 h and then left to set for 30 min. The reaction products were filtered and, subsequently, subjected to four cycles of washing with ultrapure water (Milli-Q) and ethanol. Following this, the products were dried under vacuum at 60 °C for 12 h until they became powders. The MnO2 particles obtained were systematically characterized using scanning electron microscopy (SEM), X-ray diffraction (XRD), and Brunauer–Emmett–Teller (BET) analysis. Moreover, the dispersion state of MnO2 particles in water was further characterized using a Malvern Mastersizer.
Batch experiments were conducted to measure the adsorption isotherms of As using MnO2. Initially, a 50 mL solution containing As (III) with an initial concentration of 100 µg/L was prepared. Then, predetermined amounts of synthesized MnO2 particles and H2O2 were added into the system to initiate the catalytic reaction and adsorption of As. The dosage amount of MnO2 particles varied between 15 mg/L to 100 mg/L, and the initial concentration of H2O2 was set in the range between 0.01 wt% and 0.3 wt%. Samples for As measurement were prepared at specific time intervals by collecting 3 mL of the suspension containing MnO2 particles. The collected suspension was promptly filtered using a syringe filter. Note that the MnO2 particles trapped on the filter membrane were not reintroduced into the system. As the controlling parameters, pH of the system was adjusted using HNO3 and/or NaOH; concentration and types of cations and anions were adjusted by adding specific electrolytes; temperature of the As (III) solution was controlled using an automatic temperature controller; and the As (III) solution was prepared using Milli-Q water, ground water, or river water, depending on the goal of the experiment. All experiments were conducted at least in triplicate. The concentrations of As (III) and As (V) were analyzed using a combination of high-performance liquid chromatography and inductively coupled plasma mass spectrometry (HPLC-ICP-MS) with the NexION300X instrument from Perkin Elmer Co., Waltham, MA, USA.
To investigate the mechanism of the oxidation–adsorption process for As removal via the MnO2–H2O2 system, the MnO2 particles before and after reaction were collected and compared with each other. To examine the alterations in MnO2 particles resulting from the catalytic reaction and As adsorption, X-ray photoelectron spectroscopy (XPS), Fourier transform infrared spectroscopy (FTIR), and Raman spectroscopy were employed. Furthermore, electron spin resonance (ESR) tests were performed to confirm the presence of reactive free radicals generated in the MnO2–H2O2 system.

3. Results

3.1. Characterization of MnO2

The characteristics of the synthesized MnO2 particles are shown in Figure 1. Figure 1a,b illustrate that the MnO2 particles exhibited irregular shapes, generally ranging in size from 0.5 µm to 1 µm. Additionally, the HR-TEM image (Figure 1c) reveals that the material’s lattice spacing measures 0.24 nm, corresponding to the (-111) crystal plane of δ-MnO2 [33].
The XRD pattern depicted in Figure 1d exhibits distinct peaks at 12.46°, 25.33°, and 36.68°, which correspond to the (001), (002), and (-111) facets, respectively. These characteristic peaks indicate the polymorph of δ-MnO2 (JCPDS PDF# 80–1098) [34,35]. BET tests were also conducted to further characterize the morphology of the particles. As shown in Figure 1e, the closed state of the adsorption–desorption curve belonging to the type-IV isotherm indicated the porous structure of the MnO2 particles. More detailed statistical results obtained using BET tests showed that the average pore size of the MnO2 particles was 3.412 nm and the specific surface area was as high as 288.487 m2/g. Figure 1f shows the further measurements of the size distribution of the agglomerates obtained by conducting DLS measurements on the MnO2 particles dispersed in water. The results indicated that the majority of the agglomerates fell within the range of 10 µm to 100 µm, with an average size of approximately 50 µm. Additionally, there were smaller quantities of larger agglomerates formed, measuring around 500 µm in size. Conclusively, the mentioned characterization tests indicated that the synthesized MnO2 particles were mesoporous δ-MnO2 with a high specific surface area, which might contribute to the adsorption of As discussed in the following section.

3.2. Performance of MnO2–H2O2 System with Respect to As Removal

3.2.1. Key Operating Parameters for As Removal

In the conventional systems for As adsorption, mechanical stirring is always required in order to maintain the continuous dispersion of adsorbents and enhance the contact between adsorbates and adsorbents. However, in the MnO2–H2O2 system, the high adsorption efficiency of As could be achieved automatically without mechanical stirring. By adding H2O2 into the system containing MnO2 adsorbents, the extensive generation of O2 from the catalytic decomposition of H2O2 led to the turbulent conditions necessary for facilitating effective and continuous contact between As and micron-sized MnO2 particles (the turbulent conditions caused by the catalytic decomposition of H2O2 have been described in detail in our previous studies [28,29]). Besides the advantage of not requiring mechanical stirring, as shown in Figure 2a, the equilibrium adsorption capacity (qe) of the MnO2–H2O2 system was always higher than that of the mechanically stirred MnO2 system, especially when the initial As concentration was high (>2 mg/L). For example, when the initial As concentration was 6 mg/L, the qe of MnO2–H2O2 system was 33.6 mg/g, which was more than twice that of the mechanically stirred MnO2 system (qe = 15.5 mg/g). The enhanced performance of the MnO2–H2O2 system can be attributed to the increased generation of hydroxyl radicals, which facilitates the oxidation of As (III) to As (V) and, subsequently, enhances the adsorption process. A detailed discussion of this process is provided in the following section.
The adsorption capacity of MnO2 for both As (III) and As (V) was also tested. As shown in Figure 2b, the qe of As (III) and As (V) was always comparable when the initial As (II or V) concentration varied in the range from 100 µg/L to 6 mg/L. Figure 2c further demonstrates the influence of the H2O2 and MnO2 dosages on As removal. It shows that when the H2O2 concentration was higher than 0.01 wt%, the qe remained almost constant regardless of the increase in the H2O2 concentration, indicating that the free radicals and O2 generated by the 0.01 wt% H2O2 were at high enough levels to enable the saturated oxidation–adsorption of As under the experimental conditions. Moreover, when the initial As concentration was 100 µg/L and the H2O2 concentration was 0.015 wt%, upon increasing the MnO2 dosage from 25 mg/L to 100 mg/L, qe would decrease gradually from 3.3 mg/g to 0.9 mg/g, which implied the inadequate utilization of adsorption sites on the MnO2 particles under the condition of a high MnO2 dosage. A lower MnO2 dosage of 15 mg/L was also tested, but the qe was much lower than that obtained with the 25 mg/L MnO2 dosage due to the lack of available adsorption sites.
The curves of the adsorption kinetics are shown in Figure 2d. They indicate that the adsorption process of As (III) was very fast within the first 10 min; then, the adsorption rate decreased gradually. Finally, qe was achieved at about 30 min, and the adsorption amounts remained almost constant afterwards. The final removal efficiency of As (III) was determined to be 88% under the conditions of 25 mg/L of MnO2 and 0.015 wt% H2O2 (the concentration of As left in the solution was about 12 µg/L). When the MnO2 dosage was doubled to 50 mg/L, the trend of the curve was almost the same. Considering the fact that the initial As concentration used in the experiments was 100 µg/L, which is higher than that in most natural groundwater and surface water globally, and as the permissible limit of As in drinking water is set at 10 µg/L, it can be deduced from the experimental results that the As removal capacity of MnO2–H2O2 is sufficient for the practical treatment of natural water.

3.2.2. Simulations of Adsorption Kinetics, Isotherms, and Thermodynamics

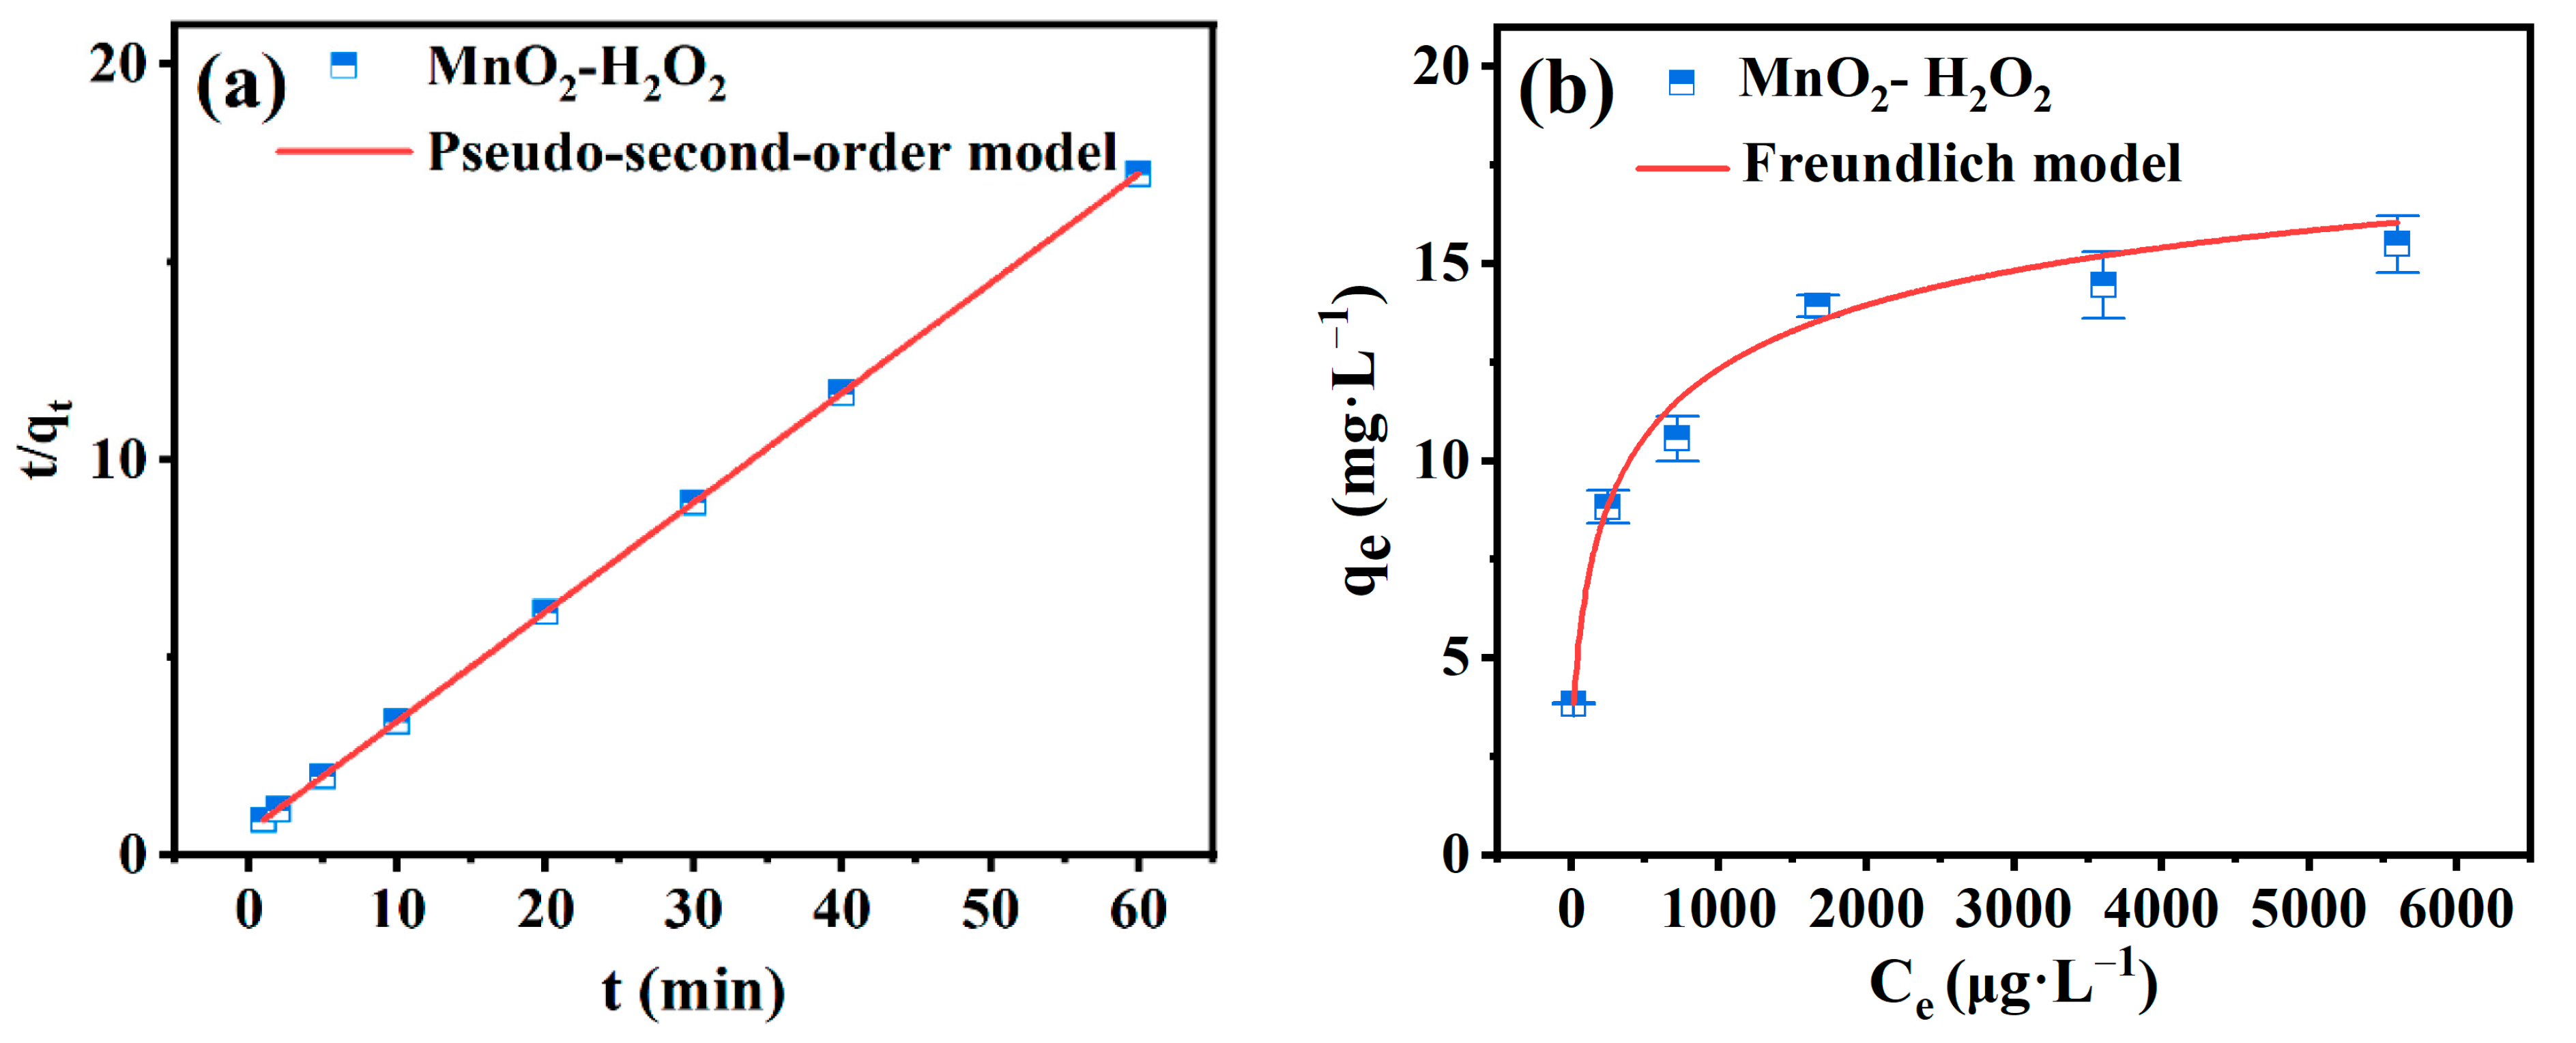
The adsorption kinetic curves were simulated using both the pseudo-first-order and pseudo-second-order models. The simulated curves and the values of related parameters are shown in Figure 3a and Table S1. The results indicate that the pseudo-second-order model provides a more suitable simulation of the adsorption kinetics, as evidenced by its higher Adj. R2 value. Meanwhile, the calculated qe with z value of 3.6 was also comparable with that obtained from the experiments, which was 3.3. As the pseudo-second-order kinetic model suggests that chemisorption is the rate-limiting step in the adsorption process, it was deduced that the predominant mechanism for the adsorption of As (III) involves chemisorption, where covalent bonds may be formed through the sharing or exchange of electrons between MnO2 and As.
Simulations of the adsorption isotherms were further conducted using both the Langmuir and Freundlich models [36,37], and the values of the corresponding parameters are shown in Figure 3b and Table S2. Figure 3b shows that qe was enhanced with the increasing initial As concentration; subsequently, the increment rate declined gradually, which is similar to the adsorption isotherms of other adsorbents. As shown in Table S2, the Freundlich model in which multimolecular layer adsorption was set as the assumption could provide a more appropriate simulation with a higher Adj. R2 value (>0.99). This implies that the adsorption of As (III) by MnO2 might be dominated by the multimolecular layer adsorption on the MnO2′s surface.
Thermodynamic parameters, including the changes in standard free energy (ΔG0), enthalpy (ΔH0), and entropy (ΔS0), were also calculated. The calculated results and calculation procedures are shown in Table 1 and the Supporting Information. The negative value of ΔG0, along with its decreasing trend as the temperature increases, suggests that the adsorption of As by the MnO2–H2O2 system is a spontaneous process. This indicates that the adsorptive forces are strong enough to overcome the binding potential, allowing for the effective binding of As (III) and As (V) on the surface of the MnO2. The negative value of ΔH0 indicates that the adsorption process is exothermic. Additionally, the positive value of ΔS0 suggests an increase in randomness at the solid/solution interface during the adsorption of As (III) and As (V) on the surface of the MnO2 [38]. This increase in randomness can be attributed to the substitution of surface groups on MnO2 by As and the generation of oxygen on the MnO2′s surface through the catalytic decomposition of H2O2.

3.3. Mechanisms for As Removal

To characterize the distribution of adsorbed As on the surface of the MnO2, scanning electron microscopy and energy-dispersive X-ray spectroscopy (SEM-EDS) mapping of the MnO2 particles after As adsorption were conducted. As shown in Figure 4, the adsorbed As was distributed uniformly on the surfaces of the MnO2 particles without distinct areas of As enrichment, indicating the remarkable homogeneity of As adsorption by the MnO2 particles.
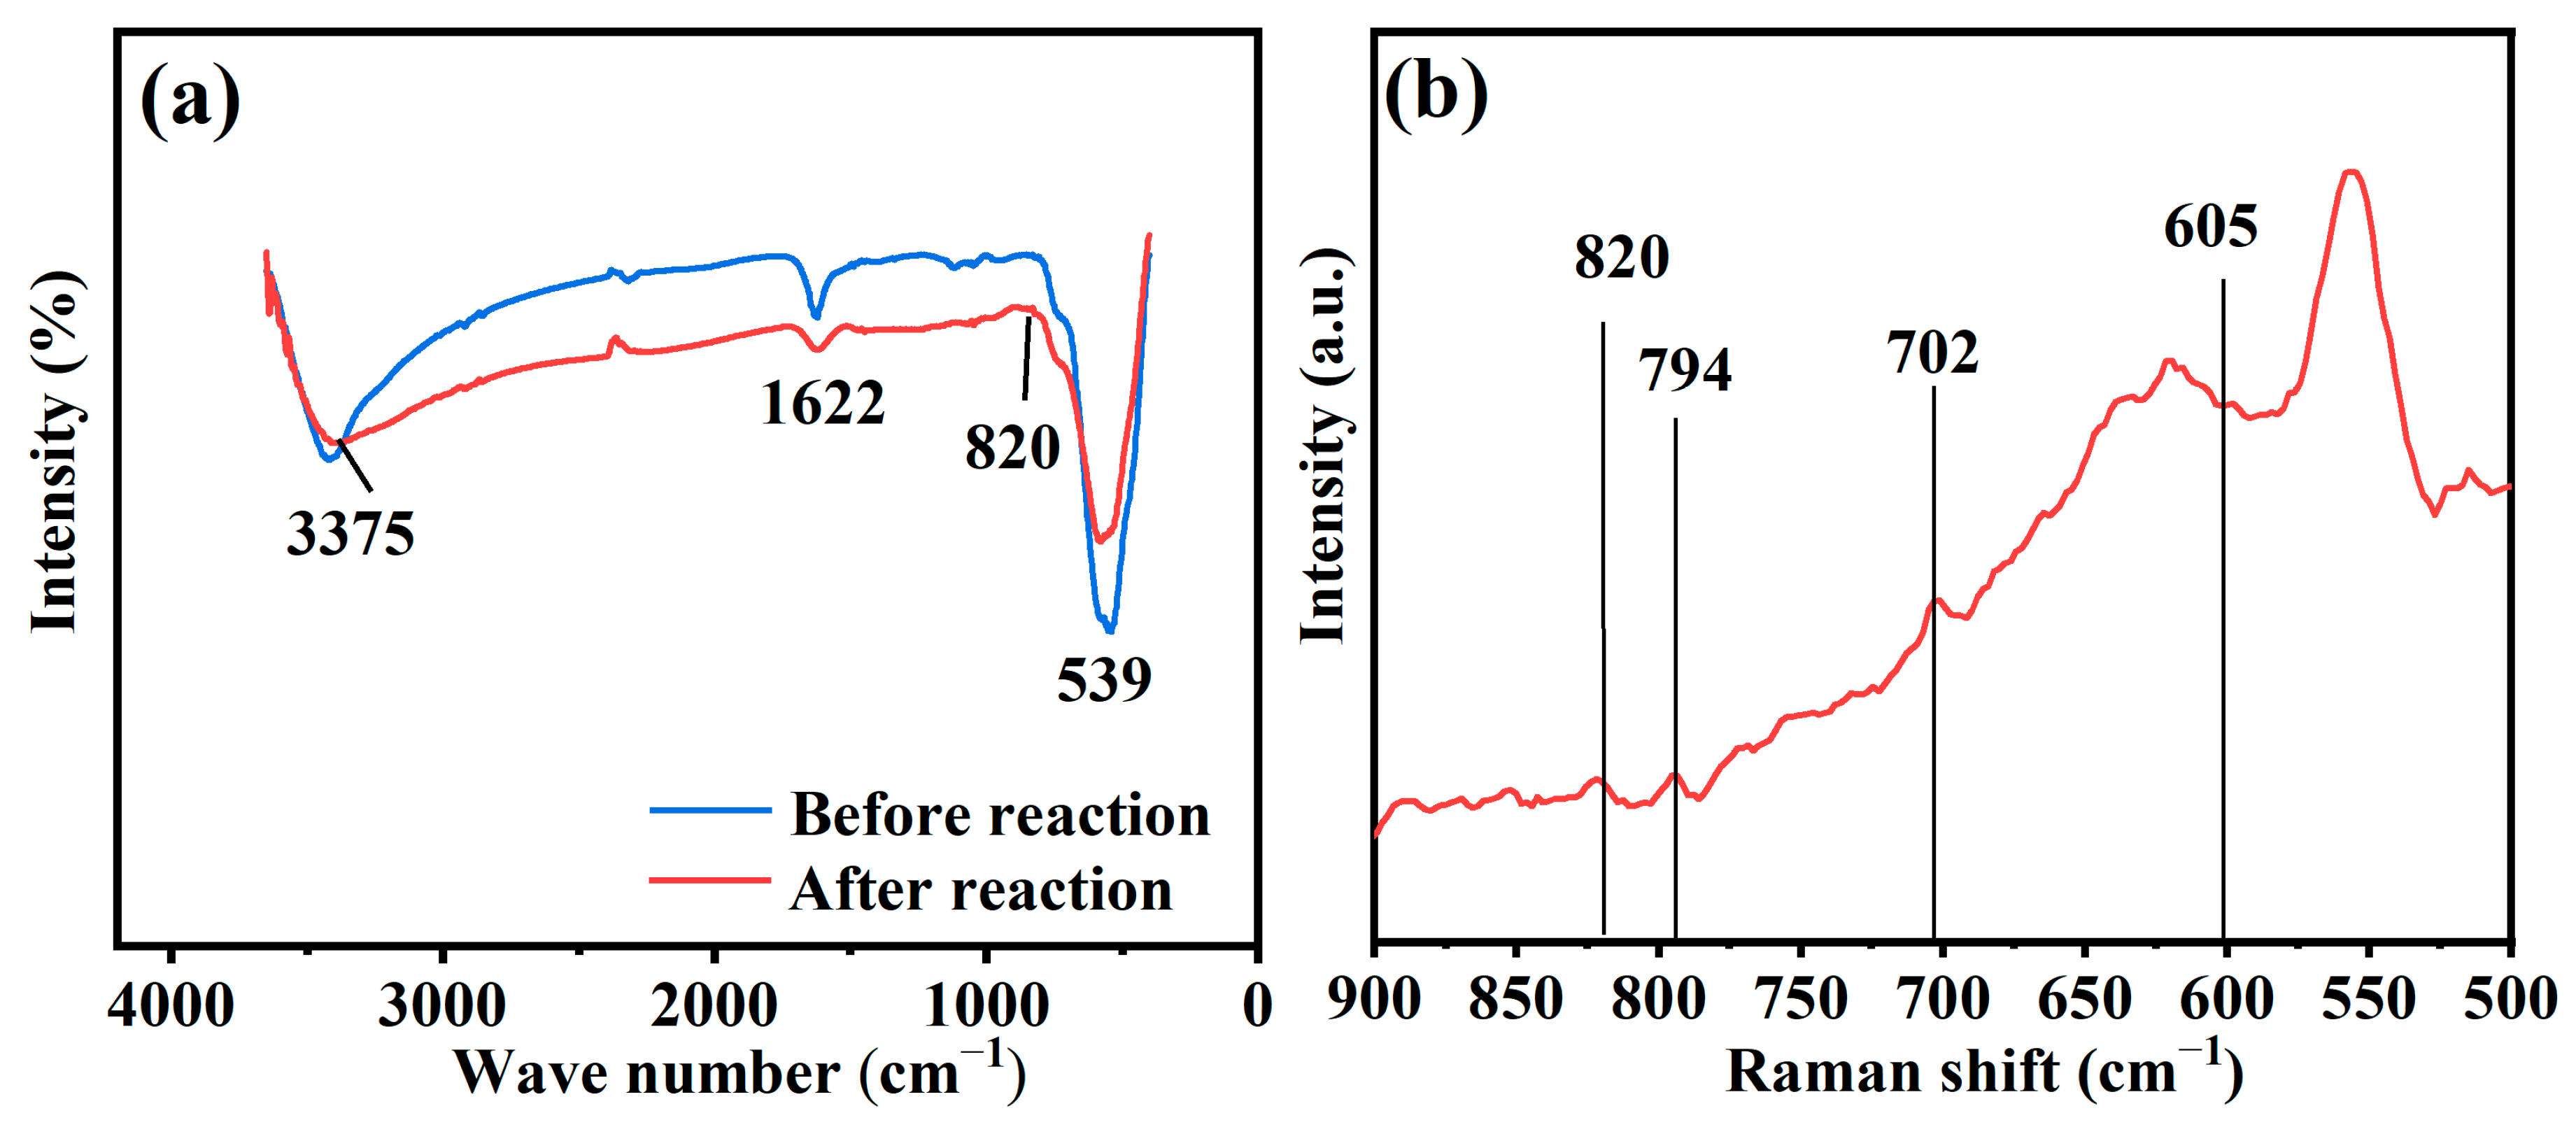
The Fourier-transform infrared spectroscopy (FTIR) spectra before and after As (III) adsorption on the MnO2′s surface are shown in Figure 5a. the shift of the peak from 3399 cm−1 to 3375 cm−1 and the prominent reduction in the peak area around 530 cm−1 indicated the involvement of a hydroxyl group on the MnO2′s surface (Mn-OH) in the As (III) adsorption process [39]. The adsorption of As (III) on the MnO2′s surface via complexation was further confirmed by the Raman spectra (shown in Figure 5b). The vibration peaks at 605 cm−1 and 702 cm−1 represented the formation of As-OH [40]. Moreover, the presence of peaks at 794 cm−1 corresponding to As (III)-O and 820 cm−1 corresponding to As (V)-O [40] indicates that both the adsorption of As (III) and the oxidation of As (III) to As (V) occurred concurrently within the MnO2–H2O2 system. It was deduced that the substitution of hydroxyl groups on the MnO2′s surface (Mn-OH) via As led to the formation of surface complexes, resulting in the adsorption of As.
In addition to FTIR and Raman spectra, X-ray photoelectron spectroscopy (XPS) was employed to further analyze and identify the chemical states of the elements on the surface of MnO2 before and after the removal of As (III). As shown in Figure 6a, besides the characteristic peaks of C1s at 284.5 eV, O1s at 529.2 eV, Mn2p3/2 at 641.5 eV, and Mn2p1/2 at 653.2 eV, the appearance of the characteristic peak of As3d at 45.3 eV after the As (III) removal process verified the effective adsorption of As on the MnO2′s surface [41]. It has been reported in previous studies that the binding energies of As3d for As (III) and As (V) in arsenic oxide were 45.2–45.6 eV and 44.2–44.6 eV, respectively [42,43]. As shown in the inset of Figure 6a, the peak area ratios of As (III) and As (V) were determined to be 18.9% and 81.1%, respectively. This finding indicates that a significant portion of As (III) was oxidized to As (V) during the removal process. Figure 6b illustrates the spectrum of Mn2p on the surface of MnO2 before and after As (III) adsorption. Prior to As (III) adsorption, the energy spacing between Mn2p3/2 and Mn2p1/2, which was approximately 11.7 eV, and the Mn2p3/2 peak at 641.9 eV suggested an oxidation state of +4 for the Mn in MnO2 [44]. After the adsorption of As (III), the peak of Mn2p3/2 can be divided into three overlapped peaks representing Mn4+ at 642.7 eV, Mn3+ at 641.7 eV, and Mn2+ at 640.4 eV [20], with the peak area ratios at Mn4+:Mn3+:Mn2+ = 37.4:17.1:45.5. It can be inferred that the reduction of Mn (IV) to Mn (III)/Mn (II) took place during the As (III) removal process, and this reduction might have been induced by the adsorbed As (III). Figure 6c,d show the results of the changes in the O1s spectra further detected before and after As (III) removal. It is known that O1s spectra can be deconvoluted into three overlapping peaks corresponding to oxide oxygen (O2−, 529.5 eV), a hydroxyl group (-OH, 530.9 eV), and adsorbed water (H2O, 532.0 eV) [39,45]. The results demonstrated a significant decrease in the peak area ratio of the -OH group from approximately 39.3% to 31.9% after As adsorption. This observation aligns with the Raman spectrum findings, thereby confirming the crucial role of -OH groups in the removal of As. Moreover, the prominent increase in the peak area ratio of O2− from about 56.5% to 63.7% was possibly caused by the ligand exchange between AsO2 and the -OH group on the surface resulting in the formation of surface complexes [16].
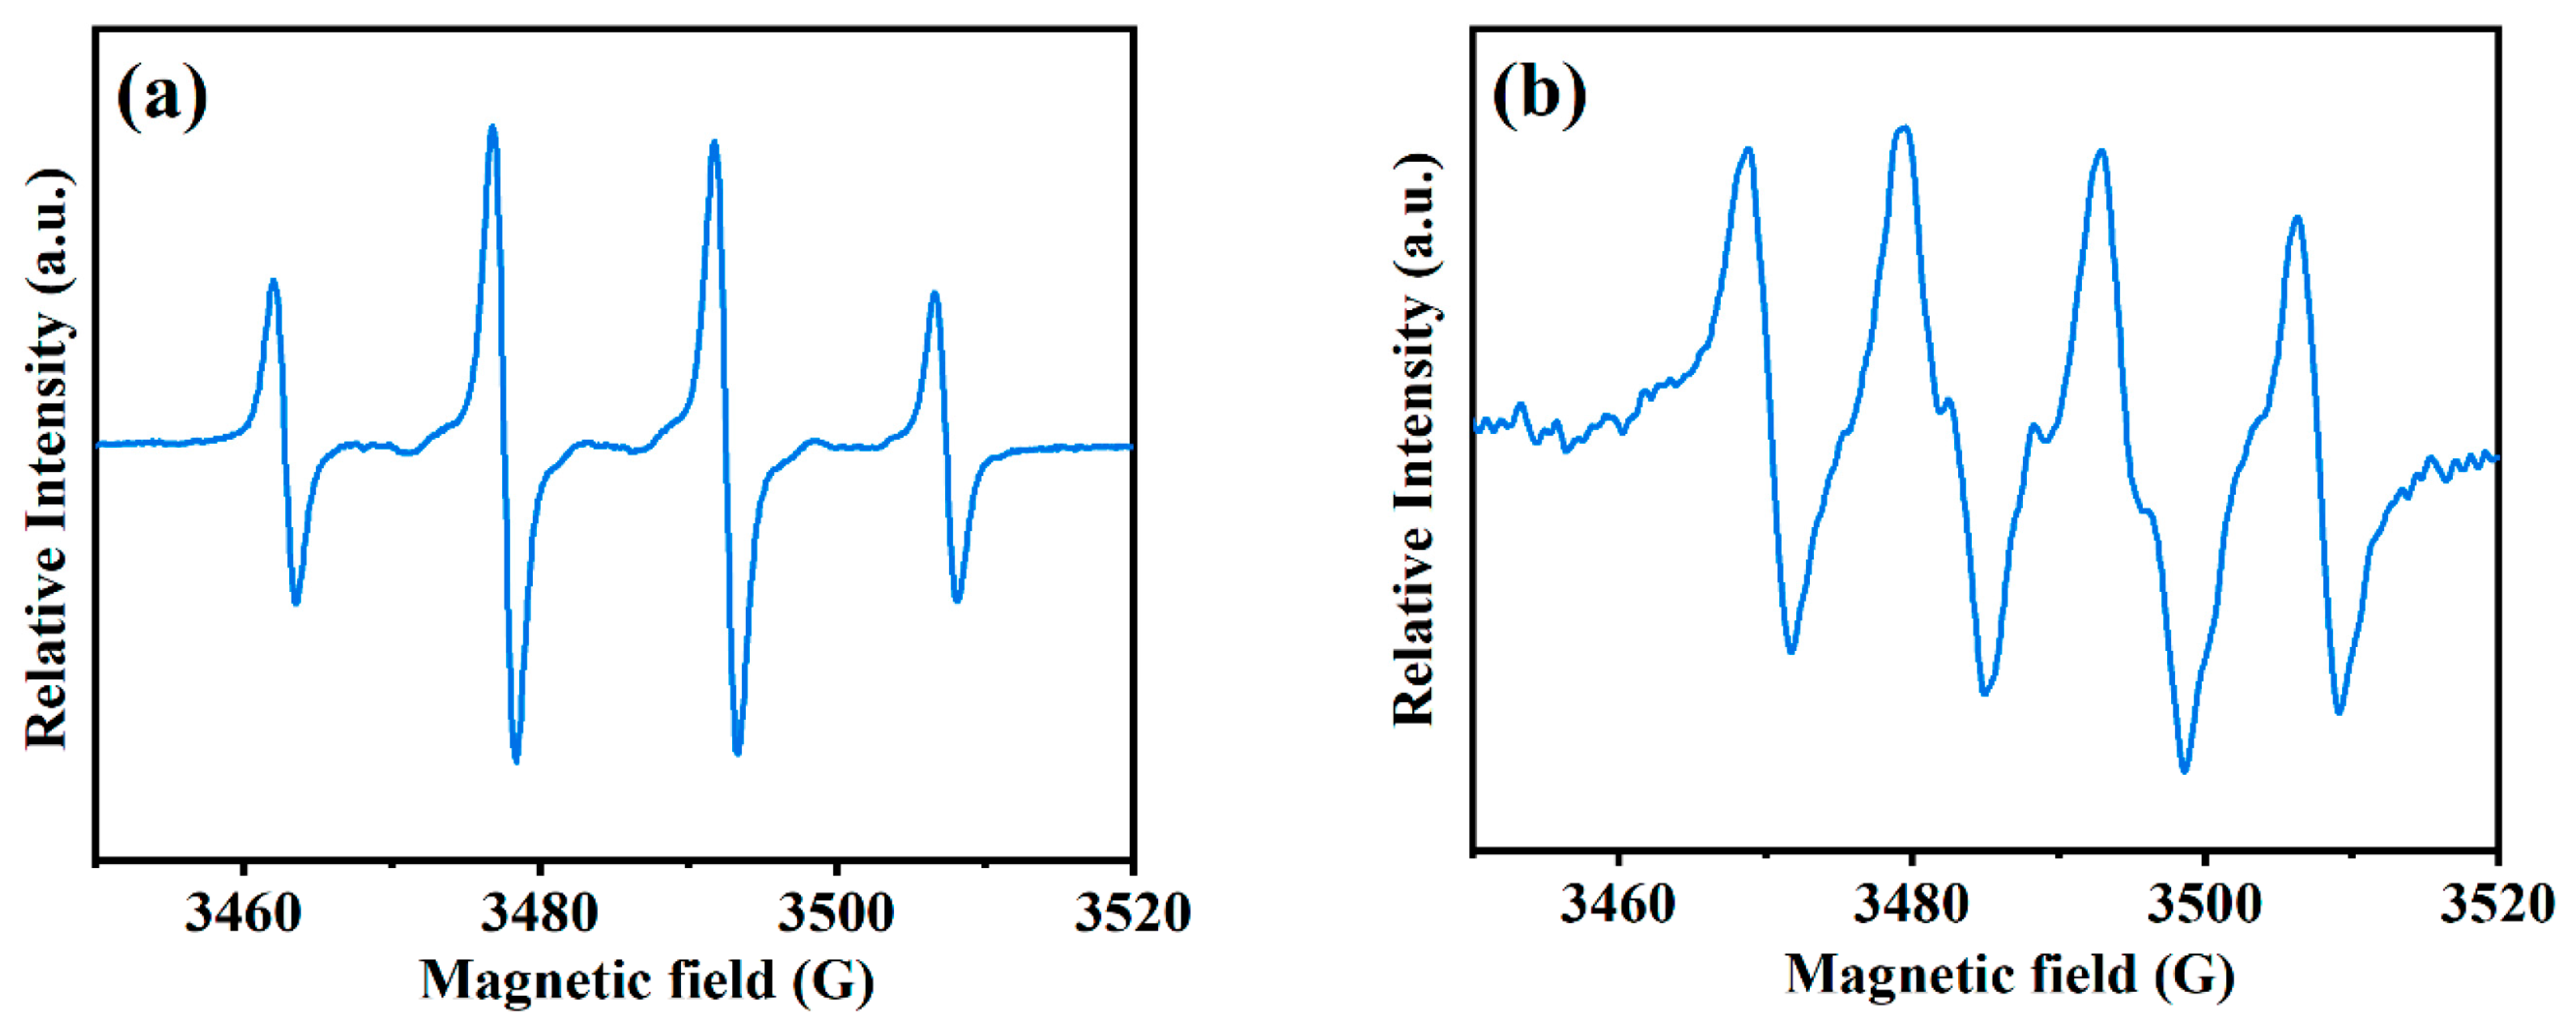
It has been reported that both •OH and •O2 can be generated in the H2O2–MnO2 system. In this study, electron paramagnetic resonance (ESR) tests were also conducted to identify the reactive oxygen species (ROS) in the H2O2–MnO2 system, using DMPO as the spin-trapping reagent for both •OH and •O2. As shown in Figure 7a, the characteristic spectrum with four peaks representing DMPO-•OH (special hyperfine coupling constants: αN = αH = 14.9 G) could be identified [46]. It should be noted that methanol rather than water was used as the solvent for •O2 detection to restrain the disproportionation of •O2 and quench the generated •OH. As shown in Figure 7b, four peaks with almost the same intensity (1:1:1:1) were observed, which belonged to the typical peaks of the DMPO-OOH adduct (special hyperfine coupling constants: αN = 14.3 G and αH = 11.7 G). So, the ESR results demonstrated that both •OH and •O2 were generated in the H2O2–MnO2 system. Theoretically, the catalytic decomposition of H2O2 by MnO2 is complicated, involving the following typical reactions [25,47]
H2O2 + [≡MnO2]OH ⟶ [≡MnO2]OH-H2O2
[≡MnO2]OH-H2O2 ⟶ [≡MnO2] + HOO• + H2O
H2O2 + HOO• ⟶ H2O + •OH + O2
[≡MnO2] + H2O2 ⟶ [≡MnO2]H + HOO
[≡MnO2]OH+ HOO ⟶ [≡MnO2] + H2O + •O2
HOO• + OH ⟶ •O2 + H2O
where [≡MnO2]OH-H2O2 represents the initial transition state of MnO2 bonded with H2O2. It can be seen that free radicals, including •OH and •O2, and oxygen could be generated simultaneously from the catalytic decomposition of H2O2.
To demonstrate the combined adsorption and oxidation processes for As removal, the concentrations of As (III), As (IV), and total As, which were equal to As (III) + As (V) in solution, were monitored. Their trends are summarized and shown in Figure 8. It was found that the concentrations of both As (III) and total As decreased quickly within the first 20 min, resulting in the removal of 80–90% of the total As. Meanwhile, the concentration of As (V) in solution first increased with the decline in As (III) during the first 10 min and then gradually decreased until 30 min. The trend of As (V) can be explained by the difference in the adsorption rate and oxidation rate. During the initial 10 min, the rate of oxidation of As (III) to As (V) was higher than the rate of the adsorption of As (V), resulting in the accumulation of As (V) in the solution. From 10 min to 30 min, the oxidation rate gradually decreased as a result of the ongoing consumption of reactants, including H2O2 and As (III). Consequently, the adsorption of As (V) became the dominant process, leading to a decrease in the concentration of As (V) in the solution. Finally, the overall system reached a dynamic balance, with almost constant As (III), As (V), and total As concentrations after 30 min.
From the results of the aforementioned tests, it could be deduced that the removal of As by the H2O2–MnO2 system was attributed to the combination of adsorption and oxidation. On the one hand, the oxidation of As (III) to As (V) occurred through the action of oxidants present in the system, including MnO2, H2O2, and free radicals such as •OH and •O2. On the other hand, both As (III) and As (V) could be adsorbed onto the surface of MnO2 through complexation processes. The superior enhancement of As removal by the H2O2–MnO2 system compared with that of the system containing only MnO2 was attributed to the synergistic effect of H2O2 and MnO2 resulting in the generation of abundant O2 and free radicals.

3.4. Influences of Environmental Factors and Practical Applications

Figure 9 demonstrates the influences of representative environmental factors, including temperature, pH and electrolytes, on the performance of the H2O2–MnO2 system with respect to As removal. As shown in Figure 9a, it is evident that the removal rate of As gradually increased as the temperature was raised from 15 °C to 45 °C. Furthermore, remarkable As removal performance, amounting to a removal efficiency higher than 75% (for reference, the initial As concentration was set to 100 µg/L), could always be achieved after 20 min even when the temperature was set as low as 15 °C. These results reveal the outstanding temperature adaptability of the H2O2–MnO2 system. It should be pointed out that according to the thermodynamic calculation shown in Table 1, the adsorption of As was deduced as an exothermic process. However, the calculated value of ΔH0 (−0.939 kJ·mol−1), which was around zero, implied that temperature might not significantly influence As removal from the perspective of the intrinsic thermodynamic properties of the adsorption process. It is possible that the higher decomposition rate of H2O2 at higher temperatures, leading to the faster generation of free radicals and oxygen, may account for the better performance of H2O2–MnO2 system with respect to As removal.
It has been proved that pH can influence the reaction between MnO2 and H2O2 by changing the structure of MnO2 and reaction processes [25]. As shown in Figure 9b, the adsorption capacity of the H2O2–MnO2 system remained almost constant and at a high level when the pH was between six and eight. At pH = 7, qe was calculated to be 3.3 mg/L. However, when the pH was lower than 4 or higher than 10, a marked decline in As removal was observed. The decline in the performance of the H2O2–MnO2 system can be attributed to the states of MnO2. When the pH was lower than four, the acidic condition resulted in the dissolution of MnO2; when pH was greater than ten, the surface charge of MnO2 was prominently negative, which significantly inhibited the effective adsorption of negatively charged AsO2 ions (pK1 = 9.2) [48].
The influence of typical ions on the performance of the H2O2–MnO2 system was also studied. As shown in Figure 9c, the typical cations in natural water, including Ca2+, Na+, and Mg+, demonstrated almost no influence on As removal via the H2O2–MnO2 system, even though their concentrations in the experiments (up to 1 mmol/L) were much higher than that of As (100 µg/L). On the contrary, Figure 9c also indicates that besides Cl, the other tested anions, including HCO3, SiO32−, and HPO42−, could significantly inhibit As adsorption. The inhibition effects of anions on As removal were possibly attributed to their competition with AsO2 and AsO43− for the adsorption sites on the adsorbents [49].
Finally, the H2O2–MnO2 system’s As removal performance using groundwater and river water as the natural solvent was tested. As shown in Figure 9d, when the initial As concentration was about 100 µg/L, a high removal efficiency (>90%) could be achieved within 40 min in both aquatic media. The remaining As concentration in the water was lower than 10 µg/L, which is accordance with the maximum contaminant level for drinking water set by the WHO. Furthermore, extensive studies have revealed that the number of manganese ions leached resulting from the reaction between MnO2 and H2O2 increased from 1 ppb to 3.1 ppm as the pH decreased from 9 to 3 [25]. In particular, for natural water, which commonly has a neutral pH of around 7, the leaching amount of manganese ions has been reported to be negligible, amounting to a value of 5 ppb [25].
The desorption of adsorbed As for the regeneration of MnO2 particles using NaOH solution (0.5 M) and their reusability were also tested. The results indicated that the qe of MnO2 decreased gradually from 3.2 mg/g to 2.0 mg/g after four runs of consecutive adsorption and regeneration (shown in Supporting Information), indicating that most of the activated sites on the MnO2 surface could be reactivated by replacing the adsorbed AsO32− and AsO43− with OH. Although the results indicated that As adsorption on the MnO2 via chemisorption through the formation of inner-sphere surface complexes is not completely reversible, the regeneration ratio of MnO2, with a value of more than 60% (2.0/3.2 = 0.625), demonstrates the MnO2–H2O2 system’s applicatory potential in the practical water treatment process.

4. Conclusions

In this study, a highly efficient MnO2–H2O2 system designed for the degradation of As was successfully established. A trace H2O2 dosage, a short reaction time, a high removal efficiency of As, the lack of a requirement for external mechanical stirring, and the high environmental adaptability observed demonstrated the system’s great potential with respect to practical water treatment. The systematic characterization of the MnO2 and ESR tests revealed that the effective removal of As was mainly attributed to the combined oxidation–adsorption mechanism. Although the MnO2–H2O2 system demonstrated the mentioned advantages, it should be noted that attention should still be paid to monitoring the pH of the system when applying it for practical water treatment in order to prevent possible secondary contamination caused by the released manganese ions. Furthermore, future studies will continue to concentrate on the application of the MnO2–H2O2 system to treating real wastewater that contains As.

Supplementary Materials

The following supporting information can be downloaded at: https://www.mdpi.com/article/10.3390/su15119080/s1, S1: The detailed description of simulation for kinetic curves; S2: Simulation of isotherm; S3: Simulation of thermodynamics; S4: Detailed histogram of regeneration and reuse of MnO2 particles; S5: More SEM-EDS images of MnO2 particles; S6: Characteristics of ground water and river water used in the experiments are shown in the Supporting Information.

Author Contributions

Investigation, Y.W.; Writing—original draft, Q.L.; Writing—review & editing, Y.Z., Z.S. and X.H.; Supervision, J.M. All authors have read and agreed to the published version of the manuscript.

Funding

This work was supported by the National Key Research and Development Program of China (Grant No. 2019YFD1100104); Postdoctoral Science Foundation Grant, China (Grant No. 2020T130152); Cooperative Researching Project of Chunhui Program, Ministry of Education, China (Grant No. HLJ2019006); Open Project of State Key Laboratory of Urban Water Resource and Environment, Harbin Institute of Technology (Grant No. QA202008); National Natural Science Foundation of China (Grant No. 52000048).

Conflicts of Interest

The authors declare no conflict of interest.

References

  1. Williams, M. Arsenic in mine waters: An international study. Environ. Geol. 2001, 40, 267–278. [Google Scholar] [CrossRef]
  2. World Health Organization. Guidelines for Drinking-water Quality, 4th ed.; WHO Press: Geneva, Switzerland, 2011; Volume 38, pp. 104–108. [Google Scholar]
  3. Jain, C.K.; Ali, I. Arsenic: Occurrence, toxicity and speciation techniques. Water Res. 2000, 34, 4304–4312. [Google Scholar] [CrossRef]
  4. Gibbon-Walsh, K.; Salaun, P.; Berg, C.M.V.D. Arsenic speciation in natural waters by cathodic stripping voltammetry. Anal. Chim. Acta 2010, 662, 1–8. [Google Scholar] [CrossRef]
  5. Smedley, P.L.; Kinniburgh, D.G. A review of the source, behaviour and distribution of arsenic in natural waters. Appl. Geochem. 2002, 17, 517–568. [Google Scholar] [CrossRef] [Green Version]
  6. Mohan, D.; Pittman, C.U., Jr. Arsenic removal from water/wastewater using adsorbents—A critical review. J. Hazard. Mater. 2007, 142, 1–53. [Google Scholar] [CrossRef]
  7. Singh, N.; Nagpal, G.; Agrawal, S. Rachna Water purification by using Adsorbents: A Review. Environ. Technol. Innov. 2018, 11, 187–240. [Google Scholar] [CrossRef]
  8. Mondal, P.; Bhowmick, S.; Chatterjee, D.; Figoli, A.; Van der Bruggen, B. Remediation of inorganic arsenic in groundwater for safe water supply: A critical assessment of technological solutions. Chemosphere 2013, 92, 157–170. [Google Scholar] [CrossRef] [PubMed]
  9. Bissen, M.; Frimmel, F.H. Arsenic— a Review. Part II: Oxidation of Arsenic and its Removal in Water Treatment. Acta Hydrochim. et Hydrobiol. 2003, 31, 97–107. [Google Scholar] [CrossRef]
  10. Habuda-Stanić, M.; Nujić, M. Arsenic removal by nanoparticles: A review. Environ. Sci. Pollut. Res. 2015, 22, 8094–8123. [Google Scholar] [CrossRef]
  11. Hou, S.; Ding, W.; Liu, S.; Zheng, H.; Zhai, J.; Yang, L.; Zhong, Z. Fast oxidation and deep removal of As(III) by integrating metal–organic framework ZIF-67 and sulfite: Performance and mechanism. Chem. Eng. J. 2023, 460. [Google Scholar] [CrossRef]
  12. Lin, Z.; Deng, F.; Ren, W.; Wang, Z.; Xiao, X.; Shao, P.; Zou, J.; Luo, X. Integration of adsorption and simultaneous heterogeneous catalytic oxidation by defective CoFe2O4 activated peroxymonosulfate for efficient As (III) removal: Performance and new insight into the mechanism. Chem. Eng. J. 2023, 454, 139960. [Google Scholar] [CrossRef]
  13. Park, H.; Choi, H. As(III) removal by hybrid reactive membrane process combined with ozonation. Water Res. 2011, 45, 1933–1940. [Google Scholar] [CrossRef] [PubMed]
  14. Sorlini, S.; Gialdini, F. Conventional oxidation treatments for the removal of arsenic with chlorine dioxide, hypochlorite, potassium permanganate and monochloramine. Water Res. 2010, 44, 5653–5659. [Google Scholar] [CrossRef]
  15. Zhang, W.; Zhang, G.; Liu, C.; Li, J.; Zheng, T.; Ma, J.; Wang, L.; Jiang, J.; Zhai, X. Enhanced removal of arsenite and arsenate by a multifunctional Fe-Ti-Mn composite oxide: Photooxidation, oxidation and adsorption. Water Res. 2018, 147, 264–275. [Google Scholar] [CrossRef]
  16. Chen, J.; Wang, J.; Zhang, G.; Wu, Q.; Wang, D. Facile fabrication of nanostructured cerium-manganese binary oxide for enhanced arsenite removal from water. Chem. Eng. J. 2018, 334, 1518–1526. [Google Scholar] [CrossRef]
  17. Gupta, K.; Ghosh, U.C. Arsenic removal using hydrous nanostructure iron(III)–titanium(IV) binary mixed oxide from aqueous solution. J. Hazard. Mater. 2009, 161, 884–892. [Google Scholar] [CrossRef]
  18. Ding, W.; Wan, X.; Zheng, H.; Wu, Y.; Muhammad, S. Sulfite-assisted oxidation/adsorption coupled with a TiO2 supported CuO composite for rapid arsenic removal: Performance and mechanistic studies. J. Hazard. Mater. 2021, 413, 125449. [Google Scholar] [CrossRef] [PubMed]
  19. Ferguson, M.A.; Hoffmann, M.R.; Hering, J.G. TiO2-Photocatalyzed As(III) Oxidation in Aqueous Suspensions: Reaction Kinetics and Effects of Adsorption. Environ. Sci. Technol. 2005, 39, 1880–1886. [Google Scholar] [CrossRef]
  20. Cai, X.; Li, Y.; Guo, J.; Liu, S.; Na, P. Mn(IV) promotion mechanism for the photocatalytic oxidation of arsenite by anatase-TiO2. Chem. Eng. J. 2014, 248, 9–17. [Google Scholar] [CrossRef]
  21. Zhao, Z.; Jia, Y.; Xu, L.; Zhao, S. Adsorption and heterogeneous oxidation of As(III) on ferrihydrite. Water Res. 2011, 45, 6496–6504. [Google Scholar] [CrossRef]
  22. Manning, B.A.; Fendorf, S.E.; Bostick, B.; Suarez, D.L. Arsenic(III) Oxidation and Arsenic(V) Adsorption Reactions on Synthetic Birnessite. Environ. Sci. Technol. 2002, 36, 976–981. [Google Scholar] [CrossRef] [Green Version]
  23. Wei, Z.; Wang, Z.; Yan, J.; Liu, Y.; Wu, Y.; Fang, Y.; Yu, L.; Cheng, G.; Pan, Z.; Hu, G. Adsorption and oxidation of arsenic by two kinds of β-MnO2. J. Hazard. Mater. 2019, 373, 232–242. [Google Scholar] [CrossRef] [PubMed]
  24. Scott, M.J.; Morgan, J.J. Reactions at Oxide Surfaces. 1. Oxidation of As(III) by Synthetic Birnessite. Environ. Sci. Technol. 1995, 29, 1898–1905. [Google Scholar] [CrossRef] [PubMed]
  25. Do, S.-H.; Batchelor, B.; Lee, H.-K.; Kong, S.-H. Hydrogen peroxide decomposition on manganese oxide (pyrolusite): Kinetics, intermediates, and mechanism. Chemosphere 2009, 75, 8–12. [Google Scholar] [CrossRef]
  26. Zhang, Y.; Liu, C.; Xu, B.; Qi, F.; Chu, W. Degradation of benzotriazole by a novel Fenton-like reaction with mesoporous Cu/MnO2: Combination of adsorption and catalysis oxidation. Appl. Catal. B Environ. 2016, 199, 447–457. [Google Scholar] [CrossRef]
  27. He, X.; Sun, B.; He, M.; Chi, H.; Wang, Z.; Zhang, W.; Ma, J. Highly efficient simultaneous catalytic degradation and defluorination of perfluorooctanoic acid by the H2O2-carbon/MnO2 system generating O2- and OH synchronously. Appl. Catal. B Environ. 2020, 277, 119219. [Google Scholar] [CrossRef]
  28. He, X.; Li, B.; Wang, P.; Ma, J. Novel H2O2–MnO2 system for efficient physico-chemical cleaning of fouled ultrafiltration membranes by simultaneous generation of reactive free radicals and oxygen. Water Res. 2019, 167, 115111. [Google Scholar] [CrossRef] [PubMed]
  29. He, X.; Bahk, Y.K.; Wang, J. Organic dye removal by MnO2 and Ag micromotors under various ambient conditions: The comparison between two abatement mechanisms. Chemosphere 2017, 184, 601–608. [Google Scholar] [CrossRef]
  30. Chang, Y.; Cho, Y.-C.; Lin, Y.-P. Degradation of PFOS by a MnO2/H2O2 process. Environ. Sci. Water Res. Technol. 2020, 6, 3476–3487. [Google Scholar] [CrossRef]
  31. Chen, X.; Li, Y.; Fu, W.; Tien, S.; Yang, Y.; Yang, K.; Xu, X.; Zhang, X. Oriented generation of singlet oxygen in H2O2 activation for water decontamination: Regulation of oxygen vacancy over α-MnO2 nanocatalyst. Environ. Sci. Nano 2023. [Google Scholar] [CrossRef]
  32. Wang, J.; Jing, Y. Inhibition of iron chelate degradation in liquid redox desulfurization by nanoscale MnO2 through H2O2 decomposition. J. Chem. Technol. Biotechnol. 2023, 98, 1395–1401. [Google Scholar] [CrossRef]
  33. Lu, Y.; Deng, H.; Pan, T.; Liao, X.; Zhang, C.; He, H. Effective Toluene Ozonation over δ-MnO2: Oxygen Vacancy-Induced Reactive Oxygen Species. Environ. Sci. Technol. 2023, 57, 2918–2927. [Google Scholar] [CrossRef]
  34. Le, S.; Yan, B.; Mao, Y.; Chi, D.; Zhu, M.; Jia, H.; Zhao, G.; Zhu, X.; Zhang, N. N-doped δ-MnO2 coated N-doped carbon cloth as stable cathode for aqueous zinc-ion batteries. Int. J. Electrochem. Sci. 2023, 18, 1–8. [Google Scholar] [CrossRef]
  35. Wang, H.; Liang, M.; Gao, J.; Ma, C.; He, Z.; Zhao, Y.; Miao, Z. Robust structural stability of flower-like δ-MnO2 as cathode for aqueous zinc ion battery. Colloids Surf. A Physicochem. Eng. Asp. 2022, 643, 128804. [Google Scholar] [CrossRef]
  36. Langmuir, I. The constitution and fundamental properties of solids and liquids. Part I. Solids. J. Am. Chem. Soc. 1916, 38, 2221–2295. [Google Scholar] [CrossRef] [Green Version]
  37. Freundlich, H.M.F. Uber die Adsorption in Losungen. Z. fÜR Phys. Chem. 1906, 57, 385–470. [Google Scholar] [CrossRef]
  38. Unuabonah, E.; Adebowale, K.; Olu-Owolabi, B. Kinetic and thermodynamic studies of the adsorption of lead (II) ions onto phosphate-modified kaolinite clay. J. Hazard. Mater. 2007, 144, 386–395. [Google Scholar] [CrossRef] [PubMed]
  39. Zhang, Y.; Yang, M.; Dou, X.-M.; He, H.; Wang, D.-S. Arsenate Adsorption on an Fe−Ce Bimetal Oxide Adsorbent: Role of Surface Properties. Environ. Sci. Technol. 2005, 39, 7246–7253. [Google Scholar] [CrossRef]
  40. Goldberg, S.; Johnston, C. Mechanisms of Arsenic Adsorption on Amorphous Oxides Evaluated Using Macroscopic Measurements, Vibrational Spectroscopy, and Surface Complexation Modeling. J. Colloid Interface Sci. 2001, 234, 204–216. [Google Scholar] [CrossRef]
  41. Su, C.; Puls, R.W. Arsenate and Arsenite Removal by Zerovalent Iron: Kinetics, Redox Transformation, and Implications for in Situ Groundwater Remediation. Environ. Sci. Technol. 2001, 35, 1487–1492. [Google Scholar] [CrossRef] [PubMed]
  42. Nesbitt, H.; Canning, G.; Bancroft, G. XPS study of reductive dissolution of 7Å-birnessite by H3AsO3, with constraints on reaction mechanism. Geochim. et Cosmochim. Acta 1998, 62, 2097–2110. [Google Scholar] [CrossRef]
  43. Khalaf, M.M.; El-Lateef, H.M.A.; A Mohamed, I.M. Novel electrocatalysts for ethylene glycol oxidation based on functionalized phosphates of bimetals Mn/Ni: Morphology, crystallinity, and electrocatalytic performance. Surfaces Interfaces 2023, 38. [Google Scholar] [CrossRef]
  44. Nesbitt, H.W.; Banerjee, D. Interpretation of XPS Mn(2p) spectra of Mn oxyhydroxides and constraints on the mechanism of MnO2precipitation. Am. Miner. 1998, 83, 305–315. [Google Scholar] [CrossRef]
  45. Guo, Z.; Li, C.; Gao, M.; Han, X.; Zhang, Y.; Zhang, W.; Li, W. Mn−O Covalency Governs the Intrinsic Activity of Co-Mn Spinel Oxides for Boosted Peroxymonosulfate Activation. Angew. Chem. Int. Ed. 2020, 60, 274–280. [Google Scholar] [CrossRef] [PubMed]
  46. Shi, H.; Timmins, G.; Monske, M.; Burdick, A.; Kalyanaraman, B.; Liu, Y.; Clément, J.-L.; Burchiel, S.; Liu, K.J. Evaluation of spin trapping agents and trapping conditions for detection of cell-generated reactive oxygen species. Arch. Biochem. Biophys. 2005, 437, 59–68. [Google Scholar] [CrossRef] [PubMed]
  47. Sorge, A.R.; Turco, M.; Pilone, G.; Bagnasco, G. Decomposition of Hydrogen Peroxide on MnO2/TiO2 Catalysts. J. Propuls. Power 2004, 20, 1069–1075. [Google Scholar] [CrossRef]
  48. Stumm, W. Chemistry of the Solid-Water Interface: Processes at the Mineral-Water and Particle-Water Interface in Natural Systems. John Wiley & Son Inc.: New York, NY, USA, 1992; p. 520. [Google Scholar]
  49. Ren, Z.; Zhang, G.; Chen, J.P. Adsorptive removal of arsenic from water by an iron–zirconium binary oxide adsorbent. J. Colloid Interface Sci. 2011, 358, 230–237. [Google Scholar] [CrossRef] [PubMed]
Figure 1. Characteristics of the synthesized MnO2 particles: (a) SEM image; (b) TEM image (c) HR-TEM image (d) XRD pattern; (e) adsorption–desorption curves of BET tests; (f) size distribution of MnO2 agglomerates dispersed in water.
Sustainability 15 09080 g001
Figure 2. Key operating parameters for As removal: (a) comparison between H2O2 addition and mechanical stirring with respect to As removal (experimental conditions: MnO2—25 mg/L; H2O2—0.015 wt%); (b) comparison of As (III) and As (V) removal (experimental conditions: MnO2—25 mg/L; H2O2—0.015 wt%); (c) influence of H2O2 and MnO2 dosage on As removal (experimental conditions: initial As (III)—100 μg/L); (d) kinetics of As removal (experimental conditions: H2O2—0.015 wt%; initial As (III)—100 μg/L).
Sustainability 15 09080 g002
Figure 3. Simulation of adsorption kinetics and isotherms (experimental conditions: MnO2—25 mg/L; H2O2—0.015 wt%; initial As (III)—100 μg/L). (a) Pseudo-second-order model; (b) Freundlich model.
Sustainability 15 09080 g003
Figure 4. SEM-EDS mapping of MnO2 particles after adsorption of As. (From left to right: images of oxygen, manganese, and arsenic.)
Sustainability 15 09080 g004
Figure 5. FTIR and Raman Spectra of MnO2 particles: (a) FTIR spectrum; (b) Raman spectrum.
Sustainability 15 09080 g005
Figure 6. XPS core-level spectra of MnO2 surface before and after As adsorption: (a) full spectrum; (b) Mn2p; (c) O1s before As adsorption; (d) O1s after As adsorption.
Sustainability 15 09080 g006
Figure 7. ESR spectra for the reactive free radicals generated in H2O2–MnO2 system: (a) DMPO-OH adducts in water; (b) DMPO-OOH adducts in H2O2–MnO2 systems in methanol.
Sustainability 15 09080 g007
Figure 8. Trends of total As, As (III), and As (V) concentrations during the adsorption–oxidation process (experimental conditions: MnO2—25 mg/L; H2O2—0.015 wt%; initial As (III)—100 μg/L).
Sustainability 15 09080 g008
Figure 9. Influence of representative environmental factors on the performance of H2O2–MnO2 system with respect to As removal (experimental conditions: MnO2—25 mg/L; H2O2—0.015 wt%; initial As (III)—100 μg/L): (a) influence of temperature; (b) influence of pH; (c) influence of typical ions; (d) system tested in river water and ground water.
Sustainability 15 09080 g009
Table 1. Thermodynamic parameters for the adsorption of As on MnO2.
Temperature
(K)
ΔG0
(kJ·mol−1)
ΔH0
(kJ·mol−1)
ΔS0
(kJ·mol−1·K)
288.15−4.421−0.93912.112
298.15−4.557
308.15−4.686
318.15−4.780
Disclaimer/Publisher’s Note: The statements, opinions and data contained in all publications are solely those of the individual author(s) and contributor(s) and not of MDPI and/or the editor(s). MDPI and/or the editor(s) disclaim responsibility for any injury to people or property resulting from any ideas, methods, instructions or products referred to in the content.