Abstract
Accurate hydrological simulations are crucial for managing water resources and promoting sustainable agriculture in submerged paddy agricultural watersheds. The SWAT-MODFLOW, which couples the Soil and Water Assessment Tool (SWAT) and the Modular Groundwater Flow (MODFLOW) model, is a widely used tool for hydrologic simulations that consider surface water and groundwater (SW-GW) interactions. However, it falls short of effectively simulating the hydrological processes of submerged rice paddy field areas. To address this, we developed the hourly SWAT-MODFLOW-PADDY model, which enables integrated surface and groundwater simulations and effectively represents the hydrological responses of submerged paddy fields to high-resolution rainfall data. Our findings demonstrated that the hourly SWAT-MODFLOW-PADDY model could dynamically simulate soil moisture and runoff patterns in submerged paddy fields. Notably, the developed model showed enhanced performance throughout the entire period for hourly flow in the watershed, with an average coefficient of determination (R2) of 0.75, Nash and Sutcliffe efficiency (NSE) of 0.76, and percent bias (PBIAS) of 13.22 compared to the original model (R2 = 0.62, NSE = 0.70, PBIAS = 48.21). The model’s performance in predicting water quality was improved, and it highlighted the significant impact of complex hydrological mechanisms within submerged paddy fields on the spatial distribution of groundwater recharge and stream water volumes exchanged through SW-GW interactions. Given these promising results, the SWAT-MODFLOW-PADDY model could be a valuable resource for managing submerged paddy-dominated agricultural watersheds across various climates and regions.
1. Introduction
Rice is a crucial crop for food security, socio-economic development, and environmental conservation in Asian countries [1,2,3,4]. Paddy fields not only contribute to rice production but also provide essential ecosystem services such as flood control, groundwater recharge, water purification, and support for ecosystems [5]. These fields play a critical role in regulating groundwater levels and the return flow of groundwater to rivers, as irrigation water absorption affects groundwater recharge [6]. During low-flow periods, large volumes of irrigation water discharged from aquifers to rivers are critical for maintaining downstream baseflow and aquatic ecosystems [7,8,9]. However, excessive use of pollutants such as fertilizers and pesticides in rice fields can negatively affect river water quality and aquatic ecosystems. Moreover, the increasing frequency and intensity of abnormal weather events, such as droughts and extreme floods, exacerbate the challenges of establishing adaptive strategies for agricultural water management [10,11,12]. Therefore, comprehensive modeling approaches that consider the complex impacts of agricultural activities and surface water–groundwater (SW-GW) interactions on water resources and ecosystems are needed to ensure long-term sustainability in paddy-dominated watersheds.
In this regard, physically based watershed-scale hydrological models, such as the Soil and Water Assessment Tool (SWAT) [13], Hydrologic Simulation Program—Fortran (HSPF) [14], and SWAT-Modular Groundwater Flow (SWAT-MODFLOW) model [15], have been essential tools for making decisions on watershed management strategies and policies due to their ability to simulate streamflow and water quality for a wide range of applications [16]. Among them, the SWAT-MODFLOW model is widely used to quantify the impact of water resource management scenarios, climate change and land-use change, and the hydrological cycle on spatiotemporal SW-GW interactions at various regional and watershed scales [15,17,18,19,20,21,22].
However, the SWAT-MODFLOW model has limitations in simulating integrated SW-GW hydrology that takes into account the influence of hydrological mechanisms and agricultural activities in paddy fields. While paddy submerging simulation is possible based on the SWAT model’s cone-shaped pothole structure, it still inadequately represents the actual paddy system [23]. To improve the simulation of paddy fields in watersheds, several studies have modified the pothole module of the SWAT model [23,24,25]. For example, Sakaguchi et al. [23] introduced a new potential percolation rate parameter and modified the processes of infiltration, ponding releasing, irrigation, and evaporation in the SWAT model’s paddy module to realistically simulate water balance in paddy fields. Tsuchiya et al. [24] proposed an enhanced paddy simulation module called SWAT-Paddy, which considers the environmental impacts of paddy cultivation, such as puddling, irrigation, and drainage. Similarly, Ouyang et al. [25] modified the pothole module in the SWAT model to better represent the hydrological cycle, soil erosion, and nutrient loss in large paddy patches, and their results showed that the modified SWAT model exhibited superior performance in simulating streamflow, soil water dynamics, and diffuse pollution loads.
Previous studies have shown that modified SWAT models successfully simulate the water balance in paddy fields and the hydrology of the watershed. Nevertheless, according to Gassman et al. [26], most of the SWAT-related studies published in the literature are reported to still have limitations in the explicit simulation of rice paddy dynamics. Moreover, to the best of our knowledge, no hydrological model has been developed based on high-resolution rainfall data that considers the understanding of hydrological mechanisms in rice fields and the hydraulic connectivity of SW-GW. Unlike upland fields, the hydrological processes in paddy fields, such as runoff and continuous infiltration during submergence periods, greatly influence not only streamflow and water quality but also the amount of groundwater. Hydrological simulations that do not account for the impact of paddy fields in watersheds dominated by these fields can result in unrealistic outputs, potentially leading to unsuitable policies and decisions.
Therefore, this study aims to assess the performance of the hourly SWAT-MODFLOW-PADDY model in a submerged paddy-dominated watershed. The specific objectives include: (1) developing the hourly SWAT-PADDY module to predict hydrological behavior in submerged paddy fields using high-resolution rainfall data; (2) evaluating the effectiveness of enhancing the hourly flow and water quality prediction performance through integration with the SWAT-MODFLOW model; and (3) quantitatively comparing the impact of hydrological behavior in submerged paddies on the spatiotemporal distribution of groundwater recharge and SW-GW interactions.
2. Materials and Methods
2.1. General Characteristics of the Study Area
The Seokwon watershed is located in South Korea and spans an area of 52 km2 (Figure 1). Elevations in the watershed vary from 70 to 470 m, with an average elevation of 118.4 m and a slope of 14.1%. The soil predominantly found in the watershed, accounting for 41%, is of the ‘Ra’ type according to Korean soil classification, characterized by its loamy sand texture. Land cover in the watershed is primarily composed of forests (29.9%), followed by paddy fields (25.6%) and upland fields (22.2%). The cultivation of paddy fields for submerged rice farming is common, signifying a considerable presence of irrigated agriculture. Additionally, groundwater is highly utilized for water curtain cultivation in greenhouses located in the lower reaches of the watershed from winter to early spring each year [27]. The study area experiences an average annual precipitation of 1137 mm, with approximately 71% occurring during the Asian monsoon season, which lasts from June to September (Figure 2).
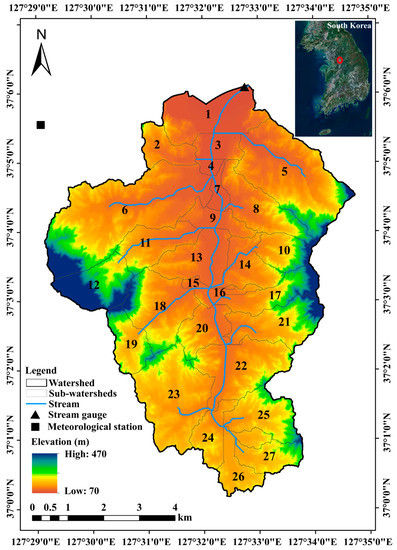
Figure 1.
The location map of the study area. The numbers within each sub-watershed represent unique identification codes.
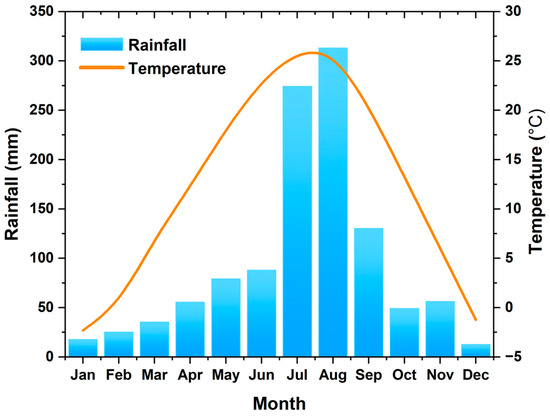
Figure 2.
Monthly rainfall and temperature patterns in the study area.
2.2. Description of SWAT-MODFLOW Model
SWAT is a semi-distributed, continuous, and physically based hydrological model designed to simulate the water, sediment, and agricultural chemicals (e.g., nutrients) in both gauged and ungauged watersheds using hydrologic response units (HRUs) with homogeneous land use, soil, and slope characteristics.
However, the model has weaknesses in its interpretation of the appropriate groundwater dynamic due to its quite simplified groundwater module [28]. MODFLOW-2005 [29] is primarily used to address the drying and rewetting nonlinearity of the unconfined groundwater flow equation, utilizing the Newton–Raphson formula of MODFLOW-2005 (MODFLOW-NWT) [30]. This model also includes several packages: Basic (BAS), Discretization for Structured Grids (DIS), Recharge (RCH), Upstream Weighting (UPW), Newton Solver (NWT), and River (RIV), which simulate hydrologic processes in both steady and transient states for a variety of aquifer types [16].
SWAT-MODFLOW is an integrated model that combines SWAT (Version 2012) and MODFLOW-NWT into a single FORTRAN executable. In the SWAT-MODFLOW model, MODFLOW is called the sub-module within the SWAT model code to simulate three-dimensional groundwater flow and all sources and sinks (e.g., recharge, pumping, discharge to tile drains, and interaction with the stream network) [28].
The linkage between SWAT and MODFLOW is achieved through the passing of state variables. The HRUs are disaggregated into individual polygons with specific geographic locations by pre-processing GIS routines [31]. These disaggregated HRUs (DHRUs) are then intersected with MODFLOW grid cells to pass the state variables between SWAT and MODFLOW models.
During the simulation, the HRU-based deep percolation (i.e., water exiting the bottom of the soil profile) calculated in SWAT is mapped to MODFLOW’s RCH package to control the groundwater head [16]. The RIV package of MODFLOW-NWT calculates volumetric flow rates between the aquifer and the stream in each river grid cell, which are then passed to the streams in SWAT for routing [15]. The detailed model theory and variable descriptions, including procedures for coupling the two models, are described in Bailey et al. [15] and Bailey and Park [31].
2.3. Model Setup and Input Data
Before simulating the SWAT-MODFLOW model at hourly time steps, we constructed an hourly SWAT model for the study area. The SWAT model requires main input data, namely the digital elevation model (DEM), land use, and soil data, in addition to the meteorological data. We used a 5 × 5 m resolution DEM created from 1:5000 digital topographic maps obtained from the National Geographic Information Institute (https://www.ngii.go.kr, accessed on 11 May 2023) for watershed delineation.
The SWAT model was built with a total of 27 sub-watersheds and 1079 HRUs. For land use and soil maps, we used 1:25,000 land use maps from the Environmental Geographic Information Service (https://egis.me.go.kr, accessed on 11 May 2023) and 1:50,000 soil maps from the Rural Development Administration (http://soil.rda.go.kr, accessed on 11 May 2023), respectively. Hourly meteorological data (precipitation, wind, relative humidity, maximum and minimum air temperatures, and solar radiation) from the Iljuk weather station near the watershed were obtained from the Korea Meteorological Administration (https://www.weather.go.kr, accessed on 11 May 2023) and used as input for the SWAT model. After constructing input data for the SWAT model, we created four linkage files (swatmf_dhru2hru.txt, swatmf_dhru2grid.txt, swatmf_grid2dhru.txt, and swatmf_river2grid.txt) [31], which are necessary to connect SWAT features (HRUs, sub-watersheds) with MODFLOW grid cells using a GIS preprocessing tool. We constructed package input files such as BAS, DIS, RCH, UPW, NWT, and RIV for the SWAT-MODFLOW simulation using the Graphical User Interface for Groundwater Models (ModelMuse) 4.2.0 [32] software.
The model comprised a total of 2310 grid cells (55 rows, 42 columns) with dimensions of 200 × 200 m (Figure 3). Based on the watershed boundary, we considered the area outside the watershed a no-flow condition and set the grid cells as inactive. A total of 150 river grid cells were created for water exchange between the stream network and the aquifer. The aquifer structure in the study area consisted of one alluvial layer and one rock layer, set as an unconfined aquifer and a confined aquifer, respectively. We spatially distributed the bottom elevations of the alluvial and rock layers, collected through geotechnical investigation, across the grid using the inverse distance weighting method. The horizontal hydraulic conductivity of each aquifer within the watershed was spatially distributed based on field permeability and instantaneous impact tests (Table 1). The vertical hydraulic conductivity was assumed to be 1/10 of the horizontal value. Default values of 0.0001 and 0.2 were used for specific storage and specific yield, respectively, for each aquifer.
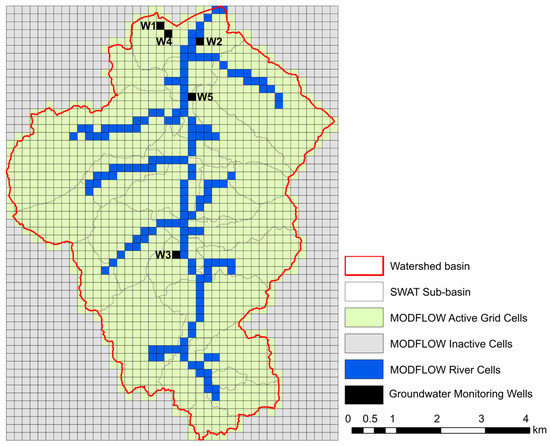
Figure 3.
The MODFLOW model grid and boundary conditions.

Table 1.
Hydrogeological parameters of the study area.
2.4. Surface Water–Groundwater Interactions for Hourly SWAT-MODFLOW
In the SWAT model, the hourly surface flow was calculated using the Green Ampt Mein–Larson (GAML) method [33], while other hydrological variables, such as lateral flow and groundwater, were determined based on daily processes and then uniformly distributed for hourly stream routing [34]. The SWAT-MODFLOW model, which calls the MODFLOW model at daily intervals to replace the SWAT model’s groundwater modules, enables integrated SW-GW simulations in the hourly SWAT model when linked with the daily MODFLOW model. However, although the SWAT-MODFLOW model adds the volume of water exchange resulting from aquifer–stream interactions at the daily time step to each sub-watershed in-stream for stream routing, it does not reflect this exchange in the hourly simulations. To address this limitation, we modified the model code to include the influence of SW-GW interactions on the hourly flow calculations for streams in each sub-watershed. When daily rainfall and baseflow occur, the SW-GW exchange volumes are temporally distributed based on the baseflow distribution factor; otherwise, they are equally distributed across 24 h and utilized for hourly stream routing in the SWAT model.
2.5. Development of Hourly SWAT-PADDY Module
In this study, we developed an hourly SWAT-PADDY module (Figure 4) for simulating flow and water quality at hourly time steps in response to submerged paddy field conditions. The module treats paddies as crop fields during non-submerged periods and calculates the water balance using Equation (1) during submerged periods.
where is the water depth of submerged paddy (mm/h), is the hourly rainfall (mm/h), is the amount of irrigation (mm/h), is the evaporation from the water surface (mm/h), is the amount of infiltration into the first soil layer (mm/h), is the amount of outflow (mm/h), and t is the hour time.
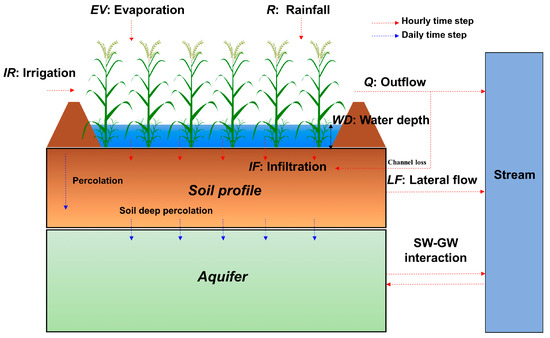
Figure 4.
Water balance through the hourly SWAT-PADDY module.
Unlike previous studies that developed daily SWAT-PADDY modules, this module can simulate changes in submerged paddy water depth according to rainfall, evaporation, infiltration, and irrigation at hourly time steps. We assumed the irrigation amount for paddy fields would maintain the standard depth during submerged periods, with any difference between actual water depth and the user-defined standard submerged water depth () automatically supplied to the paddy, as shown in Equations (2) and (3).
Evaporation in the paddy was calculated using equations from Sakaguchi et al. [23], and evenly distributed over 24 h each day, as shown in Equations (4) and (5).
The evaporation coefficient () and leaf area index () of plants growing in submerged paddies, as well as the at which evaporation from the water surface does not occur (), and potential evapotranspiration for a given day (, mm) were used to calculate evaporation using hourly time steps. In this study, and values of 0.6 and 4, respectively, were applied based on the study of Tsuchiya et al. [24]. The infiltration amount was calculated based on Equation (6) if the soil water stored in the soil profile from the previous day equaled or exceeded the field capacity of the soil profile; otherwise, it was calculated using Equation (7). The infiltration amount was determined by the saturated hydraulic conductivity of the first soil layer (, mm/h), the amount of water stored in the soil profile on the previous day (, mm), and the amount of water held in the soil profile at field capacity (, mm).
Runoff from the paddy field was generated when the water depth due to rainfall exceeded the standard water depth during the submerged period or occurred as drainage as per the paddy farming schedule. Runoff exceeding the standard water depth was generated using the Francis weir formula, with a weir width and depth of 0.6 m per 1 ha of paddy HRU area [35]. During drainage, the amount of runoff from the paddy caused by the paddy farming schedule was gradually distributed over one day according to time weight. Some of the runoff was infiltrated into the soil layer due to channel loss, and the remaining runoff was added to the in-stream of each sub-watershed and routed to the river. The potential infiltration rate of the waterway was manually estimated at 0.15 but was automatically calibrated.
To accurately simulate water quality in the watershed with a high proportion of submerged paddy fields, we modified the hourly SWAT-PADDY module to account for paddy field fertilization in both submerged and non-submerged periods. When fertilization was applied as per the farming schedule during the non-submerged period, the hourly fertilization amount (organic nitrogen (Org-N), nitrate-nitrogen (NO3-N), ammonia-nitrogen (NH3-N), organic phosphorus (Org-P), and soluble phosphorus (Sol-P)) was converted to a daily amount and added to the nutrients stored in the soil’s first layer. Conversely, when fertilizer was applied to the paddy during the submerged period, fertilizer nutrients were incorporated into the quality of the submerged water in the paddy. Nutrients that have settled were then added to the reserve of nutrients in the first soil layer, similar to the reservoir nutrient settlement process in the SWAT model. Amounts excluding nutrients were separated through settlement and flotation processes according to daily time steps and used for water quality simulation.
2.6. Linking the SWAT-MODFLOW Model with Hourly SWAT-PADDY Module
This study linked the hydrological process of the SWAT-MODFLOW model with the hourly SWAT-PADDY module. Figure 5a presents the inclusion of the activation status (1 = activated, 0 = deactivated) of the hourly SWAT-PADDY module in the linkage file of the original SWAT-MODFLOW model. Figure 5b presents the input file for the paddy farming schedule of the hourly SWAT-PADDY module, including HRU numbers for paddy fields, the farming date (daily count), standard submerged water depth (WD, in mm), and fertilization details: Org-N (W1, kg/ha), NO3-N (W2, kg/ha), NH3-N (W3, kg/ha), Org-P (W4, kg/ha), and Sol-P (W5, kg/ha). When the user activates the hourly SWAT-PADDY module in the linkage file, the model reads the input file of the hourly SWAT-PADDY module and simulates hourly hydrological behavior based on submerged and non-submerged conditions for HRUs corresponding to paddy fields.
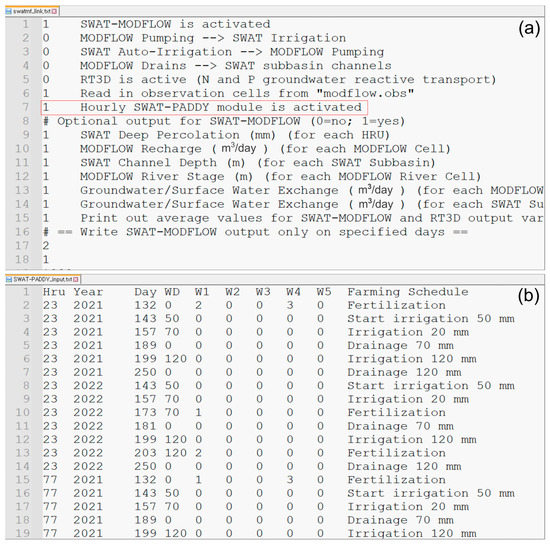
Figure 5.
Activation and application of the hourly SWAT-PADDY module in the SWAT-MODFLOW model: (a) modified linkage file of SWAT-MODFLOW model and (b) paddy farming schedule file.
During the non-submerged period, paddy fields are treated as crop fields, and the GAML method is used for runoff and infiltration calculations. During the submerged period, hourly infiltration and runoff in each HRU are calculated by the hourly SWAT-PADDY module, converted to daily time units, and used in the soil moisture algorithm for calculating lateral flow and percolation by soil layers. Soil deep percolation at each HRU during the simulation period is used as the recharge variable of the MODFLOW model. The hourly runoff of the paddy field, excluding waterway infiltration, is added to the in-stream of sub-watersheds along with the SW-GW interaction and is routed at an hourly time step. The configuration diagram of the hourly SWAT-MODFLOW-PADDY model and the hourly SWAT-PADDY module linkage is shown in Figure 6.
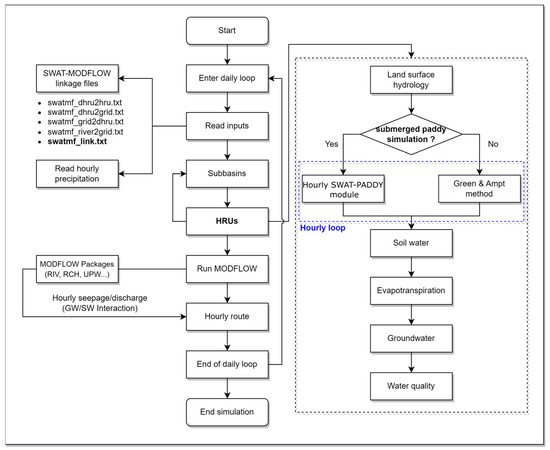
Figure 6.
The diagram of the hourly SWAT-MODFLOW-PADDY model.
In this study, an input file was established for the hourly SWAT-PADDY module to simulate hydrology based on the behavior of submerged paddy fields (Table 2). The file included the farming schedule for a total of 27 HRUs (7.99 km2) selected based on the paddy area of each sub-watershed. The general paddy farming schedule of the region where the watershed is located was applied for the 5 paddy HRUs within the downstream sub-watersheds (1 to 5). Additionally, agricultural activities for the 11 paddy HRUs in both the middle stream sub-watersheds (6 to 16) and the upstream sub-watersheds (17 to 26) were applied to begin 3 and 6 days earlier, respectively, compared to the schedule in the downstream region.
Table 2.
The submerged paddy farming schedule used in this study.
2.7. Calibration and Validation of the Hourly SWAT-MODFLOW-PADDY Model
In this study, we performed hourly simulations of the SWAT model linked to the hourly SWAT-PADDY module and daily simulations of the MODFLOW model from 1 January 2020 to 26 July 2022, including a one-year warm-up period. We performed separate calibration (9 April 2021–21 October 2021) and validation (1 March 2022–26 July 2022) of the SWAT model, utilizing hourly flow and water quality measurements (suspended solid (SS), biochemical oxygen demand (BOD), total nitrogen (TN), and total phosphorus (TP)) from the watershed outlet. We selected TN and TP as the key calibration parameters due to their comprehensive representation of nutrient levels in water. Environmental managers across the United States and worldwide frequently use TN and TP measures to assess eutrophication in lotic ecosystems [36]. Similarly, the Korean Ministry of Environment utilizes specific concentrations of TN and TP as water quality criteria to assess the status of water quality.
The Soil and Water Assessment Tool Calibration and Uncertainty Procedure (SWAT-CUP) [37] with the sequential uncertainty fitting (SUFI-2) algorithm was employed for automatic calibration. SUFI-2 effectively captures parameter uncertainties in hydrologic models and quantifies their impacts [38], as described in detail in Abbaspour et al. [39].
After SWAT model calibration, we coupled it with the MODFLOW model and manually calibrated the hourly SWAT-MODFLOW-PADDY model by comparing simulated and observed daily groundwater heads at three monitoring wells within the study area. The model’s performance was evaluated using statistical metrics such as the coefficient of determination (R2) [40], Nash and Sutcliffe efficiency (NSE) [41], and percent bias (PBIAS) [42], which are widely used to assess hydrologic watershed models.
R2 is a statistical indicator that evaluates the correlation between observed and simulated values, represented by a value between 0 and 1, where 1 indicates a perfect linear relationship. NSE is a normalized measure of the relative size of the residual variance between observed and simulated values, calculated within a range of −∞ to 1, and NSE = 1 indicates a perfect match with the observed values. PBIAS represents the relative error from the observed values, where a positive value means the simulated values are overestimated and a negative value means the simulated values are underestimated. The general performance of a watershed-scale hydrological model can be considered acceptable if the R2 and NSE values are greater than 0.5 and the PBIAS value is less than 25% [43].
3. Results and Discussion
3.1. Runoff and Soil Moisture Predictions with Paddy Field-Specific Hydrological Modeling
The results of our research demonstrated that the hourly SWAT-MODFLOW-PADDY model, which incorporated submerged conditions in paddy fields, offered a more reasonable simulation of soil moisture and runoff patterns compared to the hourly SWAT-MODFLOW model. Figure 7 presents that both models exhibited consistent soil moisture patterns before paddy submergence. However, during the submergence period, a noticeable divergence in soil moisture between the two models became apparent. Specifically, the hourly SWAT-MODFLOW model exhibited a significant decrease in soil moisture during the summer months as increased temperatures led to drier soil conditions. In contrast, the hourly SWAT-MODFLOW-PADDY model maintained a saturated soil moisture state due to the continuous rise in infiltration within the submerged paddy field, regardless of the prevailing rainfall conditions.
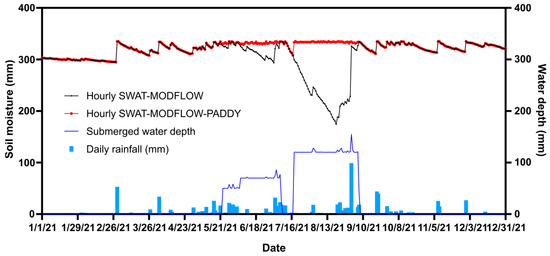
Figure 7.
Time series of soil moisture for a specific HRU (paddy field) as simulated by the hourly SWAT-MODFLOW and SWAT-MODFLOW-PADDY models.
The surface runoff volume and patterns of the two models displayed significant differences based on the implementation of the paddy farming schedule (Figure 8). The hourly SWAT-MODFLOW model simulated a peak runoff of 6.15 m3/s (with rainfall of 10.5 mm at 1:00 a.m. on May 31st); however, the hourly SWAT-MODFLOW-PADDY model showed a lower peak runoff and a gradual runoff occurrence following the rainfall event (Figure 8a). Additionally, the hourly SWAT-MODFLOW-PADDY model generated peak surface runoffs of 4.2 m3/s (39 mm rainfall at 3:00 a.m.) and 6.8 m3/s (16 mm rainfall at 7:00 a.m.) on September 1st, while the hourly SWAT-MODFLOW model did not simulate paddy field surface runoff (Figure 8b). This discrepancy could be attributed to the hourly SWAT-MODFLOW model’s inability to account for the inundated conditions of paddy fields. Consequently, even during heavy rainfall events, the persistently dry soil conditions facilitated water absorption through infiltration, preventing the formation of initial runoff.
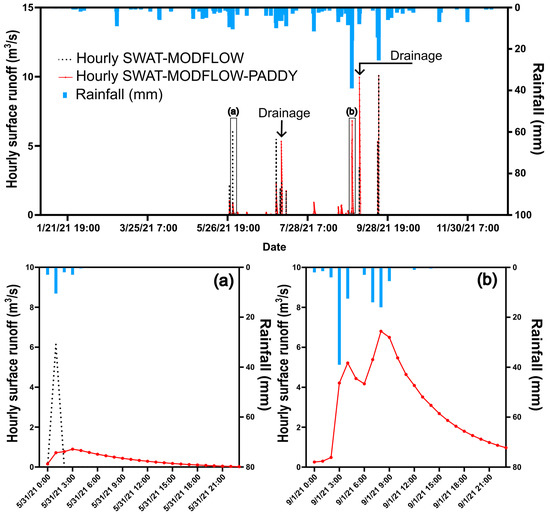
Figure 8.
Time series of surface runoff for a specific HRU (paddy field) as simulated by the hourly SWAT-MODFLOW and SWAT-MODFLOW-PADDY models: (a) typical day with 19 mm daily rainfall and (b) extreme day with 99 mm daily rainfall.
These findings emphasize the importance of accounting for paddy field-specific characteristics when modeling hydrological processes in such areas. The discrepancy between the two models’ surface runoff volume and patterns, particularly during heavy rainfall events, highlights the necessity for an accurate representation of paddy field conditions in predicting runoff and informing water management strategies. The hourly SWAT-MODFLOW model’s limitation in considering inundated conditions in paddy fields may result in underestimating runoff during heavy rainfall events, leading to potential inaccuracies in water resources management and planning. Therefore, incorporating paddy field-specific characteristics and processes into hydrological models, such as the hourly SWAT-MODFLOW-PADDY model, is essential for enhancing the accuracy of runoff and soil moisture predictions in paddy-dominated watersheds.
3.2. Performance Evaluation of Hourly SWAT-MODFLOW-PADDY Model
Our study evaluated the performance of two models, hourly SWAT-MODFLOW and hourly SWAT-MODFLOW-PADDY, by comparing their simulated data with the observed hourly flow data at the watershed outlet (Figure 9). Both models demonstrated acceptable performance in terms of R2 and NSE for hourly flow during the calibration and validation periods, based on statistical metrics; however, the PBIAS of the hourly SWAT-MODFLOW model exhibited an unsatisfactory performance level, with a value exceeding 25%. In contrast, the hourly SWAT-MODFLOW-PADDY model showed an improvement in the R2 and NSE during the calibration and validation periods compared to the hourly SWAT-MODFLOW model, with a significant reduction in PBIAS (Table 3). The improved performance of the hourly SWAT-MODFLOW-PADDY could be attributed to the model’s ability to reflect the hydrologic behavior of the submerged paddy fields within the watershed as well as the volume of water exchanged due to the SW-GW interaction.
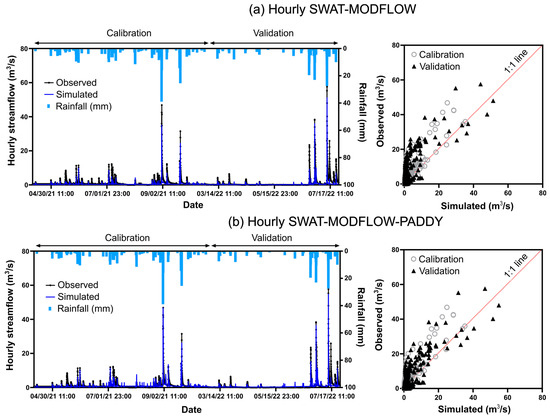
Figure 9.
Comparison of simulated hourly flow data from the hourly SWAT-MODFLOW and SWAT-MODFLOW-PADDY models with observed data at the watershed outlet.
Table 3.
Performance statistics for hourly flow at the watershed outlet during the calibration and validation periods, with values in parentheses indicating performance during the validation period.
Moreover, the hourly SWAT-MODFLOW-PADDY model reasonably simulated groundwater heads at five monitoring wells within the watershed, with R2 values ranging from 0.39 to 0.93 and PBIAS values between –0.247 and 0.477 (Figure 10). Although the R2 value for the observed groundwater heads at a specific well (W2) was low at 0.39, this was reasonable given the limitations that not all paddy fields within the watershed were considered in the farming schedule, and it is not realistically possible to account for the farming schedule of every paddy field.
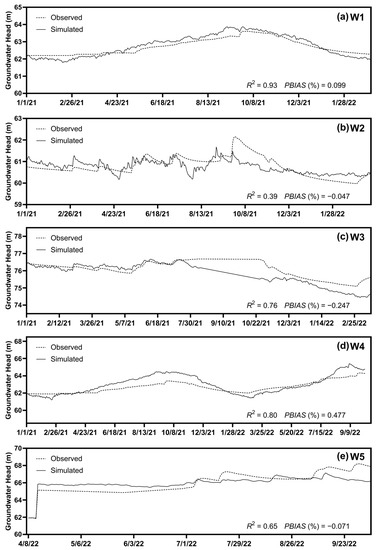
Figure 10.
Hydrograph of daily simulated and observed groundwater heads for five wells located within the watershed, accompanied by summary performance statistics.
Figure 11 presents the scatterplots of the simulated hourly water quality loads from both models compared with the observed values. The hourly SWAT-MODFLOW-PADDY model also showed improved results for TN and TP water quality predictions at an hourly scale, with R2, NSE, and PBIAS values showing improvement throughout the entire simulation period (Table 4). The results suggest that the farming schedule for paddy fields contributes to the improvement in hourly flow and water quality prediction in agricultural watersheds where submerged paddy farming takes place.
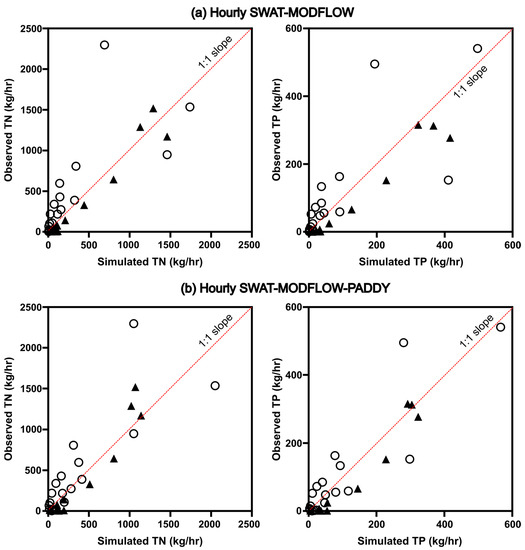
Figure 11.
Scatterplot of the relationship between observed and simulated hourly water quality loads at the watershed outlet. Black triangles represent calibration data and empty circles represent validation data.
Table 4.
Performance statistics for hourly water quality at the watershed outlet during the entire period.
Nevertheless, there were substantial deviations between the observed and simulated results. These discrepancies can be attributed to several factors. One major issue is the model’s limited capacity to account for various non-point pollution sources and the paucity of detailed data on the amount and patterns of fertilization across paddy fields. Another crucial aspect to consider is that our model might not sufficiently represent the vital role of biological processes, notably microbial decomposition and the transformation of nutrients [44]. These transformations significantly impact water quality. To improve the accuracy of the hourly SWAT-MODFLOW-PADDY model, further comprehensive investigations are necessary. These investigations should not only examine the amount and patterns of fertilization in paddy fields but also incorporate detailed studies on biological processes occurring within these fields, such as the role of microorganisms in nutrient transformations. Potential improvements to the model could involve incorporating more detailed information about paddy field management practices or soil properties to further enhance the accuracy of the simulations. Additionally, careful model calibration by linking the hourly SWAT-PADDY module with the PEST (Parameter Estimation by Sequential Testing tool) [45] is likely necessary, as there is no way to calibrate the SWAT-MODFLOW model on an hourly time step. These findings emphasize the importance of incorporating paddy field-specific characteristics and processes into hydrological models to improve the accuracy of flow and soil moisture predictions in submerged paddy-dominated watersheds.
3.3. Spatial Distribution of the Groundwater Recharge and Surfacewater–Groundwater Interaction
Figure 12 presents the spatial distribution of the average monthly groundwater recharge by HRU within the watershed for both models during the submerging of paddy fields in the region. The HRU-based average groundwater recharge of the hourly SWAT-MODFLOW-PADDY model varied from 0.27 to 0.95 mm per month, with maximum recharge values ranging between 11.09 and 35.5 mm. These values were significantly higher than those obtained from the hourly SWAT-MODFLOW model. In August, the hourly SWAT-MODFLOW model estimated an HRU-based average recharge of 0.09 mm, a considerable decrease of approximately 85% compared to July, coinciding with a total rainfall of 123.5 mm. This reduction can be attributed to the wet soil conditions in the watershed resulting from the prior rainfall and the model’s omission of submerged paddy conditions, leading to relatively low soil infiltration. In contrast, the HRU-based average recharge in August for the hourly SWAT-MODFLOW-PADDY model declined by about 49% to 0.49 mm compared to July. This decrease can be accounted for by the continuous maintenance of the standard submerged depth in August due to the water supply, enabling infiltration to persist even as the soil remained saturated.
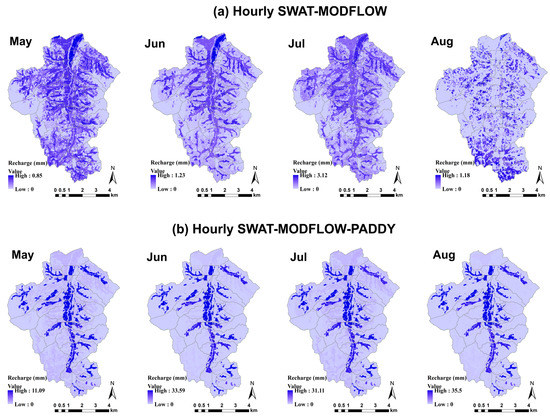
Figure 12.
Spatial distribution of average monthly groundwater recharge by HRU within the watershed as simulated by both models during paddy field submerging.
In the hourly SWAT-MODFLOW-PADDY model, the simulated monthly average surface runoff, lateral flow, groundwater recharge, and evapotranspiration within the watershed exhibited increases of 1.67 times, 1.45 times, 8.9 times, and 1.51 times, respectively, compared to the results from the hourly SWAT-MODFLOW model (Figure 13). This emphasizes the importance of hydrological simulations that take into account the mechanisms of submerged paddy fields for accurate water balance analysis in agricultural watersheds where paddy farming is prevalent.
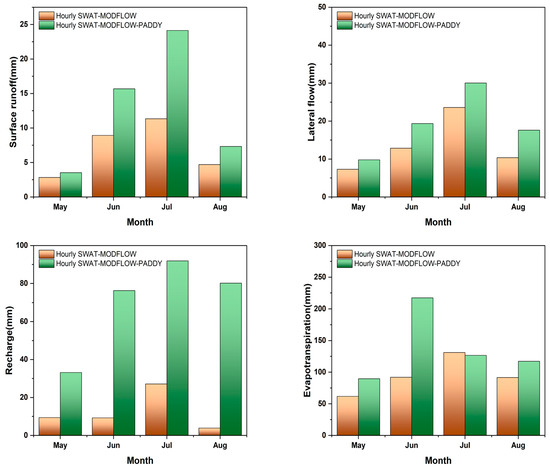
Figure 13.
Comparison of simulated monthly average surface runoff, lateral flow, groundwater recharge, and evapotranspiration within the watershed between both the hourly SWAT-MODFLOW and SWAT-MODFLOW-PADDY models.
Figure 14 presents the simulated average annual water exchange between the stream and the aquifer for each river cell, using both models. Overall, both models demonstrated high groundwater contributions to the streamflow. However, the total amounts of groundwater contributing to the stream through the SW-GW interaction in the hourly SWAT-MODFLOW-PADDY model were approximately 36,106 m3/day. These results were about 1.82 times higher than those obtained from the hourly SWAT-MODFLOW model, which amounted to approximately 19,852 m3/day. In particular, during the months corresponding to the submerged paddy cultivation period, the amount of water exchanged in each river cell differed significantly between the two models (Figure 15).
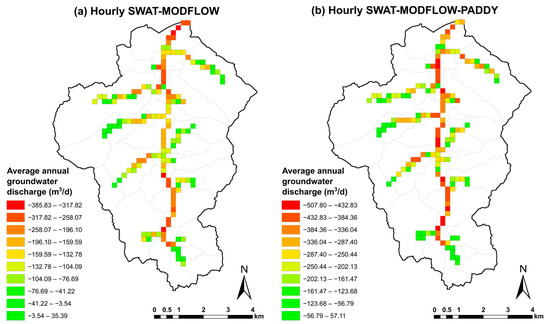
Figure 14.
Simulated average annual water exchange between the stream and aquifer for each river cell, as illustrated by both models.
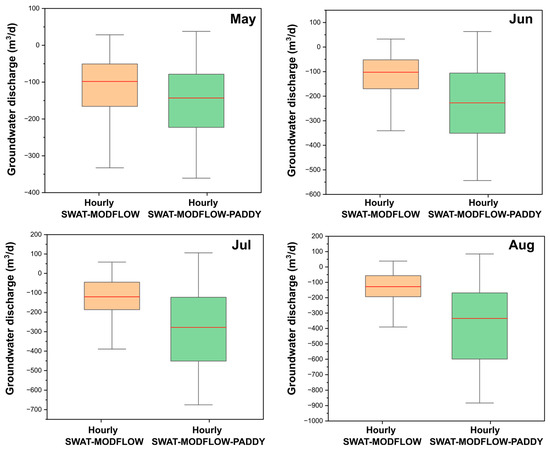
Figure 15.
Amount of water exchanged in each river cell during the months corresponding to the submerged paddy cultivation period.
These findings emphasize the importance of incorporating the hydrologic behavior of submerged paddy fields into the model to produce accurate and reliable spatial and temporal groundwater head and recharge distribution, as well as water exchange results in submerged paddy agricultural watersheds. In future studies, for a precise SW-GW integrated analysis, securing an adequate warm-up period and calibrating the model using long-term groundwater head observation data are essential.
4. Conclusions
This study developed and evaluated the hourly SWAT-MODFLOW-PADDY model, a tool designed to predict hourly flow and water quality in agricultural watersheds dominated by submerged paddy fields, by integrating the hydrologic behavior of these fields with high-resolution rainfall data.
The hourly SWAT-MODFLOW-PADDY model yielded a more accurate simulation of soil moisture content and flow dynamics, particularly during high rainfall events, than the original hourly SWAT-MODFLOW model. It significantly mitigated uncertainties in hydrological simulations for watersheds characterized by submerged paddy farming. Notably, it successfully captured hourly flow and water quality data, revealing the significant influence of the hydrological characteristics of submerged paddy fields on the spatial distribution of groundwater recharge and SW-GW exchange processes.
However, the hourly SWAT-MODFLOW-PADDY model’s accuracy could be further improved. Enhancements can include prioritizing a comprehensive database on agricultural water usage, identifying precise irrigation water sources, and establishing a connection with these water sources within the SWAT-PADDY module for a more accurate water balance analysis. Furthermore, implementing a robust farming schedule framework could improve the model’s performance. One significant limitation acknowledged in this study is the model’s inability to fully account for the role of microorganisms in the decomposition and transformation of nutrients, such as denitrification, in paddy fields. These biological processes significantly impact water quality and should be more adequately represented in our model. Future studies should therefore consider these factors to enhance the accuracy of the hourly SWAT-MODFLOW-PADDY model.
The results of integrated surface water and groundwater simulation can be applied in various fields, such as groundwater management, water resource planning, flood prediction and management, water environment conservation, and ecosystem management. However, hydrological simulations that do not account for the unique agricultural characteristics of the watershed can present challenges in making informed decisions for appropriate management strategies.
In these aspects, the hourly SWAT-MODFLOW-PADDY model developed in this study shows potential for accurate SW-GW integrated hydrologic analysis in watersheds dominated by submerged paddy agriculture. The findings from this research are anticipated to provide valuable insights for future studies necessary for water resource management, the quantification of agricultural water use, and the development of sustainable agricultural adaptation strategies.
Author Contributions
Conceptualization, S.L. and K.J.L.; methodology, S.L. and Y.S.P.; formal analysis, Y.S.P. and J.K.; data curation, S.L.; writing—original draft preparation, S.L.; writing—review and editing, J.K. and K.J.L.; visualization, S.L.; supervision, K.J.L. All authors have read and agreed to the published version of the manuscript.
Funding
This research was supported by “Korea Environment Industry & Technology Institute (KEITI) through the Aquatic Ecosystem Conservation Research Program, funded by the Korea Ministry of Environment (MOE), grant number 2020003030004” and “2021 Research Grant from Kangwon National University”.
Institutional Review Board Statement
Not applicable.
Informed Consent Statement
Not applicable.
Data Availability Statement
The data that support the findings of this study are available from the corresponding author upon reasonable request.
Conflicts of Interest
The authors declare no conflict of interest.
References
- Matsuno, Y.; Nakamura, K.; Masumoto, T.; Matsui, H.; Kato, T.; Sato, Y. Prospects for Multifunctionality of Paddy Rice Cultivation in Japan and Other Countries in Monsoon Asia. Paddy Water Environ. 2006, 4, 189–197. [Google Scholar] [CrossRef]
- Han, J.; Zhang, Z.; Luo, Y.; Cao, J.; Zhang, L.; Zhuang, H.; Cheng, F.; Zhang, J.; Tao, F. Annual Paddy Rice Planting Area and Cropping Intensity Datasets and Their Dynamics in the Asian Monsoon Region from 2000 to 2020. Agric. Syst. 2022, 200, 103437. [Google Scholar] [CrossRef]
- Phan, N.T.; Lee, J.-Y.; Kien, N.D. The Impact of Land Fragmentation in Rice Production on Household Food Insecurity in Vietnam. Sustainability 2022, 14, 11162. [Google Scholar] [CrossRef]
- Devkota, K.P.; Pasuquin, E.; Elmido-Mabilangan, A.; Dikitanan, R.; Singleton, G.R.; Stuart, A.M.; Vithoonjit, D.; Vidiyangkura, L.; Pustika, A.B.; Afriani, R.; et al. Economic and Environmental Indicators of Sustainable Rice Cultivation: A Comparison across Intensive Irrigated Rice Cropping Systems in Six Asian Countries. Ecol. Indic. 2019, 105, 199–214. [Google Scholar] [CrossRef]
- Natuhara, Y. Ecosystem Services by Paddy Fields as Substitutes of Natural Wetlands in Japan. Ecol. Eng. 2013, 56, 97–106. [Google Scholar] [CrossRef]
- Anan, M.; Yuge, K.; Nakano, Y.; Saptomo, S.; Haraguchi, T. Quantification of the Effect of Rice Paddy Area Changes on Recharging Groundwater. Paddy Water Environ. 2007, 5, 41–47. [Google Scholar] [CrossRef]
- Chang, Y.-C.; Lin, W.-T.; Hsu, N.-S.; Kan, C.-E. Reuse of Return Flow from Wetland Paddy to Supplement Industrial Water Needs. Irrig. Drain. 2009, 59, 345–355. [Google Scholar] [CrossRef]
- Yoshida, T.; Nakano, T.; Shin, K.; Tsuchihara, T.; Minakawa, H.; Miyazu, S.; Kubota, T. Quantification of Seasonal Variabilities in Groundwater Discharge in an Extensive Irrigation Watershed Using H, O, and Sr Isotopes. Hydrol. Earth Syst. Sci. Discuss. 2018, 551, 1–33. [Google Scholar] [CrossRef]
- Kaandorp, V.P.; Molina-Navarro, E.; Andersen, H.E.; Bloomfield, J.P.; Kuijper, M.J.M.; de Louw, P.G.B. A Conceptual Model for the Analysis of Multi-Stressors in Linked Groundwater–Surface Water Systems. Sci. Total Environ. 2018, 627, 880–895. [Google Scholar] [CrossRef]
- Zheng, J.; Wang, W.; Ding, Y.; Liu, G.; Xing, W.; Cao, X.; Chen, D. Assessment of Climate Change Impact on the Water Footprint in Rice Production: Historical Simulation and Future Projections at Two Representative Rice Cropping Sites of China. Sci. Total Environ. 2020, 709, 136190. [Google Scholar] [CrossRef]
- Xiao-jun, W.; Jian-yun, Z.; Shahid, S.; ElMahdi, A.; Rui-min, H.; Zhen-xin, B.; Ali, M. Water Resources Management Strategy for Adaptation to Droughts in China. Mitig. Adapt. Strateg. Glob. Chang. 2012, 17, 923–937. [Google Scholar] [CrossRef]
- Ali, N.I.M.; Aiyub, K.; Lam, K.C.; Abas, A. A Bibliometric Review on the Inter-Connection between Climate Change and Rice Farming. Environ. Sci. Pollut. Res. 2022, 29, 30892–30907. [Google Scholar] [CrossRef]
- Arnold, J.G.; Srinivasan, R.; Muttiah, R.S.; Williams, J.R. Large Area Hydrologic Modelling and Assessment. Part I—Model Development. J. Am. Water Resour. Assoc. 1998, 34, 73–89. [Google Scholar] [CrossRef]
- Bicknell, B.R.; Imhoff, J.C.; Kittle, J.L., Jr.; Donigan, A.S., Jr.; Johanson, R.C.; Barnwell, T.O. Hydrological Simulation Program—Fortran User’s Manual for Version 11; United States Environmental Protection Agency: Washington, DC, USA, 1996; p. 100.
- Bailey, R.T.; Wible, T.C.; Arabi, M.; Records, R.M.; Ditty, J. Assessing Regional-Scale Spatio-Temporal Patterns of Groundwater–Surface Water Interactions Using a Coupled SWAT-MODFLOW Model. Hydrol. Process. 2016, 30, 4420–4433. [Google Scholar] [CrossRef]
- Aliyari, F.; Bailey, R.T.; Tasdighi, A.; Dozier, A.; Arabi, M.; Zeiler, K. Coupled SWAT-MODFLOW Model for Large-Scale Mixed Agro-Urban River Basins. Environ. Model. Softw. 2019, 115, 200–210. [Google Scholar] [CrossRef]
- Zhang, L.; Dai, Y.; Lin, J.; Han, J.; Sun, X.; Li, X.; Liu, P.; Liao, A. Evaluating Spatiotemporal Variations of Groundwater–Surface Water Interaction Using an Integrated Hydrological Model in Huashan Basin, China. Sustainability 2022, 14, 14325. [Google Scholar] [CrossRef]
- Chunn, D.; Faramarzi, M.; Smerdon, B.; Alessi, D.S. Application of an Integrated SWAT–MODFLOW Model to Evaluate Potential Impacts of Climate Change and Water Withdrawals on Groundwater–Surface Water Interactions in West-Central Alberta. Water 2019, 11, 110. [Google Scholar] [CrossRef]
- Rafiei, V.; Nejadhashemi, A.P.; Mushtaq, S.; Bailey, R.T.; An-Vo, D.A. Groundwater-surface water interactions at wetland interface: Advancement in catchment system modeling. Environ. Model. Softw. 2022, 152, 105407. [Google Scholar] [CrossRef]
- Gao, F.; Feng, G.; Han, M.; Dash, P.; Jenkins, J.; Liu, C. Assessment of Surface Water Resources in the Big Sunflower River Watershed Using Coupled SWAT–MODFLOW Model. Water 2019, 11, 528. [Google Scholar] [CrossRef]
- Salmani, H.; Javadi, S.; Eini, M.R.; Golmohammadi, G. Compilation Simulation of Surface Water and Groundwater Resources Using the SWAT-MODFLOW Model for a Karstic Basin in Iran. Hydrogeol. J. 2023. [Google Scholar] [CrossRef]
- Aslam, R.A.; Shrestha, S.; Usman, M.N.; Khan, S.N.; Ali, S.; Sharif, M.S.; Sarwar, M.W.; Saddique, N.; Sarwar, A.; Ali, M.U.; et al. Integrated SWAT-MODFLOW Modeling-Based Groundwater Adaptation Policy Guidelines for Lahore, Pakistan under Projected Climate Change, and Human Development Scenarios. Atmosphere 2022, 13, 2001. [Google Scholar] [CrossRef]
- Sakaguchi, A.; Eguchi, S.; Kato, T.; Kasuya, M.; Ono, K.; Miyata, A.; Tase, N. Development and Evaluation of a Paddy Module for Improving Hydrological Simulation in SWAT. Agric. Water Manag. 2014, 137, 116–122. [Google Scholar] [CrossRef]
- Tsuchiya, R.; Kato, T.; Jeong, J.; Arnold, J.G. Development of SWAT-Paddy for Simulating Lowland Paddy Fields. Sustainability 2018, 10, 3246. [Google Scholar] [CrossRef]
- Ouyang, W.; Wei, P.; Gao, X.; Srinivasan, R.; Yen, H.; Xie, X.; Liu, L.; Liu, H. Optimization of SWAT-Paddy for Modeling Hydrology and Diffuse Pollution of Large Rice Paddy Fields. Environ. Model. Softw. 2020, 130, 104736. [Google Scholar] [CrossRef]
- Gassman, P.; Jeong, J.; Boulange, J.; Narasimhan, B.; Kato, T.; Somura, H.; Watanabe, H.; Eguchi, S.; Cui, Y.; Sakaguchi, A.; et al. Simulation of Rice Paddy Systems in SWAT: A Review of Previous Applications and Proposed SWAT+ Rice Paddy Module. Int. J. Agric. Biol. Eng. 2022, 15, 1–24. [Google Scholar] [CrossRef]
- Kang, T.-S.; Kim, J.; Yang, D.; Yu, N.; Shin, M.; Lim, K.-J. A Study on How to Reduce the Amount of Groundwater Used in the Dry Season and Improve the Water Quality of the Base Runoff. J. Korean Soc. Agric. Eng. 2022, 64, 27–35. [Google Scholar] [CrossRef]
- Taie Semiromi, M.; Koch, M. Analysis of Spatio-Temporal Variability of Surface–Groundwater Interactions in the Gharehsoo River Basin, Iran, Using a Coupled SWAT-MODFLOW Model. Environ. Earth Sci. 2019, 78, 201. [Google Scholar] [CrossRef]
- Harbaugh, A.W. MODFLOW-2005: The U.S. Geological Survey Modular Ground-Water Model—The Ground-Water Flow Process; USGS: Reston, VA, USA, 2005. [CrossRef]
- Niswonger, R.G.; Panday, S.; Ibaraki, M. MODFLOW-NWT, a Newton Formulation for MODFLOW-2005. US Geol. Surv. Tech. Methods 2011, 6, 44. [Google Scholar] [CrossRef]
- Bailey, R.; Park, S. SWAT-MODFLOW Tutorial Version 3 Documentation for Preparing and Running SWAT-MODFLOW Simulations; Department of Civil and Environmental Engineering, Colorado State University: Fort Collins, CO, USA, 2019; pp. 1–89. [Google Scholar]
- Winston, R.B. ModelMuse: A Graphical User Interface for MODFLOW-2005 and PHAST; U.S. Geological Survey: Reston, VA, USA, 2009.
- Mein, R.G.; Larson, C.L. Modeling Infiltration during a Steady Rain. Water Resour. Res. 1973, 9, 384–394. [Google Scholar] [CrossRef]
- Jeong, J.; Kannan, N.; Arnold, J.; Glick, R.; Gosselink, L.; Srinivasan, R. Development and Integration of Sub-Hourly Rainfall-Runoff Modeling Capability Within a Watershed Model. Water Resour. Manag. 2010, 24, 4505–4527. [Google Scholar] [CrossRef]
- Choi, S.-K. APEX-Paddy Model Development and Climate Change Impact Assessment for Paddy Rice; Department of Landscape Architecture and Rural Systems Engineering, Seoul National University: Seoul, Republic of Korea, 2019. [Google Scholar]
- Bennett, M.G.; Schofield, K.A.; Lee, S.S.; Norton, S.B. Response of Chlorophyll a to Total Nitrogen and Total Phosphorus Concentrations in Lotic Ecosystems: A Systematic Review Protocol. Environ. Evid. 2017, 6, 18. [Google Scholar] [CrossRef]
- Abbaspour, K.C. Swat-Cup: SWAT Calibration Uncertainty Program—A User Manual; Swiss Federal Institute of Aquatic Science and Technology: Dübendorf, Switzerland, 2013. [Google Scholar]
- Wu, H.; Chen, B. Evaluating Uncertainty Estimates in Distributed Hydrological Modeling for the Wenjing River Watershed in China by GLUE, SUFI-2, and ParaSol Methods. Ecol. Eng. 2015, 76, 110–121. [Google Scholar] [CrossRef]
- Abbaspour, K.C.; Johnson, C.A.; van Genuchten, M.T. Estimating Uncertain Flow and Transport Parameters Using a Sequential Uncertainty Fitting Procedure. Vadose Zone J. 2004, 3, 1340–1352. [Google Scholar] [CrossRef]
- Moriasi, D.N.; Arnold, J.G.; Van Liew, M.W.; Bingner, R.L.; Harmel, R.D.; Veith, T.L. Model Evaluation Guidelines for Systematic Quantification of Accuracy in Watershed Simulations. Trans. ASABE 2007, 50, 885–900. [Google Scholar] [CrossRef]
- Nash, J.E.; Sutcliffe, J.V. River Flow Forecasting through Conceptual Models Part I—A Discussion of Principles. J. Hydrol. 1970, 10, 282–290. [Google Scholar] [CrossRef]
- Gupta, H.V.; Sorooshian, S.; Yapo, P.O. Status of Automatic Calibration for Hydrologic Models: Comparison with Multilevel Expert Calibration. J. Hydrol. Eng. 1999, 4, 135–143. [Google Scholar] [CrossRef]
- Moriasi, D.; Gitau, M.; Pai, N.; Daggupati, P. Hydrologic and Water Quality Models: Performance Measures and Evaluation Criteria. Trans. ASABE American Soc. Agric. Biol. Eng. 2015, 58, 1763–1785. [Google Scholar] [CrossRef]
- Alam, M.A.; Rahman, M.M.; Biswas, J.C.; Akhter, S.; Maniruzzaman, M.; Choudhury, A.K.; Jahan, M.A.H.S.; Miah, M.M.U.; Sen, R.; Kamal, M.Z.U.; et al. Nitrogen Transformation and Carbon Sequestration in Wetland Paddy Field of Bangladesh. Paddy Water Environ. 2019, 17, 677–688. [Google Scholar] [CrossRef]
- Doherty, J.E.; Hunt, R.J. Approaches to Highly Parameterized Inversion—A Guide to Using PEST for Groundwater-Model Calibration; USGS: Reston, VA, USA, 2010. [CrossRef]


Disclaimer/Publisher’s Note: The statements, opinions and data contained in all publications are solely those of the individual author(s) and contributor(s) and not of MDPI and/or the editor(s). MDPI and/or the editor(s) disclaim responsibility for any injury to people or property resulting from any ideas, methods, instructions or products referred to in the content. |
© 2023 by the authors. Licensee MDPI, Basel, Switzerland. This article is an open access article distributed under the terms and conditions of the Creative Commons Attribution (CC BY) license (https://creativecommons.org/licenses/by/4.0/).