Article

Design of an Evaluation System for Disruptive Technologies to Benefit Smart Cities

1
School of Public and Management, Tsinghua University, Beijing 100084, China
2
China Gezhouba Group No. 2 Engineering Co., Ltd., Chengdu 610091, China
3
Beijing National Research Center for Information Science and Technology, Tsinghua University, Beijing 100084, China
4
International School, Huaqiao University, Quanzhou 362021, China
*
Author to whom correspondence should be addressed.
These authors contributed equally to this work.
Sustainability 2023, 15(11), 9109; https://doi.org/10.3390/su15119109
Submission received: 31 March 2023 / Revised: 23 May 2023 / Accepted: 1 June 2023 / Published: 5 June 2023
(This article belongs to the Special Issue Advanced Research on Sustainable Smart City)

Abstract

:
Technological empowerment has facilitated the development of cities, which have progressed from pre-industrial to industrial to information-based and are currently transitioning towards the advanced stage of smart cities. The evolution and transformation of cities are fuelled by technology, which serves as a key driver. Disruptive technologies are radically scientific innovations that dramatically change the way consumers, businesses, and industries operate by destroying the value of existing technical competencies, thereby providing organisations with the capability or technical foundation to alter their business environments. To ensure that a city has a clear understanding of its smart city development direction, it is crucial to establish a scientifically valid and reliable evaluation index and method to analyse and recognise the disruptive technologies closely related to industrial development, transformation, and competitiveness in smart cities. However, there is a paucity of study on this topic. This paper addresses this research gap by developing a framework for disruptive technology identification and evaluation for smart cities using an entropy weight method and analytic hierarchy process. The evaluation index system contains 5 primary indicators and 11 secondary indicators according to the connotation of disruptive technologies in smart cities. The feasibility and effectiveness of the proposed framework are verified in the field of information science. This study provides technical knowledge and theoretical support for the evaluation and construction of smart cities.

Graphical Abstract

1. Introduction

The rise in technological advances and innovations has resulted in the development of health, climate, education, transportation, and economics that can obtain sustainable competitive advantages and promote the quality of life in cities. According to the United Nations, the world’s urban population is projected to reach 68% by 2050 [1]. Rapid urbanisation with continuous population growth presents challenges, as cities face issues such as poverty, inequality, competitiveness, and environmental degradation. Technology is one of the domain components for strategising smart cities and is currently inextricably linked with economic growth. Public and private services in cities can be transformed by smart technologies to integrate real-time information and communications and citizens’ requirements and needs and to enhance liveability, workability, and sustainability. During a period of sluggish growth, the adoption and investment of key technologies offer extraordinary opportunities for citizens and fuel the growth of cities by seeking new methods to cut and reduce costs, create demand, and drive innovation. Finally, this becomes a virtuous circle that sparks a new wave of wealth creation.
Christensen first introduced the concept of disruptive innovation [2]. Subsequently, the theory has been widely discussed and applied in various industries. While there are various perspectives on disruptive innovation, one practical application is the prediction and management of disruptive technologies. Recognising the emergence of new, potentially disruptive technologies and trends is a challenge that can be addressed by forecasting change and being proactive through comprehension of the mechanics of innovation, determining future drivers, and gathering information [3]. Studies on disruptive innovation forecasting rely on empirical evidence, hindsight evaluation technology roadmap scenario analysis, diffusion models, the literature, and patent-based methods. However, disruptive technologies are mostly ex post and difficult to predict. Furthermore, ex ante prediction and evaluation frameworks are not well established [4]. Previous studies have explored the impact of disruptive technologies on multiple aspects of smart cities, including transportation and mobility, health, real estate, and smart homes [5,6]. Some studies have focused on one or several specific fields of disruptive technologies in smart cities such as IoT, AI, big data, and blockchain [7,8,9,10]. This narrow focus limits our understanding of the full potential and impact of disruptive technologies on cities and fields within them [11]. Therefore, a more comprehensive approach is required to understand the roles of these technologies in shaping smart cities. This study explores the potential challenges and opportunities of seven key technologies and applications that are crucial for the development of a smart cities. From the perspective of technological breakthroughs and cutting-edge technology, these fields encompass information science, material science, manufacturing, transportation, the modern service industry, and frontier research.
This study aims to design and verify a framework for evaluating disruptive technologies in smart cities. By focusing on the underlying factors that lead to disruptive technologies, this study proposes a methodological framework for identifying disruptive technologies from a scientific perspective. This framework is significant for predicting future technological developments, mitigating the risks of technological surprises, and shaping industrial advantages. The remainder of this paper is organised as follows: Section 2 presents the background of previous research. Section 3 introduces the overall research framework and detailed steps to select disruptive technologies in smart cities, and Section 4 presents the results of our research. The last section draws conclusions and outlines future work.

2. Background

The concept of smart cities has been widely debated and has many definitions [12,13]. However, smart cities do not merely automate routine functions or optimise the use of space, buildings, or traffic management systems. They should also provide support for monitoring and understanding economic and social activities in cities, improving efficiency and quality of life and ensuring equity. In addition, smart cities offer opportunities for smarter and more accessible communication, particularly between citizens and local government or between suppliers and consumers [14]. According to Muvuna et al. [15], smart cities must be re-envisioned to become more sustainable, integrated, and collaborative. Many initiatives aim to address specific issues that affect city administrators and citizens, such as parking, air pollution, traffic congestion, waste management, tax management, and health information management. Chourabi et al. identified eight groups of critical factors that are crucial for shaping a framework for the development of smart cities: management and organisation, technology, governance, policy context, people and communities, economy, built infrastructure, and the natural environment. These factors currently serve as the foundation for determining the priorities of local government agendas [16].
Smart cities are seen as a solution to address the challenges brought about by urbanisation. A study by McKinsey shows that the implementation of smart city technology can improve various aspects of quality of life, including crime reduction, improved health, streamlined commuting, and reduced carbon emissions, by 10–30% [17]. Features such as open data, infrastructures, mobile apps, public participation tools, and IoT platforms are designed to provide citizens with access to the resources they need. According to Batty et al., ICT in a smart city is ‘integrated with the traditional infrastructure and coordinated using digital technologies’ [18]. This creates a highly interconnected system that provides real-time access to information, products, and services. The level of integration of these subsystems is a measure of a city’s intelligence. Massive amounts of data are produced daily in smart cities. Smart cities use data and technology to monitor and manage various operational aspects. These data are then analysed to identify areas for improvement and optimise decision-making. For instance, AI is utilised as a management and information-mining tool to gather intelligence in proactive management and job prioritisation and for collecting geospatial features in maps. From a technical perspective, improvements in the performance and efficiency of urban services and amenities in smart cities are not solely dependent on one or several technologies. Smart cities encompass a vast array of applications in various domains, including smart homes [19], real estate [20], healthcare [21], transportation, and mobility [22].
Disruptive technologies refer to new technologies or innovations that fundamentally changes procedures and disrupt existing market or industry structures. Moreover, they have the potential to create new markets, displace existing products or services, and alter the competitive landscape [23]. Therefore, it is important to identify disruptive technologies. However, various organisations and experts have distinct perspectives and objectives regarding the methods used to identify disruptive technologies.
Government agencies play a crucial role in identifying disruptive technologies that align with a country’s medium and long-term needs at macro perspective. DARPA uses qualitative methods such as the Delphi technique and brainstorming method to identify future needs, evaluate problems, and develop fund-related technologies. The National Research Council (NRC) of the United States proposed a conceptual model of persistent forecasting for disruptive technologies [24]. The Russian Foundation for Advanced Research and Impulsing Paradigm Change through Disruptive Technologies (ImPACT) employ expert evaluation methods and process mechanism design to identify disruptive technologies.
To guide the development of related industries, think tanks should release relevant forecast reports based on customer requirements. The center for New American Security, McKinsey & Company, Massachusetts Institute of Technology (MIT), and other influential think tanks mostly use qualitative methods, such as questionnaires or surveys, brainstorming, and scenario analysis, to predict and identify disruptive technologies. These methods include the technology readiness level, assessment, and roadmap, which rely on expert opinions combined with modelling tools or simulations for analysis.
Researchers have leveraged the theories of disruptive technology entry, technology-market competition, and technical performance to propose different technical routes using existing identification and prediction methods. These include methods based on technological evolution (such as technology life cycle, TRIZ, diffusion model, and data envelopment analysis), future scenario assumptions, and quantitative analysis using cluster, knowledge mapping, and patent analysis [25,26]. These methods identify rapidly growing disruptive technologies at the industry level and provide data support for predicting future trends. Although scenario assumptions are useful in the early stages of technological development, quantitative methods provide factual basis and are suitable for after fact research and analysis.
To successfully adopt and benefit from disruptive technologies, organisations must have the capacity to prepare for and embrace change. However, the identification of disruptive technologies and methods employed to achieve goals varies depending on the objectives and perspectives of government agencies, think tanks, and scholars. Government agencies are primarily concerned with identifying major disruptive technologies in the early stages of development to enhance a country’s competitiveness and address societal challenges. Government agencies focus on developing methodological frameworks that integrate different functions and emphasise the organisational convenience and feasibility of process mechanisms. Think tanks aim to guide the commercialisation of mature technology by exerting influence, with a focus on identifying technologies in industrial formation stage. Researchers have studied recognition methods applicable to different stages of technological development and explored different technical routes. The methods employed by scholars emphasise theoretical foundations and exploratory of research.
Disruptive technologies have profoundly impacted cities by creating new opportunities for economic and social growth. However, not all new technologies are disruptive. Therefore, it is challenging to identify new and potentially disruptive technologies and trends in applications. Disruptive technologies are characterised by their simplicity, affordability, and accessibility, making them appealing to a wide range of customers. Disruptive technologies can challenge established businesses and industries, as they offer new and often superior solutions to existing problems and create new opportunities for growth and innovation in smart cities. This study focuses not only on selecting disruptive technologies in the early stages but also on the transition and commercialisation of disruptive technologies. In particular, the selected disruptive technologies are funded by university-industry collaboration and are likely to have a great impact on smart cities in short development cycles. Therefore, it is necessary to establish a framework for identifying and evaluating disruptive technologies that prioritise the ease and feasibility of organisational processes and the simplicity and practicality of methods to facilitate the development of smart cities.

3. Research Design

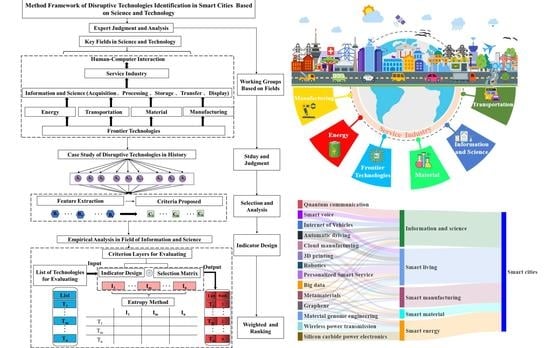
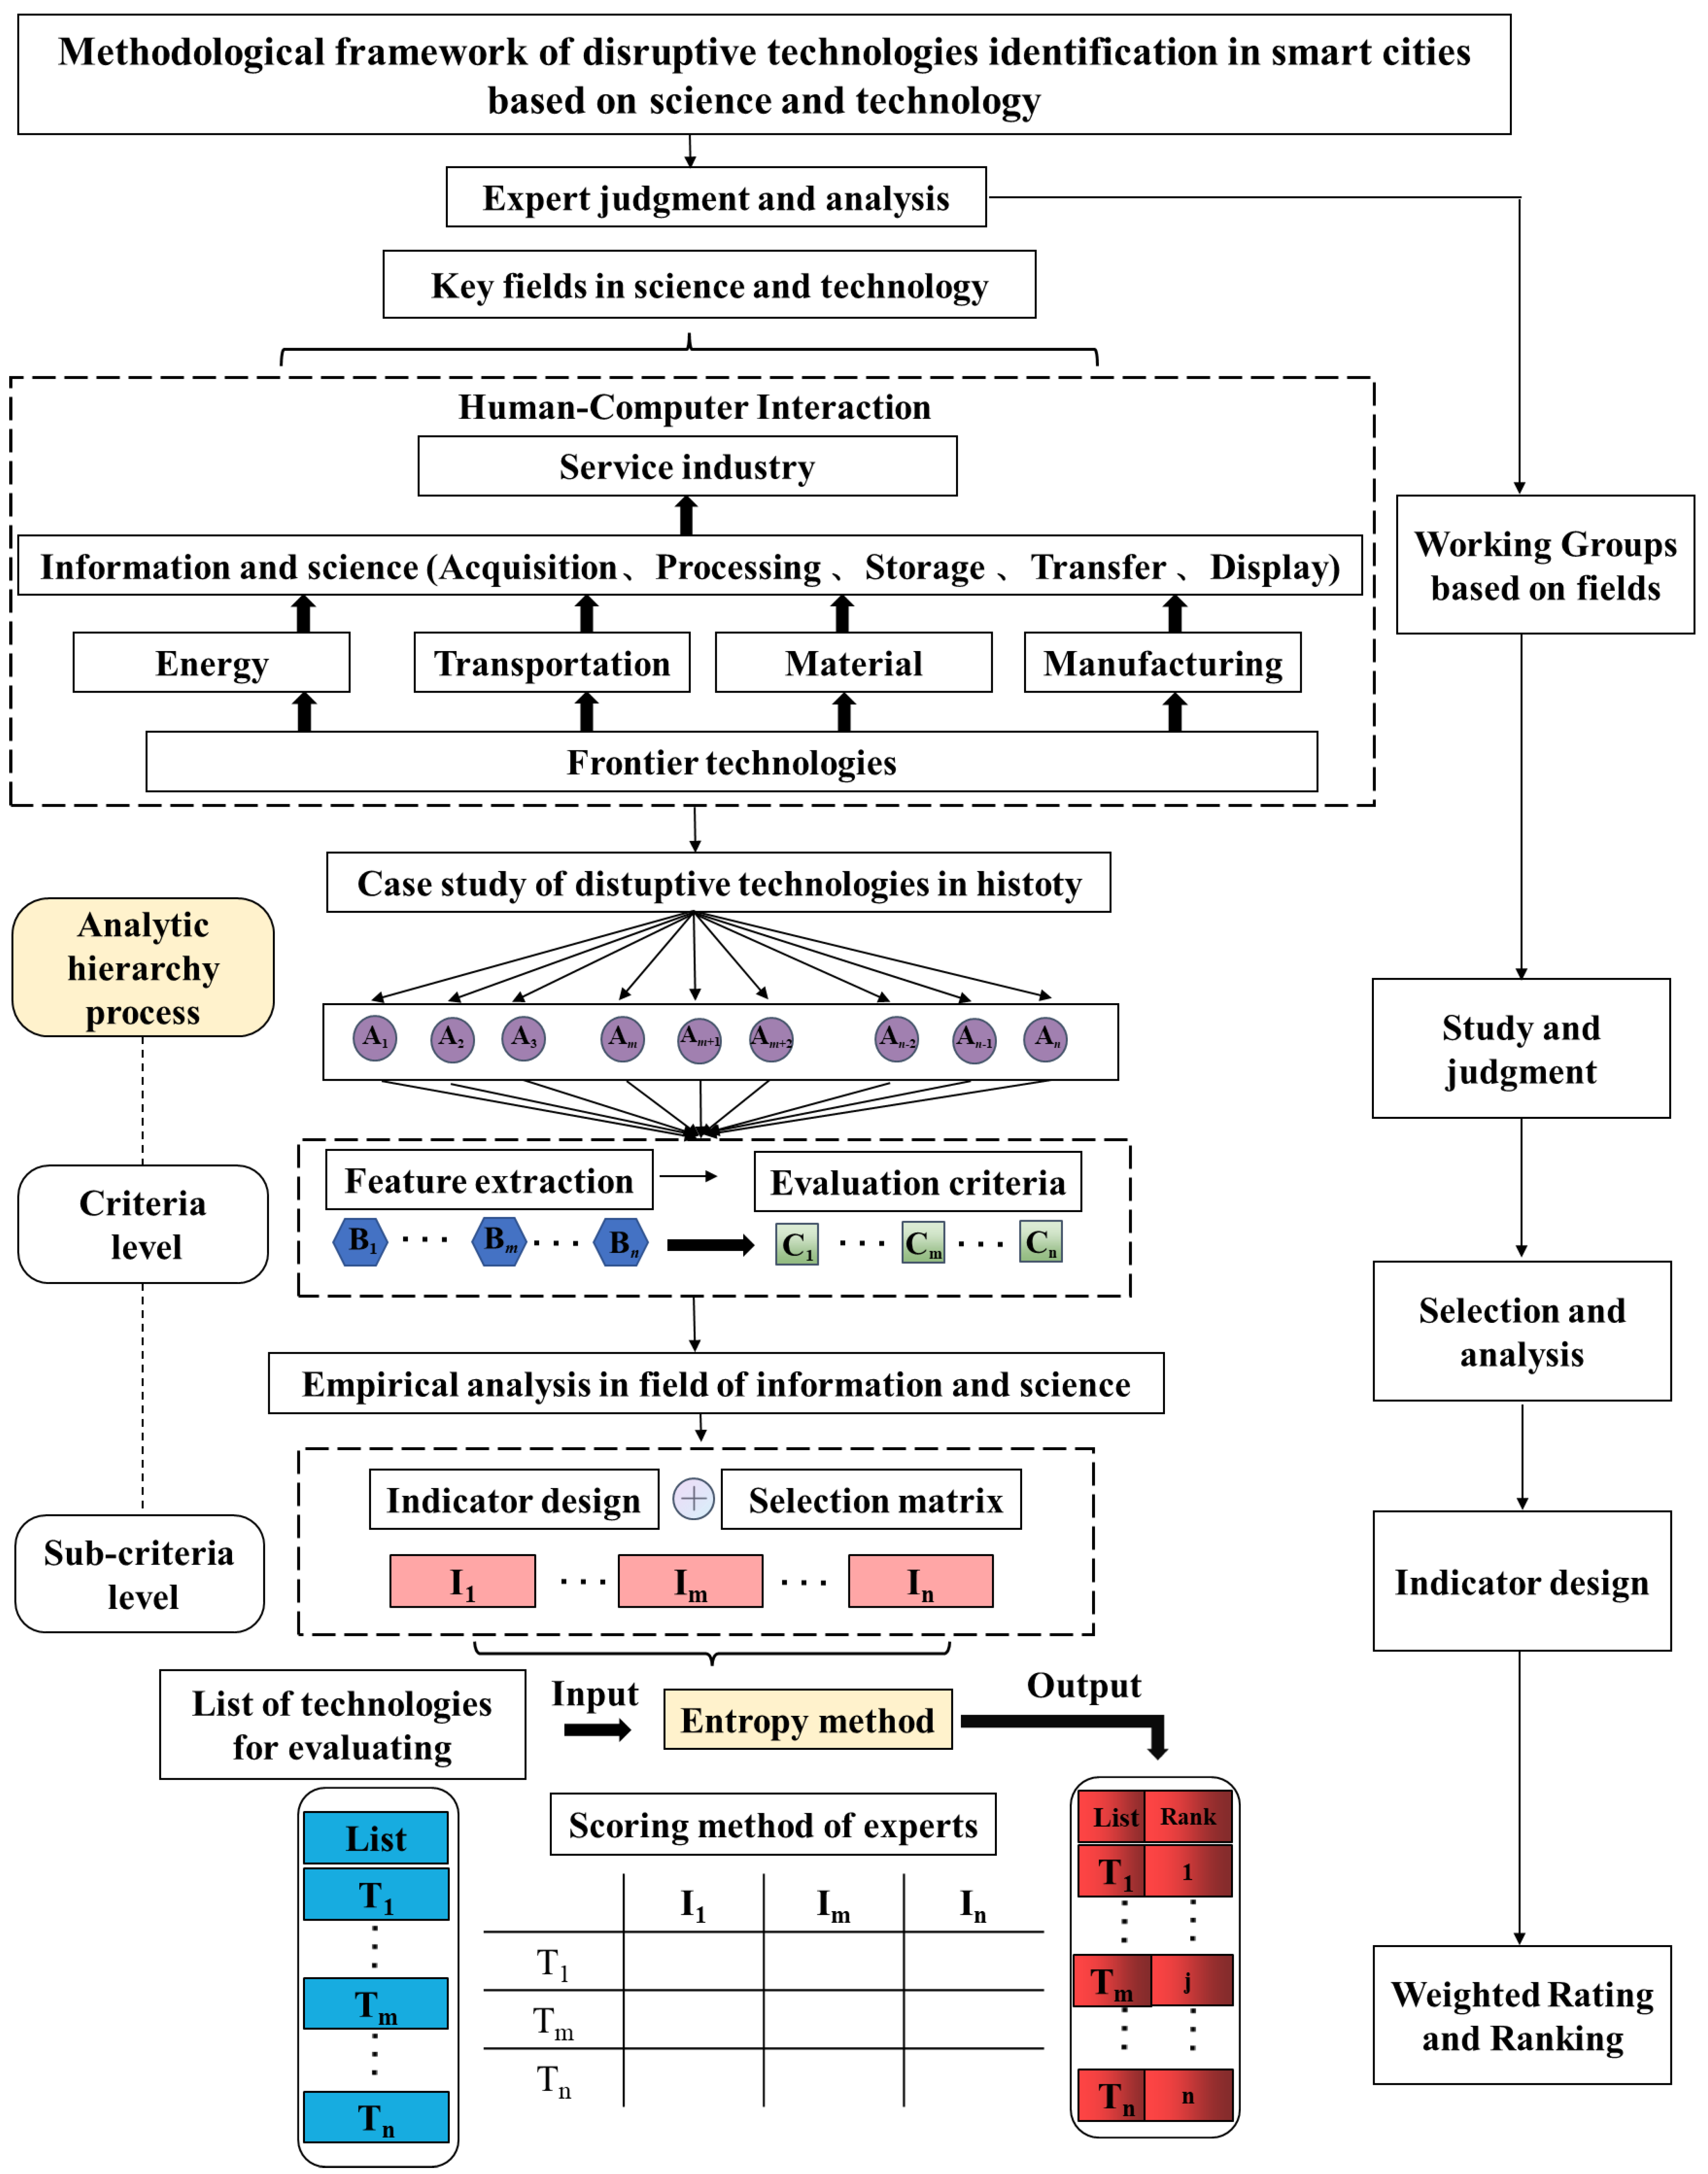
3.1. Overall Research Framework

The research and recognition of disruptive technology has gained significant attention in recent years. However, its definition remains ambiguous and whether it can be predicted ex ante has not been adequately addressed. Moreover, from different perspectives such as technological development and industrial applications, contrasting can be drawn regarding disruptive technologies.
The design concept this research has three parts; discovery of technologies, selection of disruptive technologies, and evaluation of disruptive technologies. The framework of the evaluation system for disruptive technologies is shown in Figure 1. We invited 295 experts including full professors and senior researchers from universities, research institutions, and enterprises via email and telephone. A total of 257 experts agreed to attend these meetings, and 231 experts participated in the meetings. In addition, 28 experts came from other countries. Experts were grouped according to their areas of expertise. The number of experts in each group was more than 30, and the percentage of experts from other countries in each group was more than 13%. Seven main technical fields that were mostly related to smart cities were selected based on the majors of invited experts. The seven fields were information science and technology, materials, energy, transportation, manufacturing, modern industry, and research. According to this study, there were three main steps in the framework.
Step 1: Propose criteria for disruptive technologies related to smart cities. The representative disruptive technologies from each field were selected based on their general characteristics. Then, the main reasons for this disruptive technology were identified, and the trajectory of the disruptive technology is analysed. Finally, the criteria for evaluating disruptive technologies in each field were presented by integrating the potential applications of disruptive technologies and the characteristics of key technologies that are crucial to smart cities.
Step 2: Disruptive technologies were selected from the current cutting-edge technologies based on the proposed criteria. Considering the trends in global science and technology and the current development level of smart cities, potentially disruptive technologies for smart cities were recognised and selected. In addition, the impact of the forecasted disruptive technologies was discussed in detail.
Step 3: Evaluate the selected disruptive technologies. Taking the field of information and science of smart cities as an example, the feasibility and effectiveness of the proposed framework were verified using the entropy weight method.
Each of these steps is discussed in detail below (Figure 1). After sixteen subjects of disruptive technologies in seven fields are selected based on the proposed framework, the steps of a case study in the information and science of smart cities are described and are equally applicable to the design system of any other field. However, the evaluation indicators for the field of information and science are not suitable for others.

3.2. Detailed Steps

3.2.1. Cases Study and Feature Extraction

The first step was to extract the features of typical historical cases of disruptive technologies. One technology from each field was selected by the experts. Typical cases of disruptive technologies and their features were described as follows:
1. Internet: Internet technology has disrupted Asynchronous Transfer Mode (ATM) technology, resulting in significant positive impacts on human society, revolutionary changes in social production and daily life, and the advancement of human civilisation to a higher stage. Although ATM technology represented the ideals of the telecommunications industry with a reliable, manageable, and network-centric network, it faced obstacles in the later stages of development. With the evolution of markets and technology, the Internet has emerged as an embodiment of thinking in the computer industry, featuring an available, best effort, and end-to-end network design. The technical features of ATM and IP manifest the distinguishing attributes of the telecommunications and computer industries, respectively. The telecommunications industry has gradually evolved over the past century and has typically been constrained by government regulations. Its products and services demand high reliability and interoperability among the terminal equipment. In contrast, the computer industry is renowned for its rapid innovation and low-cost requirements; however, it can tolerate a certain level of unreliability, offering greater potential for development and expansion.
2. Silicon Transistor: The advent of silicon semiconductors disrupted the use of equipment based on electronic tubes and circuits during the early stages, leading to the widespread bankruptcy and replacement of electronic tube manufacturers, thereby causing the entire industry to undergo a significant transformation. The widespread implementation of transistor circuits has revolutionized the way of life, allowing for a shift from a closed society to one of information-sharing and intelligence. The re-placement of materials engenders novel social forms, lifestyles, and modes of competition. Technological and process upgrades expedite industry replacement. Third-generation semiconductors or novel semiconductor materials are poised to serve as technical underpinnings in the development of an intelligent society. Pioneering breakthroughs in the next generation of semiconductor materials and devices will engender technological transformations and reshuffle the international semiconductor industry landscape.
3. AC transmission: AC transmission technology, with its technical advantages of flexible voltage transformation and low long-distance transmission loss, as well as the market advantages of significantly reducing the cost of power supply, has widely replaced the DC transmission mode. This is inconvenient for long-distance transmission and has occupied an absolute dominant position in the past century. This phenomenon attributed to several factors. First, long-term basic theoretical research on AC transmission has led to the emergence of disruptive technologies. Second, the industry’s need to overcome bottlenecks has sparked the development of AC transmission. Third, the combination of key technological breakthroughs and large-scale industrial applications resulted in the emergence of AC transmission. Finally, as a disruptive technology, AC transmission is timely and relative to the existing technical system, making it possible to replace the existing dominant technology.
4. Computer-Aided Design (CAD): CAD technology overcomes the limitations of human–computer interaction, facilitating the real-time exchange of information between people and computer-aided design machines. This has disrupted traditional design methods and enabled design automation, leading to improved levels of product and engineering design, reduced consumption, shortened cycles of scientific research and new product development, and significantly increased labour productivity. The emergence of new technologies in the manufacturing field is closely linked to the development of relevant fields, especially information technology. The application of new technologies in manufacturing aims for large-scale implementation across the entire field rather than being limited to small research, to achieve disruptive effects.
5. Combustion engine vehicles: The advent of internal-combustion engines has revolutionised human transportation, replacing carriages as the primary mode of travel after over 5000 years. Its impact on the transportation industry is immense and creates vast industrial opportunities. This disruptive technology has created tremendous opportunities for the automotive industry. The development of the core and related technologies should be mutually reinforced to promote each other.
6. Internet payment: Since the turn of the millennium, Internet payment has exhibited a remarkable surge, thus becoming a significant payment option globally and a dominant payment method and lifestyle choice for younger generations. The development and application of technology have facilitated the emergence of innovative forms and pathways to achieve certain functions and services, potentially leading to external transformation.
7. Graphical User Interface (GUI): GUI technology refers to a computer interface displayed in graphical mode that greatly facilitates non-professional users. This technology was ground-breaking, completely abandoning the early interactive form based on text commands or machine instructions and using graphical symbols that are easier for people to perceive and operate to represent various complex operating commands. This created a new way for people to use computers. The technical implementation of a GUI is feasible, considering factors such as hardware limitations and software compatibility. Finally, the introduction of GUI was expected to promote scientific breakthroughs and lead to industry changes by improving user experience and productivity, ultimately advancing the field of human–computer interaction.
After reviewing historical typical cases of disruptive technologies, the features of disruptive technologies in each field were extracted in Table 1.

3.2.2. Smart Cities Requirements, Criteria Proposed

Understanding the technical requirements of smart cities was essential for designing the proposed framework. As shown in Figure 2, the advent of information and science technologies has led to the emergence of smart cities, characterised by the widespread application of information and intelligent technologies in various aspects of production and life. The realisation of these smart cities relies heavily on the extensive adoption of information and science technologies and utilisation of advanced energy sources and smart materials. In addition, the domains of production and daily life represent the main areas for the deployment and manifestation of advanced intelligent technology.
There are several common features of disruptive technologies in each field. The criteria for selecting disruptive technologies in smart cities are as follows:
(I)
It shows significant improvement, transformation or substitution in function or performance simultaneously.
(II)
It directly or indirectly results in revolutionary changes or expansions in certain aspects or specific areas of production and life in smart cities, including production methods, business models, social orders, and rules.
(III)
A single or integrated technology, product, system, or services have the ability to achieve big prospect of application or a huge impact.

3.2.3. Determine Evaluation Indicators by Analytic Hierarchy Process and Verify the Proposed Framework Using Entropy Weight Method

Disruptive technologies for smart cities were selected based on the proposed criteria. Over the past 20 years, the way of life in smart cities has been profoundly affected and changed, leading to the emergence of various new industries and business models through technological innovation, particularly in the field of information science. To verify the feasibility and effectiveness of the designed framework for disruptive technology identification, information science was chosen as a case study.
According to the criteria for selecting disruptive technologies, 12 secondary indicators were identified (Table 2). Indicators in the evaluation system for disruptive technologies should be comprehensive and unbiased to meet these criteria. Indicators 1–4 are in line with the first criterion for selecting disruptive technology; indicators 5–8 are satisfied with the second criterion, and indicators 9–10 agree with the third criterion. A 100-mark system was used to score each indicator.
Entropy is a concept in thermodynamics that refers to the measure of a system’s disorder or uncertainty. Entropy is used as a quantitative measure of the amount of information contained in a dataset or index system. By assessing the amount of information in the data of an index system, entropy provides a means of quantifying the information content of a system. In this study, 5 primary indicators and 12 secondary indicators are scored on a scale of 1 to 10. The submitted technologies are scored on a scale of 1 to 100. The first step is normalisation of scores, x′ij, and its calculation method is as follows:
x i j = ( x i j min ( x j ) ) / ( max ( x j ) min ( x j ) )
The standardised value of the ith indicator in the jth technologies is denoted as pij:
p i j = x i j / i = 1 n x i j
The entropy value Ei of the ith indicator is defined as:
E j = i = 1 n p i j ln p i j / ln ( n )
From Equation (3), pij should bigger than zero. If pij is equal to zero, the entropy value will be zero. Entropy weight of the jth index is determined by Equation (4).
w j = ( 1 E j ) / ( n i = 1 n E j )
Once the hierarchy has been established, the next step is to evaluate the criteria in pairs to determine their relative importance and weight. The relative weight in analytic hierarchy process could be obtained:
x i j = w i / w j
X is judgment matrix:
X = [ x 11 x 12 x 1 m x 21 x 22 x 2 m x m 1 x m 2 x m m ]
Zi is Geometric mean:
Z i = x 11 x 12 x 1 m m
The weight coefficient of the i-th index w0i:
w i 0 = Z i / i = 1 m Z i
The largest Eigen root of the judgment matrix λmax:
λ max = i = 1 m ( X w 0 ) i n w i 0
The consistency index and average random consistency index of the matrix C.R. could be calculated, respectively:
C . I . = ( λ max n ) / ( n 1 )
C . R . = C . I . / R . I .
In the paper, n is 4. When C.I. is equal to zero, the judgment matrix has completion consistency; the larger value of C.I. is, the worse the degree of consistency. The R.I. could be found in in the corresponding look up table [27]. In our case, for matrix size of 5 and 11, the R.I.s are equal to 0.89 and 1.49, respectively. When C.R. is smaller than 0.1, the positive and negative judgment matrix has an acceptable degree of consistency; otherwise, the judgment matrix needs to be readjusted.
gi is the score given by experts. If there is only one maximum or maximum of gi, the maximum or maximum gi will be removed. The final score of one indicator Gi is the average number of total scores. Then, the obtained w0i is substituted in Equation (12), and the final scores Si can be directly calculated as follows:
S i = i = 1 m ( w 0 i G i )
The Shapiro–Wilk test is a statistical test of the hypothesis that is applied to a sample whether the sample is likely to originate from a normal distribution. The formula for the W value is given as follows:
w j = ( i = 1 n a i S i ) / i = 1 n ( S i S i ¯ )
In order to calculate the statistic w, S’i should be sorted in increasing order of Si, ai values are constants generated from the covariances, variances, and means of the sample from a normally distributed sample.

4. Results

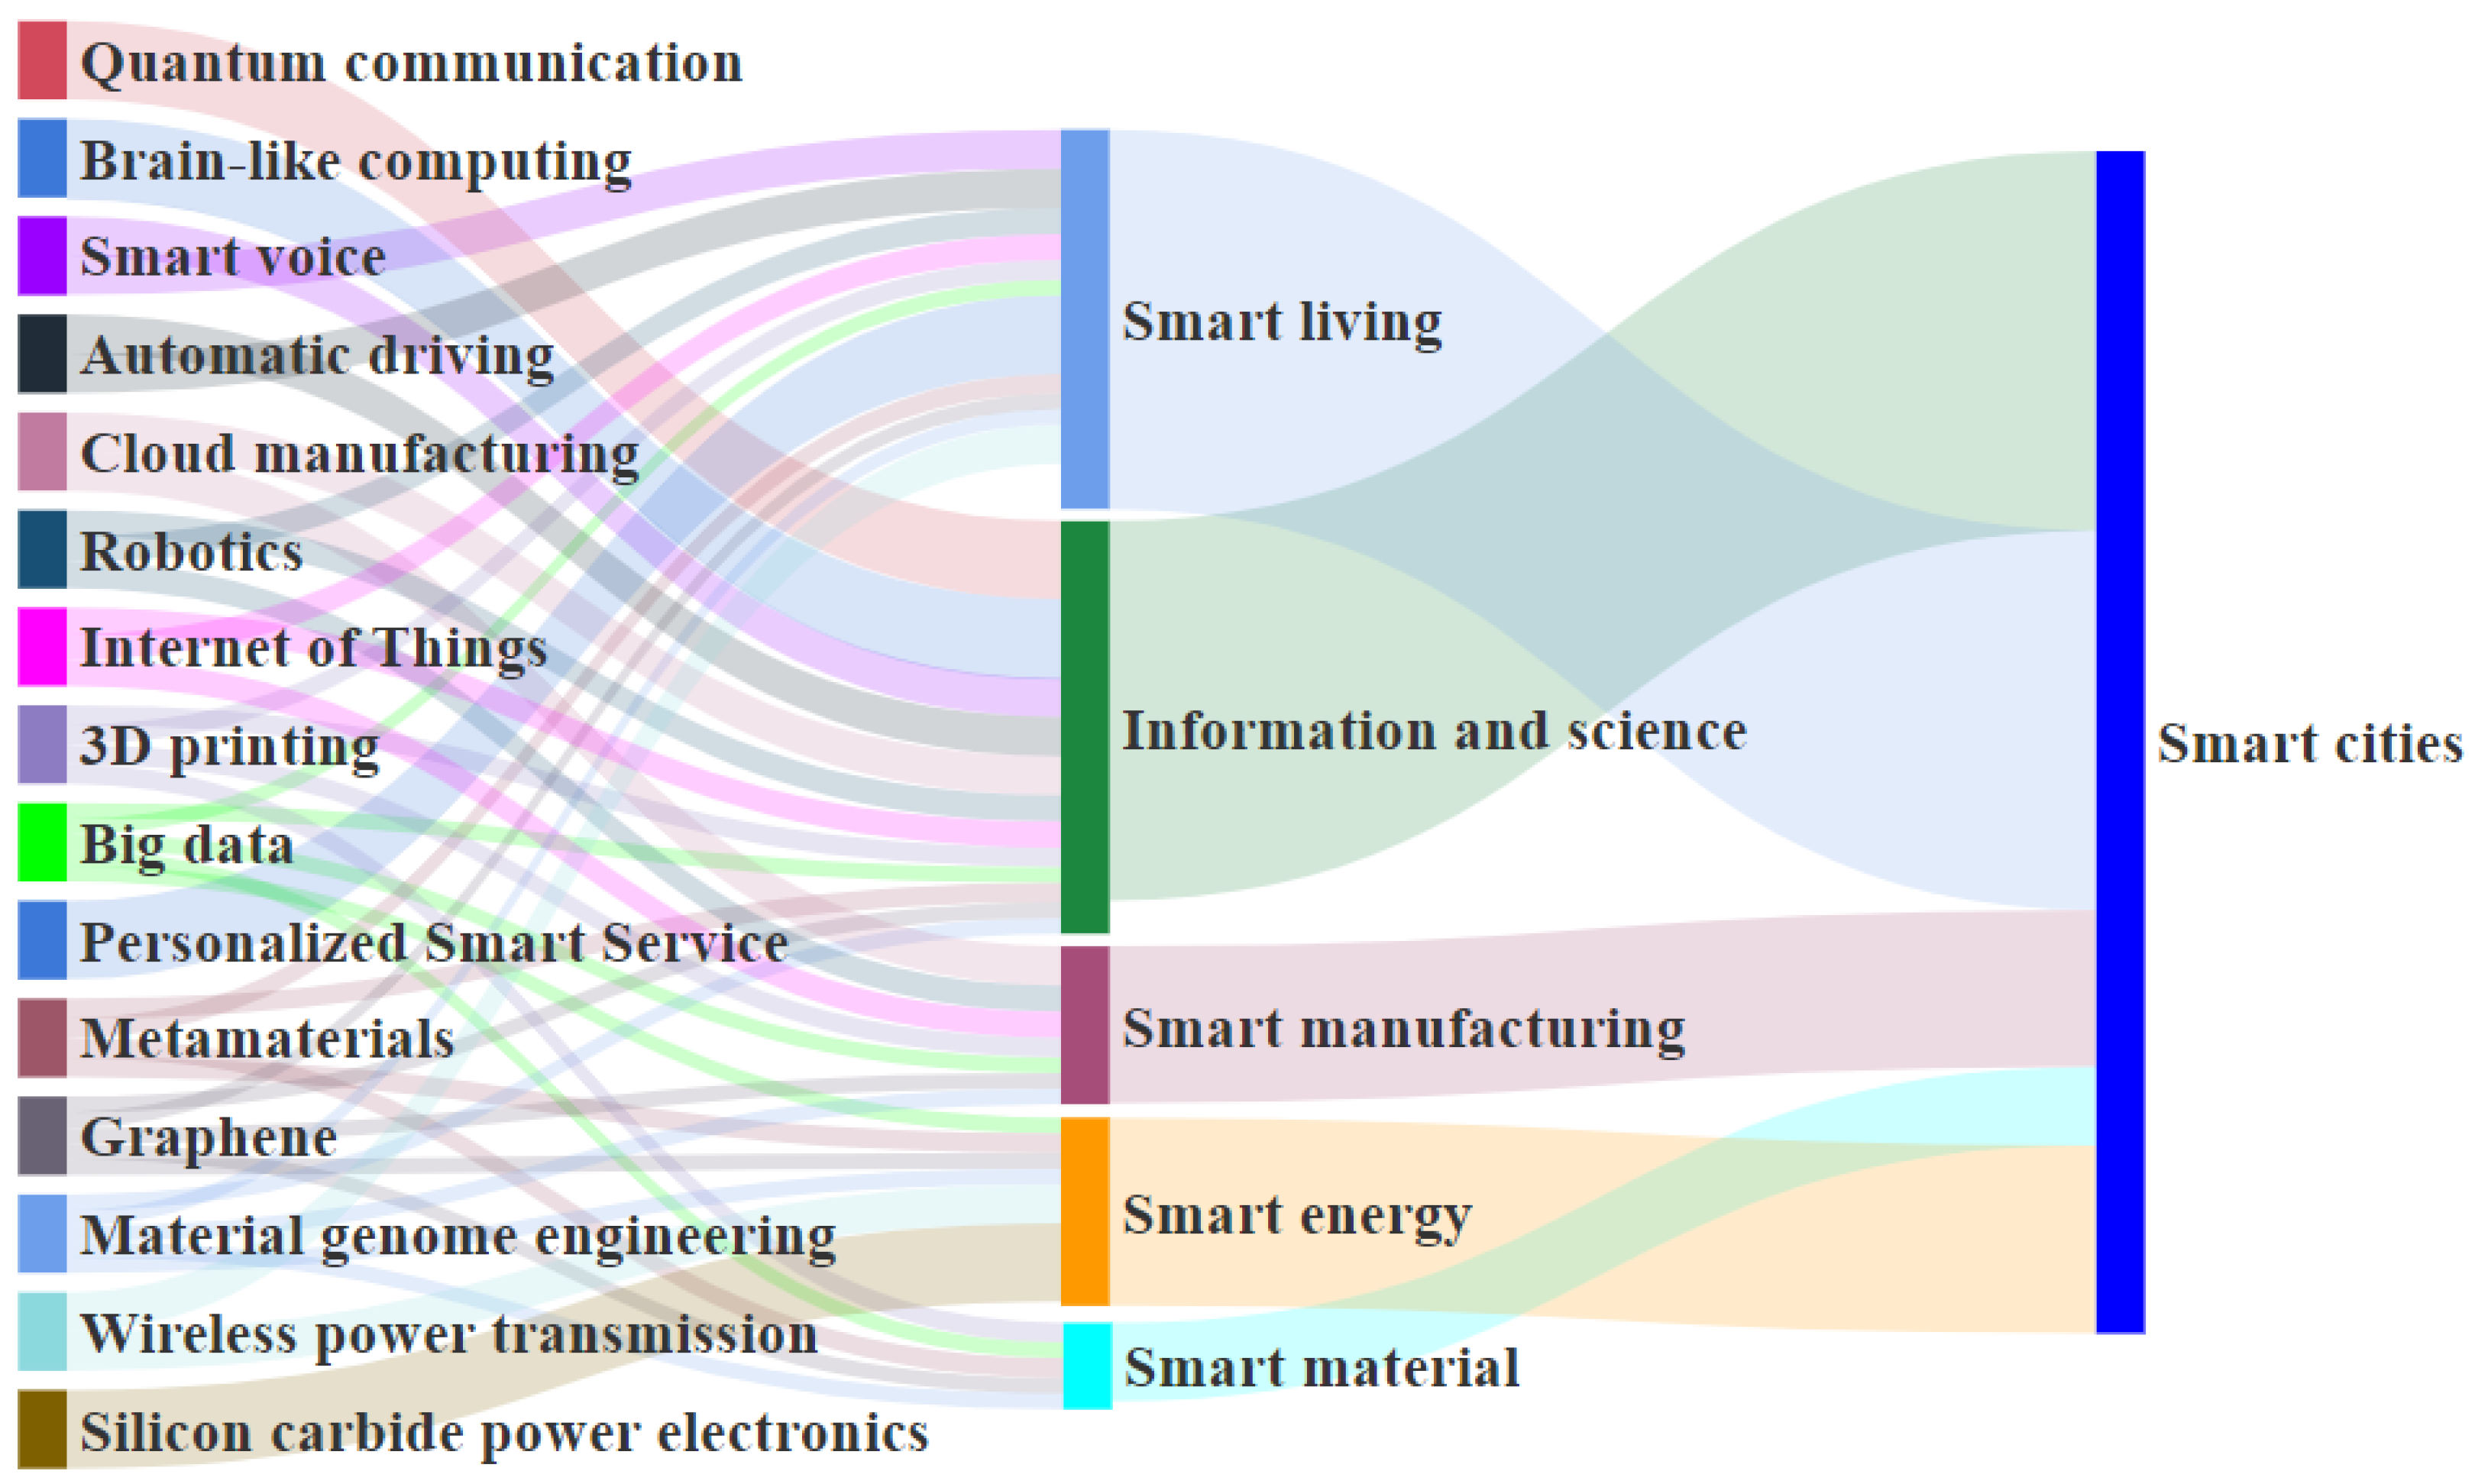
4.1. Selected Disruptive Technologies

Relationship between Disruptive Technologies and Key Areas

Based on the function and role of each selected disruptive technology in Table 3, a preliminary analysis of the relationship between each technology and development of the key areas of an intelligent society can be conducted. The findings reveal that over three-quarters of the technologies have a direct impact on more than two key areas of an intelligent society in Figure 3. Robots, 3D printing, big data, metamaterials, and material genome engineering, among other information, materials, and manufacturing technologies, have a direct impact on more than three key areas of an intelligent society. In particular, big data, graphene, and material genome engineering have significantly influenced all five key areas of an intelligent society.
A correlation analysis of disruptive technologies and key fields can provide insights into the expected impact of these technologies on the development of various fields and macro analysis conclusions about their processes and paths. In the information field, technological changes are mainly driven by the progress and application of basic technologies such as big data and smart voice. These technologies have revolutionised information acquisition and processing capabilities and, in combination with secure communication technology and efficient smart technology, provide the possibility for the development of various smart production and life application technologies and products. The development of smart cities is enabled by the extensive penetration of information and smart technologies into application fields, leading to the emergence of smart production and life forms.
A correlation analysis between disruptive technologies and key fields can offer valuable insights into the anticipated impact of these technologies on the advancement of various domains, including sustainability. By focusing on sustainability, the analysis can shed light on the potential environmental, social, and economic implications of disruptive technologies in different sectors. Specifically, in the context of the information field, technological advancements are primarily propelled by the progress and implementation of fundamental technologies such as big data and smart voice. These advancements have revolutionised the capabilities of information acquisition and processing. Moreover, when combined with secure communication technology and efficient smart systems, they facilitate the development of diverse smart production and life application technologies and products that contribute to sustainable practices.
In the field of smart materials, information processing, new material design, and manufacturing technologies have enabled key smart materials, electronic information materials, and smart manufacturing materials that support the development of smart city application technologies. This has improved the overall transformation and innovation of smart materials.
In the field of smart energy, the management of energy transmission, high-performance energy electronic materials and devices’ design and manufacturing capabilities are expected to drive technological progress and change in the energy field, making the entire energy system smarter, more efficient, and less consuming.
In the field of smart manufacturing, the design and interconnection capabilities of electronic information functional materials and the construction of new smart manufacturing and execution systems enable the enhancement of the manufacturing production model to become networked, smart, ubiquitous, and personalised.
In the field of smart life, the acquisition, processing, and transmission of information as well as the design and manufacturing capabilities of related smart materials and systems make transportation tools and systems the earliest fields to realise smart devices. From this starting point, intelligence can be further developed to infiltrate other areas of human life, transforming various life technologies into smart technologies.
The advancement of smart cities relies on the widespread integration of information-based and smart technologies into various application fields. This integration paves the way for the emergence of innovative production and lifestyle models that align with sustainability principles. These smart city initiatives leverage the potential of information-based and smart technologies to optimise resource utilisation, enhance energy efficiency, promote environmental preservation, and foster socio-economic well-being. By considering sustainability as a key aspect, the correlation analysis of disruptive technologies and key fields can provide a holistic understanding of the transformative processes and pathways involved. This enhanced understanding can guide policymakers, researchers, and practitioners in harnessing the full potential of disruptive technologies to create sustainable and resilient cities for the future.

4.2. Empirical Analysis Using Entropy Weight Method

According to the proposed primary and secondary indicators in Table 2, experts assigned a score for each primary and secondary indicator on a scale of 1 to 10. Based on Equations (1)–(7), the judgment matrices of the pairwise comparisons for the primary and secondary indicators are shown in Table 4 and Table 5, respectively. After applying the AHP, the weights and eigenvalues of the two judgment matrices can be calculated, as shown in Table 6. The C.R. can be obtained by Equation (11). Both C.R.s of the primary and secondary indicators were smaller than 0.1, indicating that the judgment matrices of this evaluation all satisfied the consistency test, and the weight distributions were rational.
From the weights of the primary indicators, weights C1 and C4 show that technology which has great changes in technology, industry, models, and interactive features of the information society are more important than others in the primary indicators. According to the weights of the secondary indicators, weights I9, I10, and I11 show that technologies which have an intelligent system and terminal interaction, share data or applications, and will be a new product in the future are more important than other secondary indicators. Thus, the findings of the present study are reasonable. The majority of the technologies selected are in the early stages of technology development, commonly referred to as the emerging technology stage within the overarching technology life cycle. The intrinsic innovative potential of technology alludes to its capacity to engender novel applications, products, and services that can create disruptive change and trigger a paradigm shift across diverse industries and domains. Therefore, factors that have potential impacts on smart cities or the ability to provide services to support smart cities should be considered when identifying and predicting disruptive technologies.
In the final selection, the submitted technologies were scored on a scale of 1 to 100. Experts gave scores for each technology according to indicator after evaluated in Table 7. Then, scores of the results were analysed and checked whether they conform to the normal distribution. The total number of technologies was 15 or fewer than 50. Compared with the Kolmogorov–Smirnov test, the Shapiro–Wilk test is more appropriate method for small sample sizes (<50 samples). Therefore, we used Shapiro–Wilk test to assess the normality of the list of submitted technologies. According to Equation (12), the p value can be calculated and is equal to 0.195 > 0.05, indicating that the distribution conforms to a normal distribution under the acceptance assumption. The index weight calculated using our model conformed to the general rules for the overall score of the evaluation results.

5. Conclusions

This study explores an identification methodology for disruptive technologies in smart cities. The framework encompasses feature extraction following a case study, proposing criteria, and verifying the proposed framework based on the entropy weight method and analytic hierarchy process. Through effective identification and assessment of criteria of disruptive technology, high priority factors have a significant impact on smart cities. Moreover, the structure of the proposed framework was analysed. These results are consistent with actual situations in which disruptive technologies are identified in smart cities. Finally, the feasibility and effectiveness of the proposed framework are verified in the field of information science. This framework considers not only the ease and feasibility of organisational processes but also the simplicity and practicality of rapidly responding, developing, and deploying applications in smart cities. By providing innovative practical processes and empirical cases to enable smart cities, this study offers technical knowledge and theoretical support for their evaluation and construction of smart cities.
This study applies an expert system based on professional knowledge and rich experience and constructs an identification framework for disruptive technology in smart cities. In our practical applications and in quality assessment studies involving a large number of participants, C.R. values are close to 0.1 with an increasing number of indicators, especially the secondary indicators. The readjustment of the indicator requires significantly more time and effort. Patients should be careful when building an AHP model. The specific fields verified in this study can easily be generalised to many other fields involving public–private partnership programs. Future research could explore evaluation mechanisms that combine expert evaluation and quantitative assessment throughout the entire technology life cycle to improve the effectiveness of strategic planning and decision-making. Furthermore, a sensitivity analysis should be conducted to comprehensively evaluate the performance of the proposed method and identify its potential strengths and weaknesses. This analysis enables optimisation of the method and facilitates comparison with alternative methodologies. Moreover, the approach can be generalised to multiple applications of technology readiness level in smart cities to further enhance their overall applicability and sustainability, which allows for a comprehensive assessment of their potential impact on sustainable smart city development and ensures that disruptive technologies are considered for implementation align with sustainable development principles.

Author Contributions

Conceptualisation, X.G. and J.Q.; methodology, Z.W. and J.Q.; formal analysis, J.C.; investigation, X.G. and Z.L.; data curation, J.C. and Z.G.; writing—original draft preparation, J.Q.; writing—review and editing, J.Q. and X.G. All authors have read and agreed to the published version of the manuscript.

Funding

This research was funded by the National Natural Science Foundation of China, grant number L1624034, and China Postdoctoral Science Foundation, grant number 2022T150280, 2022M711434 and 2022M296067, and Young Elite Scientists Sponsorship Program by CAST, grant number 2022QNRC001.

Institutional Review Board Statement

Not applicable.

Informed Consent Statement

Not applicable.

Data Availability Statement

Not applicable.

Conflicts of Interest

The authors declare no conflict of interest.

References

  1. Habitat, U.N. Envisaging the Future of Cities. World Cities Report. 2022. Available online: https://unhabitat.org/world-cities-report-2022-envisaging-the-future-of-cities (accessed on 14 January 2023).
  2. Christensen, C.M. The Innovator’s Dilemma: When New Technologies Cause Great Firms to Fail; Harvard Business Review Press: Boston, MA, USA, 2013. [Google Scholar]
  3. Kaal, W.A.; Vermeulen, E.P.M. How to regulate disruptive innovation—From facts to data. Jurimetrics 2017, 57, 169–209. [Google Scholar]
  4. Si, S.; Chen, H. A literature review of disruptive innovation: What it is, how it works and where it goes. J. Eng. Technol. Manag. 2020, 56, 101568. [Google Scholar] [CrossRef]
  5. Guo, J.; Tan, R.; Sun, J.; Cao, G.; Zhang, L. An approach for generating design scheme of new market disruptive products driven by function differentiation. Comput. Ind. Eng. 2016, 102, 302–315. [Google Scholar] [CrossRef]
  6. Cvar, N.; Trilar, J.; Kos, A.; Volk, M.; Stojmenova Duh, E. The use of IoT technology in smart cities and smart villages: Similarities, differences, and future prospects. Sensors 2020, 20, 3897. [Google Scholar] [CrossRef] [PubMed]
  7. Voda, A.I.; Radu, L.D. How can artificial intelligence respond to smart cities challenges? In Smart Cities: Issues and Challenges; Elsevier: Amsterdam, The Netherlands, 2019; pp. 199–216. [Google Scholar]
  8. Hashem, I.A.T.; Chang, V.; Anuar, N.B.; Adewole, K.; Yaqoob, I.; Gani, A.; Ahmed, E.; Chiroma, H. The role of big data in smart city. Int. J. Inf. Manag. 2016, 36, 748–758. [Google Scholar] [CrossRef] [Green Version]
  9. Bhushan, B.; Khamparia, A.; Sagayam, K.M.; Sharma, S.K.; Ahad, M.A.; Debnath, N.C. Blockchain for smart cities: A review of architectures, integration trends and future research directions. Sustain. Cities Soc. 2020, 61, 102360. [Google Scholar] [CrossRef]
  10. Talari, S.; Shafie-Khah, M.; Siano, P.; Loia, V.; Tommasetti, A.; Catalão, J.P.S. A review of smart cities based on the internet of things concept. Energies 2017, 10, 421. [Google Scholar] [CrossRef] [Green Version]
  11. Radu, L.D. Disruptive technologies in smart cities: A survey on current trends and challenges. Smart Cities 2020, 3, 1022–1038. [Google Scholar] [CrossRef]
  12. Bruneckiene, J. The concept of smart economy under the context of creation the economic value in the city. Public Policy Adm. 2014, 13, 469–482. [Google Scholar] [CrossRef]
  13. Song, H.; Selim, G. Smart Heritage for Urban Sustainability: A Review of Current Definitions and Future Developments. J. Contemp. Urban Aff. 2022, 6, 175–192. [Google Scholar] [CrossRef]
  14. Kirimtat, A.; Krejcar, O.; Kertesz, A.; Tasgetiren, M.F. Future Trends and Current State of Smart City Concepts: A Survey. IEEE Access 2020, 8, 86448–86467. [Google Scholar] [CrossRef]
  15. Muvuna, J.; Boutaleb, T.; Baker, K.; Mickovski, S. A methodology to model integrated smart city system from the information perspective. Smart Cities 2014, 2, 496–511. [Google Scholar] [CrossRef] [Green Version]
  16. Chourabi, H.; Nam, T.; Walker, S.; Gil-Garcia, J.R.; Mellouli, S.; Nahon, K.; Pardo, T.; Scholl, H. Understanding smart cities: An integrative framework. In Proceedings of the 2012 45th International Conference on System Sciences, Maui, HI, USA, 4–7 January 2012; pp. 2289–2297. [Google Scholar]
  17. Smart Cities: Digital Solutions for a More Livable Future. Available online: https://www.mckinsey.com/capabilities/operations/our-insights/smart-cities-digital-solutions-for-a-more-livable-future (accessed on 4 May 2023).
  18. Batty, M.; Axhausen, K.; Giannotti, F.; Pozdnoukhov, A.; Bazzani, A.; Wachowicz, M.; Ouzounis, G.; Portugali, Y. Smart cities of the future. Eur. Phys. J. Special Top. 2012, 214, 481–518. [Google Scholar] [CrossRef] [Green Version]
  19. Lin, C.; He, D.; Kumar, N.; Huang, X.; Vijayakumar, P.; Choo, K. Homechain: A blockchain-based secure mutual authenti-cation system for smart homes. IEEE Internet Things J. 2019, 7, 818–829. [Google Scholar] [CrossRef]
  20. Ullah, F.; Sepasgozar, S.; Wang, C. Asystematic review of smart real estate technology: Drivers of, and barriers to, the use of digital disruptive technologies and online platforms. Sustainability 2018, 10, 3142. [Google Scholar] [CrossRef] [Green Version]
  21. Manogaran, G.; Varatharajan, R.; Lopez, D.; Kumar, P.; Sundarasekar, R.; Thota, C. A new architecture of Internet of Things and big data ecosystem for secured smart healthcare monitoring and alerting system. Future Gener. Comput. Syst. 2018, 82, 375–387. [Google Scholar] [CrossRef]
  22. Torre-Bastida, A.; Del Ser, J.; Laña, I.; Ilardia, M.; Bilbao, M.; Campos-Cordobés, S. Big Data for transportation and mobility: Recent advances, trends and challenges. IET Intell. Transp. Syst. 2018, 12, 742–755. [Google Scholar] [CrossRef]
  23. Bughin, J.; Chui, M.; Manyika, J. Clouds, big data, and smart assets: Ten tech-enabled business trends to watch. McKinsey Q. 2010, 56, 75–86. [Google Scholar]
  24. National Research Council. Persistent Forecasting of Disruptive Technologies Report 2; National Academies Press: Washington, DC, USA, 2010; Available online: https://nap.nationalacademies.org/catalog/12834/persistent-forecasting-of-disruptive-technologies-report-2 (accessed on 17 February 2023).
  25. Alʹtshuller, G.S. The Innovation Algorithm: TRIZ, Systematic Innovation and Technical Creativity; Technical Innovation Center, Inc.: Worcester, MA, USA, 1999. [Google Scholar]
  26. Lim, D.J.; Anderson, T.R. Technology trajectory mapping using data envelopment analysis: The ex ante use of disruptive innovation theory on flat panel technologies. R&D Manag. 2016, 46, 815–830. [Google Scholar]
  27. Yuan, J.; Li, W.; Xia, B.; Chen, Y.; Skibniewski, M.J. Operation performance measurement of public rental housing delivery by PPPS with fuzzy-AHP comprehensive evaluation. Int. J. Strateg. Prop. Manag. 2019, 23, 328–353. [Google Scholar] [CrossRef]
Figure 1. The proposed design framework of evaluating disruptive technologies and its implementation process of the evaluation system.
Sustainability 15 09109 g001
Figure 2. The development of smart cities is enabled by seven key fields of technologies.
Sustainability 15 09109 g002
Figure 3. A Sankey diagram of 16 selected disruptive technologies (left) in seven key fields (middle) enabling smart cities (right). Thicker rectangles indicate greater frequency. The frequencies of 16 selected disruptive technologies are equal. The connecting nodes, inflows, and outflows indicate more connections with more and thicker nodes.
Sustainability 15 09109 g003
Table 1. Features of disruptive technologies are extracted in each field.
FieldFeatures
Information and
Science
1. Create or change the methods of connection and interaction in IoT and human–computer in the information age;
2. Smart and humanise the information system and terminal devices, improve user experience, change user behaviour and habits, and become the original source of social life and service;
3. Promote the innovation of industrial application models and business models and create huge economic and social value by the open sharing of data and applications.
Material1. Change the traditional mode of thinking in materials;
2. Change of material function and performance suddenly;
3. A new material system;
4. Substitute and replacement products.
Energy1. Bring revolutionary changes to development of society;
2. Realise industrial scale application and occupy a leading position
Manufacturing1. Breakthrough of bottleneck technology;
2. Large-scale application
Transportation1. Change the future mode of transportation, production;
2. Change the laws and regulations of future business operation mode and innovate traffic management;
3. Intersection and integration of basic technologies.
Service
Industry
1. Enter another new market instead of following the original one;
2. More convenient, simpler, cheaper, smaller, and easier to operate, resulting in big impact of existing technologies, products, service models and business models;
3. Integrate technologies and business models that make life more convenient and change the way of life and social interaction.
Frontier1. Originality of technical principles;
2. Feasibility of technical realisation;
3. Promote breakthroughs or lead industrial changes.
Table 2. Primary and secondary indicators of disruptive technologies.
Primary IndicatorSymbols of Primary IndicatorSecondary IndicatorDescriptionSymbols of Secondary Indicator
Great changes in technology, industry, models, etc.C1Change existing technical systems and theoriesInnovation in science and technologyI1
Change existing product principles and structuresProduct innovationI2
Change life and service modelLifestyle innovationI3
Change industry application or business modelInnovation of Industry ModelI4
Generate huge social and economic valueC2Generate huge national defence and social valueChanges to applications in other fieldsI5
Significantly reduce costs and greatly increase productivityChanges to other domain modelsI6
Generate cross-field applications or business modelsC3Cross-field applicationFuture social interactive intelligenceI7
Emergence of new business models in cross-fieldsBig data sharingI8
Interactive Features of Information SocietyC4Intelligent system and terminal interactionSocioeconomic value enhancementI9
Open sharing of data or applicationsProductivity improvementI10
Is it possible to realize?C5Can there be products in 5–10 years?Innovation in science and technologyI11
Table 3. The key subjects of selected disruptive technology.
Key SubjectsSelected Disruptive Technologies
Information and science Big data; Smart voice; Brain-like computing; Quantum communication; Metamaterials; Graphene; Material genome engineering; Cloud manufacturing; 3D printing; Robotics; Internet of Things Automatic driving
Smart material Big data; Metamaterials; Graphene; Material genome engineering; 3D printing
Smart manufacturing Big data; Graphene; Material genome engineering; Cloud manufacturing; 3D printing; Internet of Things; Robotics
Smart energyBig data; Metamaterials; Graphene; Material genome engineering; Silicon carbide power electronics; Wireless power transmission
Smart livingBig data; Smart voice; Metamaterials; Graphene; Material genome engineering; Wireless power transmission; 3D printing; Robotics; Automatic driving; Internet of Things; Personalised Smart Service
Table 4. Pairwise comparison matrices of primary indicator.
C1C2C3C4C5
C11.001.250.921.811.05
C20.801.000.850.890.86
C31.091.181.000.521.20
C40.831.121.921.001.13
C50.951.160.830.891.00
Table 5. Pairwise comparison matrices of secondary indicator.
I1I2I3I4I5I6I7I8I9I10I11
I11.00001.12001.30000.51000.45000.41000.31000.37600.48500.57800.6250
I20.89291.00000.52000.60000.71000.89000.64100.63200.54500.56500.5620
I30.76921.92311.00000.61000.60100.63000.62000.64200.62000.54000.4950
I40.83331.66671.63931.00000.78000.54000.61000.64100.61000.62000.5720
I52.22221.40851.66391.28211.00001.75000.68000.44200.69200.41200.3950
I62.43901.12361.58731.85190.57141.00001.68001.46200.51100.51000.3830
I73.22581.56011.61291.63931.47060.59521.00001.62000.32000.75000.4200
I82.65961.58231.55761.56012.26240.68400.61731.00002.38000.50100.2110
I92.06191.83491.61291.63931.44511.95693.12500.42021.00000.55700.2850
I101.73011.76991.85191.61292.42721.96081.33331.99601.79531.00000.5500
I111.60001.77942.02021.74832.53162.61102.38104.73933.50881.81821.0000
Table 6. The indicators and its weight.
Primary
Indicator
WeightEigenvalueSecondary
Indicator
WeightEigenvalue
C10.23585.1872I10.053712.0106
I20.054311.4539
I30.059811.4436
I40.068111.4027
C20.16485.3050I50.076511.5710
I60.088311.7674
C30.18335.3197
C.I. = 0.0763
C.R. = 0.0857 < 0.1
I70.085111.8778
I80.098312.4390
C.R. = 0.0966 < 0.1
C40.23175.0687I90.116412.4332
I100.115211.3256
C50.18445.1974I110.184412.3441
Table 7. Assessment results of technologies in science and information and rankings.
RankTechnologyI1I2I3I4I5I6I7I8I9I10I11Score
1Photoelectric integrated brain chip technology89.2190.3391.4292.7295.6787.4785.9187.5685.0089.5487.5288.86
2Superhuman vision for multi-dimensional information perception86.4684.2783.6876.9476.8489.7582.4288.7385.4282.4886.4884.27
3Ultra-fast full-time vision model and chip77.2477.4580.5776.6277.8181.7378.5675.5878.4175.2681.7078.49
4Neuromorphological computing chips and systems74.2473.8175.5271.1469.5767.4972.3773.3470.1671.2670.3271.36
5Artificial intelligence photoelectric computing chip68.2672.1865.2768.3371.1470.4768.7566.8265.4666.1863.9867.29
6Intelligent processing technology of time domain serial photonic neural network63.7262.4658.7560.4365.7862.5262.3856.4857.4355.5255.1059.09
7Mobile augmented reality56.6458.7159.5255.4856.3756.1856.4555.3756.4557.7157.7356.98
8Near-zero power consumption IoT chip technology 43.2849.9845.5146.2547.3648.8547.6450.6446.3748.9548.8547.96
9EDA technology for fast chip design45.2043.6840.3547.3746.2545.4243.2644.1747.2445.6542.2744.52
10Multidimensional permanent optical storage using quartz glass41.4740.2843.0042.5238.5237.7349.5047.5642.3245.6143.8443.37
11Electronic medicine technology39.8537.5238.6443.2844.1540.4841.5642.3339.4643.6442.3941.58
12Underwater array photonic communication network42.1347.5846.7945.6235.5743.3441.4545.6237.8235.1438.7640.84
13Artificial intelligence platform based on meta operator fusion43.5738.6237.8535.7241.4636.4542.3742.3342.8537.8034.0738.82
14Edge intelligence oriented ultra-low power principal devices and new architecture chips40.0741.3541.0832.4636.7535.6240.5831.0435.5834.6136.3136.39
15Sensors and chips specifically developed for artificial intelligence89.2190.3391.4292.7295.6787.4785.9187.5685.0089.5487.5230.05
Disclaimer/Publisher’s Note: The statements, opinions and data contained in all publications are solely those of the individual author(s) and contributor(s) and not of MDPI and/or the editor(s). MDPI and/or the editor(s) disclaim responsibility for any injury to people or property resulting from any ideas, methods, instructions or products referred to in the content.

