Abstract
The projected image, created by destination marketing organizations, and the perceived image, formed by tourists’ perceptions, are crucial factors in destination selection. In this paper, machine learning models are used to construct projected image dimensions and perceptual dimensions for Chinese and English to analyze the similarities and differences between projected and perceptual images and their Chinese sustainability and cultural differences issues. We take Xiamen, a seaside tourist city in China, as an example, and analyze it by collecting 110,098 official promotional texts (both in Chinese and English) and tourist online review feedback as data sources using a latent Dirichlet allocation (LDA) model of natural language processing. The findings show that (1) the official projected image focuses on the overall image of the destination, while the tourists’ perceived image focuses on the specific image. (2) The official projected image covers the whole area of tourism, while the tourists’ perceived image focuses on Xiamen’s well-known attractions. The results of the above two points are the same for both the Chinese and English Topic models. (3) The official projected image focuses on three dimensions of destination: sustainability-economic, socio-cultural and environmental, while the tourist perception is more in the socio-cultural and environmental dimensions. (4) Both the projected and perceived images in Chinese and English differ in cross-cultural situations. The perceived images of Chinese and British tourists are influenced by their respective cultural backgrounds. Chinese tourists’ perceptions reflect cultural values associated with collectivism, long-term orientation, and uncertainty avoidance. On the other hand, British tourists’ perceptions align with cultural values of individualism, short-term orientation, and lower uncertainty avoidance. These differences can be explained using Hofstede’s cultural dimensions theory. The research in this paper can provide a reference for the promotion of tourism cities, and tourism destination organizations should not only focus on sustainable promotion, but also attract domestic and foreign tourists through differentiated promotion.
1. Introduction
Tourists are usually attracted to a combination of attractions, activities, and services offered by a destination [1]. Therefore, to attract more tourists, destination marketing organizations (DMOs) actively promote the tourism image of a destination to tourists and potential tourists through online platforms such as official websites and social media. A tourism destination image (TDI) is generated by the two-way interaction between the projected image on the supply side and the perceived image on the demand side [2] and plays an important role in marketing, brand differentiation, and destination selection [3,4,5,6,7,8].
The projected image refers to the image that local governments, tourism companies, social groups, and other image builders (in this study, DMOs) promote externally and internally with the help of video promos, print ads, brochures, guidebooks, website information, etc., reflecting the current destination marketing thinking and focus [9,10,11,12]. A tourist-perceived image refers to the overall impressions, feelings, and perceptions of tourists about the destination and tourism products [13].
Earlier studies on destination images focused largely on the perceived destination image from the perspective of tourists and less on the projected image of the DMO [14,15]. However, understanding the projected image of destination organizations is important for tourism marketing strategy development [16] because tourists’ perceived images of destinations are largely influenced by the projected images of DMOs [17]. Projected images are believed to guide tourists’ perceptions by changing their perceptions of the local culture [18].
In recent years, some studies have started to analyze official projected images and tourists’ perceived images comparatively [19,20,21,22,23]. These studies have mainly focused on the study of visual representations of projected images, e.g., through the analysis of images in tourism brochures issued by DMOs and images published in official media [20,21,22,23]. Some studies analyze texts published by DMOs [24]. However, it is important to note that these visual approaches have certain limitations. They primarily provide insights into the visual aspects of the projected images but may not capture the full range of information conveyed through the textual content. Therefore, an analysis of the textual information can complement and enhance our understanding of projected images and their influence on tourist perceptions.
The alignment between the destination marketing organization’s (DMO) projected image and the tourist’s perceived image is crucial for the effectiveness of destination marketing and can inform future marketing strategies [2]. A commonly held belief is that a closer match between the projected and perceived images leads to better outcomes [2]. To achieve this alignment, managers and destination marketers must project an accurate image of the destination through their marketing materials, which can increase tourists’ intention to visit [25].
With the emergence of social media, user-generated content (UGC) has become a new source of authoritative and credible data for research [26,27]. In the tourism domain, tourist-generated content (TGC), including textual content and image information, is commonly used to study tourism destination image perception [25,28,29,30,31]. The large amount of TGC data available makes it a highly reliable source for studying visitor perceptions [2]. Textual information from DMOs on their official websites and social media platforms is also a valuable source of data for studying projected images [32]. However, the analysis of textual content requires advanced techniques to handle the massive amounts of data efficiently and extract meaningful insights. Furthermore, the use of natural language processing techniques in deep learning and machine learning can improve the accuracy of analyzing huge amounts of internet data, thereby avoiding the significant time and monetary costs associated with conducting qualitative research and analyzing quantitative data [33]. By analyzing textual content on social media or official websites, destination managers and marketers can gain insights to better plan products/services, enhance marketing communications, and attract and retain visitors [34].
Sustainability is a key factor in the competitiveness of tourism destinations [35]. Tourists are increasingly interested in sustainable tourism that takes into account cultural, environmental and social development, and the official websites of destination management organizations play an important role in attracting tourists by communicating about sustainability with the aim of informing, engaging, and motivating stakeholders about destination sustainability behavior [36]. The concept of destination sustainability as perceived by tourists has rarely been studied [37]. However, tourists’ perceptions of sustainability are fundamental to the success of sustainability strategies [38]. Therefore, it remains to be answered by research whether destination sustainability development is concerned with the official projected image and the tourist-perceived destination image.
Recent research has demonstrated that tourists from different cultural backgrounds tend to have divergent perceptions of tourist destinations [39,40]. However, cross-cultural research within the tourism industry has been relatively neglected [40,41], despite the rising importance of catering to diverse cultural preferences in light of the surge in international tourism [42]. Culture plays a critical role in shaping visitor behavior and influencing destination perception across different cultural groups [43].
Current cross-cultural studies on destination image (DI) comparisons are primarily based on country rather than language [44]. However, linguistic considerations are a crucial variable for distinguishing cross-cultural behavioral differences [45,46,47]. Language serves as a key cultural and cognitive attribute that shapes individuals’ thoughts and actions, and research in economics has demonstrated the impact of language on consumer behavior [48]. For instance, Kim & Filimonau (2017) [48] found that language can influence tourists by comparing the pro-environmental attitudes of Korean- and Mandarin-speaking tourists. Therefore, examining language differences in DI perceptions can provide a more nuanced understanding of cross-cultural differences in tourism.
In recent years, many Chinese tourism cities have intensified their marketing efforts by investing heavily in promoting and marketing in Chinese and English in domestic and international markets, respectively. To guide practical work in developing promotional and marketing content in Chinese and English, destination management organizations (DMOs) require theoretical guidance. Most studies in tourism and hospitality research have adopted Hofstede’s cultural dimension theory for cross-cultural research [41]. However, whether Hofstede’s cultural dimension theory is applicable to exploring the differences in perceived images of Chinese and English-speaking tourists requires further investigation.
Therefore, this study aims to utilize the natural language processing latent Dirichlet allocation (LDA) thematic modeling method to extract massive textual information pertaining to projected and perceived destination images from official DMO websites, social platforms, and tourism social platforms in both Chinese and English. By applying the LDA model, we can identify the underlying themes and attributes within the textual data, providing a deeper understanding of the projected and perceived images.
While prior studies have primarily focused on visual representations, this study expands the analysis to include textual content, which has been relatively neglected. Analyzing Chinese and English texts specifically offers new insights into cultural differences in tourism perceptions.
The primary objective of this research is to address the following four research questions:
- (1)
- To what extent do the attributes of the projected and perceived images, as identified through the application of the Latent Dirichlet Allocation (LDA) model, align with those observed in previous studies using alternative methodologies?
- (2)
- How consistent is the projected image, as revealed by analysis using the LDA model, with the perceived image, and to what degree does it reflect concerns regarding destination sustainability?
- (3)
- Are there significant cross-cultural differences between projected and perceived images in Chinese and English?
- (4)
- Can Hofstede’s cultural dimension theory elucidate the disparities in destination image between Chinese and English?
The outcomes of this research are poised to have a positive impact on the recovery of the tourism industry, which has been severely affected by the COVID-19 pandemic. By gaining a more comprehensive understanding of tourist preferences and perceptions, tourism managers will be able to tailor marketing strategies for both domestic and international markets, thereby contributing to the sustainable development of tourism. Furthermore, this study can aid China in effectively attracting domestic and international tourists as the country reopens its borders to the world.
2. Literature Review
2.1. The Discrepancy between Projected and Perceived Images
In 1975, Hunt introduced the concept of images from consumer behavior to the tourism industry, which led to the study of Tourism Destination Images (TDIs). Today, TDIs have become one of the most widely researched topics in tourism [49,50]. Destination Management Organizations (DMOs) present destination images to tourists through various forms of Occupationally Generated Content (OGC) such as official travel guides, tourism brochures, official websites, and social media, which consist of text, images, and videos. Tourists are generally passive receivers of OGC published by DMOs [23]. However, there is often a discrepancy between projected and perceived images, which arises from DMOs’ lack of understanding of tourists’ interests. Such conflicting image marketing weakens the projected images of DMOs and reduces the attractiveness of destinations to potential tourists [11].
Previous studies have attempted to measure the gap between projected and perceived images. Deepening the understanding of tourists’ perceptions and providing projected destination images that are consistent with tourists’ perspectives can help destinations develop objective and effective marketing programs, which are crucial for enhancing the destination brand [23].
Despite the extensive research on destination images, there is still no universally accepted definition or empirical testing of the concept [49]. Consequently, there is no established measure for destination images, particularly for studies using visual data [23].
Studies measuring the gap between projected and perceived images differ in their data sources and research methods, leading to varying research outcomes. Marine-Roig and Ferrer-Rosell (2018) [2] synthesized 17 studies and discovered that early studies on projected images mainly utilized data from official tourism websites, travel magazines, travel guides and brochures, official promotional campaigns, and travel agency surveys. Early studies on tourists’ perceived images were primarily based on questionnaires [51,52,53,54]. Subsequently, studies on projected images shifted their focus to official photos posted on websites, while research on tourists’ perceived images moved towards analyzing travel blog comments and photos (UGC) [55,56]. Results have indicated that tourists’ perceived images often do not align with the projected images of the supply side or DMO [57,58].
Marine-Roig and Ferrer-Rosell (2018) [2] conducted an analysis of the gap between supply-side projected images and demand-side perceived images of TDIs. They measured the differences in terms of three dimensions: spatial, cognitive, and affective images, using a combined distance approach [59]. The results indicated significant differences between the organic perceived image and the autonomous and projected images. Following this, several studies have been conducted to investigate the discrepancy between projected and perceived images using data sources such as photos posted by DMOs on the internet and shared by tourists, as presented in Table 1.

Table 1.
Samples papers of the fit between the projected image and perceived image attributes.
The aforementioned studies suggest an incongruity between projected and perceived destination images. Researchers have shifted their focus from survey-based research to content analysis of User-Generated Content (UGC) and Traditional Generated Content (TGC) on the internet, with a greater emphasis on photo-based analyses. However, fewer studies have focused on textual data, and research methods have progressed from traditional survey analysis to big data-driven social network analysis, machine learning, and deep learning. Nonetheless, studies utilizing natural language processing (e.g., LDA modeling) or similar techniques remain scarce. Previous studies on destination image attributes relied mainly on factor analysis and researcher coding, utilizing similar attributes for both projected and perceived images. This approach resulted in more unique descriptions of destination image attributes, specific to the analyzed destination, rather than generic attributes applicable to multiple destinations. In contrast, this study presents both perspectives, allowing the results to characterize the analyzed destination while also facilitating comparative analysis with other destinations. Previous research has not given adequate attention to cross-cultural studies, as many studies have analyzed texts or photos in a single language context, limiting the ability of Destination Management Organizations (DMOs) to comprehend the needs of different visitor groups.
2.2. Cross-Cultural Research and the Impact of Language in the Tourism Industry
Culture plays a crucial role in shaping tourist behavior and understanding it can lead to a better interpretation of their preferences and behavior [39,43,60,61]. The success of international tourism marketing strategies depends on the comprehension of tourists from different cultures and regions [43,62,63,64,65]. As cultural differences are significant, it is essential to consider travelers’ preferences, behavior, and cultural traits when designing and promoting tourist offerings [39,43,65].
Recent research has explored the disparities in perceptions of tourism destination images (TDIs) among different national cultures. For instance, Stepchenkova, Kim, and Kirilenko (2015) [40] identified variations in the tourist images of Russia in the camera lenses of American and Korean tourists, as well as in the geospatial distribution of photographs. Zhang, Chen, and Li (2019) [66] discovered differences in the behaviors and perceived objects of inbound tourists from various continents and countries when visiting Beijing. Moreover, studies by Deng et al. (2019) [44], Fam et al. (2023) [39], and Kim and Ritchie (2014) [42] have reported differences in the perceptions and sentiments of Western and Eastern tourists toward the same destination. Fam et al. (2023) [39] suggested that Western tourists exhibit greater individual-destination congruence than Asian tourists, meaning that Asian tourists prioritize transactional benefits over the quality of accommodation, which is not the case for Western tourists. However, contradictory evidence was presented by Williams, Soutar, Ashill, and Naumann (2017) [67], who found that Asians are more emotionally oriented, while Westerners are more economically oriented. These studies shed light on the importance of considering cultural differences in destination image research.
Culture comprises various components such as language(s), nationality, general and specialized education, ethnicity, religion, family, gender, social class, and corporate or organizational culture [41,68,69]. Language plays a crucial role in communication, serving as a medium for encoding and decoding messages, and providing a framework for interpreting the world [45]. Previous studies have shown that the primary language used by consumers is a crucial cultural variable that affects their service evaluations and behaviors [70,71]. Language has proven to be a useful tool for classifying, analyzing, and comparing different cultural groups in business research [72].
Studies that employ language as a cultural indicator have investigated variations in travel behavior across different language groups [73,74]. However, these studies have primarily concentrated on examining travel motivation, destination selection, and tourist satisfaction with hotel services and staff in cross-cultural settings, with limited attention paid to variations in the perceived image of cross-cultural tourists. Therefore, there is a need for research that examines cross-cultural differences in the perceived image utilizing language as a cultural proxy.
English and Chinese are among the most widely spoken languages in the world and are associated with two of the most influential cultures globally [75]. Previous cross-cultural studies have utilized language as a cue to gain insights into cultural differences between Chinese and English-speaking populations [75,76]. English-speaking nations, such as the United Kingdom, the United States, Canada, Australia, and New Zealand, have played a pivotal role in promoting Western culture worldwide [77]. Although cultural variations exist among these nations, prior cross-cultural research has also demonstrated shared cultural characteristics among them [78,79,80].
In the field of tourism and hospitality research, the Hofstede cultural dimension theory is frequently utilized, with individualism and collectivism being the most widely used dimensions [41]. According to this theory, Chinese culture differs significantly from the Anglosphere in four out of the six cultural dimensions. Specifically, Chinese culture is characterized by lower levels of individualism (IDV), higher power distance (PDI), higher long-term orientation (LTO), and lower indulgence (IVR) when compared to the Anglosphere [81,82]. However, it is essential to establish the validity of Hofstede’s theory in relation to projected and perceived destination images. Research supporting the application of Hofstede’s theory in tourism and destination image research would strengthen the rationale for investigating its relevance to projected and perceived images. This study aims to bridge this gap by examining the relationship between Hofstede’s cultural dimensions and the projected and perceived images of Xiamen, China.
In tourism research, it is well-established that Chinese cultural values significantly impact the behavior of Chinese tourists. These values, beliefs, and philosophical traditions, which are rooted in Confucianism, generate distinct travel motivations that differ from those of Western tourists. These motivations include values such as appropriate interpersonal relationships, the importance of family, and respect for authority [83,84,85]. Conversely, English-speaking countries are influenced by Christianity, Romanticism, the Enlightenment, and rational science, which prioritize individuality, uniqueness, and the mental agency of human beings [74].
The contrasting cultural traditions of China and English-speaking societies give rise to different societal behaviors [74]. However, existing research has primarily focused on analyzing travel motivation, destination selection, and tourist satisfaction with hotels and staff in cross-cultural settings, with inadequate attention to the variations in the perceived image of cross-cultural tourists. Understanding the differences in destination perceptions between Chinese- and English-speaking visitors can assist destination marketing organizations (DMOs) in devising more precise marketing strategies for both Chinese and English markets.
2.3. LDA Topic Modeling in Tourism Destination Image Research
Social media platforms generate vast amounts of data, with internet data increasing from terabytes (TB) to petabytes (PB). Text is currently the predominant form of communication, with over 18.2 million text messages transmitted over the Internet every minute. Furthermore, multimedia messages such as photos and videos are becoming increasingly popular [86]. According to studies, 90% of the data generated on the internet takes the form of videos and photos [87]. Big data have the potential to improve research reliability [30]. The epistemological challenges associated with big data research in tourism and hospitality primarily involve moving from theory-driven to data-driven forecasting [88].
The tourism and hospitality sector utilizes big data from three primary sources: user-generated content (UGC), operations (internet searches), and the Internet of Things (IoT). However, previous research primarily relied on a singular source (such as TripAdvisor) to collect data, which calls into question the validity and representativeness of their findings. In contrast, some studies have incorporated data from alternative platforms, such as Flick and Chinese websites Qunar and Weibo [88]. Over time, the approach to big data research in travel and hospitality has evolved from basic techniques such as descriptive statistics, frequency, and correlation analysis to more advanced methods such as spatial analysis, social network analysis, artificial neural network analysis, and machine learning modeling [88].
The utilization of machine learning techniques applied to big data can offer refined and sophisticated insights [86]. Machine learning applications encompass the examination of data derived from social media to detect anomalies, analyze behavior, bioinformatics, extract business intelligence, detect criminal activity, identify epidemics, detect events, perform image analysis, provide recommendations, establish relationships, evaluate reputation, as well as undertake sentiment and opinion analysis [86]. Analysis of user review data from prominent travel and hospitality websites such as Yelp, Expedia, and TripAdvisor through opinion mining can inform decision-making processes aimed at enhancing business operations. In particular, the application of Latent Dirichlet Allocation (LDA) in machine learning for big data analysis within the hotel and tourism sectors has demonstrated superior results compared to other algorithms [89]. Moreover, text analytics techniques may be employed for destination image analysis, location assessment, facility evaluation, tourism profiling, and more [88].
The application of machine learning and natural language processing methods in tourism research is increasingly prevalent. One such method is Latent Dirichlet Allocation (LDA), a statistical model in machine learning and natural language processing that uncovers abstract topics from a series of documents. LDA is adept at identifying latent topic information in large collections of documents or corpora by using a bag-of-words approach that treats each document as a vector of word frequencies, thereby transforming textual data into numerical data that is readily modeled [90]. LDA operates by following a series of data generation processes to extract latent topics from documents and has proven to be an effective data-driven content analysis method [91]. The application of LDA for Tourism Destination Images (TDIs) has gained traction, as exemplified by studies by Kim et al. (2017) [48], Taecharungroj and Mathayomchan (2019) [92], Kirilenko, Stepchenkova, and Hernandez (2019) [93], Aggarwal and Gour (2020) [94], Albayrak et al. (2021) [95], Ali et al. (2021) [96], Mirzaalian and Halpenny (2021) [97], Chen, Becken, and Stantic (2022) [3], Shang & Luo (2022) [98], each using LDA to investigate distinct aspects of destination perceived images. However, there remains a dearth of studies comparing projected and perceived images using LDA methods, as well as a lack of research results on different language scenarios in cross-cultural contexts. This hinders the ability of Destination Management Organizations (DMOs) to develop precise marketing strategies. To address this gap, UGC analysis has the potential to be a useful tool for cross-cultural tourism research [99].
2.4. Destination Sustainability
In recent years, tourism sustainability has received common attention from the industry and academia. Destination sustainability refers to the development of tourism destinations that take into account economic, social, cultural, and environmental benefits, and promote current development while considering long-term benefits (UNWTO, 2017) [100]. Big data approaches offer exciting opportunities for sustainable tourism research, and online platform data (including text reviews, photos, and location information) can be used for sustainable urban planning in hotels, restaurants, and Airbnb, and such information is critical for managing environmental sustainability, understanding the socio-cultural context of tourists, and providing better services [101]. Sustainable communication by destination marketing organizations through official websites can inform, engage, and motivate stakeholders about destination sustainability behaviors [36]. If destinations can communicate their sustainability efforts, they can increase their brand value [102]. Tourist experiences influence a more positive perception of the ecological, cultural, and environmental aspects of a destination [103]. The level of attention given to destination sustainability in both the official projected image and the tourist’s perceived image can provide valuable input for planning sustainability strategies. Sustainability encompasses economic, socio-cultural, and environmental dimensions and is the most widely accepted view [35,104]. In the tourism context, environmental sustainability focuses on the effective conservation of renewable resources and the reduction in pollution [104]. Socio-cultural sustainability refers to the way tourism recognizes and respects different cultures and prevents any type of exploitation of people [104]. Economic sustainability refers to creating prosperity at different levels of society [104] and distributing the economic benefits of tourism equitably to all stakeholders [105].
3. Methodology
3.1. Research Context
Xiamen is a renowned port and tourist destination situated on the southeast coast of China, specifically in Fujian Province, and it is located on the western shore of the Taiwan Strait. Known as a “sea garden”, Xiamen boasts beautiful scenery all year round, as the sea surrounds the city and permeates through it. The city has been awarded several accolades, including International Garden City, China’s Excellent Tourism City, China’s Top Ten Livable Cities, and National Civilized City. In recent years, Xiamen has received over 80 million domestic and foreign visitors annually. Prior to the COVID-19 pandemic, Xiamen’s inbound tourism performance was exceptional, ranking fifth in China based on inbound tourism indicators for several years.
As one of China’s top ten tourist destinations, Xiamen utilizes various platforms to promote its tourism image to both domestic and foreign tourists. The Xiamen Culture and Tourism Bureau (DMO) maintains an official Chinese website, which is one of the top ten tourist destination websites in China, as well as social media accounts such as Sina Weibo and WeChat official accounts, to market to domestic tourists. Meanwhile, Xiamen also uses multilingual official websites and English social media platforms such as Twitter, Facebook, YouTube, and Instagram to attract foreign tourists to the city. The official content from these sources provides a vast collection of projected image textual data that can be studied. Moreover, domestic and foreign tourists leave a significant number of comments on various tourism social platforms, which can be utilized to analyze their perceptions of Xiamen’s tourism image. By comparing and analyzing the official domestic and foreign projected images with the perceived images of domestic and foreign tourists, it is possible to gain insights into how Xiamen is perceived by different audiences.
3.2. Data Collection
The present study utilized data from various sources, including official websites, online tourism platforms, and social media platforms. Specifically, data related to the official image projection in Chinese were collected from the official WeChat account “Xiamen Cultural Tourism (厦门文旅)”, the “Xiamen Cultural Tourism” account on Sina Weibo, and the official website for cultural tourism promotion, “Xiamen Tourism”. A total of 2876 texts of Chinese projected images from the Xiamen tourism website, 1997 official blogs on Sina Weibo (from June 2021 to March 2022), and 6949 articles on WeChat public websites (from October 2015 to March 2022) were obtained for analysis. Additionally, the data for the official projected images targeted towards foreign countries were collected from the English text of the Xiamen tourism website (581 articles) and the text of the Xiamen Cultural and Tourism Bureau on Twitter (account name: Visit Xiamen; 899 posts) (note: only the Twitter data were collected as the content posted on Facebook, YouTube, Instagram, and other social platforms is the same as that posted on Twitter). In this study, the texts related to the projected image posted in Chinese were defined as the official domestic projected image, and those posted in English were defined as the official international projected image.
The textual data for tourists’ perceived images were obtained from visitor review data on well-known Chinese and English online travel platforms. The Chinese online travel platforms included Mafengwo, LVMama Travel, Ctrip, Qunar, TripAdvisor (in Chinese), Tongcheng Travel (LY.com, accessed on 1 March 2020), Tuniu Travel, and CNCN Travel (cncn.com, accessed on 1 March 2020), all of which are well-known online travel platforms in China where tourists post travel experiences and destination reviews. Among these platforms, Ctrip.com, Mafengwo, and LVMama Travel provided the most data. The English online travel platforms included TripAdvisor, Trip, and Airbnb. Among them, TripAdvisor is currently the world’s largest online travel review website with sub-stations in 45 countries, and Trip is the international version of Ctrip. Thus, this study focused on collecting English reviews from TripAdvisor and Trip. In this study, tourists who posted reviews on Chinese travel online platforms were defined as domestic tourists, and those who posted reviews on English travel platforms were defined as foreign tourists. The keywords “厦门 (Xiamen)” and “Xiamen” were used to search the above online travel online platforms, and 100,671 Chinese tourist reviews were obtained, of which 93,545 remained after screening and removal of duplicates. In addition, 16,553 reviews were obtained in English for the period spanning January 2011 to December 2021.
The total amount of data obtained for this study is 110,098.
3.3. Data Pre-Processing
To ensure the accuracy of the results, the collected text content needs to be pre-processed first, such as removing special symbols, spaces, duplicate text, images, etc., from the Chinese and English visitor comments and official projection content. The same pre-processing is needed before putting the data into the model. The data was further pre-processed to account for the fact that the names of Xiamen attractions are not common words. In the Chinese word separation stuttering database, not all of the Chinese phrases would be covered. Therefore, non-separable words such as “曾厝垵 (Zeng Cuoan)”, “芙蓉湖 (Furong Lake)”, and “白城沙滩 (Baicheng Beach)” were added to the customized Chinese dictionary. Similarly, in the English customized dictionary, non-separable words such as “Furong Lake”, “Zeng Cuoan”, and “Zheng Chenggong” were added. Additionally, since the destination of this study is Xiamen, and the word “Xiamen” appears frequently, the Chinese word “厦门 (Xiamen)” and the English word “Xiamen” were added to the deactivation lexicons of Chinese and English, respectively, to improve the accuracy of the results.
3.4. Research Flow
This study adopts a similar approach to previous studies utilizing Latent Dirichlet Allocation (LDA) for topic modeling [92,96]. Figure 1 shows the diagram of the research flow. The collected dataset underwent initial data cleaning, including noise processing. Subsequently, word separation was conducted using Jieba and nltk word separation tools, and corresponding deactivation tables were constructed to remove deactivation words. Following feature extraction and conversion to vector form using the CountVectorizer and TF-IDF model from the Scikit Learn toolkit, the LDA model was employed to model the themes of Chinese and English text in official projections, as well as Chinese and English text in visitor comments.
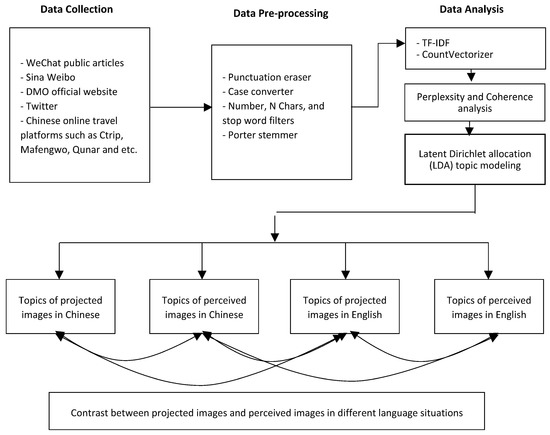
Figure 1.
Diagram of the research flow.
The TF-IDF algorithm assesses the significance of specific words within a given text relative to the entire corpus. It identifies words or phrases that have a high frequency within a particular text but occur infrequently in other texts within the same database. Consequently, these words are deemed to be indicative of the distinctive characteristics of the text [90].
As an unsupervised learning model in the text mining class, LDA models are good at discovering potential topic information in documents and finding implicit subject terms under the topics, and have better advantages in document extraction. LDA, as an unsupervised machine learning technique, is the most commonly used topic modeling method. LDA can quickly and effectively identify hidden topics (i.e., key attributes) in large unstructured text data [106,107].
It assumes that a text first requires a number of topic words in the process of formation, and the text is formed by the unfolding around these topic words, thus the words and phrases selected throughout the text are associated with each other and obey a multinomial distribution from document to topic and from topic to word, i.e.,
where w represents the words in the text, d represents the independent text, and t represents the topic of the corresponding text, thus forming a 3-layer probabilistic model. Conversely, the topic distribution of a text collection can be obtained by performing probability calculations for the distribution of documents and words in the corpus [90].
p(w|d) = p(w|t) × p(t|d)
In this paper, we use Python’s gensim toolkit to call the LDA model in order to implement various textual topic analyzes.
3.5. Topic Number Estimation
Various approaches have been proposed for determining the optimal number of topics in LDA topic modeling. One possible solution is to balance the trade-off between consistency and exclusivity between semantics and topics [108,109,110,111,112]. Perplexity is commonly used to evaluate how well the model represents the observed data and provides a comparison between theoretical predictions and actual observations [113,114]. Semantic coherence measures the internal coherence of a topic by measuring the frequency of co-occurrence between the most likely words in the original corpus; a higher semantic coherence score indicates that the most frequently used words within a topic are likely to occur together frequently [108]. Exclusivity measures the distinctiveness of a topic by comparing the similarity of word distributions [112]. Therefore, this study adopts a trade-off approach between the perplexity value, semantic coherence, and exclusivity assessment to jointly determine the optimal number of topics in the LDA results.
In this study, the process of determining the optimal number of topics for LDA modeling involved gradually increasing the number of topics from one to a maximum of 30, and then modeling different topic number scenarios to evaluate the resulting perplexity values, consistency coherence score, and topic exclusivity effects. A lower perplexity value and higher coherence score were used as indicators of a better model expression ability. The coherence score of the Chinese perceived image reached its maximum at eight nine topics, while the coherence score of the English perceived image was highest at nine topics. The Chinese projected image achieved its maximum coherence score at 23 topics, and the coherence score of the English projected image reached its peak at 26 topics. Figure 2 illustrates the Coherence scores for the four data. To further optimize the number of topics and minimize semantically similar homogeneous topics, three researchers conducted manual investigations and repeated argumentation and combined the elbow values of perplexity [115] to confirm that the number of topics for both Chinese and English projected images was determined to be nine, and the number of topics for Chinese perceived images and English perceived images was 8. The English perceived image with a topic number of 8 has less overlap between topics and is more effective than when the topic number is 9, but the Coherence score is only slightly lower than when the topic number is 9 (0.511 to 0.506) at this time. Therefore, in this study, the number of topics of English-perceived images was set at 8, and the model achieved better interpretability.
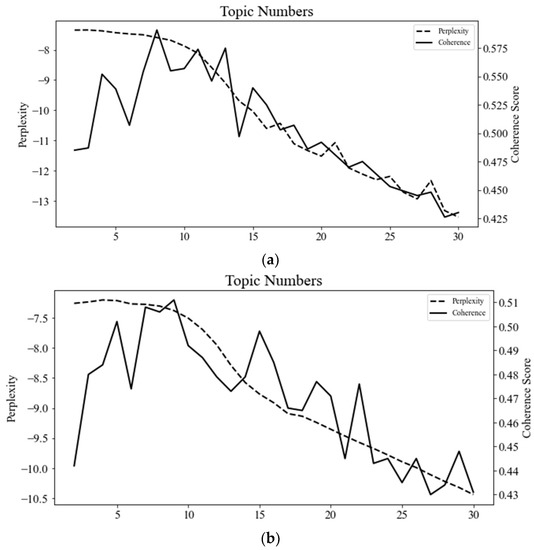
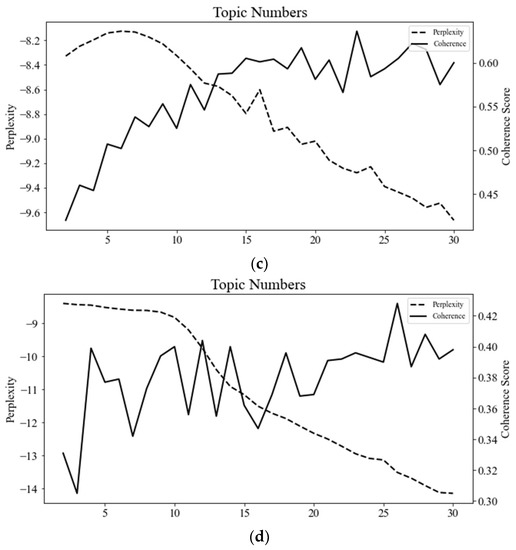
Figure 2.
Coherence scores and perplexity distributions for the LDA model performance. (a) Perceived image in Chinese, (b) Perceived image in English, (c) Projected image in Chinese, (d) Projected image in English.
4. Results
We used LDA modeling to analyze Chinese and English Official content, Chinese and English tourist reviews. LDA was able to identify the topics of this content, as well as the words in each topic. Table 2, Table 3, Table 4 and Table 5 show the topics and words using LDA for the Chinese projection, the Chinese visitor perception, the English projected image, and the English visitor-perceived image, respectively. Please note that although the clustering of words was performed automatically by LDA, the name of each topic was assigned manually by the authors after reading the words in it, which is common practice [99,116]. Specifically, for each topic, the authors first tried to select one or two words from a list of the first ten that best summarized the topic, such as “Botanical garden”, and if this did not work, the authors tried to create a phrase based on one of the words, such as “Tourism development”. If this also failed, the author ended up using a relevant phrase that could correctly describe the topic, such as “Activities” [116]. Thus, the attributes of the Chinese projected image, the English projected image, the Chinese visitor perceived image and the English visitor perceived image can be obtained separately. The official projections and visitor perceptions in Chinese were first completed in Chinese for LDA analysis, and then the results were translated into English by experienced researchers. It is important to note that the top ten frequent topic words under each topic have actual meaning, and some topic words, such as “go”, do not have much actual meaning and are excluded; if we encountered topic words with close meaning, they were aggregated into the same word [115].
Table 2.
Topic summary based on LDA analysis of projected images in Chinese.
Table 3.
Topic summary based on LDA analysis of perceived images in Chinese.
Table 4.
Topic summary based on LDA analysis of projected images in English.
Table 5.
Topic summary based on LDA analysis of perceived images in English.
4.1. Topic Modeling of Chinese Projected and Perceived Images
Upon conducting LDA model analysis on the projected and perceived images in Chinese, each topic was assigned a label following thorough deliberation between two researchers. Simultaneously, the top ten words with pragmatic significance under each topic were chosen, while terms lacking significant practical meaning, such as “go”, were eliminated from consideration [115]. The LDA model outcomes in Chinese were then professionally translated, and are displayed in Table 2 and Table 3.
The topics associated with the Chinese projected and perceived images, acquired through LDA topic modeling (Table 2 and Table 3), were subjected to comparison with the attributes obtained through manual coding in previous studies (Table 1), in order to refine the general attributes of this study. The refined attributes are presented in the rightmost column of Table 2 and Table 3. The results demonstrate that the attribute of “tourism development” emerged among the attributes of the projected image, which was not identified in prior studies. To provide a more comprehensive comparison of topic attention between the Chinese projected image and Chinese tourists’ perceived image, we have constructed a radar chart in Figure 3. This chart represents the proportion of each topic, enabling a visual assessment of the relative importance of different topics within each dataset.
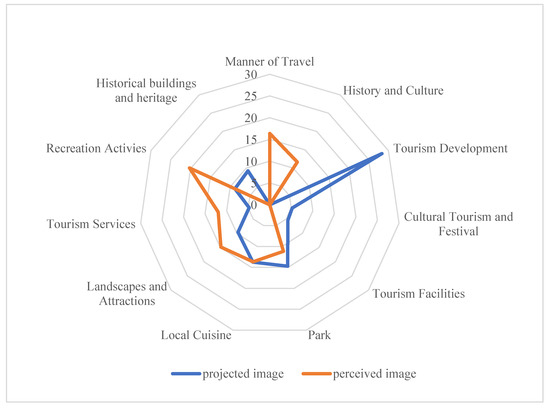
Figure 3.
Comparison of the attributes of projected and perceived images in Chinese.
The outcomes demonstrate that the LDA modeling approach can successfully model the topics of the Chinese projected image and Chinese tourist perception image, and extract meaningful topics. Additionally, the topics of the Chinese projected image and Chinese tourist perception image share some attributes, while also exhibiting differences.
4.1.1. Common Topics between the Chinese Projected and Perceived Images
From the topics and topic words extracted by the LDA topic model. We find that Gulangyu Island and food are the image attributes in which the Chinese projected image and Chinese tourists’ perceived image share commonalities. The image of Gulangyu Island projected in Chinese mainly focuses on its culture, history, architecture, art, world, museums, traditions, stories, and cultural relics to highlight the characteristics of Gulangyu Island. The image projected in Chinese shows the rich living culture and strong humanistic atmosphere of Gulangyu as a World Heritage Site. The tourists’ perceived image is based on travel activities in Gulangyu, such as the pier, itinerary, and time. The official projected image focuses on the overall content, whereas the visitors’ perceived image focuses on specific scenic spots.
Cuisine is often the meaning of travel and an important attraction for tourist destinations, and both the official projected image and tourist perceived image in Chinese involve cuisine content. The official projected image of cuisine is based on terms such as cuisine, address, life, taste, Xiamen University, Zhongshan Road, coffee, Xiamen people, Sha Po Wei, and Siming District, including the types of cuisine and places to discover cuisine. Coffee has also become an important type of cuisine in the official projected image. The image of cuisine perceived by tourists is dominated by Zengcuoan, Sha Po Wei, and the special snacks and small stores on the pedestrian street. Zhongshan Road and Sha Po Wei are cuisine-gathering places that are areas of focus for both the official and tourist images; however, tourists focus more attention on the cuisine in Zengcuoan and less on coffee.
Both the official projected image and tourist-perceived image involve activity and service-related content, but the focuses are slightly different. For activity topics, the official projected image revolves around time, location, climate, parent–child activities, etc. The tourist-perceived image also focuses on parent–child activities, but includes more specific content about parent–child activity excursions, activity locations such as science and technology museums, cable cars, and experiences. For tourism services, the official projected image is more comprehensive, including scenic spots, hotels, concessions, tickets, tourists, time, etc. The image perceived by tourists focuses on tickets, ticketing service platforms, cost performance, staff service attitudes, etc.
4.1.2. Differences between the Topics of Chinese Projected and Perceived Images
Table 2 and Figure 3 reveal that the Chinese official projected image focuses on tourism development, transportation facilities, festival tourism, off-island tourism, and parks, whereas the Chinese tourists’ perceived image focuses on landscapes and attractions, such as the piano museum, botanical garden, university campus, and Jimei School Village. Tourism development and festival tourism have become important parts of the official projected image in Chinese. However, tourists’ attention to festival tourism activities is very limited.
For many years, Xiamen has been known as a “high-value ecological garden city”, and the Chinese official projected image focuses on showing the parks, plants, ecology, flowers, and other beautiful scenery that Xiamen offers to visitors. The convenience of tourism transportation is an important factor in the visitor experience; therefore, the official Chinese projected image also focuses on introducing visitors to Xiamen’s well-developed transportation facilities, such as subways, buses, vehicles, docks, railroads, and thoroughfares.
In contrast to the overall content of the official projected image, tourists’ perceived image remains primarily centered on specific scenic spots, such as natural landscapes including the sea view, Huandao Road, Baicheng Beach, sea breeze, and seawater. Additionally, tourists also place a significant emphasis on cultural and humanistic landscapes that are related to architecture, history, culture, education, and prominent figures, such as Xiamen University, Nanputuo Temple, local restaurants, Furong Tunnel, and Jimei School Village.
4.2. Topic Modeling Analysis of English Projected and Perceived Images
The English projected image and perceived image were analyzed using the same approach, and the results of LDA topic modeling are presented in Table 4 and Table 5. The attributes of the topics of English projected image and perceived image were compared with the attributes obtained through manual coding in previous studies (Table 1) to refine the general attributes of this study, as shown in the rightmost column of Table 4 and Table 5. The analysis revealed two attributes, “city influence” and “traditional culture”, in the English projected image that were not identified in previous studies. A radar chart, depicted in Figure 4, visually presents the comparison of attention given to different topics between the English projected image and the English tourists’ perceived image. The chart illustrates the proportion of each topic, allowing for a comprehensive understanding of the variations in topic focus. The study results demonstrate that LDA modeling effectively models the topics of English projected image and English visitor-perceived image, and identifies meaningful topics. Furthermore, the English projected image and English visitor perceived image share some attributes while also having different attributes.
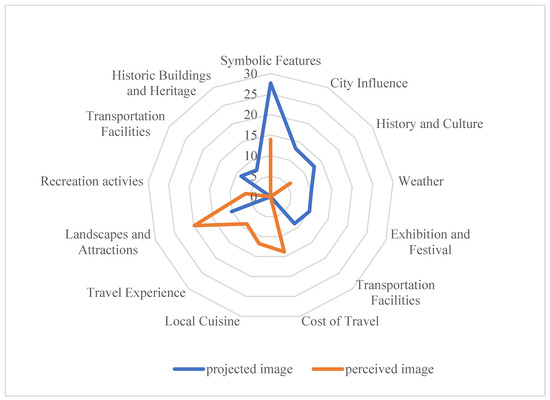
Figure 4.
Comparison of the attributes of projected and perceived images in English.
4.2.1. Commonalities of Projected and Perceived Image Topics in English
The sea garden and seascape are the common topics of the official projected image and tourists’ perceived image in English (Table 4 and Table 5, and Figure 4). The official projected image of the seascape emphasizes the beautiful seascape of Xiamen as an island city, a place to relax and enjoy. The image perceived by tourists is dominated by the seascape, which can be observed objectively; relatively speaking, the official projected image is consistent with the image perceived by tourists. Looking at the attributes, the projected and perceived images both focus on the landscape and attraction attributes, but the focus of each image is slightly different, with the official projected image promoting the characteristic landscape, attractions, and natural resources of the local area on a macro level, while tourists focus on specific well-known attractions, such as Gulangyu Island, universities, and academic villages.
4.2.2. Differences in Projected and Perceived Image Topics in English
In the topics modeled by LDA, there are significant differences between the official projected image topic and the tourist-perceived image topics. The official projected image focuses on promotion of the city’s influence, traditional culture, exhibitions and festivals, climate, transportation facilities, and special tourism, showing the pleasant climate of Xiamen as a bay city with mild winters and summers. The tourist-perceived image focuses on entrance fees to attractions, local cuisine, tourist experiences, family activities, and the piano museum. This result is similar to the findings of Stepchenkova and Zhan (2013) [12] who noted that tourists are more interested in the lives of residents than DMOs, who tend to promote the unique features of local culture and traditions.
4.3. Analysis of Each Topic in Relation to Sustainability
According to the topics and top words in Table 2, Table 3, Table 4 and Table 5, the Chinese official projection, the English official projection, the Chinese visitor reviews and the English visitor reviews have different focuses on sustainability in the context of the three dimensions of destination sustainability—economic, socio-cultural, and environmental. The Chinese official projected topics and top words include words directly related to sustainability, such as “ecology” in the second topic, which is directly related to environmental sustainability, and “development” in the first and ninth topics, which are directly related to environmental sustainability. The words “development” and “product” in topics 1 and 9 are related to economic sustainability. In the fourth and fifth topics, the words “culture” and “history” are directly related to socio-cultural sustainability. Words directly related to sustainability appear in the official English projected topics and top words, such as “City”, “million”, “development”, and “RMB” in the second, sixth, and eighth topics are directly related to economic sustainability, and “sea”, “Mountain”, “park”, “island”, “temperature“ and other words appear in topics 1, 4, 5 and 9 related to environmental sustainability. In the third and ninth topics, “tradition”, “history”, “culture”, “heritage”, and other words directly related to social and cultural sustainability.
The Chinese visitor review topics and top words also include words directly related to sustainability, such as “Gulangyu”, “scenery”, and “landscape” in topics 2, 6, and 7 which are directly related to environmental sustainability, and “history”, “culture”, “local” and “character” appear in topics 1, 3, 5 and 8 in relation to socio-cultural sustainability. In the fourth topic, words related to economic sustainability such as “price” and “preference” appear. Words directly related to sustainability appear in the official English projected topics and top words, such as “sea”, “garden”, “scenery”, “island”, and “scenic” in the first, second, fourth, and fifth topics related to environmental sustainability. In the third, sixth, seventh, and ninth topics, the words “people”, “children”, “museum” and other words related to social and cultural sustainability appear. The topic words “people”, “children”, “museum”, etc., are related to social and cultural sustainability.
From the above, it can be seen that the Chinese official projection and the English official projection focus on the three dimensions of economic, socio-cultural, and environmental sustainability of the destination, while the Chinese and English visitor reviews focus more on economic and socio-cultural sustainability.
4.4. Cross-Cultural Comparison of Perceived Image Topics of Chinese-Speaking Tourists and English-Speaking Tourists
For the purpose of facilitating comparisons, we analyze the English tourists’ perceived image in relation to the Chinese tourists’ perceived image, specifically focusing on the attention given to various themes. To visualize this comparison, we utilize the data presented in Table 3 and Table 5, and present the findings in radar charts. These charts represent the proportion of each theme, providing a visual representation of the variations observed between the two perception images. The corresponding radar charts can be found in Figure 5.
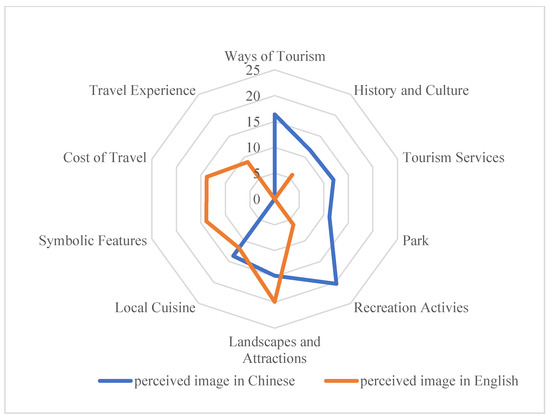
Figure 5.
Comparison of the attributes of Chinese and English perceived images.
The LDA modeling results for the Chinese tourist perceived image and English tourist perceived image topics are presented in Table 3 and Table 5, respectively, while the comparison of attention to different topics is shown in Figure 5. The results indicate that there are both similarities and differences between the two groups of tourists. According to Hofstede’s cultural attribute theory, Chinese culture tends to prioritize collectivism, long-term planning, and high-power distance [117] (Hofstede Insights, 2021), which may lead Chinese tourists to focus more on group tours, traditional cultural experiences, and authoritative guided tours. In contrast, English-speaking tourists may place a greater emphasis on individual freedom, independent travel, and exploring local cultures. Their interests in local customs, history, and culture may also differ from those of Chinese tourists.
4.4.1. Cross-Cultural Interpretation of Topics with the Same Perceived Images of Chinese-Speaking Tourists and English-Speaking Tourists
In terms of cross-cultural interpretation of the same topics in Chinese tourists’ perceived images and English tourists’ perceived images, four topics were found to be identical: parent–child activities, local cuisine, piano museum, and Gulangyu Island trip. However, there are still some differences even among these identical topics. Hofstede’s individualism–collectivism attribute can partially explain this result, as collectivist culture emphasizes social relationships and teamwork, leading to the popularity of family-oriented activities in China. In contrast, individualistic cultures value the interests and development of the individual, leading to a greater focus on individual travel and self-development [117] (Hofstede Insights, 2021). The underlying reason for this result is likely to be related to Confucian culture, which influences the travel motivation of Chinese tourists, where family reunion and children’s learning are key factors in their travel decisions [85,118].
Chinese-speaking tourists demonstrated a preference for local cuisine by using terms such as “local” and “special”, which suggests an interest in experiencing the local culture and seeking out food and places that reflect collectivist values. In contrast, English-speaking tourists used terms such as “eat” and “people” when discussing local cuisine, suggesting a focus on personal needs and independence in seeking out food and places of personal preference.
Regarding the trip to Gulangyu Island, Chinese-speaking tourists focused on the transportation method (16.39%), while English-speaking tourists focused on both the transportation method and the attractions themselves (10.08%). This result aligns with Hofstede’s individualism–collectivism attribute, as collectivist cultures tend to prioritize human interactions and relationships, while individualistic cultures prioritize personal interests and self-expression. Chinese tourists may focus more on the way they travel to Gulangyu, such as traveling with family or friends, while English-speaking tourists may prioritize the attractions themselves to fulfill their personal interests and needs.
In terms of the piano museum topic, there is a difference in the top 10 most frequent words between Chinese-speaking tourists and English-speaking tourists that cannot be explained by Hofstede’s cultural attribute. Chinese-speaking visitors seem to pay more attention to details such as time, queues, and tickets, while English-speaking visitors focus more on the overall topic and landscape, such as the museum, piano, and island. This difference may reflect distinct communication styles and contexts in the two languages and cultures, which influence how visitors focus on and express topics [119].
4.4.2. Cross-Cultural Interpretation of Different Topics in the Perceived Images of Chinese Tourists and English Tourists
The perceived images of Chinese and English-speaking tourists differ in terms of topic preference. English-speaking tourists are most impressed with Xiamen’s sea garden topic, which accounts for the largest proportion (13.95%) of their perceived images, whereas this topic does not appear in Chinese tourists’ perceived images. This finding indicates that English-speaking tourists perceive Xiamen as a city of maritime gardens, which is not as salient for Chinese tourists.
In addition, English-speaking tourists place more emphasis on entrance fees to attractions, while this topic does not appear in the perceived image of Chinese tourists. English-speaking tourists generally believe that traveling in Xiamen is worth the ticket price and offers good value for money. This observation can be explained by Hofstede’s cultural attribute of long-term vs. short-term orientation, which describes cultural attitudes and orientations toward time. In long-term-oriented cultures, people tend to focus on lasting investments, while in short-term-oriented cultures, people focus more on immediate rewards. Chinese culture values long-term investments, which means that Chinese tourists may prioritize the cultural value and experience of the attraction itself over its admission price. On the other hand, Western cultures, such as English-speaking tourists, tend to focus more on immediate rewards and value, and are more concerned with the cost and value of a trip, which explains why they are more likely to consider the price of admission to attractions.
Chinese-speaking tourists prioritize tourism service issues such as service attitude and discounts on tickets, while English-speaking tourists do not share the same level of concern for these issues. The variation can be explained by Hofstede’s individualism–collectivism attribute, which highlights how individualist societies prioritize individual autonomy rights and independence, while collectivist societies prioritize social relations and collective interests. In individualistic societies, transactions between individuals and service providers tend to be commercial and individual, whereas in collectivistic societies, transactions involve social relations and trust. As such, Chinese-speaking tourists may prioritize service quality and price because they value their relationship with tourism service providers, which affects their future tourism experiences [83].
English-speaking tourists’ perception of the Xiamen University campus and Jimei School Village is grouped under one topic, but Chinese tourists have divided their perception into two different topics, indicating a deeper understanding and greater interest in these two attractions. In China, historical and cultural factors promote stability and predictability, and people tend to avoid uncertainty. Consequently, Chinese-speaking visitors focus on specific aspects of the landscape, architecture, and history, demonstrating their concern for the actual environment and experience of the university campus. In contrast, native English-speaking cultures prioritize freedom and exploration and are more willing to accept risks and uncertainties. Therefore, English-speaking visitors describe the college campus topic with more abstract words such as “beautiful”, “landscape”, “campus”, and “beach”, focusing on the natural environment and overall sensory experience. This finding is similar to that of Soldatenko and Backer’s study (2019) [43].
The frequency of the Botanical Garden topic was 11.16% in the perception of Chinese-speaking visitors, whereas this topic was absent in the perception of English-speaking visitors, who were more attracted to Xiamen as a beautiful island garden city. This cultural disparity can be explained by Hofstede’s individualism–collectivism attribute. Chinese-speaking visitors tend to engage in group activities, and the Botanical Garden serves as an important destination for parent–child outings, which explains their high level of admiration for this attraction. In contrast, English-speaking tourists are more likely to come from individualistic cultures, where autonomy and self-realization are highly valued. Therefore, their preference for Xiamen as a beautiful sea garden city aligns with their cultural background and values.
5. Discussion and Conclusions
The present study demonstrates that LDA modeling can uncover destination image attributes that were not identified in previous manual coding studies, such as “tourism development” and “city influence”, thereby contributing to a more comprehensive understanding of destination images. This finding underscores the applicability of LDA thematic modeling for destination image research, particularly at a time when OGC and TGC data are becoming more abundant. The results of this study are consistent with previous research by Lyu et al. (2022) [88], Maier et al. (2018) [91], Xiang et al. (2017) [89], and Shang & Luo (2022) [98].
Furthermore, this study reveals differences between projected and perceived destination images in both Chinese and English. While Gulangyu, food, activities, and service-related content were common topics in both the official projected image in Chinese and the perceived image of tourists, each image had a different focus. The projected image emphasized the destination’s tourism development, transportation facilities, festival tourism, and overall tourism, while the tourist-perceived image focused more on specific attractions such as the natural and human landscapes of the destination. These findings align with previous research conducted by Stepchenkova & Zhan (2013) [12], He et al. (2022) [11], Meng et al. (2021) [22], and others.
In recent years, there has been a significant increase in tourists’ awareness and understanding of the significance of sustainable tourism [36]. As a result, destination management organizations (DMOs) are encouraged to effectively communicate sustainability messages through various online and offline channels to attract tourist interest and enhance sustainability practices [36]. However, this study highlights a disparity in sustainability concerns between DMOs and tourists, indicating the need for DMOs to adopt practices that promote tourists’ sustainability awareness and satisfaction. Therefore, it is imperative for DMOs to develop and implement sustainable tourism strategies that not only address environmental concerns but also meet the expectations and preferences of tourists. This can be achieved through collaborative efforts between DMOs, tourists, and other stakeholders in the tourism industry, with the ultimate goal of achieving sustainable tourism development.
In the field of tourism and hospitality, cultural values have long been recognized as a significant factor influencing the mindset and behavior of different individuals and groups [75,76]. This study aims to bridge the gap in the previous literature by focusing on the cross-cultural study of perceived images, rather than on tourism motivation, destination choice, and accommodation staff-tourist interaction cross-cultural studies. Additionally, this study aims to highlight the differences in the perceived image of tourists speaking different languages, in order to provide theoretical guidance to DMOs when marketing destinations and tourism products in different languages.
This study uncovers significant disparities in the perceived images of Chinese and British tourists, underscoring the impact of their distinct cultural backgrounds. Chinese tourists’ perceptions distinctly mirror their cultural values rooted in collectivism, long-term orientation, and uncertainty avoidance. Conversely, British tourists’ perceptions are characterized by individualism and a penchant for short-term orientation. These findings are supported by the Hofstede cultural dimension theory, shedding light on the underlying factors driving these differences. In doing so, this study contributes to the understanding of Hofstede’s cultural theory in the context of tourism and hospitality, while also expanding our knowledge of destination image perceptions among Chinese- and English-speaking tourists.
The study’s results suggest that DMOs can benefit from monitoring and understanding tourists’ perceptions of their image in order to improve their business communication [1]. By understanding the cultural differences between Chinese and British tourists, destination marketing organizations can tailor their promotional strategies to effectively target each audience. For example, in the case of Chinese tourists, emphasizing specific attractions, natural landscapes, culture, and humanity in promotional materials can align with their cultural values of collectivism, respect for history and tradition, and appreciation of natural beauty. This can create a stronger connection with Chinese tourists and enhance their perceived image of the destination. On the other hand, for British tourists, focusing on entrance fees, local cuisine, travel experiences, and family activities can cater to their cultural values of individualism, pragmatism, and personal enjoyment. By highlighting these aspects, destination marketing organizations can shape the projected image in a way that resonates with British tourists and influences their perception of the destination. By considering the cultural backgrounds and preferences of different tourist groups, destination marketing organizations can create targeted marketing campaigns, develop appropriate communication strategies, and customize tourism experiences to enhance the overall appeal of the destination to both Chinese and British tourists.
The findings of this study have significant implications for the tourism and hospitality industries. Firstly, the LDA topic modeling approach used in this study provides a new and complementary method for identifying and comparing perceived images of tourism destinations, which can enhance traditional manual coding and content analysis methods. Secondly, this study identifies cross-cultural differences in perceived images between Chinese and English-speaking tourists, emphasizing the need for tailored marketing strategies for different language groups by DMOs. Thirdly, cultural attributes are found to play a significant role in shaping tourists’ perceptions of tourism destinations, which highlight the importance of considering cultural values in tourism marketing.
The COVID-19 outbreak has had a significant impact on China’s tourism industry, with closures of tourist destinations restricting domestic and international tourism. As the epidemic is gradually being controlled, reopening to tourists has become a priority, and increasing inbound tourism revenue and promotion worldwide have become critical tasks for destinations. This study can provide both theoretical and practical guidance for tourism destination management organizations to improve their marketing efficiency and re-evaluate their marketing programs.
6. Limitations and Future Research
The present study employs the LDA model to analyze the destination images conveyed in official promotional texts and tourist reviews in Chinese and English, aiming to identify gaps between the projected and perceived images of the destination. This research not only introduces new methodologies and perspectives to destination image studies but also provides insights for destination organizations to enhance their marketing efficiency and improve their destination image.
Several future research directions can be pursued. Firstly, this study focuses on analyzing the differences between the destination perceptions of Chinese and English-speaking tourists based on official and tourist texts. Future studies could extend the analysis to other language groups, such as French and German, and examine the differences in destination perceptions based on Hofstede’s national culture attributes. Such investigations can facilitate the development of more accurate marketing strategies for destination organizations. Secondly, this study’s analysis of destination sustainability is only interpreted directly in terms of topics and subject terms, and subsequent studies could add quantitative research to investigate deeper theories of destination sustainability in relation to other theories. Thirdly, as the projected content of tourist destinations may change over time, it is essential to explore the differences and similarities between the official projected landscape image and tourists’ perceived landscape image. Future research can also examine whether tourists’ perceived images change when the projected content changes and how this affects their intention to return. Fourthly, the present study did not explore the communication paths between the official projected images and tourists’ perceived images due to space limitations. Thus, future research should conduct an in-depth investigation of these communication paths and analyze their impact on destination images. Fifthly, since social media platforms have become an essential source of travel information, future studies could explore the impact of social media on tourists’ perceived images and cross-validate the findings using questionnaires and interviews, considering that online comments may have elements of showing off and may not accurately reflect tourists’ true feelings.
Author Contributions
Conceptualization, Q.C. and Q.J.; methodology, Q.C., R.L. and S.X.; software, R.L. and S.X.; validation, Q.C., S.X. and R.L.; formal analysis, Q.C.; investigation, S.X.; resources, R.L.; data curation, S.X. and R.L.; writing—original draft preparation, Q.C.; writing—review and editing, R.L.; visualization, S.X.; supervision, Q.J.; project administration, Q.C.; funding acquisition, Q.C. All authors have read and agreed to the published version of the manuscript.
Funding
This research was funded by the Fujian Provincial Social Science Foundation, grant number FJ2021B161.
Institutional Review Board Statement
Not applicable.
Informed Consent Statement
Not applicable.
Data Availability Statement
Not applicable.
Acknowledgments
The authors would like to gratefully acknowledge the anonymous reviewers and the members of the editorial team who helped to improve this paper through their thorough review.
Conflicts of Interest
The authors declare no conflict of interest.
Abbreviations
DMO, destination marketing organizations; TDI, tourism destination image; UGC, user-generated content; TGC, tourist-generated content; OGC, Occupationally Generated Content; LDA, latent Dirichlet allocation.
References
- Önder, I.; Marchiori, E. A comparison of pre-visit beliefs and projected visual images of destinations. Tour. Manag. Perspect. 2017, 21, 42–53. [Google Scholar] [CrossRef]
- Marine-Roig, E.; Ferrer-Rosell, B. Measuring the gap between projected and perceived destination images of Catalonia using compositional analysis. Tour. Manag. 2018, 68, 236–249. [Google Scholar] [CrossRef]
- Chen, J.; Becken, S.; Stantic, B. Assessing destination satisfaction by social media: An innovative approach using Importance-Performance Analysis. Ann. Tour. Res. 2022, 93, 103371. [Google Scholar] [CrossRef]
- Chiu, W.; Zeng, S.; Cheng, P. The influence of destination image and tourist satisfaction on tourist loyalty: A case study of Chinese tourists in Korea. Int. J. Cult. Tour. Hosp. 2016, 10, 223–234. [Google Scholar] [CrossRef]
- Huang, G.I.; Karl, M.; Wong, I.A.; Law, R. Tourism destination research from 2000 to 2020: A systematic narrative review in conjunction with bibliographic mapping analysis. Tour. Manag. 2023, 95, 104686. [Google Scholar] [CrossRef]
- Reza Jalilvand, M.; Samiei, N.; Dini, B.; Yaghoubi Manzari, P. Examining the structural relationships of electronic word of mouth, destination image, tourist attitude toward destination and travel intention: An integrated approach. J. Destin. Mark. Manag. 2012, 1, 134–143. [Google Scholar] [CrossRef]
- Fossgard, K.; Mata, I.L.; Haukeland, J.V. Do visitors gaze and reproduce what destination managers wish to commercialise? Perceived and projected image in the UNESCO World Heritage area. Int. J. Digit. Cult. Electron. Tour. 2018, 2, 294–321. [Google Scholar] [CrossRef]
- Toral, S.; Martínez-Torres, M.R.; González-Rodríguez, M.R. Identification of the Unique Attributes of Tourist Destinations from Online Reviews. J. Travel Res. 2018, 57, 908–919. [Google Scholar] [CrossRef]
- Bramwell, B.; Rawding, L. Tourism marketing images of industrial cities. Ann. Tour. Res. 1996, 23, 201–221. [Google Scholar] [CrossRef]
- Grosspietsch, M. Perceived and projected images of Rwanda: Visitor and international tour operator perspectives. Tour. Manag. 2006, 27, 225–234. [Google Scholar] [CrossRef]
- He, Z.; Deng, N.; Li, X.; Gu, H. How to “Read” a Destination from Images? Machine Learning and Network Methods for DMOs’ Image Projection and Photo Evaluation. J. Travel Res. 2021, 61, 597–619. [Google Scholar] [CrossRef]
- Stepchenkova, S.; Zhan, F. Visual destination images of Peru: Comparative content analysis of DMO and user-generated photography. Tour. Manag. 2013, 36, 590–601. [Google Scholar] [CrossRef]
- Mak, A.H.N. Online destination image: Comparing national tourism organisation’s and tourists’ perspectives. Tour. Manag. 2017, 60, 280–297. [Google Scholar] [CrossRef]
- Govers, R.; Go, F. Projected Destination Image Online: Website Content Analysis of Pictures and Text. J. Inf. Technol. Tour. 2004, 7, 73–89. [Google Scholar] [CrossRef]
- Picazo, P.; Moreno-Gil, S. Analysis of the projected image of tourism destinations on photographs: A literature review to prepare for the future. J. Vacat. Mark. 2017, 25, 135676671773635. [Google Scholar] [CrossRef]
- Kim, S.; Lehto, X. Projected and Perceived Destination Brand Personalities The Case of South Korea. J. Travel Res. 2013, 52, 117–130. [Google Scholar] [CrossRef]
- Gartner, W.C. Tourism Image: Attribute Measurement of State Tourism Products Using Multidimensional Scaling Techniques. J. Travel Res. 1989, 28, 16–20. [Google Scholar] [CrossRef]
- Urry, J. The Tourist Gaze, 2nd ed.; Sage: New York, NY, USA, 2002. [Google Scholar]
- Hunter, W.C. The social construction of tourism online destination image: A comparative semiotic analysis of the visual representation of Seoul. Tour. Manag. 2016, 54, 221–229. [Google Scholar] [CrossRef]
- Komppula, R.; Laukkanen, T. Comparing perceived images with projected images—A case study on Finnish ski destinations. Eur. J. Tour. Res. 2016, 12, 41–53. [Google Scholar] [CrossRef]
- Dong, Y.; Gao, J. A customized method to compare the projected and perceived destination images of repeat tourists. J. Destin. Mark. Manag. 2022, 25, 100727. [Google Scholar]
- Meng, L.; Liu, Y.; Wang, Y.; Li, X. A big-data approach for investigating destination image gap in Sanya City: When will the online and the offline goes parted? Regsus 2021, 2, 98–108. [Google Scholar] [CrossRef]
- Xiao, X.; Fang, C.; Lin, H.; Chen, J. A framework for quantitative analysis and differentiated marketing of tourism destination image based on visual content of photos. Tour. Manag. 2022, 93, 104585. [Google Scholar] [CrossRef]
- Lojo, A.; Li, M.; Xu, H. Online tourism destination image: Components, information sources, and incongruence. J. Travel Tour. Mark. 2020, 37, 495–509. [Google Scholar] [CrossRef]
- Arefieva, V.; Egger, R.; Yu, J. A machine learning approach to cluster destination image on Instagram. Tour. Manag. 2021, 85, 104318. [Google Scholar] [CrossRef]
- Liu, H.; Wu, L.; Li, X. Social Media Envy: How Experience Sharing on Social Networking Sites Drives Millennials’ Aspirational Tourism Consumption. J. Travel Res. 2018, 58, 355–369. [Google Scholar] [CrossRef]
- Wang, B.; Loo, B.P.Y. The hierarchy of cities in Internet news media and Internet search: Some insights from China. Cities 2019, 84, 121–133. [Google Scholar] [CrossRef]
- Mason, P.; Davis, B. Measuring Guest Satisfaction and Competitive Position in the Hospitality and Tourism Industry: An Application of Stance-Shift Analysis to Travel Blog Narratives. J. Travel Res. 2009, 48, 139–151. [Google Scholar]
- Kladou, S.; Mavragani, E. Assessing destination image: An online marketing approach and the case of TripAdvisor. J. Destin. Mark. Manag. 2015, 4, 187–193. [Google Scholar] [CrossRef]
- Lu, W.; Stepchenkova, S.O. User-Generated Content as a Research Mode in Tourism and Hospitality Applications: Topics, Methods, and Software. J. Hosp. Tour. Manag. 2015, 24, 119–154. [Google Scholar] [CrossRef]
- Zhang, Y.; Gao, J.; Cole, S.; Ricci, P. How The Spread of User-generated Contents Shapes International Tourism Distribution: Using Agent-based Modeling to Inform Strategic UGC Marketing. J. Travel Res. 2020, 60, 1469–1491. [Google Scholar] [CrossRef]
- Choi, S.; Lehto, X.Y.; Morrison, A.M. Destination image representation on the web: Content analysis of Macau travel related websites. Tour. Manag. 2007, 28, 118–129. [Google Scholar] [CrossRef]
- Martinez-Torres, R.; Rodriguez-Piñero, F.; Toral, S.L. Customer preferences versus managerial decision-making in open innovation communities: The case of Starbucks. Technol. Anal. Strateg. Manag. 2015, 27, 1–13. [Google Scholar] [CrossRef]
- Lin, M.S.; Liang, Y.; Xue, J.X.; Pan, B.; Schroeder, A. Destination image through social media analytics and survey method. Int. J. Contemp. Hosp. Manag. 2021; ahead-of-print. [Google Scholar] [CrossRef]
- Penagos-Londoño, G.I.; Rodriguez–Sanchez, C.; Ruiz-Moreno, F.; Torres, E. A machine learning approach to segmentation of tourists based on perceived destination sustainability and trustworthiness. J. Destin. Mark. Manag. 2021, 19, 100532. [Google Scholar] [CrossRef]
- Čuić Tanković, A.; Mušanović, J. Exploring direct and indirect effects of sustainability communication on destination reputation. J. Destin. Mark. Manag. 2022, 25, 100729. [Google Scholar] [CrossRef]
- Sánchez-Fernández, R.; Iniesta-Bonillo, M.-A.; Cervera-Taulet, A. Environmental sustainability in the mediterranean destinations: A latent class segmentation analysis. Environ. Eng. Manag. J. 2016, 15, 1501–1510. [Google Scholar] [CrossRef]
- Fernández, R.; Bonillo, M.; Cervera-Taulet, A. Exploring the concept of perceived sustainability at tourist destinations: A market segmentation approach. J. Travel Tour. Mark. 2018, 36, 176–190. [Google Scholar] [CrossRef]
- Fam, K.-S.; Cheng, B.L.; Cham, T.H.; Yi, M.T.C.; Ting, H. The Role of Cultural Differences in Customer Retention: Evidence from the High-Contact Service Industry. J. Hosp. Tour. Res. 2021, 47, 257–288. [Google Scholar] [CrossRef]
- Stepchenkova, S.; Kim, H.; Kirilenko, A. Cultural Differences in Pictorial Destination Images: Russia through the Camera Lenses of American and Korean Tourists. J. Travel Res. 2014, 54, 758–773. [Google Scholar] [CrossRef]
- Li, M. Cross-Cultural Tourist Research: A Meta-Analysis. J. Hosp. Tour. Res. 2014, 38, 40–77. [Google Scholar] [CrossRef]
- Kim, J.-H.; Ritchie, J.R.B. Cross-Cultural Validation of a Memorable Tourism Experience Scale (MTES). J. Travel Res. 2014, 53, 323–335. [Google Scholar] [CrossRef]
- Soldatenko, D.; Backer, E. A content analysis of cross-cultural motivational studies in tourism relating to nationalities. J. Hosp. Tour. Manag. 2019, 38, 122–139. [Google Scholar] [CrossRef]
- Deng, N.; Liu, J.; Dai, Y.; Li, H. Different cultures, different photos: A comparison of Shanghai’s pictorial destination image between East and West. Tour. Manag. Perspect. 2019, 30, 182–192. [Google Scholar] [CrossRef]
- Craig, C.; Douglas, S. Beyond national culture: Implications of cultural dynamics for consumer research. Int. Mark. Rev. 2006, 23, 322–342. [Google Scholar] [CrossRef]
- Pizam, A.; Sussmann, S. Does nationality affect tourist behavior? Ann. Tour. Res. 1995, 22, 901–917. [Google Scholar] [CrossRef]
- Turner, L.; Reisinger, Y.; McQuilken, L. How Cultural Differences Cause Dimensions of Tourism Satisfaction. J. Travel Tour. Mark. 2002, 11, 79–101. [Google Scholar] [CrossRef]
- Kim, S.; Filimonau, V. On linguistic relativity and pro-environmental attitudes in tourism. Tour. Manag. 2017, 63, 158–169. [Google Scholar] [CrossRef]
- Lai, K.; Li, X. Tourism Destination Image: Conceptual Problems and Definitional Solutions. J. Travel Res. 2015, 55, 1065–1080. [Google Scholar] [CrossRef]
- Stepchenkova, S.; Mills, J. Destination Image: A Meta-Analysis of 2000–2007 Research. J. Hosp. Tour. Manag. 2010, 19, 575–609. [Google Scholar] [CrossRef]
- Bandyopadhyay, R.; Morais, D. Representative dissonance: India’s Self and Western Image. Ann. Tour. Res. 2005, 32, 1006–1021. [Google Scholar] [CrossRef]
- Garrod, B.; Kosowska, A. Destination Image Consistency and Dissonance: A Content Analysis of Goa’s Destination Image in Brochures and Guidebooks. Tour. Anal. 2012, 17, 167–180. [Google Scholar] [CrossRef]
- Andreu, L.; Bigne, E.; Cooper, C. Projected and Perceived Image of Spain as a Tourist Destination for British Travellers. J. Travel Tour. Mark. 2001, 9, 47–67. [Google Scholar] [CrossRef]
- Ji, S.; Wall, G. Understanding supply- and demand-side destination image relationships: The case of Qingdao, China. J. Vacat. Mark. 2015, 21, 205–222. [Google Scholar] [CrossRef]
- Sonia, K. Perceived and Projected Image of India as a Tourism Destination. South Asian J. Tour. Herit. 2013, 6, 97–107. [Google Scholar]
- Marine-Roig, E.; Clavé, S. Destination Image Gaps Between Official Tourism Websites and User-Generated Content. In Information and Communication Technologies in Tourism 2016; Springer: Berlin/Heidelberg, Germany, 2016; pp. 253–265. [Google Scholar]
- Paül i Agustí, D. The clustering of city images on Instagram: A comparison between projected and perceived images. J. Destin. Mark. Manag. 2021, 20, 100608. [Google Scholar] [CrossRef]
- Xiang, G.; Dong, Y. Network mechanism contrast: A new perspective of the ‘projection-perception’ contrast of the destination image. Curr. Issues Tour. 2022, 26, 1–17. [Google Scholar]
- Shen, S.M. In The statistical analysis of compositional data. J. R. Stat. Soc. Ser. B (Methodol.) 1983, 44, 139–160. [Google Scholar]
- Paris, C.; Musa, G.; Thirumoorthi, T. A comparison between Asian and Australasia backpackers using cultural consensus analysis. Curr. Issues Tour. 2014, 18, 175–195. [Google Scholar] [CrossRef]
- Woodside, A.G.; Hsu, S.-Y.; Marshall, R. General theory of cultures’ consequences on international tourism behavior. J. Bus. Res. 2011, 64, 785–799. [Google Scholar] [CrossRef]
- Kim, S.S.; Prideaux, B. Marketing implications arising from a comparative study of international pleasure tourist motivations and other travel-related characteristics of visitors to Korea. Tour. Manag. 2005, 26, 347–357. [Google Scholar] [CrossRef]
- Kozak, M. Comparative assessment of tourist satisfaction with destinations across two nationalities. Tour. Manag. 2001, 22, 391–401. [Google Scholar] [CrossRef]
- Kozak, M. Comparative analysis of tourist motivations by nationality and destinations. Tour. Manag. 2002, 23, 221–232. [Google Scholar] [CrossRef]
- Park, S.; Lee, C.-K.; Miller, J. A Comparative Study of the Motivations, Activities, Overall Satisfaction, and Post-Trip Behaviors of International Tourists in Macau: Mainland Chinese, Hongkongese, Taiwanese, and Westerners. Asia Pac. J. Tour. Res. 2014, 20, 1–20. [Google Scholar] [CrossRef]
- Zhang, K.; Chen, Y.; Li, C. Discovering the tourists’ behaviors and perceptions in a tourism destination by analyzing photos’ visual content with a computer deep learning model: The case of Beijing. Tour. Manag. 2019, 75, 595–608. [Google Scholar] [CrossRef]
- Williams, P.; Soutar, G.N.; Ashill, N.J.; Naumann, E. Value drivers and adventure tourism: A comparative analysis of Japanese and Western consumers. J. Serv. Theory Pract. 2017, 27, 102–122. [Google Scholar] [CrossRef]
- Legoherel, P.; Daucé, B.; Hsu, C.; Ranchhold, A. Culture, Time Orientation, and Exploratory Buying Behavior. J. Int. Consum. Mark. 2009, 21, 93–107. [Google Scholar] [CrossRef]
- Usunier, J.-C. Marketing Across Cultures; Financial Times: London, UK; Prentice Hall: Hoboken, NJ, USA, 2000. [Google Scholar]
- Huang, S.; Hsu, C.H.C.; Chan, A. Tour Guide Performance and Tourist Satisfaction: A Study of the Package Tours in Shanghai. J. Hosp. Tour. Res. 2010, 34, 3–33. [Google Scholar] [CrossRef]
- Oh, H.; Hsu, C.H.C. Assessing equivalence of hotel brand equity measures in cross-cultural contexts. Int. J. Hosp. Manag. 2014, 36, 156–166. [Google Scholar] [CrossRef]
- Nakayama, M.; Wan, Y. Is culture of origin associated with more expressions? An analysis of Yelp reviews on Japanese restaurants. Tour. Manag. 2018, 66, 329–338. [Google Scholar] [CrossRef]
- Kay, P. Cultural Experience Tourist Motives Dimensionality: A Cross-Cultural Study. J. Hosp. Tour. Manag. 2009, 18, 329–371. [Google Scholar] [CrossRef]
- Xi, Y.; Ma, C.; Qiang, Y.; Jiang, Y. A Cross-cultural Analysis of Tourists’ Perceptions of Airbnb Attributes. Int. J. Hosp. Tour. Adm. 2022, 23, 754–787. [Google Scholar] [CrossRef]
- Zhang, G.; Cheng, M.; Zhang, J. A cross-cultural comparison of peer-to-peer accommodation experience: A mixed text mining approach. Int. J. Hosp. Manag. 2022, 106, 103296. [Google Scholar] [CrossRef]
- Huang, J. The dining experience of Beijing Roast Duck: A comparative study of the Chinese and English online consumer reviews. Int. J. Hosp. Manag. 2017, 66, 117–129. [Google Scholar] [CrossRef]
- Browning, C.S.; Tonra, B. Beyond the West and towards the Anglosphere; Routledge: Oxforeshire, UK, 2010. [Google Scholar]
- Michon, R.; Chebat, J.-C. Cross-cultural mall shopping values and habitats: A comparison between English- and French-speaking Canadians. J. Bus. Res. 2004, 57, 883–892. [Google Scholar] [CrossRef]
- Schuckert, M.; Liu, X.; Law, R. A segmentation of online reviews by language groups: How English and non-English speakers rate hotels differently. Int. J. Hosp. Manag. 2015, 48, 143–149. [Google Scholar] [CrossRef]
- van Zyl, H.; Meiselman, H.L. The roles of culture and language in designing emotion lists: Comparing the same language in different English and Spanish speaking countries. Food Qual. Prefer. 2015, 41, 201–213. [Google Scholar] [CrossRef]
- Hofstede Insights. The 6 Dimensions of National Culture. 2017. Available online: https://www.hofstede-insights.com/models/national-culture/ (accessed on 2 January 2023).
- Hofstede Insights. Country Comparison: China vs. U.S. 2017. Available online: https://www.hofstede-insights.com/country-comparison/china,the-usa/ (accessed on 2 January 2023).
- Chen, L.-H.; Loverio, J.P.; Mei-jung, W.; Naipeng, B.; Shen, C.-C. The role of face (mien-tzu) in Chinese tourists’ destination choice and behaviors. J. Hosp. Tour. Manag. 2021, 48, 500–508. [Google Scholar] [CrossRef]
- Fu, X.; Cai, L.A.; Lehto, X.Y. Framing Chinese Tourist Motivations Through the Lenses of Confucianism. J. Travel Tour. Mark. 2017, 34, 149–170. [Google Scholar] [CrossRef]
- Huang, S.; Wen, J. Developing and validating a Chinese cultural value scale in tourism. Tour. Manag. 2021, 86, 104327. [Google Scholar] [CrossRef]
- Balaji, T.K.; Annavarapu, C.S.R.; Bablani, A. Machine learning algorithms for social media analysis: A survey. Comput. Sci. Rev. 2021, 40, 100395. [Google Scholar]
- Rutledge, R.B.; Chekroud, A.M.; Huys, Q.J.M. Machine learning and big data in psychiatry: Toward clinical applications. Curr. Opin. Neurobiol. 2019, 55, 152–159. [Google Scholar] [CrossRef] [PubMed]
- Lyu, J.; Khan, A.; Bibi, S.; Chan, J.H.; Qi, X. Big data in action: An overview of big data studies in tourism and hospitality literature. J. Hosp. Tour. Manag. 2022, 51, 346–360. [Google Scholar] [CrossRef]
- Xiang, Z.; Du, Q.; Ma, Y.; Fan, W. A comparative analysis of major online review platforms: Implications for social media analytics in hospitality and tourism. Tour. Manag. 2017, 58, 51–65. [Google Scholar] [CrossRef]
- Blei, D.M.; Ng, A.; Jordan, M.I. Latent Dirichlet Allocation. J. Mach. Learn. Res. 2001, 3, 993–1022. [Google Scholar]
- Maier, D.; Waldherr, A.; Miltner, P.; Wiedemann, G.; Niekler, A.; Keinert, A.; Pfetsch, B.; Heyer, G.; Reber, U.; Häussler, T.; et al. Applying LDA Topic Modeling in Communication Research: Toward a Valid and Reliable Methodology. Commun. Methods Meas. 2018, 12, 1–26. [Google Scholar] [CrossRef]
- Taecharungroj, V.; Mathayomchan, B. Analysing TripAdvisor reviews of tourist attractions in Phuket, Thailand. Tour. Manag. 2019, 75, 550–568. [Google Scholar] [CrossRef]
- Kirilenko, A.P.; Stepchenkova, S.O.; Hernandez, J.M. Comparative clustering of destination attractions for different origin markets with network and spatial analyses of online reviews. Tour. Manag. 2019, 72, 400–410. [Google Scholar] [CrossRef]
- Aggarwal, S.; Gour, A. Peeking inside the minds of tourists using a novel web analytics approach. J. Hosp. Tour. Manag. 2020, 45, 580–591. [Google Scholar] [CrossRef]
- Albayrak, T.; Cengizci, A.D.; Caber, M.; Nang Fong, L.H. Big data use in determining competitive position: The case of theme parks in Hong Kong. J. Destin. Mark. Manag. 2021, 22, 100668. [Google Scholar] [CrossRef]
- Ali, T.; Marc, B.; Omar, B.; Soulaimane, K.; Larbi, S. Exploring destination’s negative e-reputation using aspect based sentiment analysis approach: Case of Marrakech destination on TripAdvisor. Tour. Manag. Perspect. 2021, 40, 100892. [Google Scholar] [CrossRef]
- Mirzaalian, F.; Halpenny, E. Exploring destination loyalty: Application of social media analytics in a nature-based tourism setting. J. Destin. Mark. Manag. 2021, 20, 100598. [Google Scholar] [CrossRef]
- Shang, Z.; Luo, J.M. Topic modelling for wildlife tourism online reviews: Analysis of quality factors. Curr. Issues Tour. 2022, 14, 3246. [Google Scholar] [CrossRef]
- Jia, S. Motivation and satisfaction of Chinese and U.S. tourists in restaurants: A cross-cultural text mining of online reviews. Tour. Manag. 2020, 78, 104071. [Google Scholar] [CrossRef]
- UNWTO. EU Guidebook on Sustainable Tourism for Developemnt; UNWTO: Madrid, Spain, 2023; Available online: https://www.unwto.org/EU-guidebook-on-sustainable-tourism-for-development (accessed on 2 January 2023).
- Xu, F.; Nash, N.; Whitmarsh, L. Big data or small data? A methodological review of sustainable tourism. J. Sustain. Tour. 2019, 28, 144–163. [Google Scholar] [CrossRef]
- Furlow, N. The New Brand Spirit: How Communicating Sustainability Builds Brands, Reputations and Profits. J. Prod. Brand. Manag. 2014, 23, 376–377. [Google Scholar] [CrossRef]
- Torres-Moraga, E.I.; Alonso-Dos-Santos, M.; Quezada Arboleda, D.; Carvajal-Trujillo, E. The role of experience and trustworthiness on perception sustainable touristic destinations. J. Hosp. Tour. Manag. 2021, 49, 471–480. [Google Scholar] [CrossRef]
- Mathew, P.V.; Sreejesh, S. Impact of responsible tourism on destination sustainability and quality of life of community in tourism destinations. J. Hosp. Tour. Manag. 2017, 31, 83–89. [Google Scholar] [CrossRef]
- Martínez, P.L.; Pérez, A.; Rodríguez del Bosque, I. Measuring Corporate Social Responsibility in tourism: Development and validation of an efficient measurement scale in the hospitality industry. J. Travel Tour. Mark. 2013, 30, 365–385. [Google Scholar] [CrossRef]
- Bi, J.; Liu, Y.; Fan, Z.; Cambria, E. Modelling customer satisfaction from online reviews using ensemble neural network and effect-based Kano model. Int. J. Prod. Res. 2019, 57, 7068–7088. [Google Scholar] [CrossRef]
- Guo, Y.; Barnes, S.J.; Jia, Q. Mining meaning from online ratings and reviews: Tourist satisfaction analysis using latent dirichlet allocation. Tour. Manag. 2017, 59, 467–483. [Google Scholar] [CrossRef]
- Ding, K.; Choo, W.C.; Ng, K.Y.; Ng, S.I. Employing structural topic modelling to explore perceived service quality attributes in Airbnb accommodation. Int. J. Hosp. Manag. 2020, 91, 102676. [Google Scholar] [CrossRef]
- Hu, N.; Zhang, T.; Gao, B.; Bose, I. What do hotel customers complain about? Text analysis using structural topic model. Tour. Manag. 2019, 72, 417–426. [Google Scholar] [CrossRef]
- Kuhn, K. Using structural topic modeling to identify latent topics and trends in aviation incident reports. Transp. Res. Part C Emerg. Technol. 2018, 87, 105–122. [Google Scholar] [CrossRef]
- Roberts, M.E.; Stewart, B.M.; Tingley, D. stm: An R Package for Structural Topic Models. J. Stat. Softw. 2019, 91, 1–40. [Google Scholar] [CrossRef]
- Schmiedel, T.; Müller, O.; vom Brocke, J. Topic Modeling as a Strategy of Inquiry in Organizational Research: A Tutorial with an Application Example on Organizational Culture. Organ. Res. Methods 2019, 22, 941–968. [Google Scholar] [CrossRef]
- Newman, D.; Asuncion, A.; Smyth, P.; Welling, M. Distributed inference for latent dirichlet allocation. In Proceedings of the 20th International Conference on Neural Information Processing Systems, Vancouver, BC, Canada, 3–6 December 2007; Curran Associates Inc.: Red Hook, NY, USA, 2007; pp. 1081–1088. [Google Scholar]
- Xue, L.; Leung, X.Y.; Ma, S. What makes a good “guest”: Evidence from Airbnb hosts’ reviews. Ann. Tour. Res. 2022, 95, 103426. [Google Scholar] [CrossRef]
- Luo, Y.; He, J.; Mou, Y.; Wang, J.; Liu, T. Exploring China’s 5A global geoparks through online tourism reviews: A mining model based on machine learning approach. Tour. Manag. Perspect. 2021, 37, 100769. [Google Scholar] [CrossRef]
- Büschken, J.; Allenby, G.M. Sentence-Based Text Analysis for Customer Reviews. Mark. Sci. 2016, 35, 953–975. [Google Scholar] [CrossRef]
- Hofstede Insights. National Culture. 2021. Available online: https://hi.hofstede-insights.com/national-culture (accessed on 2 January 2023).
- Hsu, C.H.C.; Huang, S. Reconfiguring Chinese cultural values and their tourism implications. Tour. Manag. 2016, 54, 230–242. [Google Scholar] [CrossRef]
- Reisinger, Y.; Turner, L. Cultural Differences between Mandarin-Speaking Tourists and Australian Hosts and Their Impact on Cross-Cultural Tourist-Host Interaction. J. Bus. Res. 1998, 42, 175–187. [Google Scholar] [CrossRef]


Disclaimer/Publisher’s Note: The statements, opinions and data contained in all publications are solely those of the individual author(s) and contributor(s) and not of MDPI and/or the editor(s). MDPI and/or the editor(s) disclaim responsibility for any injury to people or property resulting from any ideas, methods, instructions or products referred to in the content. |
© 2023 by the authors. Licensee MDPI, Basel, Switzerland. This article is an open access article distributed under the terms and conditions of the Creative Commons Attribution (CC BY) license (https://creativecommons.org/licenses/by/4.0/).