Abstract
Urbanization and continued population growth have had a major impact on the urban environment. Many buildings lack close regional and biomimetic characteristics during the rapid generation process, making it impossible to achieve ecological sustainability. This article took the rehabilitation center of Jinghong Dai Cultural Park in Yunnan as an example for research, intending to highlight regional characteristics and change the current severely homogenized urban style. Visual on-site environmental analysis was performed through Arc GIS, CFD-phoenics, and sketchup, and the site form planning of ecological buildings from the perspective of “regional characteristics” was explored. Morphological data of local buildings and regional plants were collected, plant growth patterns were analyzed in Grasshopper software, and skins were generated from the perspective of “biomimetic properties”, and we combined the planning form with the skin to form the overall regional architectural design. The design approach of multi-parameter software combinations brings a richer expression morphologically and distinguishes the more homogeneous stereotypical image of the city, which is of great significance and value in expanding the form of architectural design. The spatial form of the site layout and the phenology of the native plants respect the original natural environment and create a symbiosis between man and nature.
1. Introduction
In the past decade, China’s cities and towns have expanded rapidly. Spatial differences in the practice of land urbanization in China are significant, and the rough development of land urbanization is a serious problem [1]. The development of buildings in areas with low economic value lacks ecological sustainability, and the design methods of ecological buildings lack rigorous logical derivation. The short design cycle makes the design results too superficial, and the logical derivation process can be influenced by individuals and investors. Secondly, the pursuit of new forms and new technologies to form the “Influencial Online Architecture” lacks creative significance [2]. Many building skins are quickly generated using parametric software, and their operational structure or generation process lacks consideration for regional characteristics. There is also a lack of passive energy efficiency considerations in the environmental energy use of the building site, with different impacts through the microclimate environment inside and outside the building [3]. This requires the combination of ArcGIS and parameterized software to generate local ecological buildings and make innovative changes.
The use of GIS for ecological building generation was studied earlier in Canada and the United States. In the 1960s, the famous landscape architect Ian McHarg mentioned the analysis method of Graphic Overlay in his book “Design Following Nature” [4]. McHarg proposed that form should not only follow the function, but it should also respect the natural environment in which it is placed. Roger Tomlinson created the first computerized geographic information system in the 1960s while working for the Canadian government—a geographic database still used today by municipalities across Canada for land planning [5]. Currently, GIS is not an independent design tool. Its role in the analysis of the early stages of planning is more accurate and rapid than traditional analysis methods, providing objective reference and basis for the next step of planning and design [6]. For example, it has been applied to the analysis of the suitability of early buildings, the division of environmental corridors, the analysis of landscape lines of sight and horizons, as well as the analysis of the service radius of urban green space and the accessibility of residents [7]. GIS also plays a role in the protection and restoration of ancient cities, such as the 2019 planning of the ancient city of Brindisi, Italy [8]. GIS created a visual analysis map to control the location of new buildings, to control the relationship between underground pipelines, and so on. With the advancement of GIS-based data technology and computing resources, parameterized software is becoming increasingly comprehensive. Particularly regarding Building Information Modeling (BIM) for addressing building data needs and Computational Fluid Dynamics (CFD) for evaluating the outdoor environment of buildings, numerical simulations are becoming increasingly popular, and the choice of CFD models and new technologies can meet the needs of different building scenario simulations [9].This also requires designers to master more software for collaboration to improve the accuracy, logic, and consistency of the design process.
This article aimed to conduct research and analysis on the geographic information of vacation centers in Jinghong City, Yunnan Province, and to deduce a regional architectural design method for collaborative design using multiple parameterized software. One of its innovations is the use of newer parametric software to create parametric images, combined with parametric plant morphology simulations to create a creative approach to regional architectural design. The designer selectively overlays the environmental data maps to obtain a “composite map”, sorting out the site context and the generation of qualifying conditions and reflecting the “locality” data analysis in the site planning area and the general form of the buildings. The local plant community is extracted and the texture similar to the local plant growth is simulated in Rhino’s Grasshopper plug-in, and the texture is then attached to the building form to form a bionomic building that fits the local atmosphere [10]. The regional architectural design is deduced through the grasp of these immediate, stimulating, and opportunistic features [11]. The second innovative point is to change the traditional sulfuric acid paper overlay design to a parameter graph hand-drawn analysis and derivation method that combines parameter overlay image analysis and designer hand drawn analysis. It not only retains the mathematical logic of design, but it also retains the steps of designers’ perceptual beautification of design.
Overall, the combination of this region and biomimetic analysis method is beneficial for improving the space of regions with severe homogenization. The form and surface of bionic architecture increase the interaction between humans and nature and enhance the fun of living activities [12]. It is not only a technical means of stacking green buildings, but it is also a parameterized design method for “ecological buildings” based on the meteorological conditions of specific regions [13]. The framework is based on a design method that combines parametric thinking and geographic information systems. It is a derivation method of architectural form and skin that conforms to the regional environment, providing new thinking for achieving the sustainable development of ecological buildings [14]. Parametric intervention has changed the traditional thinking mode of building skin design. The combination method of different parameterized software solves the lack of innovation in traditional skin and utilizes bionic parameter technology to make the skin visualization process accurate and rapid. It is advantageous to form morphological buildings and regional skins of different natural space types, which is a sustainable design approach that conforms to nature.
2. Literature Review
2.1. Research on the Involvement of Parameterized Software in Ecological Building Design
Urbanization has become a trend in developed or developing countries, coupled with the continuous growth of population demand, which has a significant impact on the urban environment [15]. Nowadays, high-rise buildings are constantly emerging in Chinese cities, and the degree of integration between buildings and the environment is still insufficient. Coupled with the scarcity of land resources in China’s core cities, the three-dimensional greening system of high-rise buildings is rapidly developing [16]. For example, the three-dimensional garden and intensive land use landscape design in Singapore have made the landscape greening reach 110% [17]. It can be seen that the future integration and symbiosis of ecotype buildings is an inevitable trend. Various parameterized software builds the logical relationship between the site environment and buildings, which can better provide convenient calculation, evaluation, and planning for ecological building design.
In the 1960s, Italian American architect Paola Soleri proposed the famous new concept of “ecological architecture”, and designers began to integrate landscape with architecture [18]. In 1963, Canadian surveyor Roger F. Tomlinson first proposed the GIS system, witnessing the world’s first Canadian Geographic Information System (CCIS) [19]. In the 1970s, Ian Lennox McHarg, the father of ecological design in the UK, advocated for understanding and respecting nature. His book emphasized the inseparable relationship between humans and nature and described development in moderation based on the reconstruction of ecological values [20]. The book Solar Radiation, Wind, and Natural Light: Architectural Design Strategies illustrates the relationship between building form and energy and provides a detailed list of how buildings can be adapted to incorporate natural light, wind, and solar radiation from macroscopic master planning to microscopic building detailing, providing designers with design strategies for integrating buildings with nature [21]. From the 1980s to the 1990s, GIS technology began to develop, and its early application stage was mainly to digitize maps and other spatial information to help designers better understand the geographical location and surrounding environment of the building site [22]. From 1990 to 2000, GIS was used for data analysis and decision support in ecological building design. From 2000 to 2010, web-based GIS applications were used in ecological building design to achieve interactive data analysis and visualization. Today, GIS technology has entered the stage of visual application. With the development of VR (Virtual Reality) and AR (Augmented Reality) technologies, 2D or 3D visualization of precipitation, dominant wind direction, sunlight images, slope changes, and other suitability and feasibility analyses have been formed [23].
In actual projects, GIS was used to analyze the risk of surface water flooding in the city of Ghent to plan green infrastructure to reduce high-risk areas [24]. The Deira Enrichment project, a sustainable urban regeneration project in Dubai, plans to use Analytic Hierarchy Process (AHP-supported by Geographic Information Systems) to improve the outdated physical environment and conduct comprehensive urban regeneration in economic, social, and cultural aspects [25]. The Analytic Hierarchy Process (AHP) of GIS was used to initially produce hazard assessment maps for landslides, floods, and earthquakes, which were subsequently combined into a single multi-hazard map, with the computed multi-hazard maps corresponding to potential urban development suitability maps for the study area, a multi-hazard assessment modeling tool designed to mitigate the impacts of future natural hazards [26]. In academic research, parameterized software is used to plan and layout the site. Using GIS to select sites for medical waste landfills from a sustainability perspective and prioritizing them using G-MARCOS to choose the best alternative location solves a complex decision problem in the field of urban and social planning [27]. Using building energy and computational fluid dynamic (CFD) simulations to analyze how the green space layout affects the outdoor thermal environment, the optimal green space layout within a community can reduce maximum temperatures by 0.36 degrees Celsius [28]. Cho, Gayoung discussed in their paper that the parameterized double-Skin Facade wall design provides a way for high-rise buildings to use natural ventilation, and they evaluated natural ventilation performance through CFD simulation [29]. It can be seen that a parameterized software collaboration such as GIS can provide a large amount of visual data for the site environment during the design process. GIS extracts elements and reorganizes the presentation in site environmental planning, discovering the potential of the site through overlapping at different levels, capturing subtle differences, and reconstructing a perceptible spatial experience. It can help designers keenly capture new connections between people and the environment. Both architectural form and skin design have evolved from the previous “iconic internet celebrity” to the strategy of “ecological integration” and “human nature”.
Currently, the application of ecological architectural design in GIS in China is gradually increasing with the demand, but there is the problem of insufficient accuracy [18]. This requires a collaborative and complementary combination design pattern among multiple software to improve the accuracy of the design process. On the other hand, some projects only meet the requirements of cost control and maximizing benefits. This architectural design has become focused only on the results and has neglected the importance of the process. In the later stage of plan adjustment, the importance of site analysis results and environmental sustainability have gradually been ignored, leading to a lack of consistency in the implementation phase.
2.2. Research on Parametric Ecological Building Skin
Long before the parametric development of Arc GIS, designers began to simulate biological morphology and carried out bionic design on the structural composition and force relationship of organisms [30]. The German architectural theorist Semper proposed two basic archetypes of architecture, wall and roof, which correspond to two basic motives: enclosure and shelter [31]. The bionic roof skin from the original shed to the current streamline building is actually a transition from functionality to complexity [32]. It can be said that the bionic form of architectural skin reflects the sustainable external appearance of architectural form, especially considering the premise of ecological protection, which is that it is important for buildings to achieve symbiosis with the natural environment [33].
In the developed countries of Europe and America, the theory and practice of ecological architecture are very mature. Its characteristic lies in the intervention of high technology and the establishment of a complete ecological evaluation system. In 1980, Peter Pearce introduced the potential and advantages of molecular, crystalline, and polyhedral structural forms in nature for use in architectural form design from a bionic perspective [34]. In 1990, Aristid Lindenmayer proposed the L-system bionic algorithm for modeling plant shapes and developmental processes, which can be used to generate fractal structures with natural similarities and is widely used in the design of structural forms for buildings [35]. In terms of academic research, the theory of fractals and stacking is discussed in the PhD thesis “Building Morphogenesis Based on Fractal Theory”, which forms four types of natural biological relationships between branching systems, fractal mosaics, particle systems, and fractal aggregations, allowing the generated building group forms, single spaces, and skins to all exhibit morphological relationships that connect to the fractal rules of nature [36]. The study of contemporary complex architectural form design reveals the inherent natural ecological logic system at the level of form design through the analysis of “emergent construction and topological deformation” [37]. The study of bionic engineering in spatial structures discusses the advantages and roles of biological form rules in improving the performance of building spatial structures by analyzing the formal characteristics of bionic prototypes [38]. The inevitable ambivalence between geo-environmental climatic conditions and the building envelope, mentioned in “Bionic, Dynamic, Sustainable—A Study of Dynamic Building Skins Based on Bioclimatic Adaptation”, has led us to constantly study and explore the relationship between building skins and environmental climatic elements [39]. The biggest difference between ecological architecture and traditional architecture is that ecological architecture is an organic part of the natural ecological cycle, which requires designers to combine architecture and ecology closely [40]. In addition, the study of ecological architecture is more meaningful only when large-scale ecological system research is carried out across the environmental space of specific buildings [41].
Currently, there are many applications of parameterized skins in ecological architectural design in China, but the combination of parameterized software is relatively single. Bionic skin lacks a high degree of integration with the local environment. Since the local plant communities fit the local light, wind, vertical, rain, and other factors, we studied their growth patterns and growth relationships to summarize their morphological characteristics, and we referred to the morphological characteristics of real plant growth relationships in the design process. By grasping the morphological characteristics of the regional plants, we created the final design of a simulated phenology that simulates the morphology of the local plant communities. Compared with traditional design ideas, this method based on computer deduction increases the speed of design and makes the presentation of bionic skin become visual [42].
2.3. Purpose and Significance of the Study
In general, in view of the lack of combination of regionalism and imitation in Chinese local architecture, the analysis of light, radiation, thermal comfort, air flow, and sound attenuation can be brought into the architectural form composition [43]. The design method of multiple parametric software combinations can bring richer expressions for building form generation and skin design, which is of great value for building form design. This method is also applicable to various types of site deduction, so that the parameter skin is integrated into natural information and mathematical logical thinking, which has a strong parallel that is regional and sustainable. The biggest advantage over traditional design methods is the ability to break the inherent “hegemony of form” in the mind to achieve results beyond imagination [44].
In terms of bionic morphology, parametric combination design promotes the innovative design of bionic form, highlighting the improvement of regional space and the current unified urban style. The GIS image superposition method maps the characteristics of the site to the combination of architectural space, and the study of regional plant morphology integrates the bionic form of plants into the architectural skin, which not only improves the degree of integration between the architecture and environment, but it also increases the interaction between the architectural form and humans. In the academic sense, it provides a new case and research starting point for parameterization and bionic morphology by summarizing the characteristics of the architectural skin of regional form. This study enriches the theoretical research on the relationship between plant form and environment in bionic building skin design, and it is of great significance to expand the form of architectural design.
3. Materials and Methods
3.1. Analysis of Site Elevation, Slope, and Water Pattern by ArcGIS Software
Geographical architectural design first requires the designer to collect and analyze information about the local regional culture and geographical environment and to take meaningful exploration, discovery, analysis, and verification of the existing image information of the site. GIS technology integrates the unique visual effect of maps with the statistical analysis of geographic information to understand the site environment in a more intuitive and immersive way [45]. This technology fuses the building model and site terrain data in real time and optimizes the scheme through interactive design. The elevation, slope direction, gradient, and water pattern of the site are detailed by ArcGIS, which can produce a series of image data. First of all, we downloaded the DEM data of the site using bigemap GIS online (Figure 1), added the DEM data of the site to ArcGIS software, selected the slope analysis in Spatial Analysis tools, and pasted the elevation data into the raster data column to generate the slope analysis map, and we added the scale and legend in it. The slope data map can be generated by finding the slope analysis in Spatial Analysis tools in ArcGIS (Figure 1), and the midrange value of the classification can be adjusted according to the designer’s needs. Since the downloaded DEM data carry elevation information, you can directly modify the color in the layer properties.
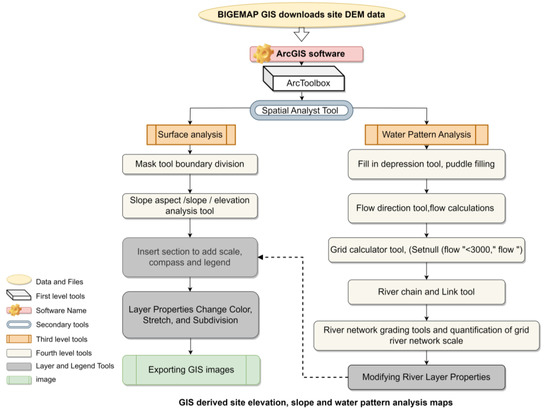
Figure 1.
The generation process of GIS site elevation and slope and water pattern image analysis, taking the resort area of Jinghong City, Yunnan Province, as an example.
In the water ripple analysis map production (Figure 1), it shows the first puddle filling, then in tools, the toolbar hydrological analysis is used to find the flow tool, the second step toolbar is used for flow calculations, the third step in the toolbar is used to search for raster calculator, and one can double-click the flow in the conditional analysis (SetNull (flow “<3000”, flow) to calculate over 3000 times the value of the river. The fourth step is to link the rivers and then classify the river network, and the fifth step is to quantify the raster river network scale. Finally, one can click on the river layer properties to modify the symbol system category to select a unique value and the field selection grid-code. The following selection can add all a pair of symbol values, and one can choose a different thickness of the line for the formation of a very clear river analysis map.
3.2. Analysis of Building Velocity Pressure and Wind Speed in the Site by Phoenics Software
The focus of wind environment research is on wind speed and velocity pressure fields. The existing dense high-rise buildings on the site can cause a series of natural environmental problems, among which is that the deterioration of the outdoor wind environment affects the environment of new buildings [46]. GIS technology is used to model the urban area in 3D and to construct an accurate terrain simulation based on a digital orthophoto and digital elevation model. the 3D building model is combined with the terrain information to construct a 3D visualization scene, and finally, the wind environment of the study area is numerically simulated and analyzed [47]. City Engine creates urban environments from scratch based on a hierarchy of comprehensible rules that can be extended according to the user’s needs [48]. Compared with previous studies, the topographic information is added to the building model, and GIS technology is used to introduce the building space and attribute information into the 3D model in order to obtain more scientific and accurate results in the numerical simulation. At present, there are relatively good CFD software such as Fluent, CFX, Phoenix, and Star CD. This article used Phoenix for wind environment simulation. PHOENICS is the earliest CFD software developed by CHAM, a company founded by Professor Brian Spalding in the UK. PHOENICS is the first commercial software of computational fluid dynamics, which has been developed and matured. It can output various indicators of wind environment, realize the simulation of various shape models, integrate green plant modules, and set its own mesh generation interface, which is more convenient than other CFD simulation software [49]. Today, various CFD packages are available for outdoor wind flow simulation in urban areas. In this study, CFD-Phoenics was selected for the simulation of outdoor wind environment based on the characteristics of the building complex, where a large area of the Yunnan Resort is located, based on the software’s universality, multi-model selectivity, ease of grid division, computational efficiency, and stability of results [50].
The following is the process of velocity pressure analysis map generation (Figure 2b). The base map data contain a digital terrain model (DTM), a digital orthophoto (DOM), and 2D GIS data. For accurate modeling, CAD data were provided by the design and planning institute. The site was first accurately modeled by pulling the site’s high-rise buildings to a set height of 75 M. The site buildings were saved separately and exported as STL 3D files. Before importing the building model data into the Phoenics software, specific attributes were added to the GIS data. The location of this case is Jinghong City, Yunnan Province, and monsoon data were imported from the official website of the Chinese weather station. The dominant wind direction of the site is southeast and southwest, and here, the southwest wind in summer was selected for demonstration, with an average summer temperature of 19 degrees and a maximum wind speed of 5.2 m/s. After that, the subdivision of the building site, the site’s Y axis, was set to (Y = 500 M), the site’s X axis was set to (X = 200 M), and the whole building group was wrapped in the calculation, and the building center subdivision was set to 10 m a subdivision line (i.e., 500 M = 50 subdivision lines). Each direction required changing the automatic setting to manual and then resetting the value of free all, modifying the numbers of cells and power based on the length value. The cells ensure that the center value is fine, the values on both sides are smaller, and the cells are relaxed. The power center is 1, and the values on both sides are positive and negative (the positive and negative signs indicate the direction of change in the grid, |power| > 1 indicates that the grid is gradually getting larger, |power| < 1 indicates that the grid is gradually getting smaller; the usual positive value is 1.2, and the negative value was set to −1.2). The same applies to positive numbers. After setting the subdivision, a parallel solver was used for velocity pressure simulation. The larger the number of processes selected, the more refined the simulation. The wind speed distribution cloud and vector map of pedestrian height (Z = 1.5 M) was obtained through wind environment simulation and generate a VR Viewer was generated.
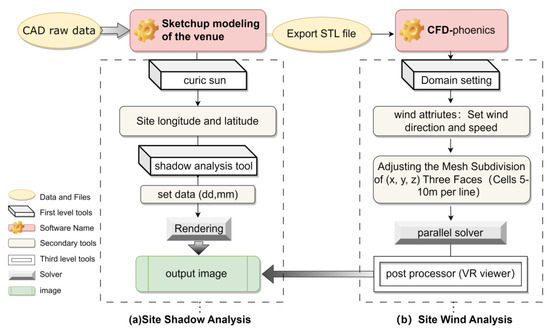
Figure 2.
(a) Light and shadow analysis; (b) the generation process of site velocity pressure analysis, taking the Jinghong Resort in Yunnan Province as an example.
3.3. Analysis of Building Shadows Using SketchUp Plugin Shadow Analysis
Daylighting analysis usually refers to the use of analysis software to simulate and calculate the sunlight impact or sunlight hours of a certain type of building on a specified date (Figure 2a). In the design phase, for high-rise buildings within the site, SketchUp plugin shadow analysis and Photoshop (hereinafter referred to as Ps) software were used for sunlight analysis. Sketch Up Rizhao Master Introduction Sketch Up Rizhao Master was developed under the leadership of Dr. Wang Shaoning and has been purchased by multiple well-known design institutions both domestically and internationally [51]. It has three core advantages: accuracy, speed, and intuition. The analysis results are accurate and in line with China’s building sunlight analysis standards. Before running Shadow Analysis for Sketch Up, the “Style” panel of Sketch Up needs entered and the “Hidden Line” mode in “Preset Style” needs selected. Firstly, Google Earth was used to find the geographic coordinates of the site, and then they were entered in SU. Clicking on “Window”, “Model Information”, and, in the dialog box, the “Manual Location Setting” button in “Geographic Location” let us set the geographic location to Jinghong City, Yunnan. The sunshine analysis on the winter solstice generally took 6 h, from 9 to 15 o’clock; on severely cold days, it lasted for 8 h, from 8 to 16 o’clock. Of course, the sunshine analysis on the summer solstice can be 11 h, from 7 to 18 o’clock. We exported a lighting analysis chart based on adjusting the date and subdivision accuracy of the venue.
3.4. Overlapping Analysis Maps to Form a “Regional Characteristics” Form Planning
In the stage of site form planning, we used various software to analyze site data and enhance the “regional characteristics” site form design by overlaying image data through reasonable data analysis (Table 1). The GIS data were used to integrate the slope and water texture of the site to reduce the amount of excavation at the slope of the site and to plan the location of natural water storage in the site through natural water texture. Due to the existence of existing high-rise buildings in some sites, the wind pressure image of the perennial dominant wind direction was used to divide the perennial windward side of the division line, and the area with a wind speed of 3–5 m/s was used as the windward area. The natural ventilation design was carried out according to the site environment in the later architectural design, so that the building form can face the windward area more often and more windows can be opened in the area where the wind speed is more stable and kept at 3–5 m/s. The area with less wind speed was designed as a public space to maintain the stability of space. Using the light shadow map, we divided the site by the surrounding building shadow cover of the area in 5 h in the building’s light location and landscape site activity space set to avoid the longer shadow area. The area with little shadow market was divided, and these areas can be reasonably arranged for building lighted surface and a public activity area.

Table 1.
Threshold values for suitable design zoning.
In the specific planning stage, as there are already high-rise buildings in the resort, shadow analysis and velocity pressure analysis were needed to ensure that the new public service buildings avoid some of the drawbacks of the existing buildings. We divided areas that are not conducive to site factors into red areas and selected areas that utilize site design conditions as blue (Figure 3). By overlaying the site image data, the site planning form was naturally generated. According to the slope and slope direction, the blue flat designable area and the red excavation volume area were cut out. Through the GIS analysis of the flow rate greater than 3000 water pattern situation, the water pattern texture was extracted; in the later site design, natural water body preservation was carried out. This site form has unique limited design conditions, and the zoning of the site and the building form alignment compounded the regional climate. The division area of the site’s GIS image formed effective visual information, which helps the architects to form a visual memory of the base conditions of the site; to grasp the main orientation of the building and the building skin opening to form an effective light and ventilation area according to the wind direction and wind pressure, sun angle and light duration; and to grasp control of the natural water system of the site according to the slope direction, slope, mountain catchment, and rainfall runoff to form a good microclimate circulation environmental space. We divided the shaded area with a length of 5 h on the lighting analysis map, distinguished between areas with sufficient lighting and areas with weak lighting on the site (Figure 4), and tried to set the shape of public buildings in blue areas with sufficient lighting on the site. On the wind speed chart, the main windward side of the building was divided into areas with high wind speeds to ensure good ventilation for newly built public buildings (Figure 4). Areas with low wind speeds were set up with quiet rest areas around the building.
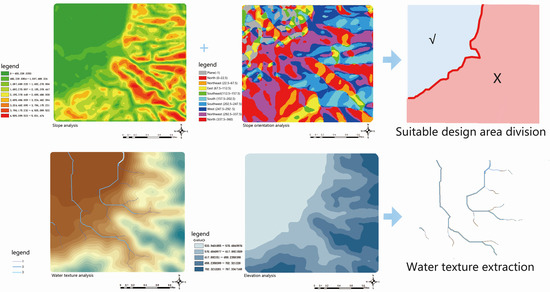
Figure 3.
The site leveling area was divided according to the slope direction to reduce excavation and to preserve the natural water system of the site according to the water flow pattern.
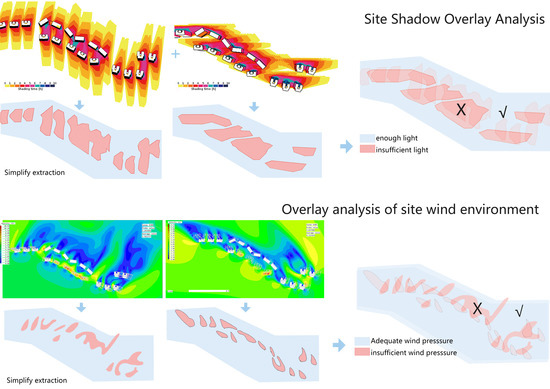
Figure 4.
Shadow areas and light areas were divided based on lighting, and velocity pressure maps were used to divide the site into areas with moderate wind speed and areas without wind.
3.5. Plant Morphology and Localized Architectural Symbols Generate “Bionic Property” Exterior Skins
Designers need to select regional plants for research, and the selected plants must already have a stable survival mode in the local growth environment and reach a certain scale in quantity. This can be conducted by classifying the morphology of local plants, grasping the unique morphological characteristics of their growth, and analyzing and summarizing their general morphological patterns from a morphological perspective. Its growth form or pattern were summarized into the skin characteristics of regional architecture, the shape generation of the building skin was logically deduced (Figure 5), and the generation in Rhinoceros’ Grasshopper software (Rhino7) was generated.
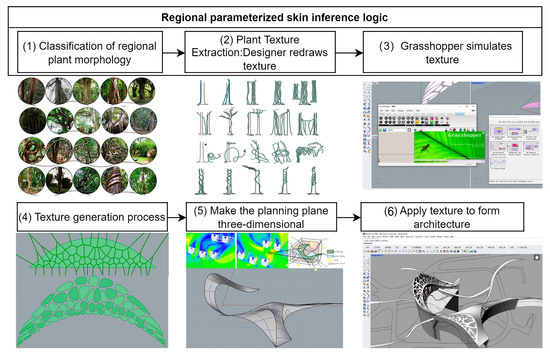
Figure 5.
Regional parameterized skin inference logic.
The specific process of generating the “bionic” outer skin needed to first classify the local plant morphology. The growth morphology of plants was visualized, and their changes in locations with significant environmental differences were summarized. For example, for plants with sufficient light and moderate wind speeds of 3–5 m/s for a full day of 5 h, the growth type is A; for areas with general 2–4 h of light and low wind speeds of 1–2 m/s, the growth type is B; for areas with less than 1 h of light and no wind, the growth type is C; and for areas with harsh environments, the growth type is D. These require designers to conduct image analysis through on-site research and plant photos, which has a certain degree of subjectivity. Because the growth logic of biomimetic building skins corresponds to the growth logic of local plants, areas with more lighting, areas with high and low wind speeds, and natural catchment areas of the site have been identified in the “in situ” form planning analysis. The pattern of plant growth types was mapped to the site zoning. The window opening shape in areas with sufficient lighting can simulate the texture of Class A plants, and different types of textures can be introduced into different environmental areas to attach to the building surface for opening, lighting, and ventilation design. Taking the Yunnan Jinghong Resort Health Center project as an example, four types of Yunnan vine winding trees were investigated and summarized as four growth modes, ABCD. They were simulated and modeled in the rhinoceros grasshopper, and their growth forms were digitally simulated. After simulation, these textures corresponded to different areas of the site, making the building biomimetic in form and compatible with the natural environment of the site in terms of lighting, ventilation, and other physical environments.
Finally, through the analysis of the overall scheme and parametric adjustment to determine the innovative sustainable regional building skin, a set of effective bionic skin generation logic was formed, ecological sustainable bionic texture form was extracted, and innovative design techniques were formed. In the field of architectural design, the design method based on the combination of parameterized thinking and environmental information system is a kind of building skin deduction method based on data and is suitable for the local environment.
3.6. Establish Parameterized Skin Thinking
The key to bionic architectural design lies in how architects can better find natural laws that are consistent with their design goals, how to establish the relationship between architecture and natural law reference prototypes, and how to translate these laws into algorithmic language. Algorithms are visualized to form an effective parametric graphic language, which is very important for design thinking and communication between designers. The design based on parameterized thinking is mainly based on the designer to establish the logical relationship between the design parameters and to rationally deal with the relationship between the parameters, according to logic rules during the algorithm [52]. In a paper by Cao Wuyang from Beijing University of Technology on the research and application of product parametric design, it was mentioned that compared to traditional design parametric thinking, it no longer only depends on the personal experience and subjective judgment of designers [30].
Parametric thinking changes the design process and methods, and the characteristics of parametric skin are mainly reflected in four stages. Firstly, in the initial stage of design, designers mainly collect and organize parameters based on parametric thinking and establish relationships between them, combining the parameter relationships according to certain logic. During the design derivation stage, parametric images and data information dominate the design analysis process, which is not influenced by stereotypes. In the design evaluation process, parametric thinking creation can modify the parameters that affect the skin during the derivation process based on the completed fit, which also reduces the workload and avoids the cumbersome pattern of “pulling the trigger and moving the whole body” in traditional design. During the design completion phase, the overall design echoes the relationship between the initial parameters, forming an organic, mutually compatible, and natural field architecture (Figure 6).
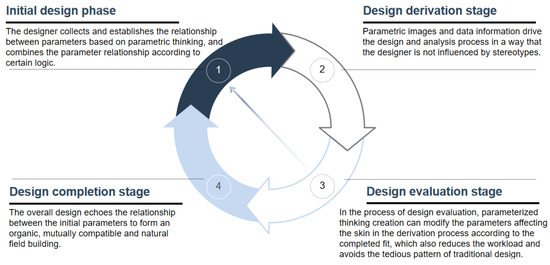
Figure 6.
Parametric epidermal thinking.
3.7. Project Location and Characteristics
The project is located in Jinghong City, Xishuangbanna Dai Autonomous Prefecture, Yunnan Province, China (Figure 7). The site is located in the Xishuangbanna Tourist Resort in the southeast of the city. It is planned to be the core of the residential economic circle, with good future development. Jinghong City is warm and humid all year round, with distinct dry and rainy seasons. It has a tropical and subtropical monsoon climate, and the site is mostly dominated by southwest and southeast winds. The Rainforest Center is located in the southeast corner of the entire site. A portion of the commercial blocks and residential areas have been built in the early stage to the west of the site, and there are five high-rise residential buildings with a height of 75 M around the Rainforest Center, which will have a certain impact on the site design.
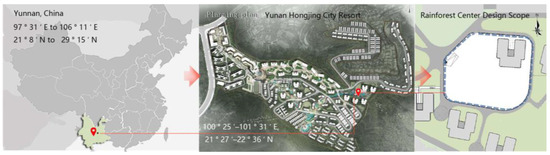
Figure 7.
Yunnan Province, China, Jinghong City, Yunnan Province. Design site for the health and wellness center within the resort.
Yunnan once had an ancient country in its history more than two thousand years ago. It is the ancient Dian Kingdom centered on the Dianchi Lake area. The Ancient Dian Kingdom is famous for its exquisite and peculiar bronze ware with exquisite and rich ornamentation. As the largest freshwater lake in Yunnan, Dianchi Lake regulates the surrounding climate environment and forms this unique primitive forest with the unique mountain forests in Yunnan. Among the local plants, there are water lilies, royal lotuses, orchids, centenarians, tea trees, silver sequoias, camellias, fragrant golden camellias, tung flowers, giant sky trees, tree wrapped trees (rattan wrapped trees), and phoenix flowers. Among the medicinal aromatic forests, there are spices such as sandalwood, cloves, and borneol. This makes Yunnan named “the emerald in the crown of the plant kingdom” (Figure 8).
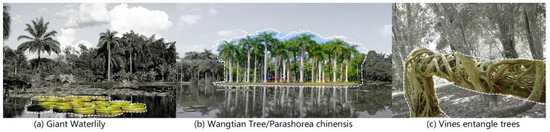
Figure 8.
Native plants in Yunnan: (a) Giant waterlily; (b) Wangtian Tree/Parashorea chinensis; (c) Vines entangle trees.
3.8. Design Goal
According to the site design requirements, as a health and leisure building, it is necessary to create an activity center with Yunnan folk culture in line with local regional characteristics. In terms of the selection of localized architectural symbols, semiotic languages were extracted from the architectural forms and barred structures of local Buddhist buildings, such as arc stacks and surrounding elements from local Buddhist buildings (Figure 9). The passive ecological strategy adopted by traditional Chinese dwellings is similar to the initial concept of GIS. It is a simple and efficient technical approach to coordinate with the environment by using architectural layout, wind direction, sunlight, materials, greening, and energy cycling [53]. Therefore, Dai bamboo building stilt houses were selected for the study, which are characterized by elevated building footprints due to the local humid climate and environment in order to achieve dry interiors. Selecting “Rattan Wrapped Tree” as the theme from the characteristic plants of Xishuangbanna in Yunnan can make use of the cultural characteristics of the rainforest in Xishuangbanna to create a healthy resort for the rainforest with both form and spirit. The overall planning and design level creates a sense of “rainforest” ecological nature, constituting a vertical system of symbiosis between native plants and buildings. The integration and symbiosis of roof greening and building skin form a sustainable “regional ecological building skin” system. “Rattan entangled tree” accounts for a large proportion of native plants, and this plant community can actually be regarded as a kind of natural micro-architecture; they adapt to the local natural environment with vigorous growth; thus, it is of great significance to study the growth form of vines.
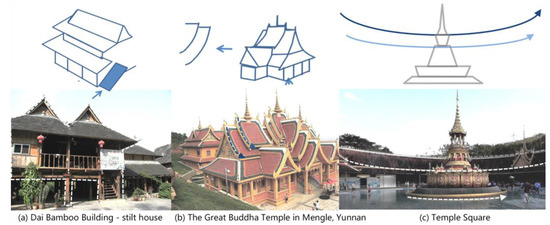
Figure 9.
Regional architectural symbols: (a) Dai bamboo building—stilt house; (b) The Great Buddha Temple in Mengle, Yunnan; (c) Temple Square.
This study hoped that this symbiotic state can organically connect people with nature and cities. Through the image integration of the growth morphology of rattan trees in different environments, the growth morphology data were formed. These form data were combined with the environmental data of the site to design an architectural corridor and site texture in the form of vines and trees on the basis of data. These form data were combined with the environmental data of the site to design an architectural corridor and site texture based on the form of vines and trees. This corridor and facial texture merged to form a unique rainforest center that connects the city and nature, with multiple activities and microclimate regulation. In terms of traffic, the entrance and exit of the site should be connected to various blocks, and the location of high-rise buildings should be considered to press the site. Reasonable road dredging should be conducted. The functional division of people’s behavior habits and psychological analysis site, including entrance space, children’s activities, hydrophilic experience area, plant science popularization area, rest club area, and hot spring area, should also be conducted. In terms of texture, the selection of local wood, stone, and plants should be considered to create a place in line with local cultural characteristics and folk customs.
4. Results
4.1. Analyzing Site Characteristics Using Parameter Image Data
4.1.1. GIS Water Pattern Analysis of Rainforest Central Site
Xishuangbanna is located on the southwest border of Yunnan, which is the frontier zone affected by typhoons. Rainstorms have become the most serious disaster weather in the region. Affected by the terrain conditions dominated by mountains and tropical monsoon climate conditions, this area has abundant rainfall, which can only be divided into dry season and rainy season in a year. The site is located in Jingne Township, Jinghong City, central Xishuangbanna, and belongs to the high-value area of rainstorm. According to statistics, about 1/3 of the time between 2008 and 2017 had rainfall, of which nearly half was rainstorms (Figure 10) [54]. The site soil is mainly lateritic red soil and yellow soil, characterized by soft and deep soil layers. Under conditions of high humidity and high temperature, geological disasters such as floods, landslides, and debris flows often occur. Therefore, the analysis of mountain runoff on the site is particularly important.
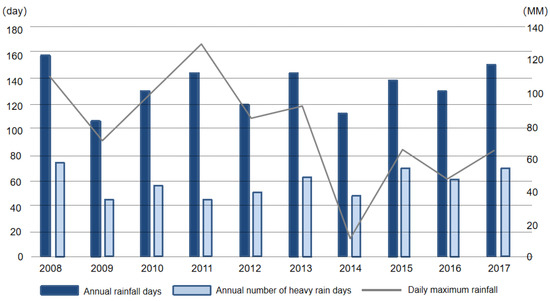
Figure 10.
Rainfall analysis in Yunnan.
According to GIS, the high flow value should be set to (SetNull (flow “<3000”, flow) to calculate more than 3000 times the value of the river and for the analysis of the site water texture muscle situation (Figure 11); it is possible to divide the natural catchment areas in the site. A portion of the mountain in the north of the rainforest center site flows down the valley to merge with the valley in the south. According to the height data, the lowest point of the valley is 581 M, and the highest point is 652 M. The entire site is high in the north and low in the center. The overall terrain presents a state of high in the east and west. The central terrain gradually slows down. According to the maximum rainfall in the rainy season, the surface runoff conforms to the terrain to form a water system from east to west in the middle of the site.

Figure 11.
Analysis of the water texture of the site, highlighting water bodies with a flow rate greater than 3000, and natural water bodies were retained in the later site design.
4.1.2. Sketchup-Shadow Analysis of Rainforest Central Site
Due to the planning of five 75 m super high buildings on the site, this analysis will have a significant impact on the lighting of the rainforest center. The Sketchup model of the venue was exported to a 3D model in STL format and was imported into photonics software for lighting simulation analysis. The sunshine analysis for the winter solstice in Jinghong City, Yunnan Province was generally set to 6 h in the software, from 9 to 15 o’clock; on severely cold days, it lasted for 8 h, from 8 to 16 o’clock. The sunshine analysis on the summer solstice can be 11 h, from 7 to 18 o’clock. The area and time range of the site covered by the shadow of high-rise buildings were analyzed through the shadow analysis plugin of SKETCHUP (Figure 12). On the winter solstice, the shadow coverage area of buildings was relatively large, with north-south shadows covering the entire site. The shadow area of 8–9 h was mostly located behind the building and in the middle of the two buildings. The central diagonal zone only has sufficient light for 4–5 h. There is a strip of 5–6 h of light in the front and rear areas of the building that exceed 80 m. It can be seen that the sufficient light area in the spring and winter shows an S-shaped pattern. On the summer solstice, the shadow coverage area of buildings shows an east–west direction, but it is obvious that there is a 6–7 h banded lighting area horizontally within the site, and the overall average lighting of the site belongs to 4–5 h. The area was divided with more lighting range and less area based on these two extreme realities.
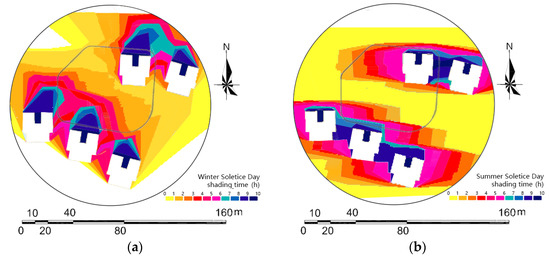
Figure 12.
Analysis of the existing high-rise shadows on the site.: (a) winter solstice shadow analysis; (b) summer solstice shadow analysis.
4.1.3. GIS Slope Analysis of Rainforest Central Site
According to the site elevation image analysis (Figure 13a) and slope image analysis (Figure 13b), the undulating morphology of the terrain is obvious. The budget cost of the building can be better controlled by respecting the vertical conditions of the site and reducing the amount of excavation of the site as much as possible. The overall topography shows a banded valley in the high center at the north and south ends. The low valley, with a C shape, runs through the whole site, with a steep slope in the north and a gentle slope in the south. During the rainy season, a large amount of rain water forms natural pools along the mountains and valleys.
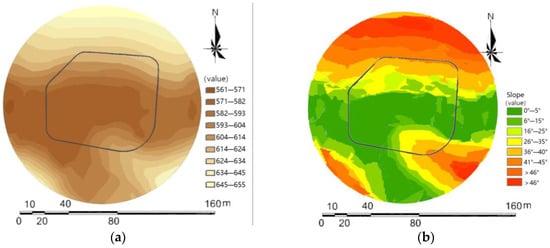
Figure 13.
Site Elevation and Slope Analysis: (a) elevation image data; (b) site slope analysis.
4.1.4. CFD Wind Direction Analysis of Rainforest Central Site
The climate of Yunnan is humid, and many buildings will lead to construction corrosion and other problems because of the reverse tide in summer, which will lead to construction corrosion without timely ventilation. Therefore, wind direction has a great influence on the humidity of the site building; thus, it is necessary to accurately analyze the dominant wind direction of the site. The analysis of the wind direction, wind speed, and area covered continuously is helpful to increase the area of the windward side of the main body in the architectural design. In the area with very low wind speed, it is necessary to use the construction method of local buildings to properly raise the first floor of the building so that the building can have better natural ventilation. Jinghong City is located in southwestern China. According to the geographical information data released by the Communist Party of China Meteorological Station, the dominant wind directions for the site are southeast and southwest winds, with an average annual temperature of 19–21 °C and a maximum wind speed of 5.0–5.5 m/s. Then, the site architectural model was brought into the phoenix software for Velocity Pressure simulation to generate VR Viewer (Figure 14). The dominant wind direction is southwest, and the wind speed behind the buildings on the site is generally 2–3 m/s. The maximum wind speed in the central open space is 3–4 m/s. The wind speed in the surrounding mountains can reach 5 m/s. When the dominant wind direction is southeast, the wind speed behind the buildings on the site is generally 1–2 m/s, and the maximum wind speed in the central open space is 4–5 m/s. According to the partition diagram of Velocity Pressure, the layout of public buildings on the site can face these two wind directions to form a circular wind-receiving architectural form, which increases the area in contact with the dominant wind direction.
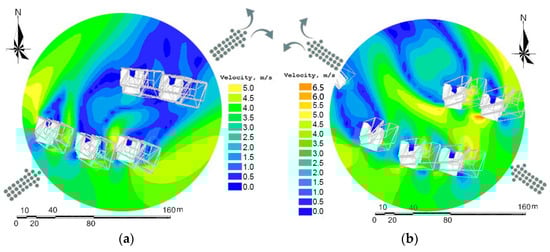
Figure 14.
Analysis of site wind velocity: (a) dominant wind direction of the site: southwest monsoon; (b) southeast monsoon.
4.2. Site Zoning and Layout Based on GIS Parametric Images Composed of “Regional Characteristics”
The Formation of “Regional Characteristics” Site Layout
The overall layout of the site was composed of parameterized image data, taking into account the distribution range of wind direction, wind speed, lighting interval, terrain slope, and site water pattern. These images were analyzed and overlaid to create a clear functional space (Figure 15), using the formed functional zoning of “conforming to nature” and spatial layout of “reducing energy consumption”. The skyline contour of the building changed quite directly, with large scale differences, making it difficult to create a comfortable and friendly scale space for the crowd. The skyline contour of ecological buildings fluctuated in height, and the scale gradually decreased. Combined with the unique landscape plants of the site, it can create a friendly scale atmosphere.
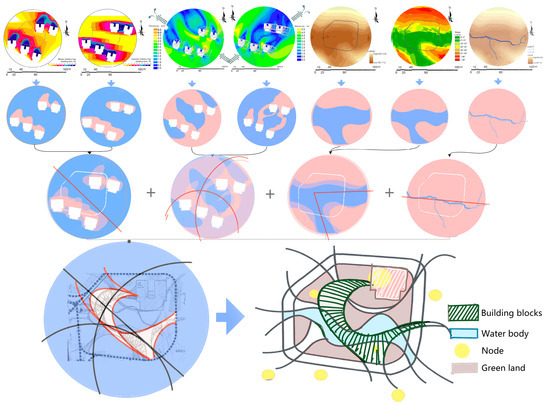
Figure 15.
Based on parameterized images, the main form of the buildings in the site and the form of the ecological water body are segmented.
According to the site water texture analysis, it was concluded that the functional zoning of the site needs to focus on protecting natural water bodies. This natural water system can be repaired as a natural water system. Hydrophilic plants can also be placed according to the final location of the mountain catchment to ensure the natural growth of aquatic species. It was combined into a river landscape, which can regulate the microclimate of the site and carry diverse plants. Through the vertical trimming of the site and the cultivation of aquatic plants, a water system landscape that can both regulate the site’s microclimate and carry diverse plants was formed. The layout of the road can be determined based on the analysis of the water system and the functions and relationships of each functional area. It can be fully considered that the outdoor sewage pipes and rainwater pipes should be laid along the road, making full use of the natural terrain to make it flow to the drainage network. The analysis of terrain in the setting of roads can greatly reduce the amount of filling and excavation in road construction and save construction costs [55]. According to the analysis of the GIS site slope and aspect, in the later sustainable design, this study respected the original landform and utilized the terrain of the site, which is high in the east and low in the west, to make the water body conform to the site elevation difference in a graded pool (Figure 16). Water converges from the southeast of the site and flows into water surfaces with different elevation differences. A large number of hydrophilic plants are planted in the stacked water body, which has a certain purification function. Finally, the mountain water flows out from the west. The purified water will enter the community water system without the operation of manual water pumping machines. The natural water system within the site conforms to the elevation differences to form a superimposed landscape, and the flowing water area also protects the diversity of local aquatic plants. The central water area was jointly constructed to form a micro rainforest center that regulates climate. Such a rainforest center connects modern communities with nature, forming an ecologically sustainable bridge. The overall surrounding building is arranged around the water area so that the activities of the people in the building are carried out around the water area. The water area serves as the center of the venue and also carries the functions of children’s science education and water playing. The surrounding building is convenient for parents.
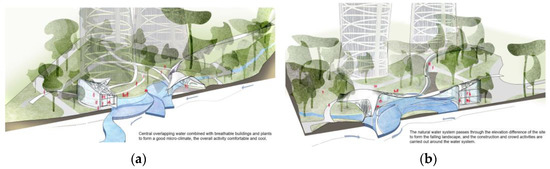
Figure 16.
Analysis of water accumulation in the center of the site: (a) the overlapping landscape can accommodate a variety of aquatic plants for water filtration; (b) site activities revolve around water bodies.
Based on the shadow analysis of the existing high-rise buildings on the site and the analysis of wind speed maps between buildings, areas with more horizontal light-receiving surfaces can be selected in the direction of the building. The overall shape of the building can be a strip-oriented southeast area, meeting the sufficient lighting needs of various indoor functional spaces. Compared with traditional buildings, the increasing and decreasing scale of the original block-shaped buildings on the site was quite abrupt (Figure 17a). The shadow area and duration of ecological form buildings are significantly smaller than traditional buildings, providing sufficient lighting space for the landscape plants on the site (Figure 17b). Ventilation is one of the most basic functions of buildings. Good ventilation can reduce building energy consumption and achieve dynamic balance between the artificial and natural environment of the building, and it will be a higher goal that buildings should pursue after meeting basic functional and aesthetic requirements. Due to the special climate conditions in Yunnan, it is necessary for buildings to have better ventilation conditions. Through wind direction analysis and wind speed analysis, it was concluded that the building structure considers the strongest ventilation efficiency to form a C-shaped ring to meet the two dominant wind directions of the site. Compared to traditional buildings, the blue area in the wind environment diagram is the area with lower wind speed, and the ecological ventilation situation is better than traditional buildings to ensure good ventilation for the landscape site and indoor environment (Figure 17c). In the layout of the rainforest center building, based on the wind direction and wind diagram relationship, the building is expanded along the windward side to improve the natural ventilation efficiency of the overall building, thereby reducing the impact of local humid climate on the building.
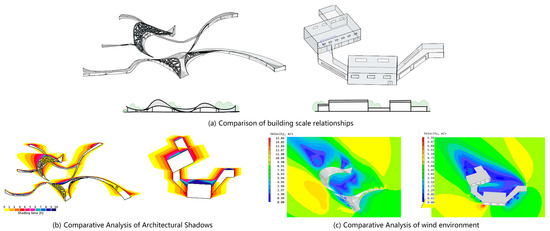
Figure 17.
Comparison between ecological architecture and traditional architecture. (a) Comparison of building scale relationships; (b) comparative analysis of architectural shadows; (c) comparative analysis of wind environment.
In short, the construction of human settlements through geographic information research embodies the systematic strategy of adapting to nature, stimulating nature, and protecting nature, as well as the water ecological wisdom with unique Yunnan traditional cultural connotation and respect for natural ecology as the core [56].
4.3. Parametric Extraction of Plant Morphology to Generate “Ecological Characteristics” of Building Epidermis
4.3.1. Extracting Morphological Parameters of Vines to Generate Ecological Exterior Skin of Buildings
Morphological bionics is one of the characteristics of parametric design languages, and the conceptual design of parametric racks was designed and improved based on this direction. The project selected the winding relationship between vines and trees, and formed different opening sizes according to the curvature changes, thus producing rich light and shadow effects. The parametric design mimics the different spatial feelings of vines and trees. In the conceptual sketch stage of the project, the author observed the visual texture in the natural landscape, summarized and analyzed its formation logic, and simulated some of its morphological characteristics through software. When simulating plant morphology, this algorithm can quickly generate plant spatial structure [39]. This scheme is also based on the topological structure and visual form of rattan entangled trees [57]. The topology and visual morphology of vine tangles were also studied in this scheme. Based on the geographical characteristics of Yunnan, four different types of morphological relationships can be summarized for the growth of vine tangles.
- “Clinging” growth form.
The biggest feature of the “clinging” growth form of rattan tangled trees is the vertical line wrapping, because they are most affected by sunlight parameters and surrounding tree parameters. Its growing environment is surrounded by taller trees, such as the Wispy tree forest, which lacks sufficient light and requires rattan trees to lean along the tall trees to obtain sufficient sunlight by clinging to them. Most plant forms are distributed along the trunk in vertical lines, forming a sense of wrapping (Figure 18a).
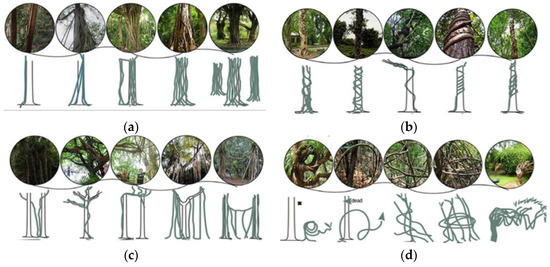
Figure 18.
Four types of image morphology of site vines: (a) “Clinging” growth form; (b) “Spiral” growth form; (c) “Lapped” growth form; (d) “Freestyle” growth form.
- 2.
- “Spiral” growth form.
The “spiral” growth form of rattan trees is characterized by rotating wrap, because they are most affected by humidity parameters and light parameters. It grows in a variety of shrubs and trees, but with less humidity in the air and water lines in the site, vines will wrap around trees to produce a state of hanging. They needs to absorb useful nutrients to form a hovering and winding posture. On the one hand, in order to obtain more light space, on the other hand, it will probe underground to absorb more nutrients. This twisting and winding plant form is usually distributed laterally along the trunk, forming a “cross-wrapped sense” of weaving (Figure 18b).
- 3.
- “Lapped” growth form.
The biggest characteristic of rattan trees with an “overlapping” growth pattern is the formation of an overlapping relationship between two tree shapes, as they are most affected by wind direction parameters and water texture parameters. In the overlapping state, rattan entangled trees sag the air roots, forming overlapping relationships in different states. On the one hand, the air roots will expand the number of air roots according to the dominant wind direction, and on the other hand, the air roots will continue to expand with the overlapping relationship, which can extend to a further direction to explore and absorb the required nutrients. The plant form of this overlapping relationship is mostly vertically distributed along the tree trunk, and it can be observed that the farther the tree is, the longer the air roots are, the closer the tree is, the denser the air roots are, and the larger the span, forming a vertically arranged “hanging wrapping feeling” (Figure 18c).
- 4.
- “Freestyle” growth form.
“Free form” vine entangled trees are characterized by free growth without attachment, as they are most affected by peripheral tree shape and lighting parameters. Due to the lack of trees in the environment that can be strongly attached or rotated upward, they can only grow freely under the driving force of the dominant wind direction and care on the site. In this case, rattan entangled trees can create a state of self-strangulation, which is to use the self-generated structure to form effective support or a spiral wound posture. On the one hand, it is also to obtain more light space, and on the other hand, it is to extend the self-generated form to areas near water sources or where there are certain trees to grow again. This freely rotating and twining plant form is mostly self-winding growth, forming a freely woven wrapping feeling (Figure 18d).
Combining the four types of growth patterns of the site’s native vine tangle plants, a data-based simulation was performed using grasshopper in Rhino (Figure 19). The base curve was first generated from the input data, censored by randomly distributing points, and the points were scaled with unequal heights according to the point-to-linear distance to form a sparsity relationship. After deleting external points, the surface was cut with a Voronoi cell set, the surface was scaled, and the curve was drawn according to the surface vertices. Finally, the curves flowed onto the final surface to form the face. The parametric formation of texture is the basis of the bionomic form of the building skin. The rainforest center building was planned as a two-story public building, and the shape of the building corresponds to the regional culture of the field, combining the undulating form of the vine with the regional dry fence building, and the vine texture corresponds to the area of the site with sufficient light and stable wind direction to determine the location of windows and light on the building block and to gradually generate the regional bionomic form of the building (Figure 19).
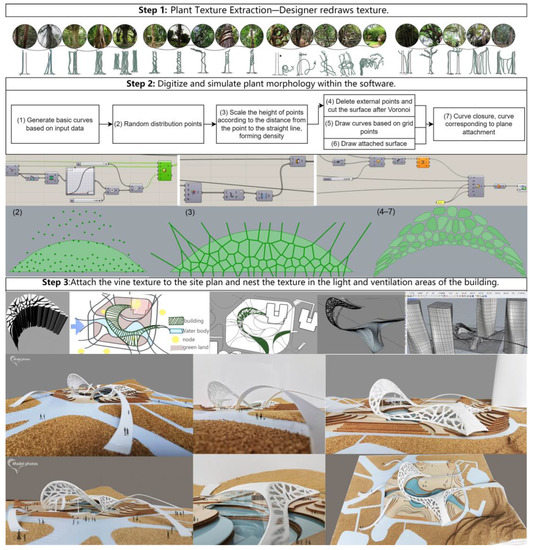
Figure 19.
Parametric “vine” epidermal generation.
The shape of the building surface highly mimics the winding shape of vines and trees, achieving the characteristics of high light transmittance and high wind in the lighting area. The orientation and functional zoning of the building were selected based on geographic information data (Figure 20). Good ventilation efficiency can reduce the energy consumption of ventilation equipment in the building, forming a ventilated building with the help of natural wind speed [58]. The importance of natural ventilation is emphasized by the parametric bionic skin. It has the advantages of energy saving, improving indoor thermal comfort, and improving indoor air quality. Through the measures of building skin to achieve a good natural ventilation effect, the basic principle of ventilation, and the application of natural ventilation technology in the building, the architect’s attention to natural ventilation can be strengthened [59].
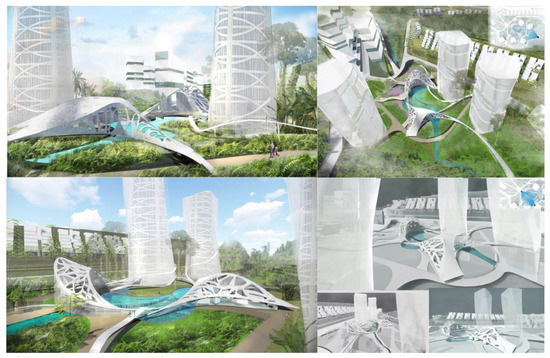
Figure 20.
Architectural rendering of the Rain Shower Center.
This regional form of architecture has a strong local nature and takes into account the use of native plants to adjust the microclimate inside and outside the building. This system will become more mature over time, and native plants will slowly integrate into the building skin system to really resolve the sense of opposition and contradiction between the building and the environment. The improvement of the living environment should not only start from “human nature” but should also be understood from “conforming to nature”. This activity center can not only communicate the awareness of protecting nature but can also draw closer to the concept of symbiosis between humans and nature, conduct practical exploration in more regions, enhance the sense of belonging to local culture, and highlight the ecological sustainable wisdom of the living environment centered on nature.
4.3.2. “Vine type” Road Series System
As the rainforest center of a health resort, the most convenient access to this activity center becomes particularly important. On the one hand, the “vine type” road series system mimics the “free style” growth pattern of native plant vines twining trees (Figure 21). On the other hand, due to the height difference of the site and the high-rise buildings in the surrounding residential areas, the “vine type” road series system well connects these functional spaces with different-story heights and adjacent plots. The convenient transportation system facilitates the situation around the site to quickly reach the water area. Under the premise that the whole site meets the demand of fast traffic, there are also some stay spaces and landscape effects in the curved “vine” road. Curved roads have more effect on moving steps and changing scenes than “linear” roads.
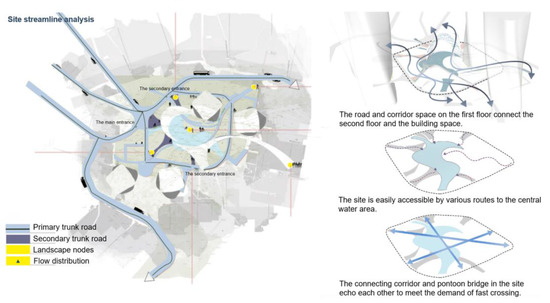
Figure 21.
“Vine form” road system.
4.3.3. Ecological “External Expansion” Architectural Landscape Integration System
The main body of the overall building is shown in the arc-shaped “C shape” (Figure 22). The attached corridor bridge space and gray space are like the vines extending in the direction of the picture, closely connecting the main body of the building with the surrounding environment. To form the “inward inclusion and outward expansion”, a rainforest health club was set up in the circular building to serve the surrounding residential areas, and a hot spring club was arranged adjacent to the building to create a natural atmosphere. The water body in the center of the site was considered to be placed with local plants in combination with the natural water system, while aquatic plants such as Wanglian were selected and placed in the hydrophilic activity center to maintain the diversity of local plants. The lively activity revolves around the water center and its circular building, creating a comfortable, natural, and vibrant community public space. Arranging tung flower trees and sky watching trees around the building can create a sense of privacy and wrap the building to form a dynamic and static zone of “quiet outside—lively inside”. The second is to use plants of different scales to form a scale gradient, which can eliminate the oppression of the surrounding high-rise buildings on the site. “Outward expansion” is reflected in the extension of the auxiliary space of the building. This kind of vine-like ribbon space can be utilized, making it not only meet the basic needs of traffic but also set up some auxiliary functions in combination with the site’s own characteristics. For example, the characteristic botanical garden (Figure 22) extends out to the east of the site and goes deep into the mountain forest, forming a good popular science botanical garden using the mountain forest resources. In addition, some children’s exhibitions can be set up in the ribbon space to enhance the fun and interactivity of the venue, allowing people of multiple ages to participate.
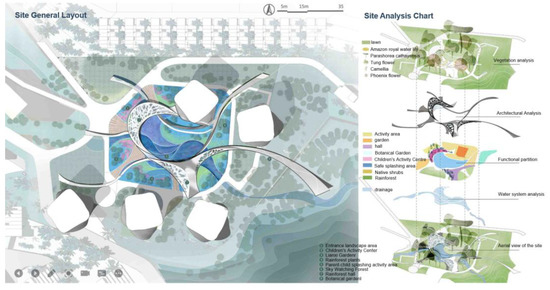
Figure 22.
“Ecological” landscape architecture integration.
5. Discussion
Architectural design is confronted with the whole man-made environment, which is not only a personal problem but is also an urgent problem concerned by everyone [60]. Due to the rapid economic development in China in the past 30 years, issues such as rapid urban expansion and the location of new buildings have also been dominated by economic and demographic forces. Nowadays, urban development is gradually slowing down, and people are beginning to attach importance to the protection of local resources, with more emphasis on the development of environmentally friendly buildings. Cities are shifting from buildings of demand to buildings of uniqueness, with an increased demand for ecologically adaptive buildings. In addition, with the rapid development of science and technology, various complex building skins are more easily realized through various technical means, and the realization of ecological building skins is even higher. As traditional architectural skin design techniques are quietly changing, the composite parametric skin design method will have more future significance.
The skin design method based on parametric software such as composite GIS can effectively solve sustainable issues such as uneven energy consumption, high pollution, and high energy consumption in buildings. This generated skin can not only reduce building energy consumption and increase the natural lighting required for buildings, but it can also accommodate the growth of local plants in the future, for example, using building water to supply plant growth to form a system of symbiosis between buildings and plants. The various functions of plants can also reduce building thermal radiation and other issues to form a virtuous cycle. In terms of human settlements, unique symbiotic buildings create different architectural spaces and vegetation spaces, which can better carry out local plant education, science popularization, parent–child activities, and other public activities, forming a unique sense of regional belonging. The surface of regional architecture carries the physical space of local culture and the growth space of local plants, promoting the close relationship between ecological and human activities.
At present, the application of ecological architecture design in GIS in China is gradually increasing with demand, but GIS lacks further development [61]. In the future, data analysis methods for geographic big data will be more comprehensive. The construction and development of dynamic video scenes are based on GIS of virtual geographic scenes [61]. Big data analysis methods can help designers better provide potential solutions in the early stages of design. The construction and development of virtual GIS-based dynamic video scenes of geographic information can facilitate the communication and understanding of GIS ideas. Combining VR/AR/MR technology and geographic analysis models, the public can collaborate with designers to change virtual geographic scenes to enjoy visual life and engage in virtual activities, derive the design process from environmental information and logical data to form a new sustainable architectural skin design theoretical system. Architects have designed regional buildings that are more ecologically sustainable by grasping the laws of nature, which also conforms to the principle of respecting and conforming to nature, eliminating the contradiction between architecture and nature, and developing towards symbiosis and integration.
6. Conclusions
In the project of Yunnan Jinghong Rainforest Center, we applied parametric image analysis and regional plant morphology simulation methods to design “regional” ecological buildings. We analyzed the natural conditions of the site in detail through GIS and other parametric software to derive parametric images of light and shadow areas, water catchment areas, and wind guiding areas and to cut out the building areas and landscape areas through image superimposition to generate limited problems that are closely related to the geographic environment of the site. Then, by sorting out the local culture and the growth patterns of vine trees under different altitudes and different humidity light, the ecological skin texture was simulated in Rhino’s grasshopper software, and the texture corresponds to the area of architectural form planning, finally forming an architectural bionic skin system. This skin incorporates geographic information data, regional architectural context, and local plant texture, resulting in a sustainable skin design approach with regional characteristics.
Parametric skin design framework is a composite architecture skin based on parametric thinking and GIS environmental information system. At the ecological level, the core of this framework is to respect the natural ecology, protect regional culture, and inherit and develop new regional ecological buildings. It can recognize the advantages and disadvantages of the site in the early stage and gradually accumulate and release the energy that conforms to the natural laws and terrain, forming a “bridge” relationship between people and nature. In terms of local human settlements, over time, such bionic buildings with regional characteristics will bring new communication spaces, activity spaces, and memory spaces of different ages to the region, forming a unique “sense of regional belonging”. At the designer level, parametric visualization can be used to help designers adjust the overall shape, material selection, elements of openings and windows, and layout and use of internal space based on factors such as site lighting, vertical direction, wind direction, and catchment. The design method with the combination of multiple parametric software can effectively help designers to demonstrate the feasibility according to the field environment, and the architectural design plan is highly optimized, feasible, and widely expandable, which meets the theoretical and practical needs.
In the field of architectural design, a design method based on the combination of parametric thinking and environmental information systems is a method of building skin deduction that is grounded and relevant to the local environment. However, this study still has limitations. Firstly, the software selected for this framework has limitations. In fact, big data analysis software and virtual reality technologies can make the analyzed geographic information structure and plant growth structure more comprehensive. The second is that the framework is not necessarily suitable for regions with excessively similar plant communities, it is difficult to distinguish the same plant communities in terms of regional characteristics, and there is a lack of epidermal design research on different cultural types in the same region. Third, there are few practical cases of ecological skin design, and more types of ecological buildings need to be explored in subsequent designs. The regional parametric ecological skin design framework needs to be expanded from a large amount of quantitative analysis and practical feedback to form a more comprehensive and systematic regional parametric skin design. The fourth point is that due to the limitations of the conceptual plan, there was a lack of sustainable ecological assessment compared to traditional architecture. It can play a greater role in utilizing the evolution of spatiotemporal patterns and process mechanisms, thus establishing an ecosystem service value evaluation method system for regional biomimetic architecture [62].
Author Contributions
Conceptualization, R.Z. and W.G.; methodology, R.Z. and W.G.; software, R.Z.; validation, R.Z. and W.G.; formal analysis, R.Z.; investigation, R.Z.; resources, R.Z.; data curation, R.Z. and W.G.; writing—original draft preparation, and W.G.; writing—review and editing, and W.G.; visualization, R.Z.; supervision, W.G.; project administration, W.G.; funding acquisition, W.G. All authors have read and agreed to the published version of the manuscript.
Funding
This research received no external funding.
Institutional Review Board Statement
Not applicable.
Informed Consent Statement
Informed consent was obtained from all subjects involved in the study.
Data Availability Statement
Data sharing not applicable.
Acknowledgments
We would like to thank the editors and anonymous reviewers for their constructive suggestions and comments, which helped improve this paper’s quality.
Conflicts of Interest
The authors declare no conflict of interest.
References
- Cao, Y.N.; Kong, L.Q.; Zhang, L.F.; Ouyang, Z.Y. The balance between economic development and ecosystem service value in the process of land urbanization: A case study of China’s land urbanization from 2000 to 2015. Land Use Policy 2021, 108, 105536. [Google Scholar] [CrossRef]
- Wei, H. Francis Carrey and Contemporary Rural Construction in China: Comparison, Criticism, and Enlightenment. Archit. Tech. 2022, 2, 49–54. [Google Scholar]
- Bo, L.; Jinsheng, G.; Zebin, Y. Exploratory simulation study on the ecological energy-saving potential of woven parameterized building skins. In Proceedings of the 2nd DADA International Academic Conference on Digital Architecture, Shanghai, China, 4 July 2015; pp. 231–239. [Google Scholar]
- Forman, R.T.T. Ian McGonagall: Designing for Nature; China Architecture & Building Press: Beijing, China, 2012; p. 120. [Google Scholar]
- Pengxiang, Z.; Weizhong, L. Introduction to GIS and GPS.; Northwest Agricultural Science and Technology University Press: Xianyang, China, 2004; p. 205. [Google Scholar]
- Long, Z.; Wen, T.; Qinrong, F.; Zhang, Q. The application of site analysis in planning and design based on the GIS. J. Hebei Univ. Eng. (Nat. Sci. Ed.) 2011, 28, 35–38. [Google Scholar]
- LI, X.R. Research and application of GIS technology in urban landscape design. Inf. Technol. 2016, 7, 121–122. [Google Scholar]
- Bowes, P. Case Study: How Brindisi, ltaly Is Using GIS toHelp Preserve Its Ancient Architecture; GIS Lounge: Santa Clara, CA, USA, 2019. [Google Scholar]
- Zheng, L.; Lu, W.S.; Wu, L.P.F.; Zhou, Q.Y. A review of integration between BIM and CFD for building outdoor environment simulation. Build. Environ. 2023, 228, 109862. [Google Scholar] [CrossRef]
- Shen, Z.; Yin, P. Research on Parametric Modeling Technique for Special-shaped Surface based on Rhino and Grasshopper. Inf. Technol. Civ. Constr. Eng. 2015, 7, 102–106. [Google Scholar]
- Yuan, L.F. Research on Bionic Architectural Form Design Strategy Based on Parametric Perspective. Master’s Thesis, Beijing University of Technology, Beijing, China, 2020. [Google Scholar]
- Xiaowei, Y. The Research of Arcinitectural Bionics—Inspirstion from Biological Nature. Master’s Thesis, Beijing Institute of Architecture and Engineering, Beijing, China, 2006. [Google Scholar]
- Yue, X.S.; Lin, Q.; Jun, C.; Lie, S.Z. The Parametric Building Epidermis Design based on the Wind Environment. Archit. Tech. 2015, 2, 125–127. [Google Scholar]
- Yunxiang, X. Exploration of Resort Architecture and Environment Design under Ecological Concept. Master’s Thesis, Nanjing University of the Arts, Nanjing, China, 2015. [Google Scholar]
- Mirzaei, P.A.; Haghighat, F. Approaches to study Urban Heat Island-Abilities and limitations. Build. Environ. 2010, 45, 2192–2201. [Google Scholar] [CrossRef]
- Yujin, L.; Yimeng, Z.; Yali, H. Analysis on the Incentive Policies for Stereoscopic Greening in China: Taking Shenzhen City as an Example. In Proceedings of the 2018 China Urban Planning Annual Conference, Hangzhou, China, 1 November 2018; pp. 297–308. [Google Scholar]
- Qian, Z. Research on the Eighth Singapore Garden Project Progress Plan and Control. Master’s Thesis, Dalian University of Technology, Dalian, China, 2015. [Google Scholar]
- Xiwen, H. Study on Four Passive Ventilation Design Modes for Buildings in Humid and Hot Regions of Asia. Master’s Thesis, School of Architecture and Urban Planning, Tongji University, Shanghai, China, 2009. [Google Scholar]
- Minyu, L. The Application and Development of GIS Geographic Information System. China’s New Technol. New Prod. 2011, 16, 28–29. [Google Scholar]
- McHarg, I.L. Design with Nature; Tianjin University Press: Tianjin, China, 2006; p. 244. [Google Scholar]
- Brown, G.Z.; Dekay, M. Solar Radiation, Wind, and Natural Light; China Construction Industry Press: Beijing, China, 2008; p. 359. [Google Scholar]
- Ruiling, Z. UVA Landscape Architecture Education and SITES—Analysis of Sustainable Landscape Architecture in the United States. China Sci. Technol. 2019, 21, 93–94. [Google Scholar]
- Jingyi, X. Development and Trend of GIS. Constr. Eng. Technol. Des. 2016, 23, 2635. [Google Scholar]
- Li, L.Y.; Uyttenhove, P.; Vaneetvelde, V. Planning green infrastructure to mitigate urban surface water flooding risk—A methodology to identify priority areas applied in the city of Ghent. Landsc. Urban Plan. 2020, 194, 103703. [Google Scholar] [CrossRef]
- Awad, J.; Jung, C. Extracting the Planning Elements for Sustainable Urban Regeneration in Dubai with AHP (Analytic Hierarchy Process). Sustain. Cities Soc. 2022, 76, 103496. [Google Scholar] [CrossRef]
- Skilodimou, H.D.; Bathrellos, G.D.; Chousianitis, K.; Youssef, A.M.; Pradhan, B. Multi-hazard assessment modeling via multi-criteria analysis and GIS: A case study. Environ. Earth Sci. 2019, 78, 47. [Google Scholar] [CrossRef]
- Torkayesh, A.E.; Zolfani, S.H.; Kahvand, M.; Khazaelpour, P. Landfill location selection for healthcare waste of urban areas using hybrid BWM-grey MARCOS model based on GIS. Sustain. Cities Soc. 2021, 67, 102712. [Google Scholar] [CrossRef]
- Bo-ot, L.M.; Wang, Y.H.; Chiang, C.M.; Lai, C.M. Effects of a Green Space Layout on the Outdoor Thermal Environment at the Neighborhood Level. Energies 2012, 5, 3723–3735. [Google Scholar] [CrossRef]
- Cho, G.Y.; Yeo, M.S.; Kim, K.W. Design Parameters of Double-Skin Facade for Improving the Performance of Natural Ventilation in High-Rise Residential Buildings. J. Asian Archit. Build. Eng. 2013, 12, 125–132. [Google Scholar] [CrossRef]
- Yuan, Y.P.; Yu, X.P.; Yang, X.J.; Xiao, Y.M.; Xiang, B.; Wang, Y. Bionic building energy efficiency and bionic green architecture: A review. Renew. Sustain. Energy Rev. 2017, 74, 771–787. [Google Scholar] [CrossRef]
- Semper, G. Four Elements of Architecture; China Architecture & Building Press: Beijing, China, 2010; p. 289. [Google Scholar]
- Mahroo, H.A.; Vafamehr, M. Structural optimization of four designed roof modules: Inspired by Voronax grid shell structures. Front. Archit. Res. 2023, 12, 129–147. [Google Scholar] [CrossRef]
- Shuo, L. The Symbiosis of Berlin’s Urban New Buildings and Historical Environment. Master’s Thesis, Zhengzhou University, Zhengzhou, China, 2017. [Google Scholar]
- Pearce, P. Structure in Nature Is a Strategy for Design; MIT Press: Cambridge, MA, USA, 1980. [Google Scholar]
- Prusinkiewicz, P.; Hanan, J.S.; Fracchia, F.D.; Lindenmayer, A.; Fowler, D.R.; de Boer, M.J.M.; Mercer, L. The Algorithmic Beauty of Plants; The Virtual Laboratory; Springer: New York, NY, USA, 2012; ISBN 978-1-4613-8476-2. [Google Scholar]
- Qiuda, L. Building Form Generation Based on Fractal Theory. Ph.D. Thesis, Tsinghua University, Beijing, China, 2014. [Google Scholar]
- Xiangning, Z. Research on Contemporary Complex Architectural Form Design. Ph.D. Thesis, Harbin Institute of Technology, Harbin, China, 2009. [Google Scholar]
- Fuju, G. Research on Bionic Engineering of Spatial Structures. Ph.D. Thesis, Tianjin University, Tianjin, China, 2002. [Google Scholar]
- Jialiang, W. Bionics, Dynamics and Sustainability—Research on Dynamic Building Skin Based on Biological Climate Adaptability. Ph.D. Thesis, Tianjin university, Tianjin, China, 2011. [Google Scholar]
- Guoqiang, Z. Research on Ecological Architecture. Master’s Thesis, Inner Mongolia University, Hohhot, China, 2005. [Google Scholar]
- Tao, H. Location Of Eco Architecture And Green Architecture In The Sustainable Developing Architecture. New Build. 1998, 2, 15–16. [Google Scholar]
- Luo, D.; Yang, Y.; Lu, P.; Jie, L. Digital Infiltration and Parametricism:Interviews and Dialogues on Digital Technology and Architectural Design. World Archit. 2013, 9, 17–35. [Google Scholar]
- Bingbo, Z.; Xiaohui, D. Analysis of Parameters Accessing in Parametric Design. Huazhong Archit. 2010, 28, 22–25. [Google Scholar]
- Yong, Y. Generative Design in Digital Times-Considerations of an Exercise of Joint Teaching on Basic Architecture Design. New Build. 2008, 3, 4–9. [Google Scholar]
- Ping, L. Visual Expression of Spatial Information. Master’s Thesis, Central South University of Forestry and Technology, Changsha, China, 2006. [Google Scholar]
- Qianqian, L. Research on the Numerical Simulation and Evaluation of Green Livable Degree in an Urban Community. Master’s Thesis, Tianjin University, Tianjin, China, 2016. [Google Scholar]
- Linyan, Y.; Tao, W.; Dingxing, Y.; Yawei, D. Discussion on the Production Process and Quality Inspection of Low Altitude Digital Aerial Photography Orthophoto Images; Yunnan Association of Science and Technology: Yunnan, China, 2017; pp. 730–739. [Google Scholar]
- Müller, P.; Wonka, P.; Haegler, S.; Ulmer, A.; Van Gool, L. Procedural modeling of buildings. ACM Trans. Graph. 2006, 25, 614–623. [Google Scholar] [CrossRef]
- Yanwen, D. Research on Evaluation of Urban Microclimate Simulation Tools Based on Green Plants. Master’s Thesis, Nanjing University, Nanjing, China, 2017. [Google Scholar]
- Junnan, L. Study on the Characteristics and Optimization Strategies of the Wind Environment of the High-Rise Residential Area Affect Multi-Rise Residential Area in the Cold Region—A Case Study of Tianjin City. Master’s Thesis, Tianjin University, Tianjin, China, 2017. [Google Scholar]
- Xuhong, Y.; Tianyou, L.; Jingjuan, J. Sunlight Analysis Strategy in the Plan Stage: Reflections on the Teaching of “Residential Area Planning and Design” Course. Archit. Cult. 2020, 12, 197–199. [Google Scholar]
- Jiancheng, L.; Zhaoji, W.; Gu, W. Introduction to Digital Architectural Design; China Construction Industry Press: Beijing, China, 2007; p. 340. [Google Scholar]
- Ling, Q.H. Ecological Architectural Technology in A Visual Field of Environmental Ethics. Res. Dialectics Nat. 2004, 20, 65–68. [Google Scholar]
- Zhan, G.H.; Yue, W. Beyond Divinity: Interpretation of Water Ecological Wisdom of Dai Traditional Villages Based on GIS Hydrological Analysis, A Case Study of Manmeng New Village, Jinghong City, Yunnan Province. World Archit. 2021, 9, 32–35. [Google Scholar]
- Dennis, N.; Brown, K. Portable Manual for Landscape Architects; China Construction Industry Press: Beijing, China, 2002; p. 481. [Google Scholar]
- Rongkun, L. Ecological Culture in Dai Nationality’s Religion. Sichuan Environ. 2009, 28, 124–126. [Google Scholar]
- Minzhi, C.; Weilong, D.; Weitong, Z. Visual simulation of trees architectural models based on parametric L-system. J. Zhejiang Univ. Technol. 2007, 35, 427–430. [Google Scholar]
- Yunsong, H. Research on Building Form Generation Method Based on the Impact of Sunlight and Wind Environment. Master’s Thesis, Harbin Institute of Technology, Harbin, China, 2013. [Google Scholar]
- Yun, L. Application of Natural Ventilation Technology in Green Building. Shanghai Energy Conserv. 2021, 8, 868–873. [Google Scholar]
- Laseau, P. Raphic Thinking; China Construction Industry Press: Beijing, China, 1988; p. 210. [Google Scholar]
- Lu, G.N.; Batty, M.; Strobl, J.; Lin, H.; Zhu, A.X.; Chen, M. Reflections and speculations on the progress in Geographic Information Systems (GIS): A geographic perspective. Int. J. Geogr. Inf. Sci. 2019, 33, 346–367. [Google Scholar] [CrossRef]
- Wang, C.N.; Cheng, L.H.; Hong, W.L. Reviews on ecosystem services: Connotation, valuation and GIS-based mapping. J. Ecol. Environ. 2009, 18, 1987–1994. [Google Scholar]


Disclaimer/Publisher’s Note: The statements, opinions and data contained in all publications are solely those of the individual author(s) and contributor(s) and not of MDPI and/or the editor(s). MDPI and/or the editor(s) disclaim responsibility for any injury to people or property resulting from any ideas, methods, instructions or products referred to in the content. |
© 2023 by the authors. Licensee MDPI, Basel, Switzerland. This article is an open access article distributed under the terms and conditions of the Creative Commons Attribution (CC BY) license (https://creativecommons.org/licenses/by/4.0/).