Abstract
With the flourishing development of the urban metro system, the topology of important nodes changes as the metro network structure evolves further. The identical important node has distinct impacts on various metro networks’ resilience. At present, the dynamic influences of important station evolution on the resilience of metro networks remain to be studied further. Taking Shenzhen Metro Network (SZMN) as an example, the dynamic influences of the structure evolution of important nodes on the resilience of the metro network were investigated in this study. Firstly, the dynamic evolution characteristics of complex network topology and node centralities in metro systems were mined. Then, combined with the node interruption simulation and the resilience loss triangle theory, the resilience levels of distinct metro networks facing the failure of the same critical node were statistically assessed. Additionally, suggestions for optimal network recovery strategies for diverse cases were made. Finally, based on the evaluation results of node importance and network resilience, the dynamic influences of the topological evolution of important nodes on the resilience of metro networks were thoroughly discussed. The study’s findings help us comprehend the metro network’s development features better and can assist the metro management department in making knowledgeable decisions and taking appropriate action in an emergency. This study has theoretical and practical significance for the resilient operation and sustainable planning of urban metro network systems.
1. Introduction
The urban metro network system is vigorously built and has been developed all over the world. As a vital component of urban infrastructure, the metro network plays an indispensable role in the whole public transportation system [1,2,3,4,5]. According to the overview of urban rail transit lines in mainland China in 2022 released by the China Association of Metros, by the end of 2022, a total of 55 cities in mainland China have put 10,291.95 km of rail transit lines into operation, of which the metro system constitutes 8012.85 km, accounting for 77.85% [6]. The urban rail transit system in China is currently in the era of line interconnection, intelligentization, and network-based operation, which is quite convenient for our daily travel.
The metro system can be regarded as a complex network composed of numerous nodes and edges [7,8]. The metro topology is continuously changing as a result of the ongoing construction and operation of new lines, and the metro network is becoming more sophisticated and complex. The topological characteristics of metro networks and the importance of nodes also vary in line with the rapid development of metro network-based operations. In the current research on the development and evolution of metro networks, most academics have proposed various quantitative indicators to mine and evaluate the development characteristics of metro systems based on complex network and graph theory. Yu et al. [9] established a nine-metric scheme to quantify the service performance of an urban metro network based on a complex network and revealed metro development in 42 cities of the Chinese mainland from their accessibility, recovery, and service capability. Song et al. [10] evaluated the influence of metro networks from 2012 to 2020 based on the connectivity, accessibility, and polycentricity of urban spatial structures using an urban spatial gravity model and social network analysis. Pei et al. [11] investigated the dynamical evolution of the structural efficiency of metro systems for 14 large cities in mainland China and found that the evolution of metro networks is the improvement of the relative ratio of average nodal efficiency in the core compared to global efficiency. Meng et al. [12] revealed the dynamic evolution mechanism of the urban metro system’s complex topology and node importance combined with complex network theory. Ma et al. [13] adopted the principal component analysis and Gaussian mixture model to reveal the spatio-temporal complexity of the Xi’an rail transit network’s evolution process based on temporal topological data. He et al. [14] created a data-driven approach to investigate the transit percolation process that characterizes the evolution of metro network connection as it involves individual cognition.
The metro system is becoming increasingly complex as metro network-based operating picks up speed, and many lines and stations are connected to and have an impact on one another. At the same time, in the process of network-based operation, the system may encounter various threats of emergencies (such as heavy passenger volumes, typhoons, extreme rainstorms, earthquakes, equipment malfunctions, terrorist attacks, etc.). These threats can cause cascading failure at different levels of station, line, or network [15], which seriously affects the timeliness and security of passenger travel. For instance, there is a typical case of Zhengzhou Metro, which was flooded by an extreme rainstorm on 20 July 2017. This catastrophe resulted in the closure of lines and stations, network paralysis, serious casualties, and property damage. When the urban metro network is confronted with unexpected or deliberate disturbance, the vulnerability [16,17,18] of the system will be increased. To reduce this vulnerability, the metro network system needs to possess a strong recovery capability, i.e., resilience [19,20,21]. Resilience is the capacity of a system to absorb, resist, and quickly recover from external risks. The focus of resilience theory is on a system’s capacity for learning and adapting across its entire life cycle. A system’s resilience level can be assessed by measuring how its performance has changed before and after a disturbance.
At present, resilience theory is a hot topic in the field of transportation (such as road [22,23,24], railway [25,26,27], aviation [28,29], navigation [30,31], etc.). The research on resilience in urban metro network systems mainly involves relevant theoretical analyses and evaluation techniques. Among them, the resilience evaluation methods of the metro network systems are being concerned and explored by many scholars, which can be classified as attribute-driven, data-driven, scenario-driven, etc. Specifically, a quantitative evaluation model of metro resilience can be constructed based on the resilience-related attributes (such as robustness, vulnerability, absorptivity, resistance, recovery, etc.) and metro transportation data. On the other hand, combined with specific disturbance scenarios (such as epidemic diseases, meteorological disasters, intentional attacks, etc.), we can identify the variables influencing the resilience of metro systems so as to put forward the corresponding resilience indicators to gauge the recovery level of a metro system.
Some study findings have been made for the metro network’s resilience assessment. Zhang et al. [32] studied the characteristics (vulnerability, robustness, rapidity, and degree to return) of the metro system’s responses to the disturbance with a multivariate multiple regression model and quantitatively evaluated COVID-19-caused resilience performance of metro rails using the metro transit data from the United States. By taking into account general station interruption, interchange station interruption, and traffic tunnel failure, Qi et al. [19] proposed a quantitative resilience assessment model of metro networks and examined the corresponding recovery strategies. Considering three dimensions of resistance, recovery, and adaptation and combined with ordered binary comparison, entropy weight, and cloud model, Jiao et al. [33] developed a model for evaluating metro stations’ resilience levels against rainstorm disasters and used Chongqing metro system as a case study. Taking both budget limitations and repair time uncertainty into account, Zhang et al. [34] proposed a resilience-based optimization model for choosing an optimal restoration sequence scheme, maximizing the global average efficiency, under the condition that the network accessibility meets given resilience requirements. To model the causal relationships to quantify the importance of different risks to the overall resilience criteria, Yin et al. [35] proposed a hybrid knowledge-based and data-driven approach for the quantitative analysis of resilience.
The existing research shows that we can understand the development characteristics of metro networks and offer rational recommendations for the optimization and sustainability of metro network topology based on its dynamic evolution. Furthermore, the resilience assessment of the metro network can be used to understand how well the system performs and its ability to resist and recover in the case of emergencies. Overall, the study of metro network evolution and metro resilience evaluation has made some progress in relevant areas. As the metro network continues to develop, the topological structure of the nodes will have a variety of effects on the network’s resilience. The structural improvements to the important stations, in particular, will be crucial to the network’s overall system performance [8,36]. Therefore, it is very important to master the evolution characteristics of the metro network topology, especially the structural changes of those key hubs, for the improvement of the resilience of the entire metro system. However, most of the current studies focus on the evolution characteristics of metro networks or the evaluation of metro resilience, but the dynamic influences of important stations’ evolution on the resilience of metro networks are still less explored. Clarifying the influences of the topological evolution of important nodes on the resilience of metro networks is helpful in understanding the relationship between node topology evolution and dynamic changes of network resilience so as to facilitate the metro management department to strengthen the regular safety and emergency management of important stations, which is of great significance for the sustainable operation of the metro system.
In view of this, the SZMN system is chosen for this study as the research object. Firstly, using complex network theory, the metro network’s evolution features and the centralities of important nodes were mined. Then, based on the cascading failure simulation and the proposed resilience evaluation model, the resilience level of different metro networks under the complete failure of important nodes was quantitatively calculated, and corresponding recovery strategies were discussed. Finally, combined with the evaluation results of comprehensive node importance and network resilience, the influences of the important node evolution on the resilience of the metro network were analyzed. The study’s findings are useful for understanding the evolution law of the metro network structure and the stations’ importance degree differences in the metro system for the planning and management departments. In addition, it is beneficial to develop rapid and effective responses when dealing with unexpected emergencies and then improve the safety management level and emergency capability of the entire metro network system. This study can provide theoretical support and technical assistance for the resilient and sustainable operation of the metro system.
2. Methodology
2.1. Complex Network Modeling and Node Centrality Measurement
Complex network theory and graph theory have been widely used and recognized in exploring the complexity of metro network systems [37]. The topological structure of a metro network can be modeled using a variety of techniques [38]. Considering the similarity between real metro network and topological space model, the classical Space L modeling method was utilized in this study for complex topology. The metro network system consists of the node set and the edge set , where and . represents a connection consisting of two adjacent nodes in metro network. In Space L model, if two nodes are adjacent, an adjacency matrix is generated and = 1. Otherwise, = 0.
After the complex topology modeling of metro network system, we can analyze the roles and functions of different nodes in the network. In the unweighted complex network, a node’s role refers to the degree of its association with other nodes, namely the node’s accessibility. The centrality of a node can be used to gauge how accessible it is. For instance, as the most direct metric of centrality, DC (Degree Centrality) [39] refers to the number of edges connected to a node, which can measure the importance of the network well. BC (Betweenness Centrality) and CC (Closeness Centrality) [40] utilize the structural information of the whole network to identify influential nodes by measuring the number of shortest paths through a node and the distance to other nodes in the network, respectively. Moreover, EC (Eigenvector Centrality) [39] considers the importance of a node’s neighbors, while PR (PageRank) [41] calculates the order of nodes according to the structure of the incoming link. The above common calculations of node centrality are implemented according to the methods in previous studies [12,19].
2.2. Node Interruption Simulation
When studying the resilience of metro networks, it is necessary to analyze the situations of nodes or links in the network being hit by unexpected events so as to determine how well they perform after an attack. When the metro network encounters an intentional or random interruption, the mode of removing nodes is often used to simulate the interruption [16,42,43]. It should be noted that the interruption of a node in this study is complete and thorough, meaning that after the node is removed from the intricate metro network, it is unavailable to other nearby nodes.
Additionally, there are two categories of stations (nodes) in the metro network: general stations and transfer stations. The transfer station can be two-line, three-line, or four-line. Any sort of station that is disrupted immediately loses all connection to its surrounding stations. Here, the general station, two-line transfer station, and four-line transfer station are selected for case study. Figure 1 shows the different types of station interruption, where L − 1/2/3/4 lines are represented by different colors and stations are coded by numbers. Station No.2 is a general station in the network (a), a two-line transfer station in the network (c), and a four-line transfer station in the network (e). After a complete failure, station No.2 exists in isolation in the network.
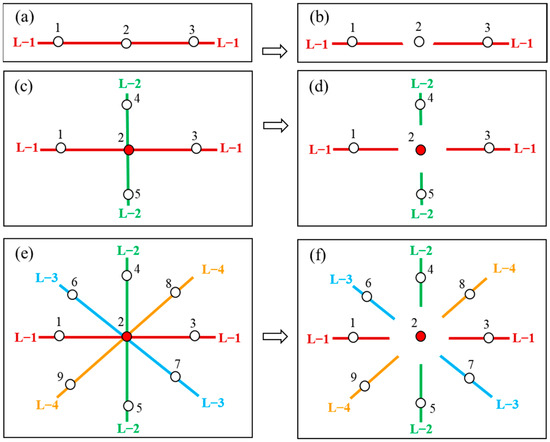
Figure 1.
The different types of station interruption: (a) a general station in the normal state, (b) a general station in the failure state, (c) a two-line transfer station in the normal state, (d) a two-line transfer station in the failure state, (e) a four-line transfer station in the normal state, and (f) a four-line transfer station in the failure state.
2.3. Resilience Evaluation Modeling
The resilience of the metro network system means that the system has the ability to maintain a certain degree of absorption, recovery, and adaptation after it is disturbed by an unexpected event. In particular, the system’s performance will suddenly deteriorate and then gradually recover to its normal level after the necessary response steps have been carried out. In this process, the system’s performance will have a changing trend with time (as shown in Figure 2). Combined with the complex network theory, the performance of the metro network system in this study mainly refers to the network connectivity, which can be quantitatively measured by the network efficiency .
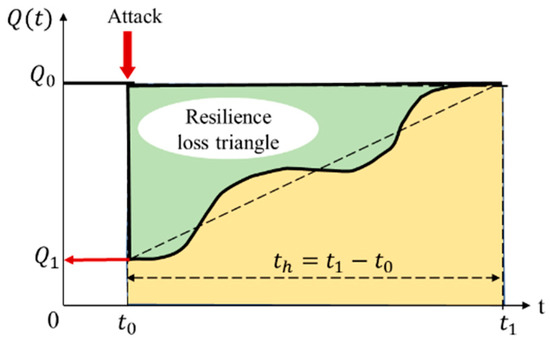
Figure 2.
The resilience evaluation model of the metro network system: the orange area is the resilience and the green one is the resilience loss.
As shown in Figure 2, the initial performance of the metro network is (i.e., ). After the attack occurs at , the performance suddenly drops down to when the metro network system is the most vulnerable. With the implementation of emergency measures, the system performance starts to recover gradually. After the time , the performance of the metro network completely recovers to the initial state. Combined with the definition of metro network resilience, it can be derived that the resilience is the orange-shaded part, which can be calculated quantitatively by Equation (1). For the definite integral , the trapezoidal summation method is used to approximate the area of the shaded part considering that the data involved in this study are discrete. In addition, there is resilience loss throughout the interruption–response–recovery process, which is represented by the resilience loss triangle shaded in green, which can be quantified by Equation (2).
3. Research Object
Shenzhen Metro (SZM) was selected as the research object in this study. SZM opened its first line in 2004, and by the end of 2022, it had formed the Shenzhen Metro network (SZMN) with 16 lines, 369 stations, and a total length of 547.38 Km in operation. In 2016, SZM opened line-11 (L-11) on 28 June and line-7/9 (L-7/9) on 28 October. Therefore, the SZMN of 2016 can evolve into three networks according to the time: N1 (from 1 January 2016 to 27 June 2016), N2 (from 28 June 2016 to 27 October 2016), and N3 (from 28 October 2016 to 31 December 2016).
For all stations in N3, it can be coded No.1 from Luhu Station in L-1. If there is a transfer station, its code with a smaller line number is the criterion. For example, Laojie Station in L-1 is coded as , and it is still No.3 in L-3; thus, we can number all stations in SZMN. All stations in N1 and N2 can be coded based on station IDs in N3 (as shown in Figure 3). Correspondingly, N1 has 5 lines and 118 stations, N2 has 6 lines and 132 stations, and N3 has 8 lines and 166 stations. Among them, Chegongmiao Station (CGM) evolved from a general station on N1 to a two-line transfer station on N2 and a four-line transfer station on N3. Node No. 2 in Figure 1 depicts the topological structure of the CGM in the SZMN. This study focused on analyzing the topological characteristics and structural importance of CGM stations in different networks as well as the influences on network resilience over the evolution of time.
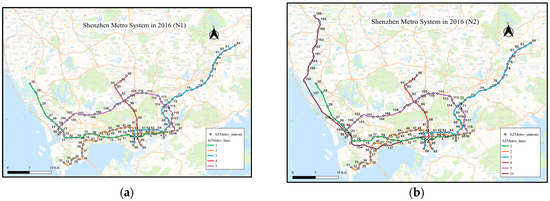
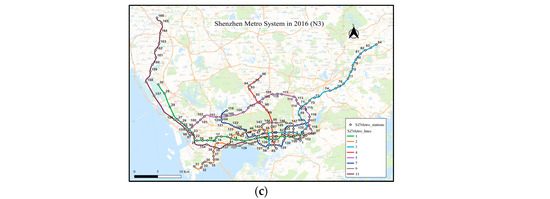
Figure 3.
The coded stations in three networks of SZMN system in 2016: (a) N1; (b) N2; (c) N3.
4. Numerical Analysis Results
4.1. Dynamic Evolution Characteristics of Important Node Centrality
In complex networks, some topological indexes can be used to measure the structural characteristics of the network from different perspectives. In addition to the number of nodes and edges ( and ), the common indexes include the average shortest path length (), network diameter () and density (), the network assortativity (), the local efficiency () and the global efficiency () of the network, etc. Combined with the above topological indicators in complex networks, the topological structure characteristics of the three networks can be obtained (as shown in Table 1).

Table 1.
The topological structure characteristics of three networks in normal conditions.
It is clear that from N1 to N2 and N3, the number of nodes and connected edges rapidly increased. The gradually decreased over time, indicating that the network was increasingly developed, and the travel cost was gradually declining. Moreover, opening new lines in 2016 did not change the diameter of SZMN. The network density decreased inch by inch, and the connection between nodes became closer and closer. The assortativity of SZMN diminished from positive to negative, indicating that the high-degree nodes in a network tend to connect those nodes with a low degree, and the SZMN became disassortative over time. Furthermore, the local network efficiency reduced gradually, indicating that SZMN’s ability to resist random attacks diminished; that is, the robustness of SZMN needs to be further improved. With the development of the network, the global efficiency progressively enlarged, the information transmission ability was gradually enhanced, and the network became more and more accessible.
The centrality (////) characteristics of CGM station () in three networks are shown in Figure 4. The five centrality indices progressively increase as the network develops. From the horizontal comparison, and occupy the higher proportion among the centralities. Compared with other nodes, CGM stations play an increasingly important role in the network, which is closely related to the evolution of its topological structure.
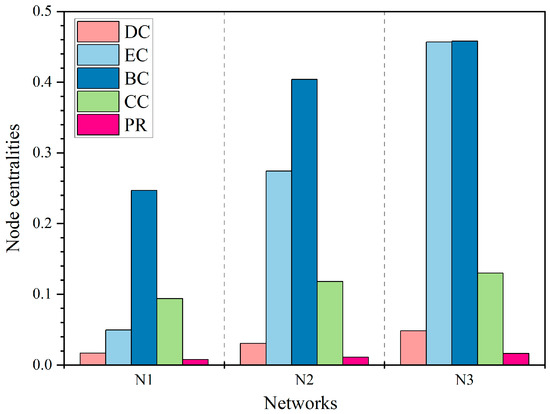
Figure 4.
The centrality characteristics of CGM station in N1, N2, and N3.
4.2. Resilience Evaluation of Metro Network under Important Node Failure
4.2.1. Network Characteristics under Important Node Failure
The metro network resilience evaluation model proposed in this study is based on the condition of a node or link failure. The same node has various effects on network resilience in the process of space-time evolution. To explore this issue, the resilience of three networks facing the failure of a CGM station is quantitatively assessed and discussed.
Based on Section 2.2, CGM stations are removed from N1, N2, and N3 to simulate a complete interruption of the metro station. The topological structure features of the networks after removing the CGM station are re-measured, and the related results are shown in Table 2. Compared with the normal network in Table 1, both and rise, and the network travel expense increases. Network density and local efficiency vary slightly. The global efficiency of the three networks descends, and in N2 and N3 decrease by 0.0122 and 0.0128, respectively.
Table 2.
The topological structure characteristics of three networks after removing CGM station.
After the removal of CGM, the network indexes of N3 change greatly; that is, the CGM station has the greatest impact on N3, indicating that the network function of CGM in N3 must be taken seriously. Among the three networks, CGM has the weakest effects on N1.
4.2.2. Resilience Evaluation and Recovery Strategy
As time goes on, CGM’s station structure shifts from a general station to a four-line transfer station, which also has different influences on network topology and resilience. In combination with Section 2.2 and Section 2.3, after the CGM station is attacked deliberately, the network resilience in three cases is statistically quantified, and corresponding recovery strategies are discussed.
Case 1: General station in N1
As shown in Figure 5, the network efficiency of the N1 network system under the normal operation is ; that is, the initial network performance is . In this case, the CGM station () is a non-transfer station, that is, a general station adjacent to two nodes ( and ). The network performance after removing the CGM station is . The recovery process for the N1 network performance only has one method because CGM is a non-transfer station, as shown in Figure 5c. According to the proposed resilience evaluation model, the network performance after full recovery is . Based on Equations (1) and (2), the trapezoidal summation method is used to calculate the network resilience and resilience loss , respectively.
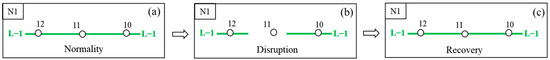
Figure 5.
The recovery process of N1 after the full interruption of CGM station: (a) Normality, (b) Disruption, and (c) Recovery.
Case 2: Two-line transfer station in N2
When the network evolved from N1 to N2, L-11 is opened. Then, the CGM station () became a transfer station connecting L-1 and L-11 and it was adjacent to four nodes (). Figure 6 shows the whole process of the CGM station in the N2 network from its initial state to complete interruption and finally full recovery, where (c) and (d) represent recovery strategies; that is, first L-1, then L-11 (the black arrow), and first L-11, then L-1 (the red arrow), respectively. The network performance of N2 is when in normal condition and when in failure condition. Then, network performances under the (c) and (d) recovery strategy are, respectively, and . Finally, the network goes back to the original normal state, which is represented by . Thus, the changing trend of N2 network performance over time after CGM station failure can be obtained, as shown in Figure 7.
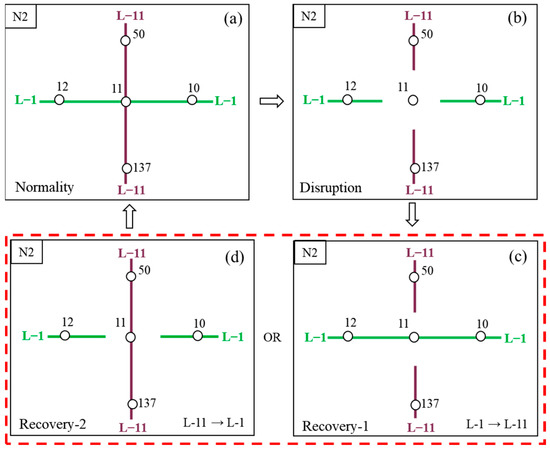
Figure 6.
The recovery process of N2 after the full interruption of CGM station: (a) Normality, (b) Disruption, (c) Recovery-1, and (d) Recovery-2.
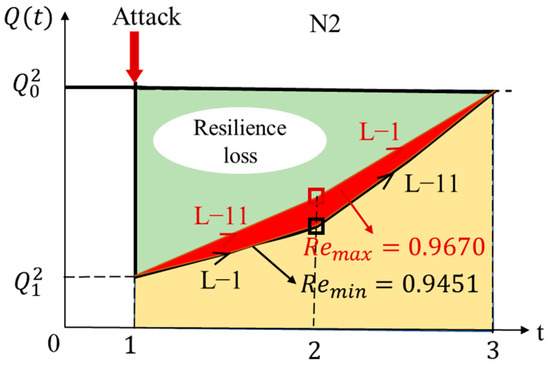
Figure 7.
The network performance trend of N2 over time under the interruption of CGM station.
Similarly, the network resilience and resilience loss under the two recovery strategies can be calculated, and the results are , , and . In comparison, the strategy of recovering L-11 first is most effective because it increases network resilience level and decreases resilience loss.
Case 3: Four-line transfer station in N3
After opening L-7/9, the SZMN developed from N2 to N3, and the CGM station became a four-line transfer station which was adjacent to eight nodes (). As shown in Figure 8, different colors represents different lines, the network began to recover after CGM was completely interrupted and some measures were implemented. The four lines of L-1/7/9/11 can be arranged in sequence, and there are recovery schemes existed. Here, the recovery sequence of L-1/7/9/11 is taken, and the corresponding schematic diagram is shown in the red dotted frame of Figure 8c–e. Next, we also take this sequence as an example to apply the proposed resilience evaluation model.
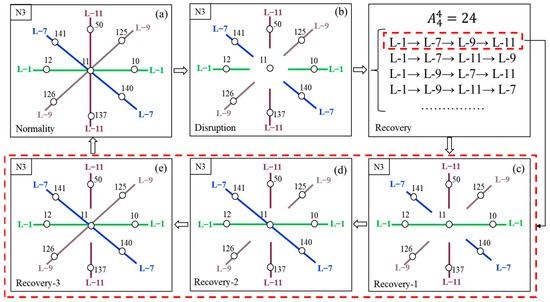
Figure 8.
The recovery process of N3 after the full interruption of CGM station: (a) Normality, (b) Disruption, (c) Recovery-1, (d) Recovery-2, and (e) Recovery-3.
The network performance of N3 is in the normal condition and under the full interruption. When L-1 is regained, the network performance is . Then, it is after recovering L-7 and after recovering L-9. Finally, the network performance is when L-11 is also performing well, and the network N3 restores completely to the normal state. Thus, we can calculate that the network resilience and resilience loss are and , respectively.
In a similar manner, the network resilience and resilience loss for 24 recovery strategies can be derived, and the results are shown in Table 3 and Table 4. Comparing these results, we can see that the optimal recovery strategy is L-11-7-1-9, where there is the maximum resilience of and the minimum resilience loss of . For the worst recovery strategy of L-7-1-9-11, there exists the minimum resilience level of and the maximum resilience loss of . Like Figure 7, we can obtain the performance trends of metro network system under the optimal and worst resilience recovery strategies (as shown by the red and black arrows in Figure 9). The metro management department can implement the necessary optimal management measures to increase network resilience and reduce loss based on the optimal recovery strategy.
Table 3.
The network resilience of N3 in different recovery strategies after the failure of CGM.
Table 4.
The network resilience loss of N3 in different recovery strategies after the failure of CGM.
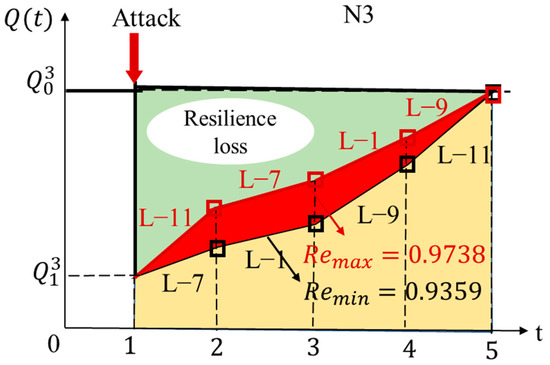
Figure 9.
The network performance trend of N3 over time under the interruption of CGM station.
4.3. Influences of Important Node Evolution on Metro Network’s Resilience
The topological structure and network resilience of the three networks (N1, N2, and N3) in the development of the metro system are objectively studied and assessed in Section 4.1 and Section 4.2. The CGM station contributes significantly to the growth of the network in this process. In the following, the comprehensive importance of CGM stations in the three networks is measured. The WTOPSIS algorithm we proposed earlier in the literature [36], namely, the combination of coefficient of variation and TPOSIS algorithm, is adopted in this study to obtain the nodes’ comprehensive importance in the metro network. Based on the five indexes of node centralities (////) and the WTOPSIS algorithm, the comprehensive importance value of all nodes in three networks can be calculated and ranked. Table 5 shows that the important values of CGM station in three networks are , and , respectively. It indicates that the CGM station is becoming more and more important in the SZMN.
Table 5.
The related results of CGM station’s centralities and network resilience.
According to Section 4.2, there are recovery strategies for N2 and recovery strategies for N3 when the CGM station is completely interrupted. The corresponding network resilience can be obtained according to each recovery strategy. To eliminate the differences, we take the average of all the resilience and the calculation can be shown in Equations (11) and (12). It can be obtained that the average network resilience for N2 and N3 is and , respectively.
Based on the centralities and the comprehensive importance of the CGM station and the average resilience level of the three networks, it can be concluded that the resilience of SZMN decreases gradually with the evolution of network structure and the rise of the CGM’s importance, indicating that CGM station plays an increasingly important role in network resilience. For the SZMN system, deliberate attacks on those key stations, such as CGM, will bring a serious impact and damage to the network. In order to prevent severe losses brought on by failure, the metro management department should strengthen the safety supervision of key stations.
5. Conclusions and Future Works
The topological structure of important nodes changes as the urban metro network evolves continuously, and the interruption of crucial nodes will have a substantial influence on the safety and resilience level of the metro network. It is essential to investigate the effects of the structure evolution of important nodes on the resilience of metro networks, given the complexity of the system and the different unexpected threats encountered during operation. In this study, the Shenzhen Metro network was taken as the research object. Firstly, using complex metro network modeling, how the topological properties of various networks and critical nodes in the evolution process of the metro network have changed over time was examined. Secondly, by integrating the interruption simulation of key nodes and the resilience evaluation model, the network resilience when facing the failure of the important node in various networks was quantitatively quantified. Finally, the influences of the evolution of important node structures on the resilience of metro networks were discussed. The conclusions can be drawn as follows:
- (1)
- SZMN gradually progresses from N1 to N2 and N3 over time, and the cost of transportation for citizens gradually decreases. The nodes are connected closer and closer together, and the global efficiency is growing inch by inch. Meanwhile, the information transmission capacity grows, and network accessibility continues to improve. With the growth of the network, node centrality values for CGM stations likewise progressively increase. and account for the highest proportion among the five centralities. Compared with other nodes, CGM stations play an increasingly important role in SZMN, which is strongly tied to how the topology has changed.
- (2)
- The topology of SZM networks (N1, N2, and N3) is clearly altered after the interruption of the CGM station, with both and growing larger and the network travel cost rising as well. Moreover, there is a little bit of difference in the network density and local efficiency . Correspondingly, the global efficiency of SZMN falls when compared to a normal network. On the whole, removing CGM had a stronger impact on N3 and a smaller impact on N1. Based on the proposed resilience evaluation model of the complex metro network, it can be concluded that there is only one recovery strategy for the general station interruption in N1, and the network resilience level and resilience loss are 0.9857 and 0.0018, respectively. CGM operates as a two-line transfer station in N2. After a complete failure, there are recovery options available, and the resilience is quantitatively 0.9451 and 0.9670, respectively. As a result, the preferred strategy is to regain L-11 first. When the network evolves to N3, there are recovery schemes after the interruption of CGM, among which the optimal recovery strategy is L-11/7/1/9, with the highest resilience of 0.9738. So, the metro management department can implement the appropriate management strategies to maximize network resilience and minimize loss.
- (3)
- Based on the topology evolution analysis of metro networks and important nodes, the WTPOSIS algorithm is adopted to quantitatively evaluate the comprehensive importance of all nodes. It can be concluded that the importance level of CGM in three networks is, respectively, , and , indicating that CGM is playing an increasingly important role in SZMN. Combined with the resilience evaluation results of a metro network facing the failure of CGM, the resilience level of SZMN decreases gradually declines over time, indicating that CGM stations have an increasing impact on the network. The metro management department should therefore increase the safety supervision of crucial stations in order to reduce the resilience loss brought on by deliberate attacks. The findings can provide certain guidance for the policies formulated in the daily operational management and future planning of the Shenzhen Metro, including key station or area management, controlling massive passenger flow, spatial planning strategy, etc. Combining with complex network theory, resilience theory, and metro management practice, the dynamic resilience influences of important node failure on metro network during the evolution of the network are explored, and the corresponding recovery strategies are discussed for different cases in this study, which helps to improve the robustness and recoverability of the entire metro network and reduce the vulnerability to emergencies. This study has significant theoretical and practical implications for the sustainable planning, construction, and safety management of the metro network. However, this study still needs to be enhanced in the aspects of network complexity and resilience evaluation model. In future research work, more factors will be considered, and an optimization algorithm will be proposed to improve the existing model. In-depth research will also be conducted on the metro network’s dynamic resilience under additional scenarios.
Author Contributions
Conceptualization, Y.M.; methodology, Y.M. and X.Z.; supervision, Q.Q. and J.L.; visualization, Y.M. and X.Z.; writing—original draft, Y.M.; writing—review and editing, Y.M. and X.Z.; funding acquisition, Q.Q. and J.L. All authors have read and agreed to the published version of the manuscript.
Funding
This research was funded by the China Postdoctoral Science Foundation (No. 2022M721449), the Innovation and Entrepreneurship Science and Technology Project of China Coal Technology and Engineering Group (No. 2022-2-QN004), and the Innovation and Entrepreneurship Science and Technology Project of Chinese Institute of Coal Science (No. 2021-JSYF-006).
Institutional Review Board Statement
Not applicable.
Informed Consent Statement
Not applicable.
Data Availability Statement
Not applicable.
Conflicts of Interest
The authors declare no conflict of interest.
References
- Wang, Y.; Zhou, Y.; Yang, H.; Yan, X. Integrated Optimization of Bus Bridging Service Design and Passenger Assignment in Response to Urban Rail Transit Disruptions. Transp. Res. Part C Emerg. Technol. 2023, 150, 104098. [Google Scholar] [CrossRef]
- Wang, J.; Lu, Y.; Yang, Y.; Peng, J.; Liu, Y.; Yang, L. Influence of a New Rail Transit Line on Travel Behavior: Evidence from Repeated Cross-Sectional Surveys in Hong Kong. J. Transp. Geogr. 2023, 106, 103526. [Google Scholar] [CrossRef]
- Hu, H.; Li, J.; Wu, S. Simulation Evaluation of a Current Limiting Scheme in an Urban Rail Transit Network. Sustainability 2022, 15, 375. [Google Scholar] [CrossRef]
- Dou, F.; Zhang, H.; Yin, H.; Wei, Y.; Ning, Y. An Optimization Method of Urban Rail Train Operation Scheme Based on the Control of Load Factor. Sustainability 2022, 14, 14235. [Google Scholar] [CrossRef]
- Chen, T.; Ma, J.; Zhu, Z.; Guo, X. Evaluation Method for Node Importance of Urban Rail Network Considering Traffic Characteristics. Sustainability 2023, 15, 3582. [Google Scholar] [CrossRef]
- China Association of Metros the Overview of Urban Rail Transit Lines in Mainland China in 2022. Available online: https://www.camet.org.cn/xyxw/11484 (accessed on 1 March 2023).
- Chen, J.; Pu, Z.; Guo, X.; Cao, J.; Zhang, F. Multiperiod Metro Timetable Optimization Based on the Complex Network and Dynamic Travel Demand. Phys. A 2023, 611, 128419. [Google Scholar] [CrossRef]
- Kopsidas, A.; Kepaptsoglou, K. Identification of Critical Stations in a Metro System: A Substitute Complex Network Analysis. Phys. A 2022, 596, 127123. [Google Scholar] [CrossRef]
- Yu, X.; Chen, Z.; Liu, F.; Zhu, H. How Urban Metro Networks Grow: From a Complex Network Perspective. Tunn. Undergr. Space Technol. 2023, 131, 104841. [Google Scholar] [CrossRef]
- Song, J.; Abuduwayiti, A.; Gou, Z. The Role of Subway Network in Urban Spatial Structure Optimization—Wuhan City as an Example. Tunn. Undergr. Space Technol. 2023, 131, 104842. [Google Scholar] [CrossRef]
- Pei, A.; Xiao, F.; Yu, S.; Li, L. Efficiency in the Evolution of Metro Networks. Sci. Rep. 2022, 12, 8326. [Google Scholar] [CrossRef]
- Meng, Y.; Qi, Q.; Liu, J.; Zhou, W. Dynamic Evolution Analysis of Complex Topology and Node Importance in Shenzhen Metro Network from 2004 to 2021. Sustainability 2022, 14, 7234. [Google Scholar] [CrossRef]
- Ma, M.; Hu, D.; Chien, S.I.-J.; Liu, J.; Yang, X.; Ma, Z. Evolution Assessment of Urban Rail Transit Networks: A Case Study of Xi’an, China. Phys. A 2022, 603, 127670. [Google Scholar] [CrossRef]
- He, Y.; Xu, Z.; Zhao, Y.; Tsui, K.-L. Dynamic Evolution Analysis of Metro Network Connectivity and Bottleneck Identification: From the Perspective of Individual Cognition. IEEE Access 2019, 7, 2042–2052. [Google Scholar] [CrossRef]
- Zhang, Y.; Ng, S.T. Robustness of Urban Railway Networks against the Cascading Failures Induced by the Fluctuation of Passenger Flow. Reliab. Eng. Syst. Saf. 2022, 219, 108227. [Google Scholar] [CrossRef]
- Lu, Q.-C.; Zhang, L.; Xu, P.-C.; Cui, X.; Li, J. Modeling Network Vulnerability of Urban Rail Transit under Cascading Failures: A Coupled Map Lattices Approach. Reliab. Eng. Syst. Saf. 2022, 221, 108320. [Google Scholar] [CrossRef]
- Wang, Y.; Tian, C. Measure Vulnerability of Metro Network Under Cascading Failure. IEEE Access 2021, 9, 683–692. [Google Scholar] [CrossRef]
- Pan, S.; Yan, H.; He, J.; He, Z. Vulnerability and Resilience of Transportation Systems: A Recent Literature Review. Phys. A 2021, 581, 126235. [Google Scholar] [CrossRef]
- Qi, Q.; Meng, Y.; Zhao, X.; Liu, J. Resilience Assessment of an Urban Metro Complex Network: A Case Study of the Zhengzhou Metro. Sustainability 2022, 14, 11555. [Google Scholar] [CrossRef]
- Chen, C.; Wang, S.; Zhang, J.; Gu, X. Modeling the Vulnerability and Resilience of Interdependent Transportation Networks under Multiple Disruptions. J. Infrastruct. Syst. 2023, 29, 04022043. [Google Scholar] [CrossRef]
- Xu, Z.; Chopra, S.S. Network-Based Assessment of Metro Infrastructure with a Spatial–Temporal Resilience Cycle Framework. Reliab. Eng. Syst. Saf. 2022, 223, 108434. [Google Scholar] [CrossRef]
- Liu, Z.; Chen, H.; Liu, E.; Hu, W. Exploring the Resilience Assessment Framework of Urban Road Network for Sustainable Cities. Phys. A 2022, 586, 126465. [Google Scholar] [CrossRef]
- Capacci, L.; Biondini, F.; Frangopol, D.M. Resilience of Aging Structures and Infrastructure Systems with Emphasis on Seismic Resilience of Bridges and Road Networks: Review. Sustain. Cities Soc. 2022, 1, 23–41. [Google Scholar] [CrossRef]
- Hosseini, Y.; Karami Mohammadi, R.; Yang, T.Y. Resource-Based Seismic Resilience Optimization of the Blocked Urban Road Network in Emergency Response Phase Considering Uncertainties. Int. J. Disaster Risk Reduct. 2023, 85, 103496. [Google Scholar] [CrossRef]
- Sresakoolchai, J.; Hamarat, M.; Kaewunruen, S. Automated Machine Learning Recognition to Diagnose Flood Resilience of Railway Switches and Crossings. Sci. Rep. 2023, 13, 2106. [Google Scholar] [CrossRef]
- Yin, J.; Ren, X.; Su, S.; Yan, F.; Tao, T. Resilience-Oriented Train Rescheduling Optimization in Railway Networks: A Mixed Integer Programming Approach. IEEE Trans. Intell. Transport. Syst. 2023, 24, 4948–4961. [Google Scholar] [CrossRef]
- Ilalokhoin, O.; Pant, R.; Hall, J.W. A Model and Methodology for Resilience Assessment of Interdependent Rail Networks—Case Study of Great Britain’s Rail Network. Reliab. Eng. Syst. Saf. 2023, 229, 108895. [Google Scholar] [CrossRef]
- Montsiemang, T.; Dube, K. Post-COVID-19 Aviation Industry Recovery, Resilience, Challenges and Opportunities: A Focus on Western Cape Province, South Africa. In COVID-19, Tourist Destinations and Prospects for Recovery; Springer: Cham, Switzerland, 2023; Volume 2, pp. 243–259. [Google Scholar]
- Guo, J.; Yang, Z.; Zhong, Q.; Sun, X.; Wang, Y. A Novel Resilience Analysis Methodology for Airport Networks System from the Perspective of Different Epidemic Prevention and Control Policy Responses. PLoS ONE 2023, 18, e0281950. [Google Scholar] [CrossRef]
- Gu, B.; Liu, J. A Systematic Review of Resilience in the Maritime Transport. Int. J. Logist. Res. Appl. 2023, 1–22. [Google Scholar] [CrossRef]
- Shi, J.; Chen, J.; Xu, L.; Di, Z.; Qu, Q. Improving the Resilience of Maritime Supply Chains: The Integration of Ports and Inland Transporters in Duopoly Markets. Front. Eng. Manag. 2023, 10, 51–66. [Google Scholar] [CrossRef]
- Zhang, Z.; Chai, H.; Guo, Z. Quantitative Resilience Assessment of the Network-Level Metro Rail Service’s Responses to the COVID-19 Pandemic. Sustain. Cities Soc. 2023, 89, 104315. [Google Scholar] [CrossRef]
- Jiao, L.; Zhu, Y.; Huo, X.; Wu, Y.; Zhang, Y. Resilience Assessment of Metro Stations against Rainstorm Disaster Based on Cloud Model: A Case Study in Chongqing, China. Nat. Hazards 2023, 116, 2311–2337. [Google Scholar] [CrossRef]
- Zhang, J.; Ren, G.; Song, J. Resilience-Based Restoration Sequence Optimization for Metro Networks: A Case Study in China. J. Adv. Transp. 2022, 2022, 8595356. [Google Scholar] [CrossRef]
- Yin, J.; Ren, X.; Liu, R.; Tang, T.; Su, S. Quantitative Analysis for Resilience-Based Urban Rail Systems: A Hybrid Knowledge-Based and Data-Driven Approach. Reliab. Eng. Syst. Saf. 2022, 219, 108183. [Google Scholar] [CrossRef]
- Meng, Y.; Tian, X.; Li, Z.; Zhou, W.; Zhou, Z.; Zhong, M. Exploring Node Importance Evolution of Weighted Complex Networks in Urban Rail Transit. Phys. A 2020, 558, 124925. [Google Scholar] [CrossRef]
- Wang, W.; Wang, Y.; Wang, G.; Li, M.; Jia, L. Identification of the Critical Accident Causative Factors in the Urban Rail Transit System by Complex Network Theory. Phys. A 2023, 610, 128404. [Google Scholar] [CrossRef]
- Meng, Y.; Tian, X.; Li, Z.; Zhou, W.; Zhou, Z.; Zhong, M. Comparison Analysis on Complex Topological Network Models of Urban Rail Transit: A Case Study of Shenzhen Metro in China. Phys. A 2020, 559, 125031. [Google Scholar] [CrossRef]
- Freeman, L.C. Centrality in Social Networks Conceptual Clarification. Soc. Netw. 1978, 1, 215–239. [Google Scholar] [CrossRef]
- Freeman, L.C. A Set of Measures of Centrality Based on Betweenness. Sociometry 1977, 40, 35. [Google Scholar] [CrossRef]
- Li, J.; Zheng, P.; Zhang, W. Identifying the Spatial Distribution of Public Transportation Trips by Node and Community Characteristics. Transp. Plan. Technol. 2020, 43, 325–340. [Google Scholar] [CrossRef]
- Shen, Y.; Ren, G.; Ran, B. Cascading Failure Analysis and Robustness Optimization of Metro Networks Based on Coupled Map Lattices: A Case Study of Nanjing, China. Transportation 2021, 48, 537–553. [Google Scholar] [CrossRef]
- Chen, H.; Zhang, L.; Liu, Q.; Wang, H.; Dai, X. Simulation-Based Vulnerability Assessment in Transit Systems with Cascade Failures. J. Clean. Prod. 2021, 295, 126441. [Google Scholar] [CrossRef]


Disclaimer/Publisher’s Note: The statements, opinions and data contained in all publications are solely those of the individual author(s) and contributor(s) and not of MDPI and/or the editor(s). MDPI and/or the editor(s) disclaim responsibility for any injury to people or property resulting from any ideas, methods, instructions or products referred to in the content. |
© 2023 by the authors. Licensee MDPI, Basel, Switzerland. This article is an open access article distributed under the terms and conditions of the Creative Commons Attribution (CC BY) license (https://creativecommons.org/licenses/by/4.0/).