
Spatial-Temporal Characteristics and Influencing Factors of Carbon Emissions from Land Use and Land Cover in Black Soil Region of Northeast China Based on LMDI Simulation
Abstract
:1. Introduction
2. Materials and Methods
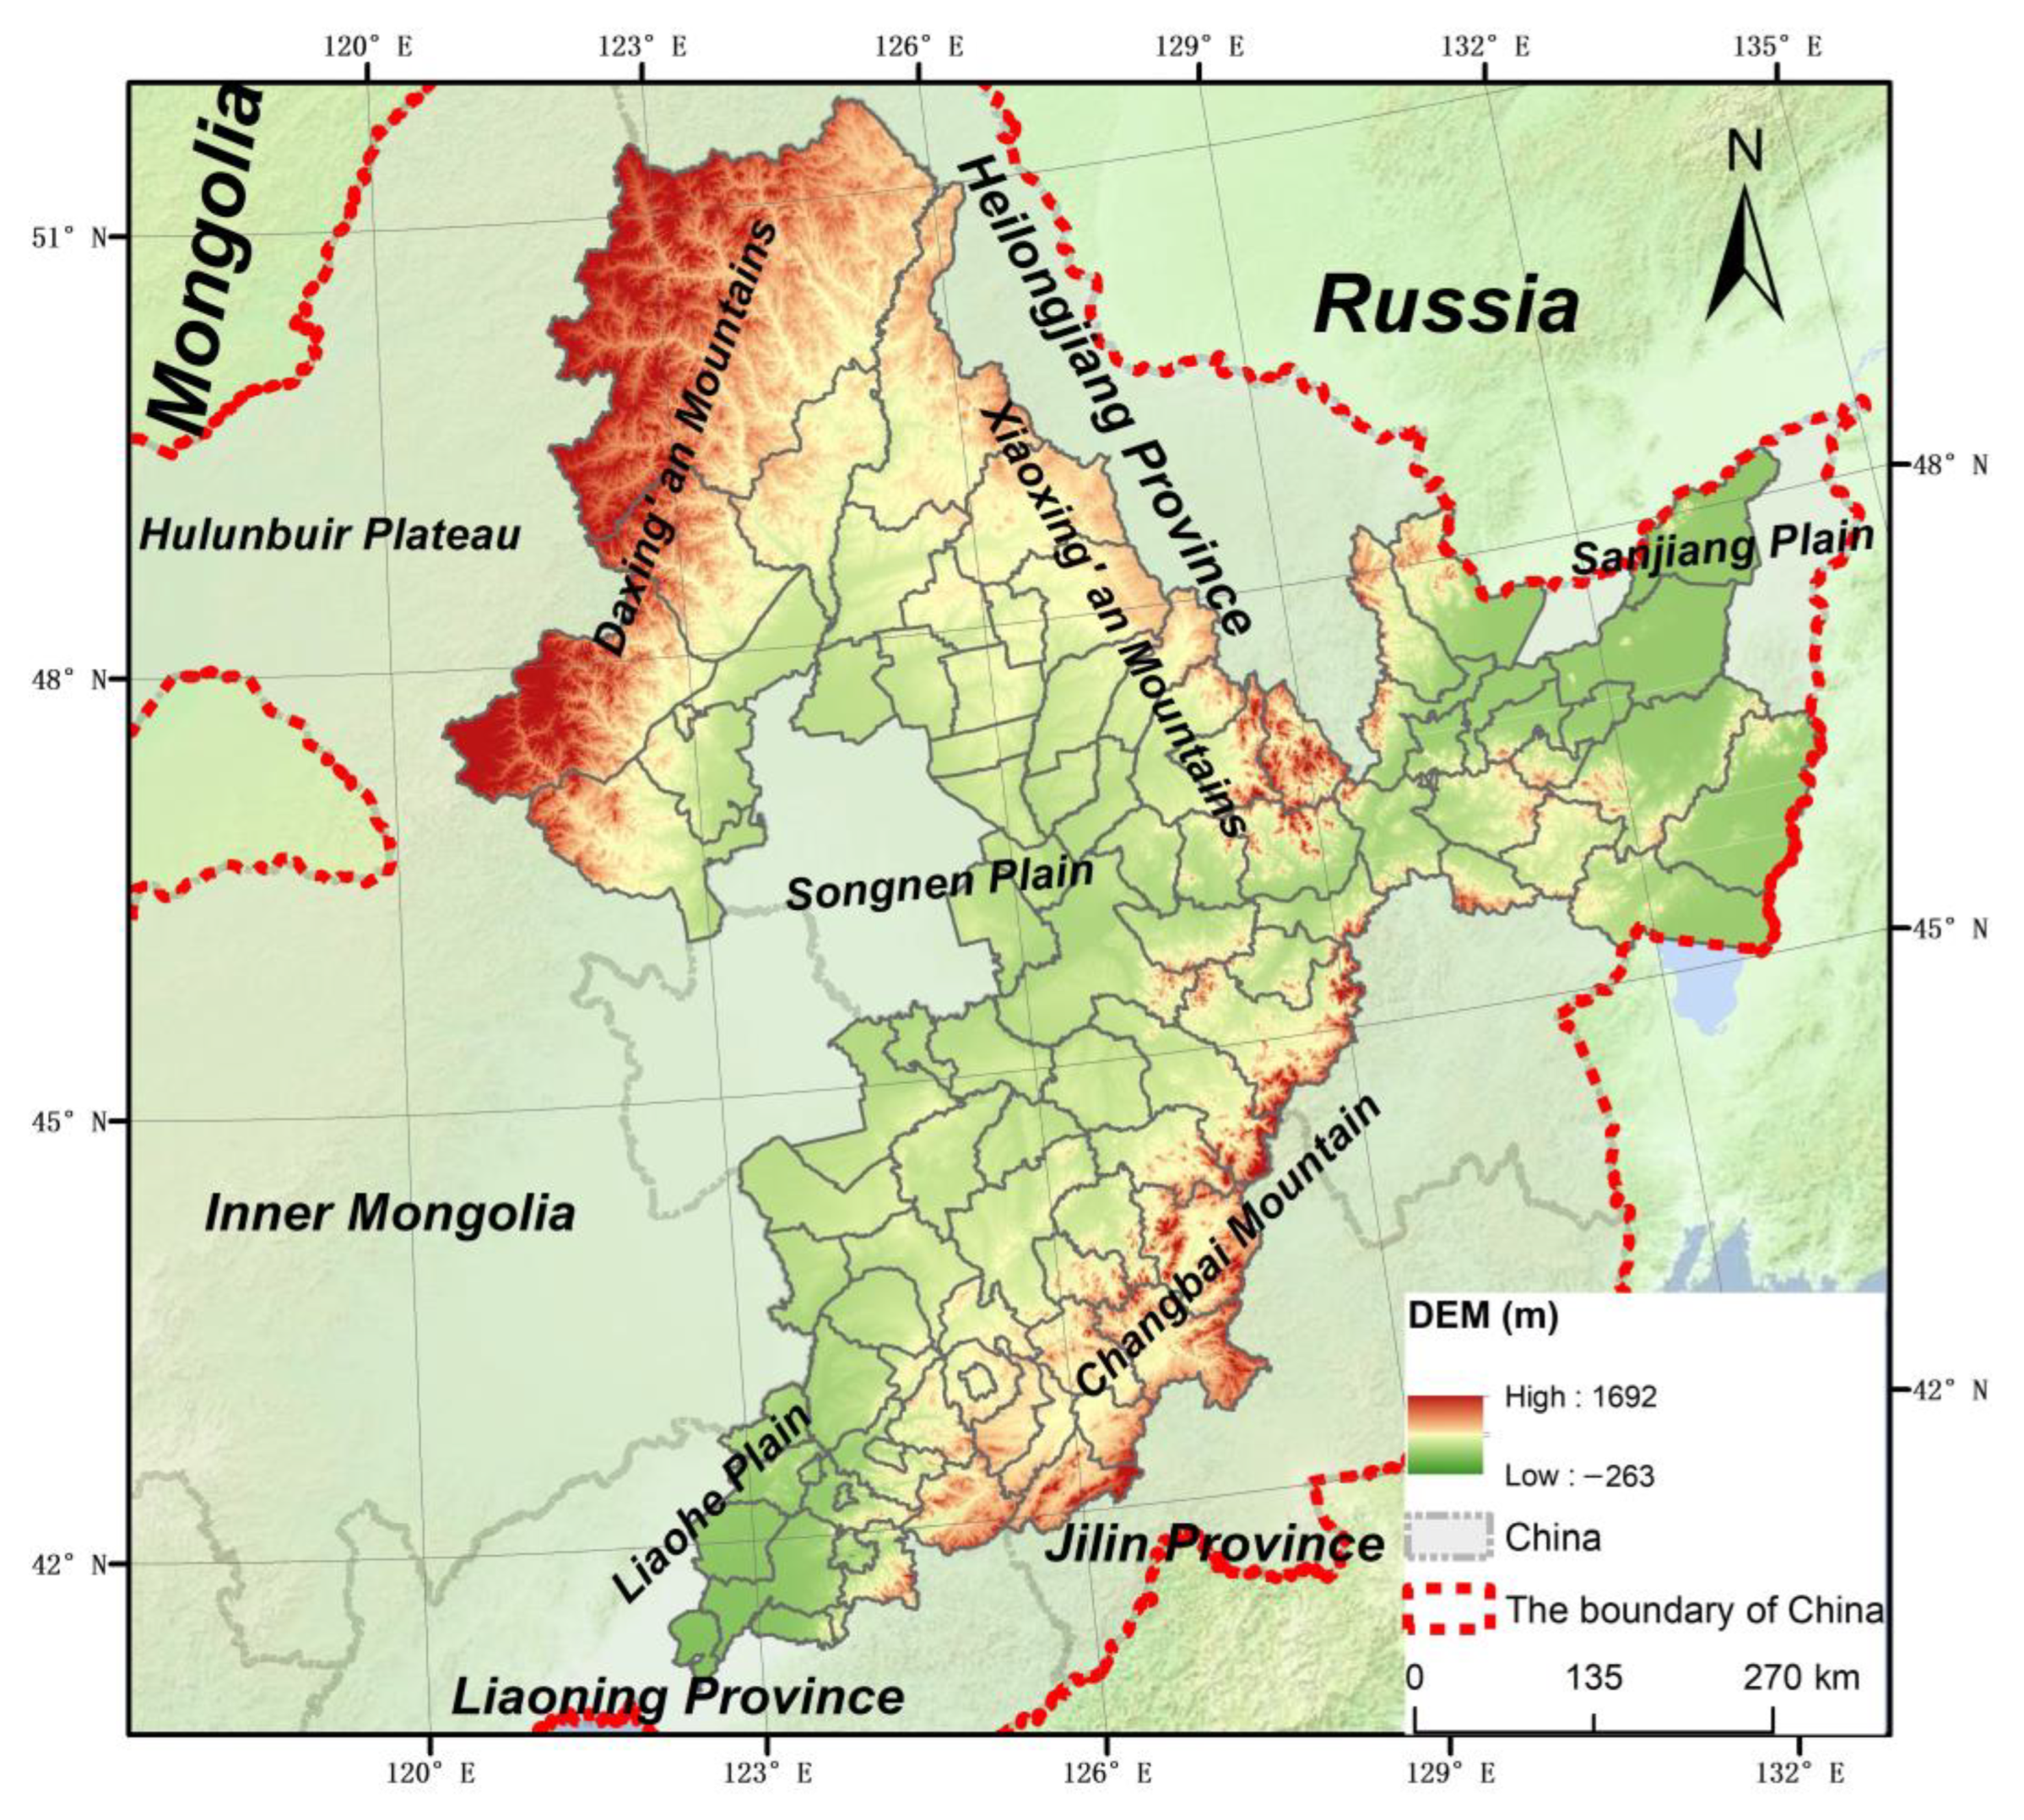
2.1. Study Area
2.2. Data Sources
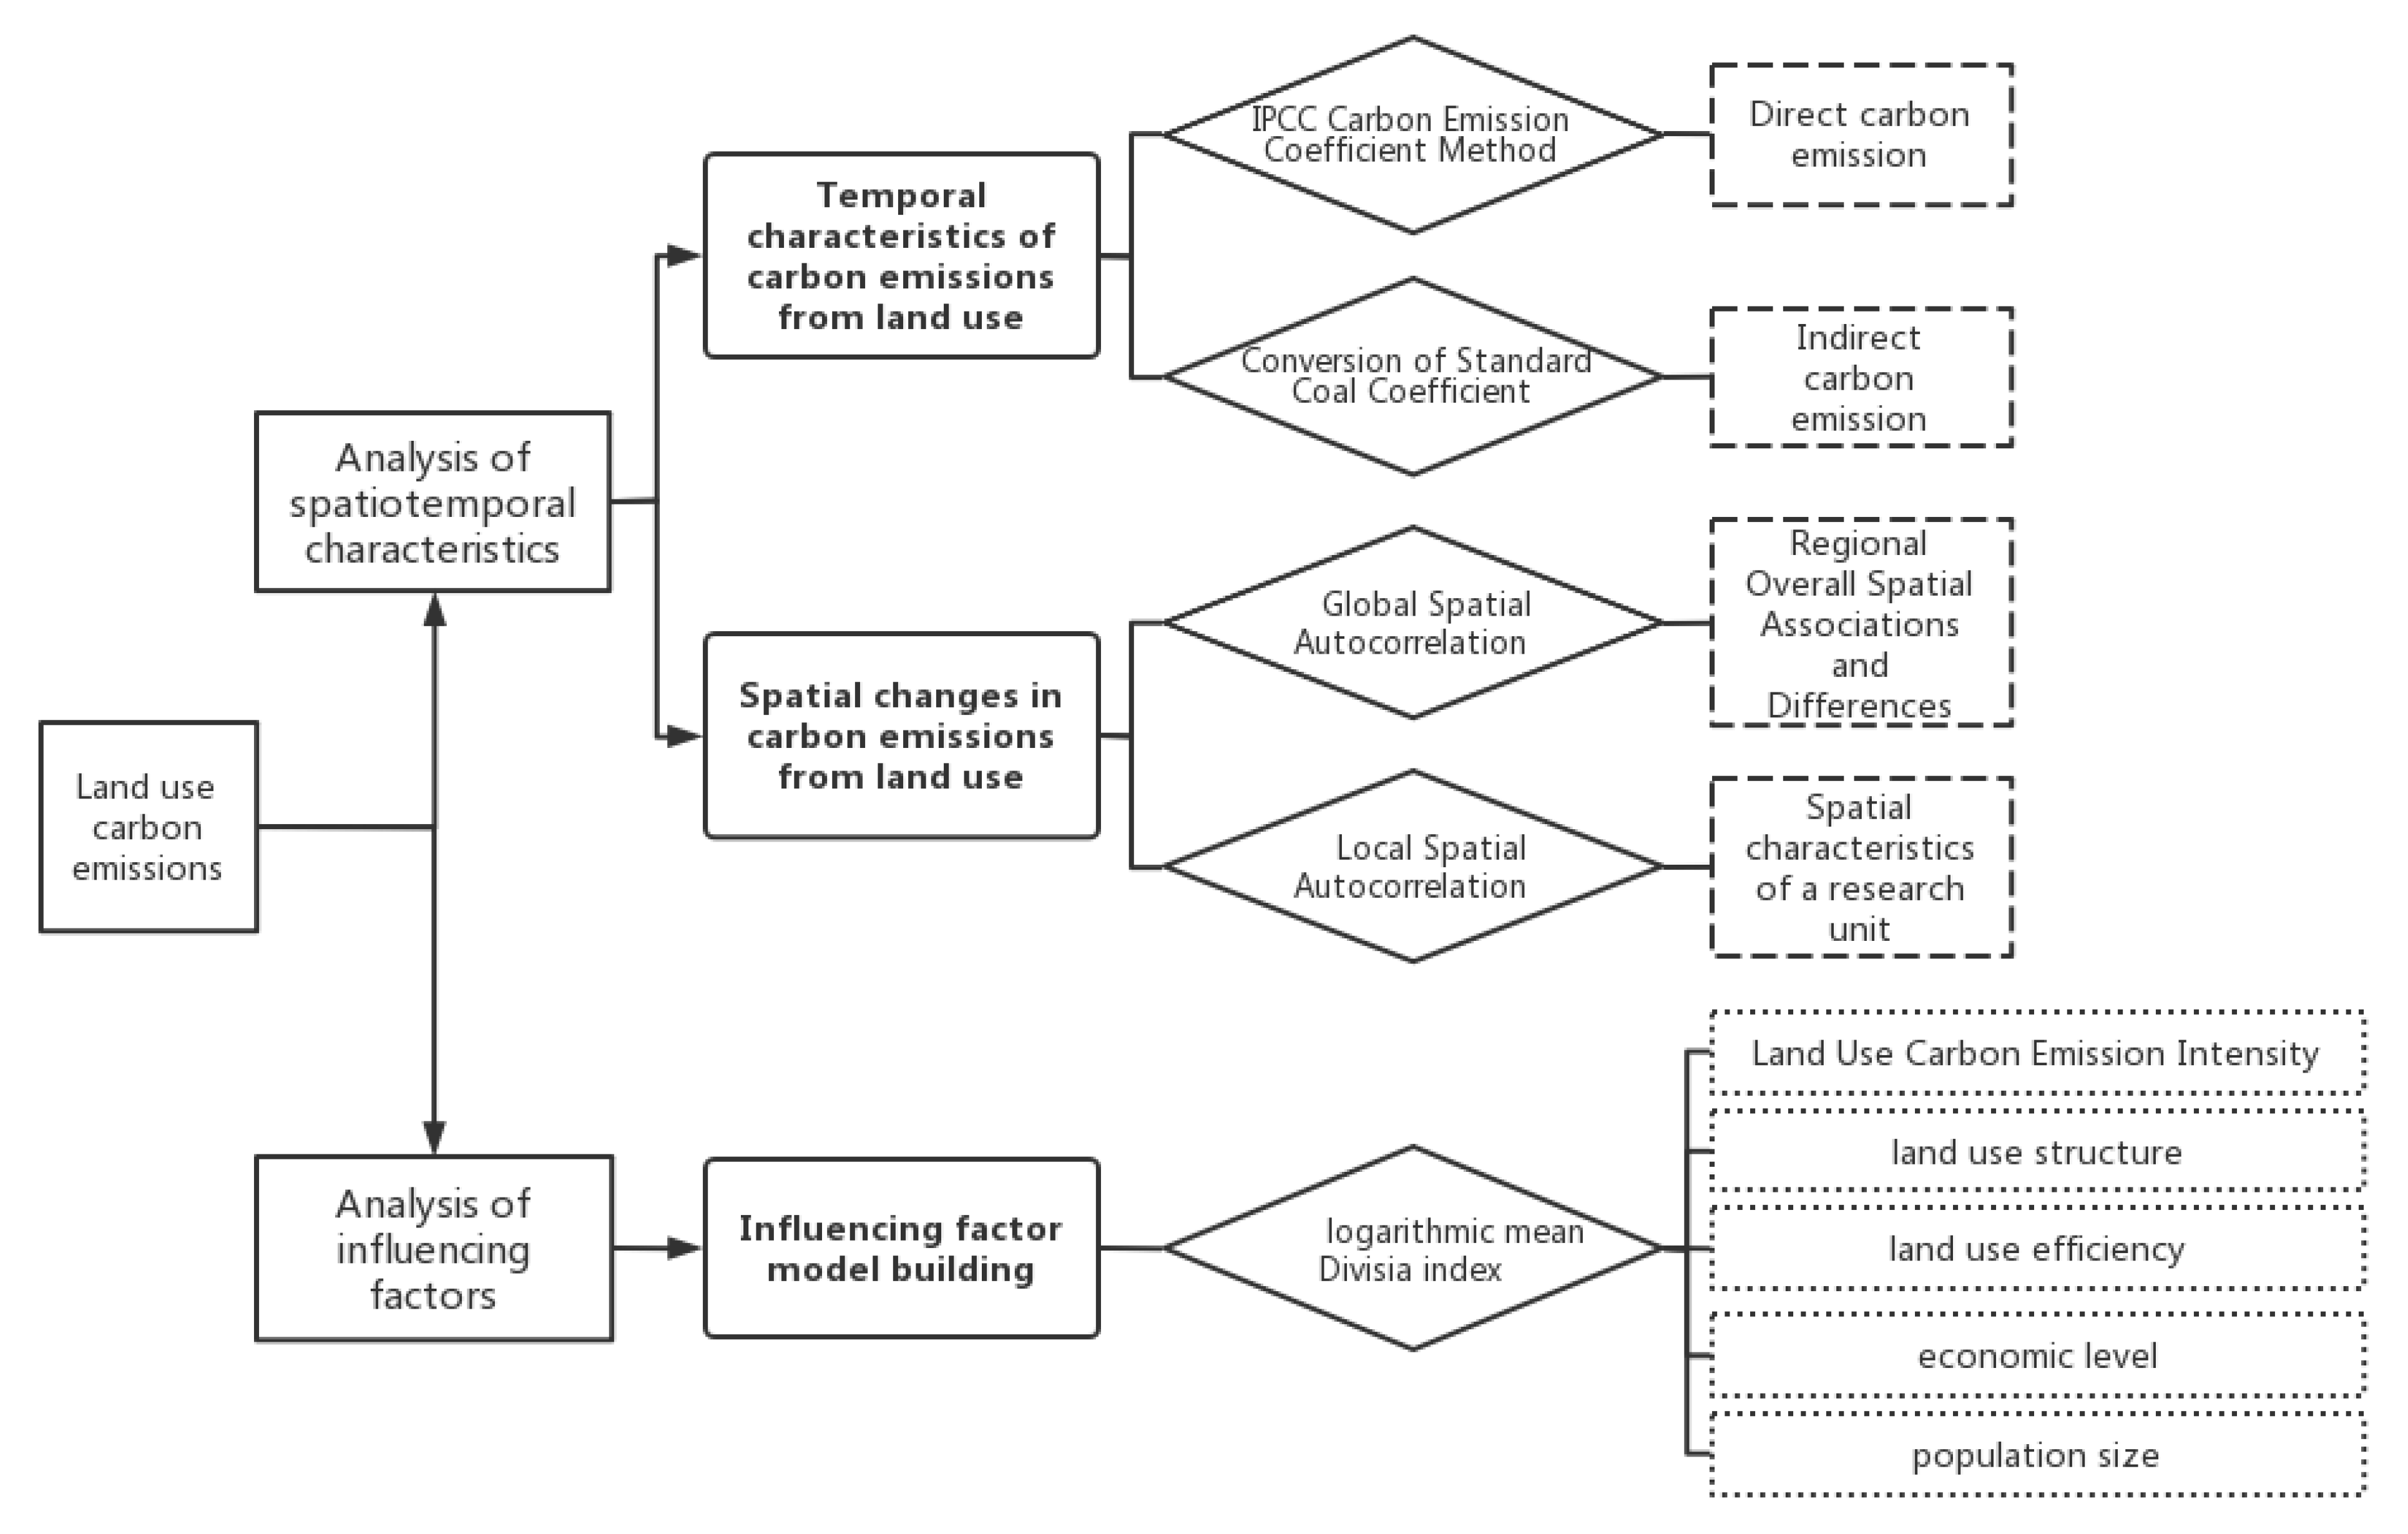
2.3. Methods
2.3.1. Computation of Carbon Storage Change Caused by LUCC
2.3.2. Spatial Autocorrelation
2.3.3. Factor Decomposition Method
3. Results
3.1. Spatio-Temporal Variation in Land Use Related Carbon Storage Change
3.1.1. Characteristics of Land Use Change in the BSRNC
3.1.2. The Overall Change Characteristics of Land Use Carbon Emissions from 1990 to 2020
3.1.3. Temporal Variation Characteristics of Land Use Carbon Emissions from 1990 to 2020
3.2. Analysis of Spatial Variation in Land Use Carbon Emissions
3.2.1. Global Autocorrelation Analysis
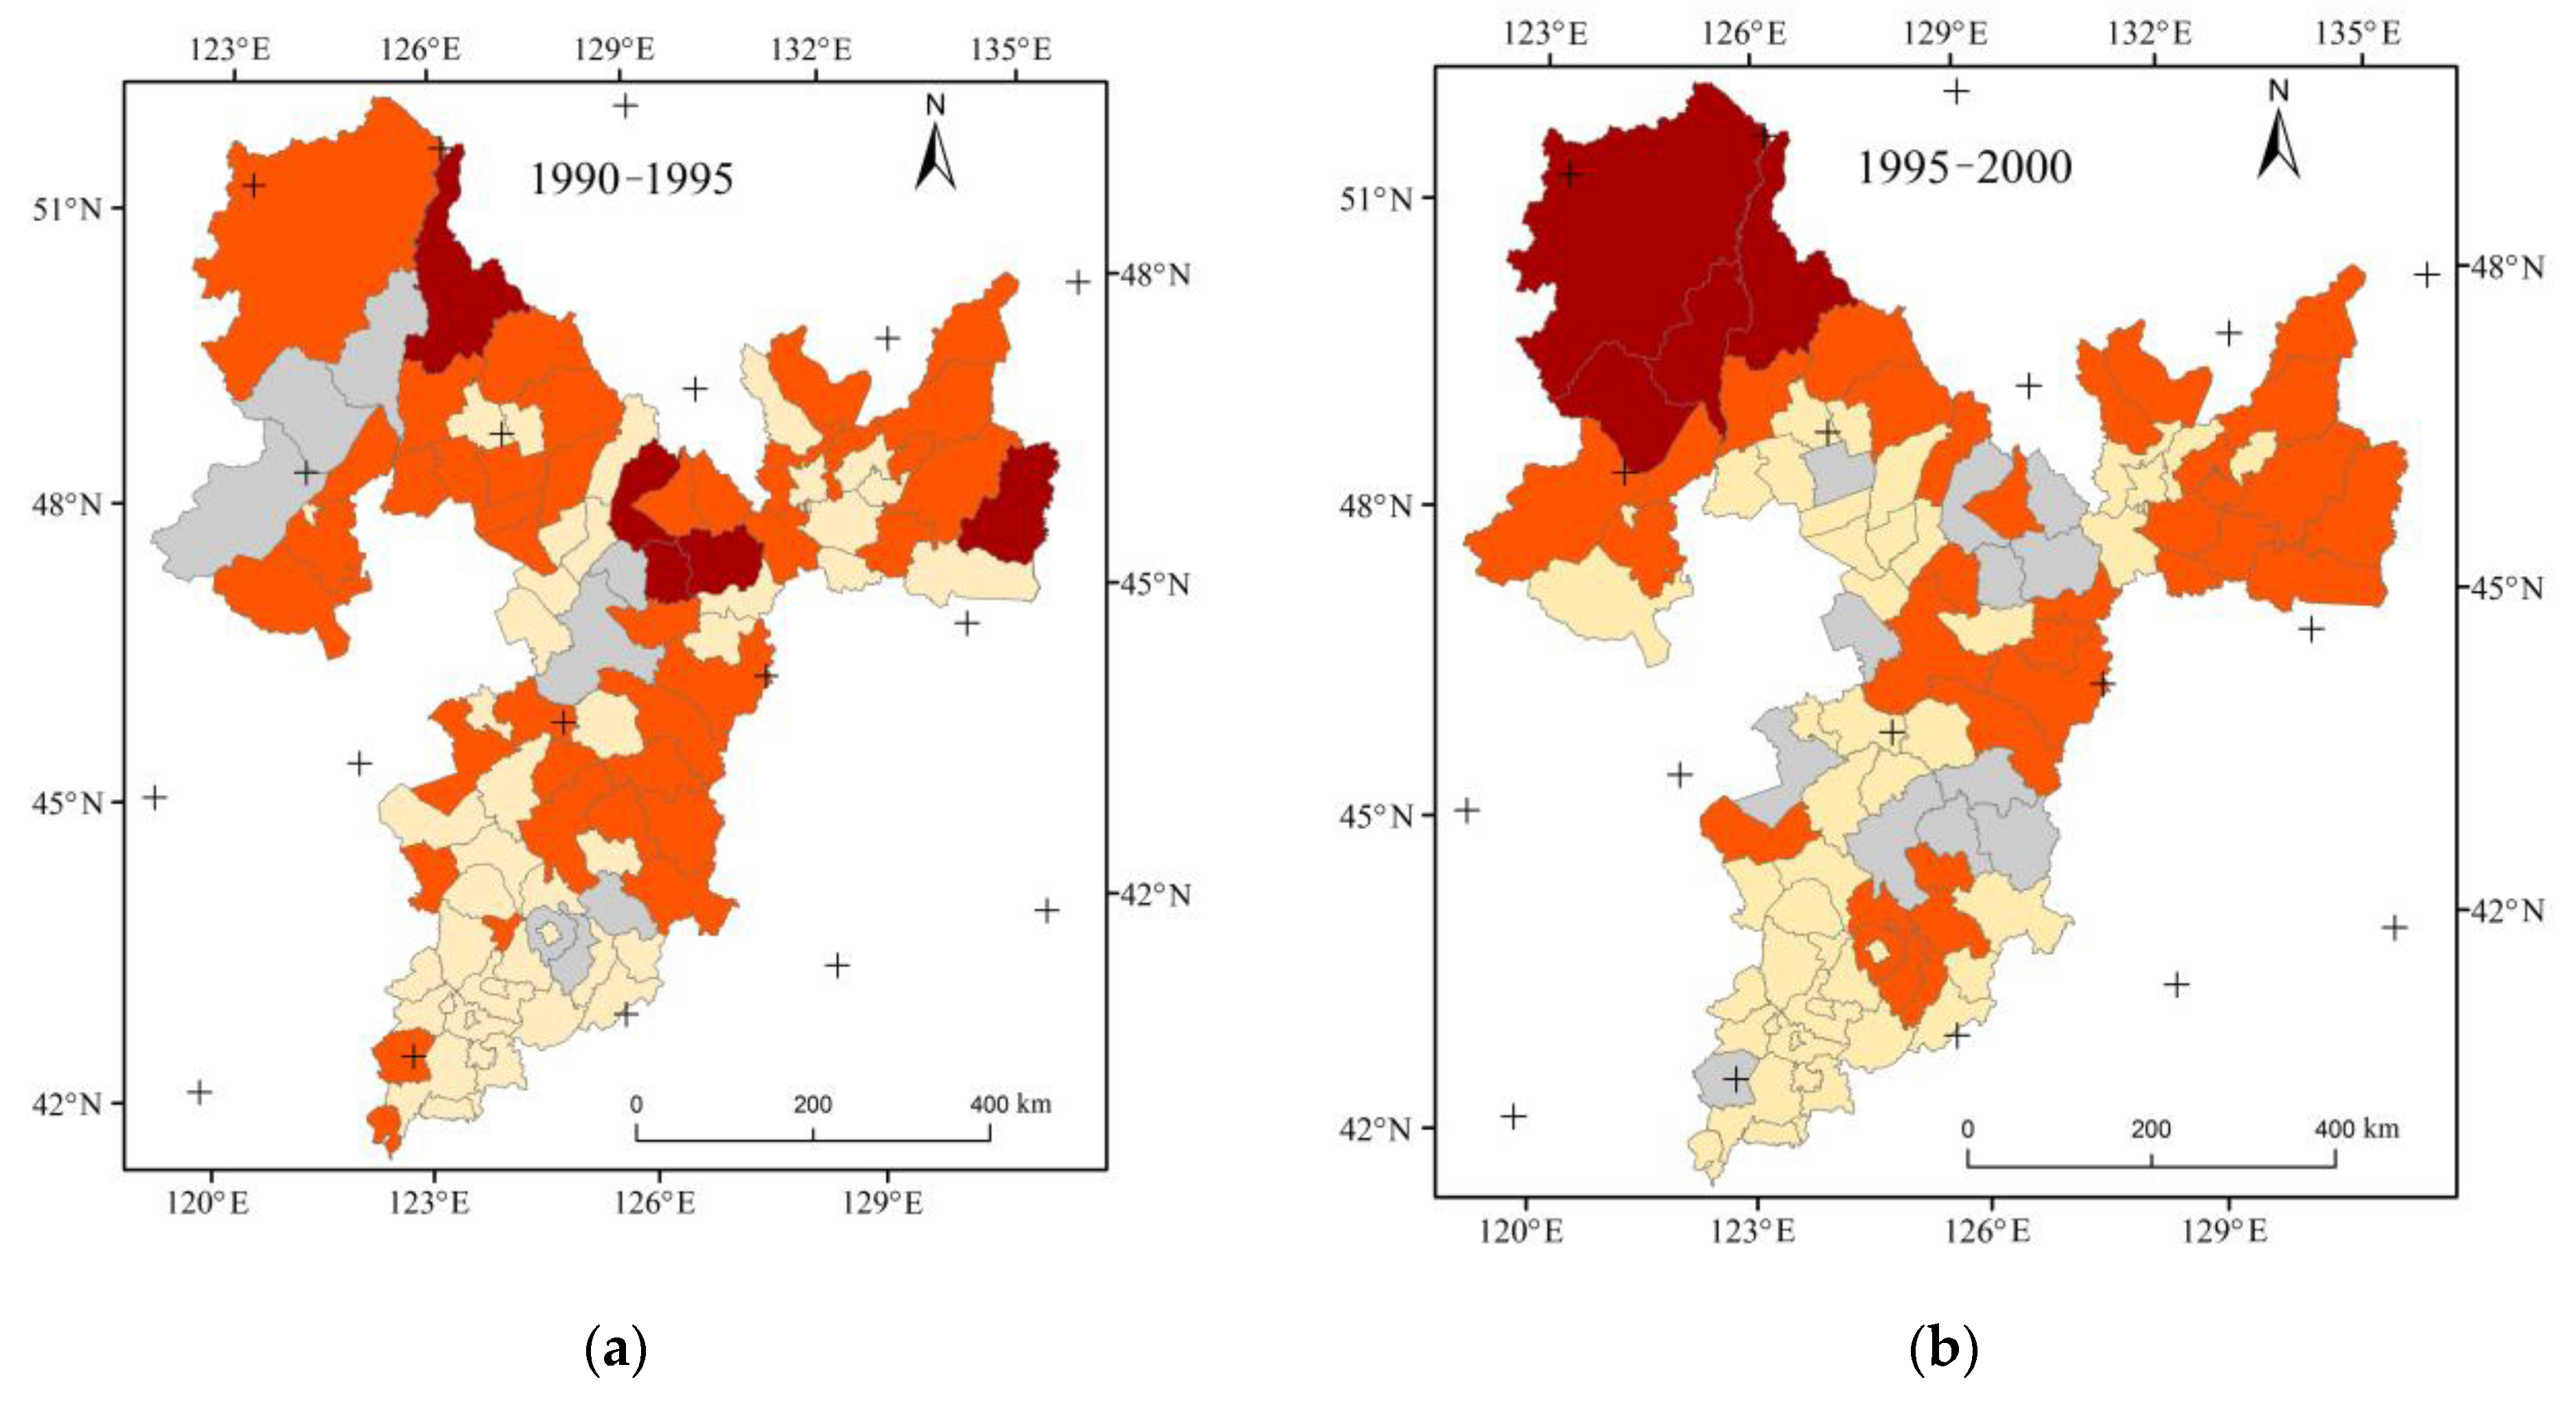
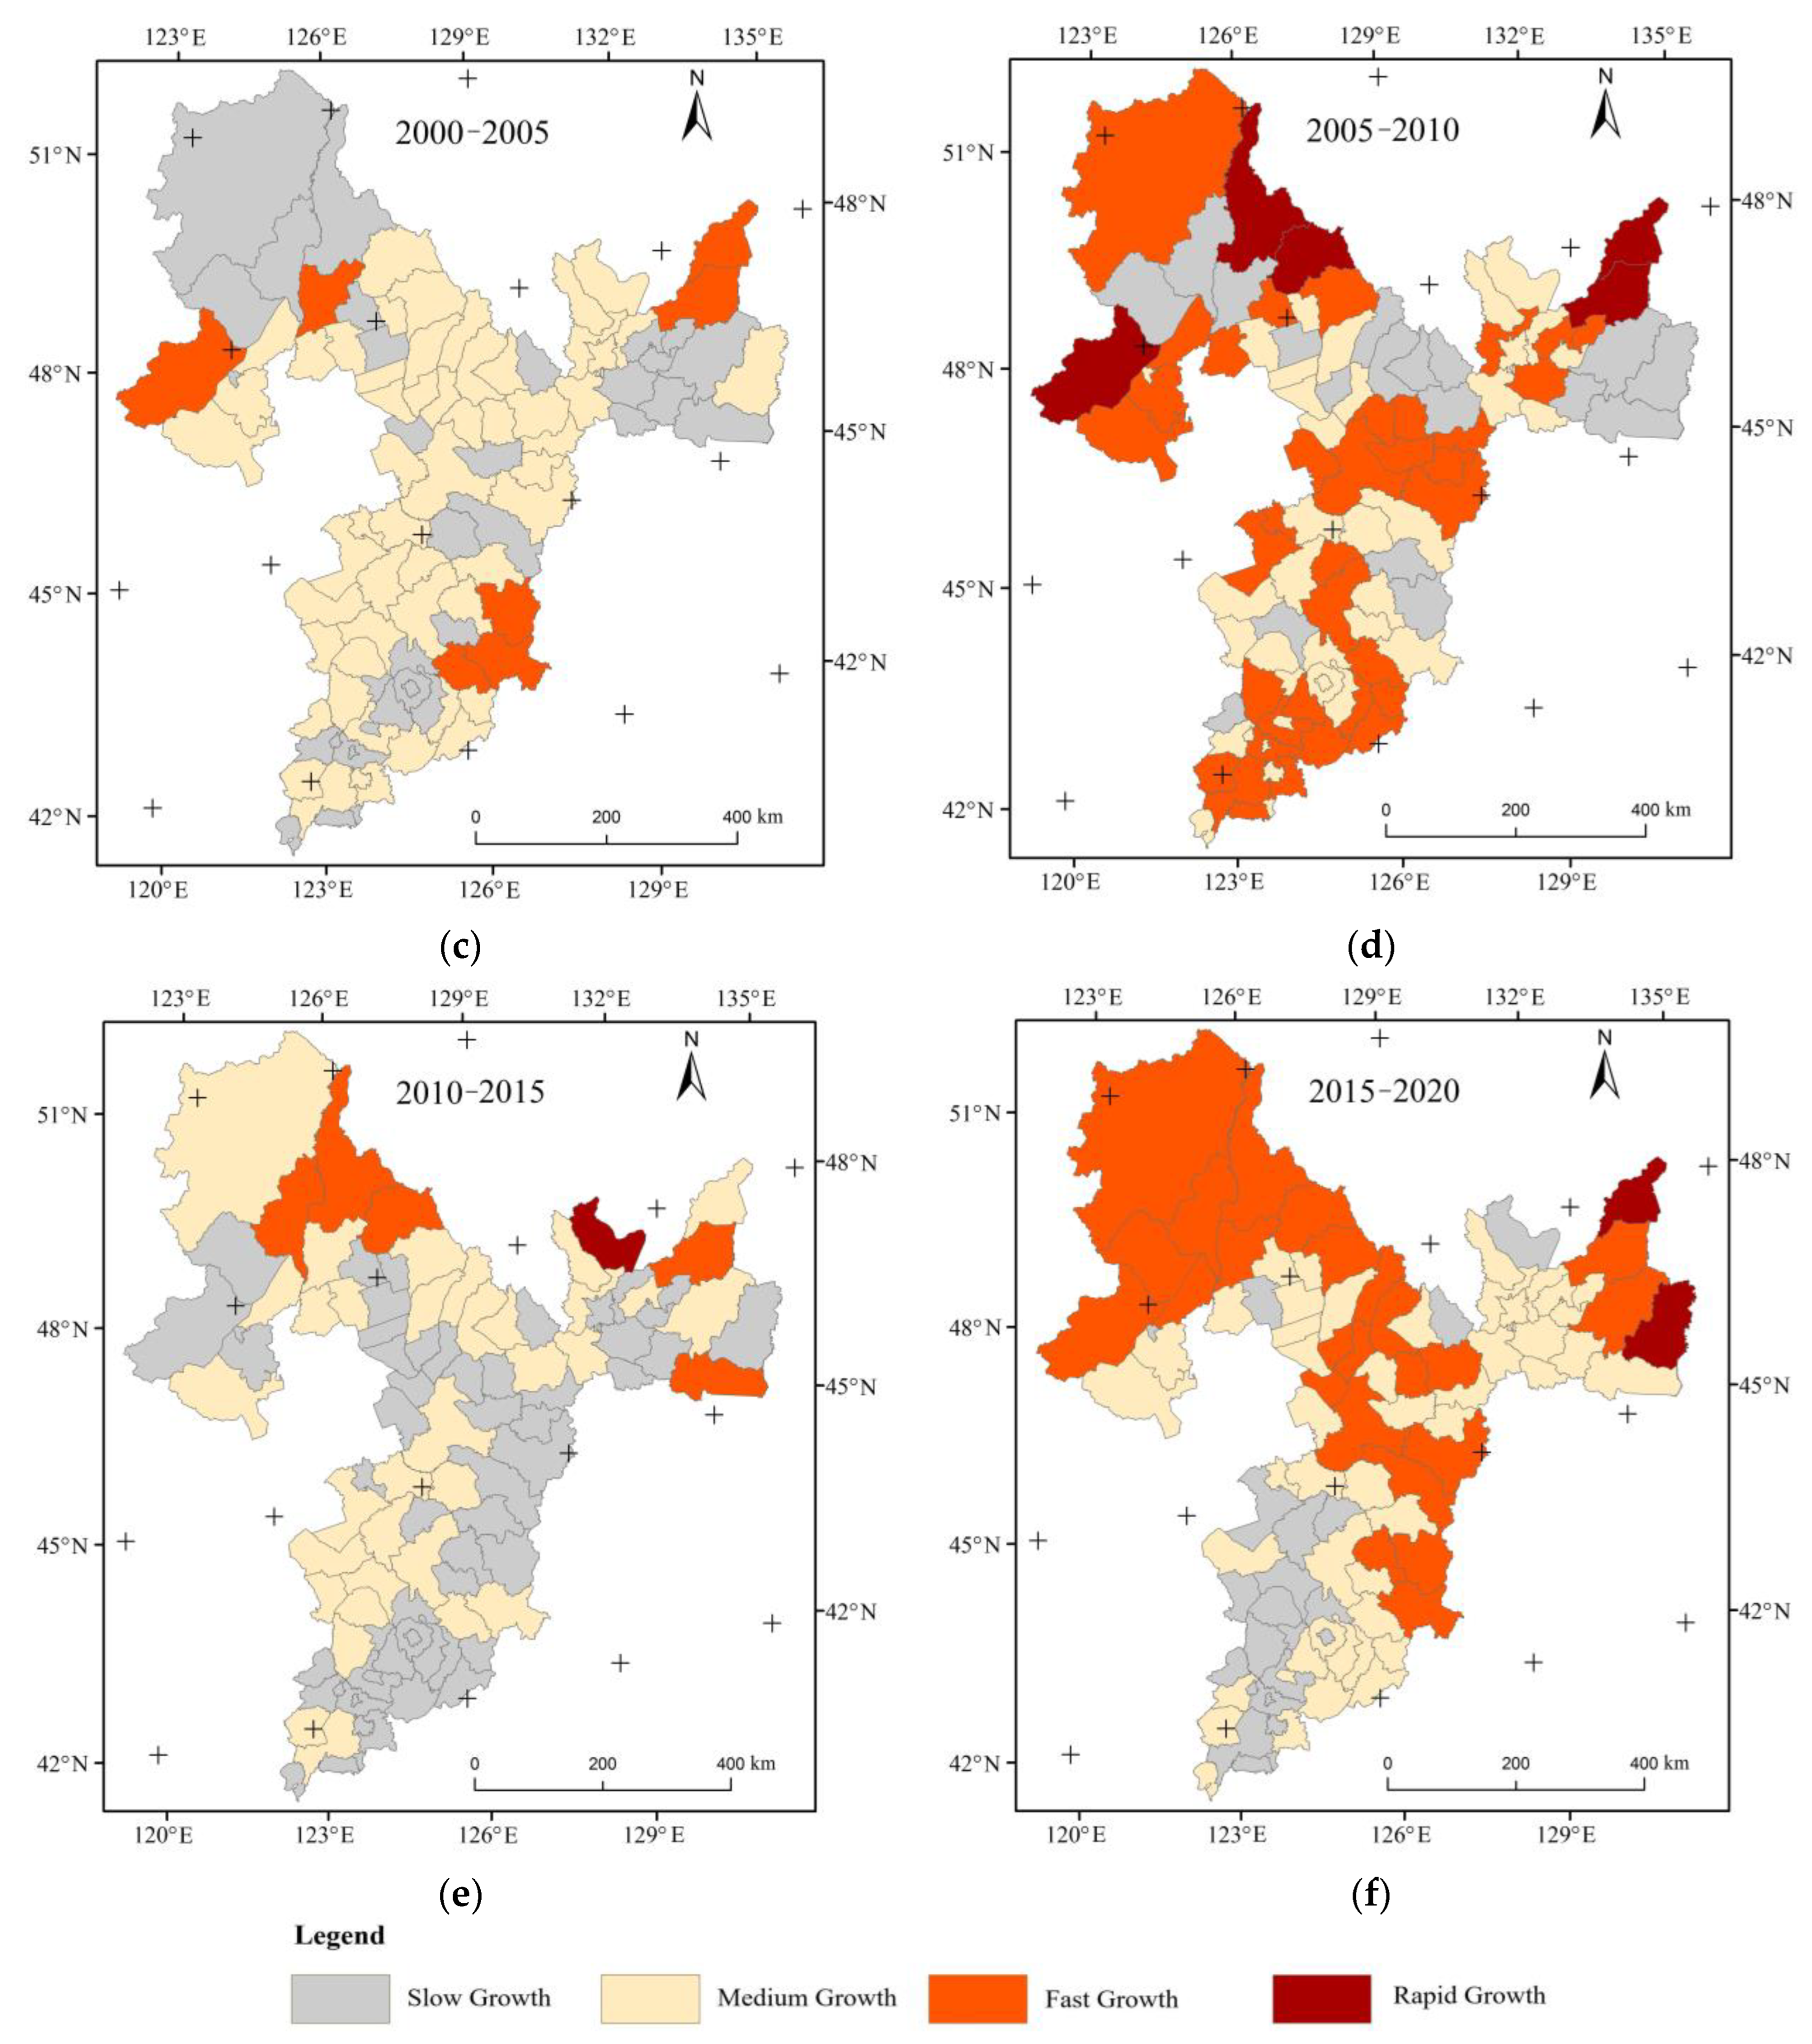
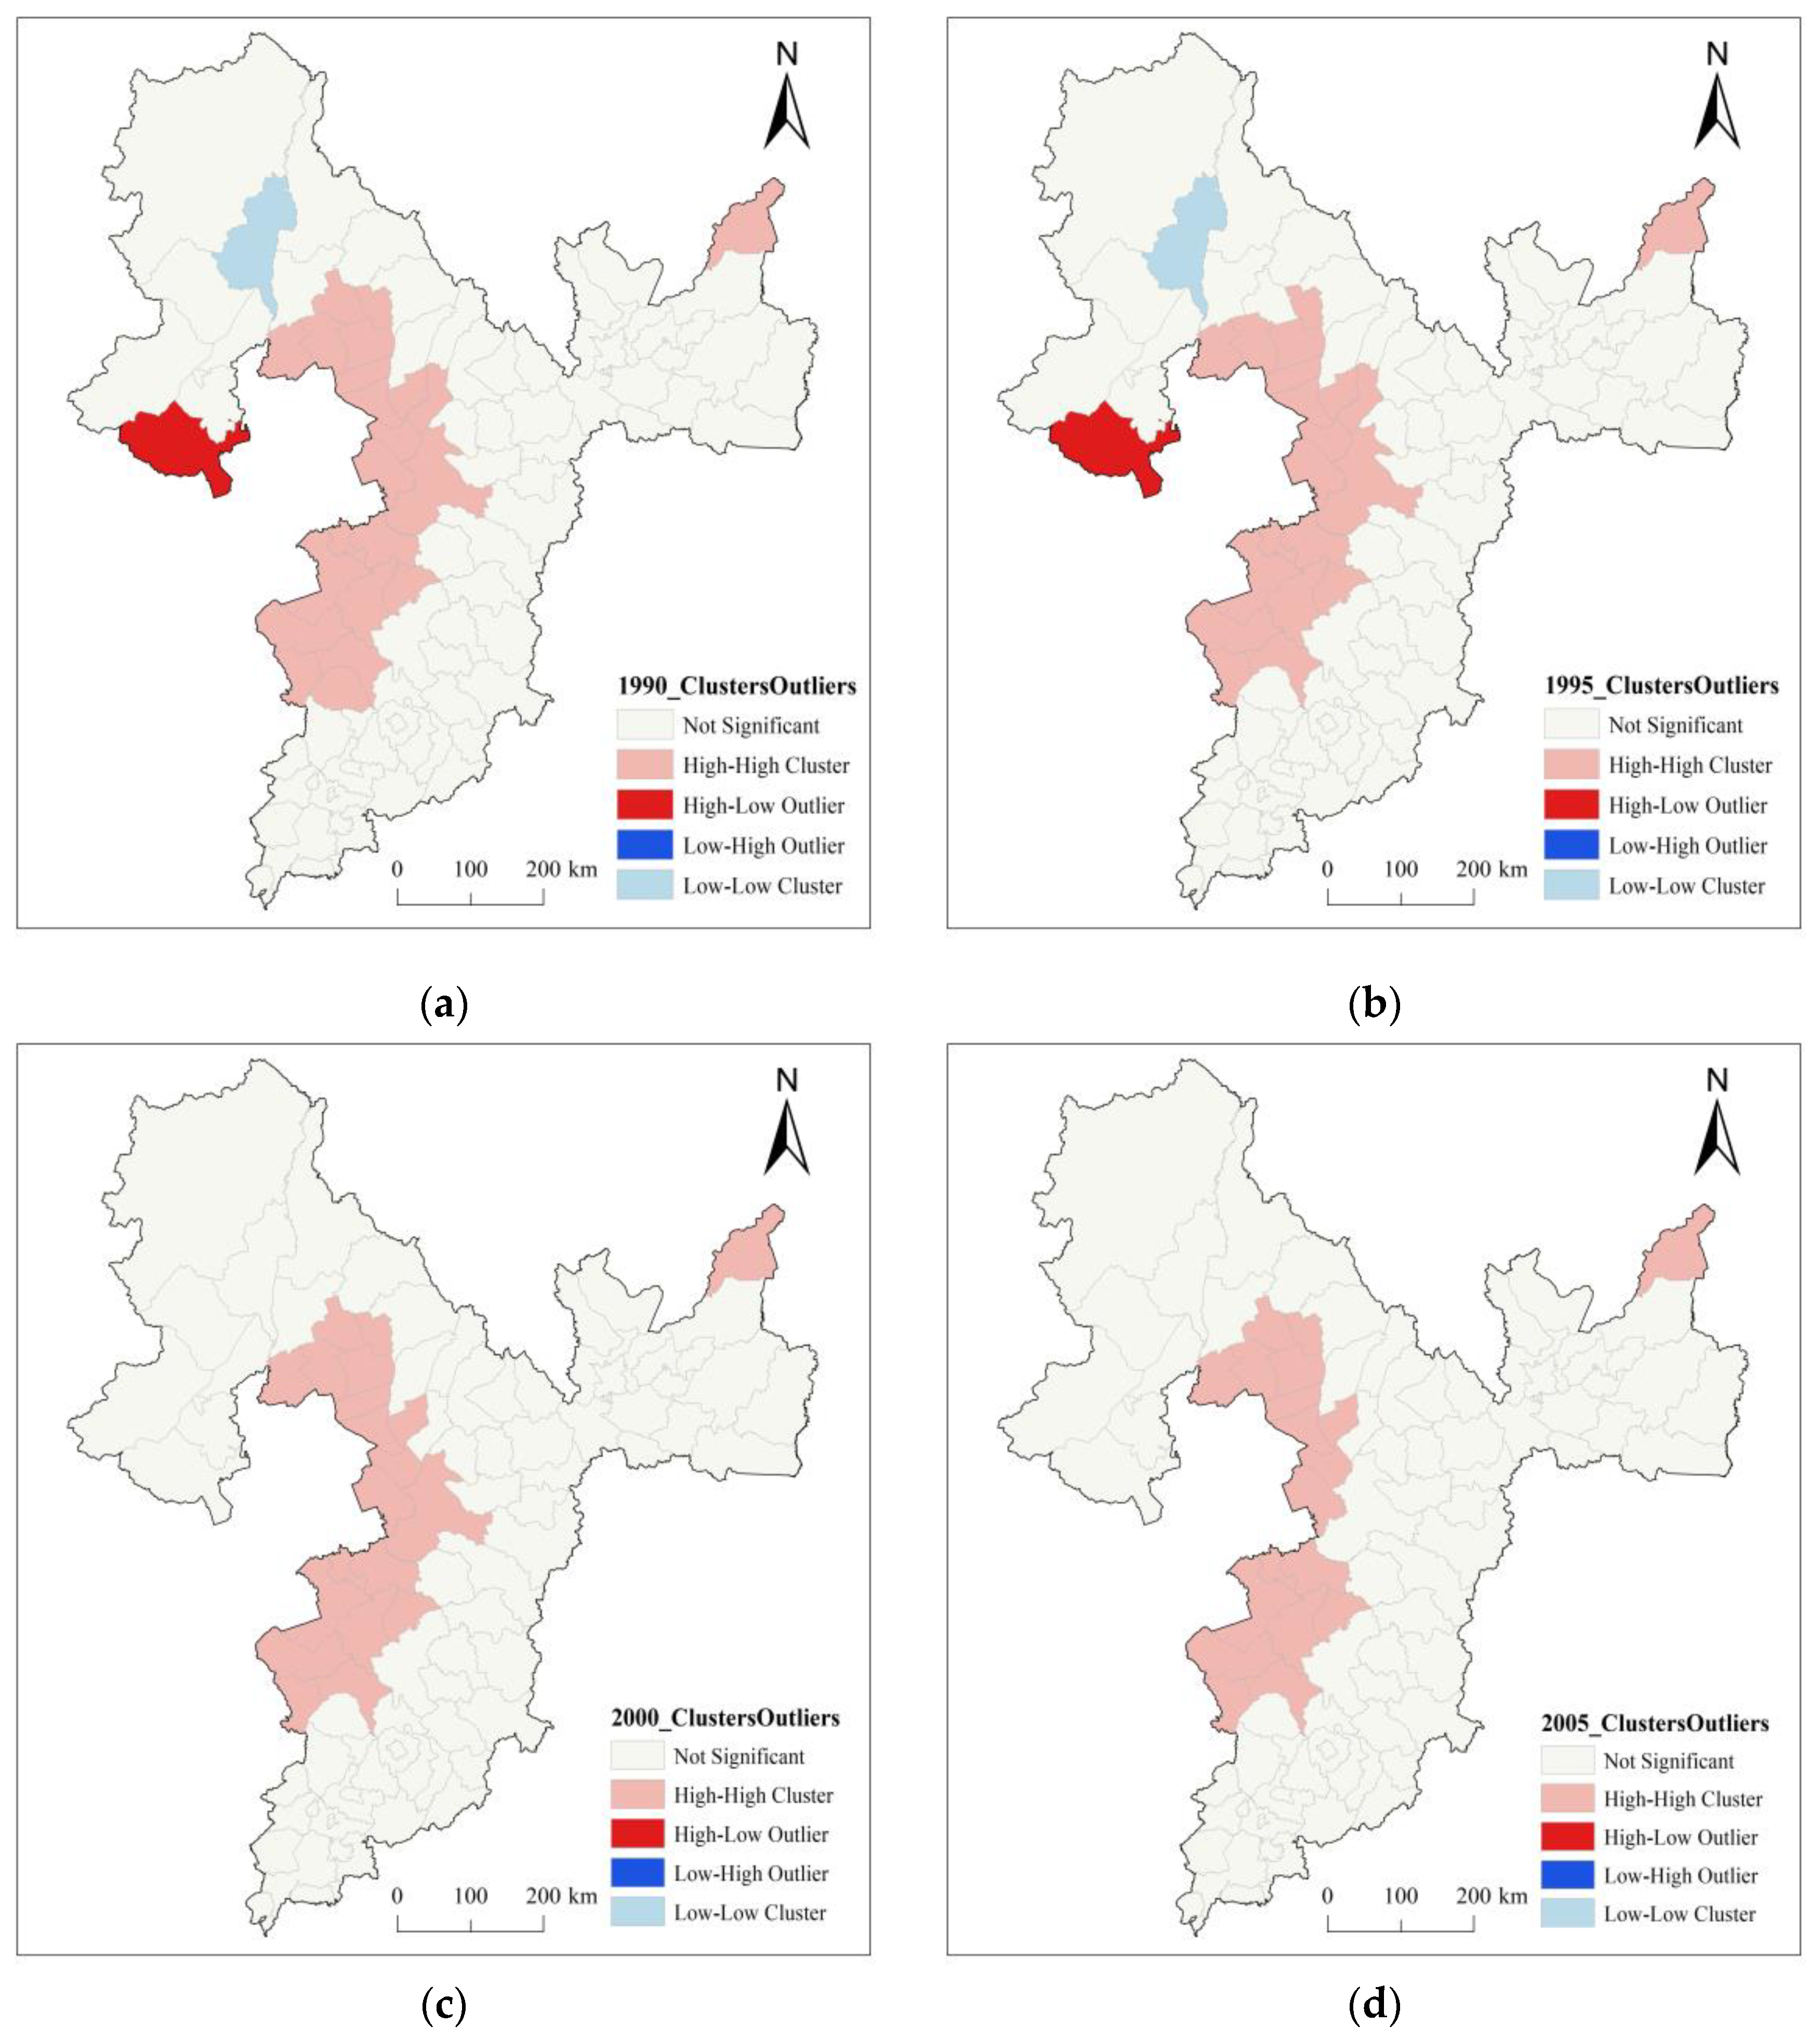
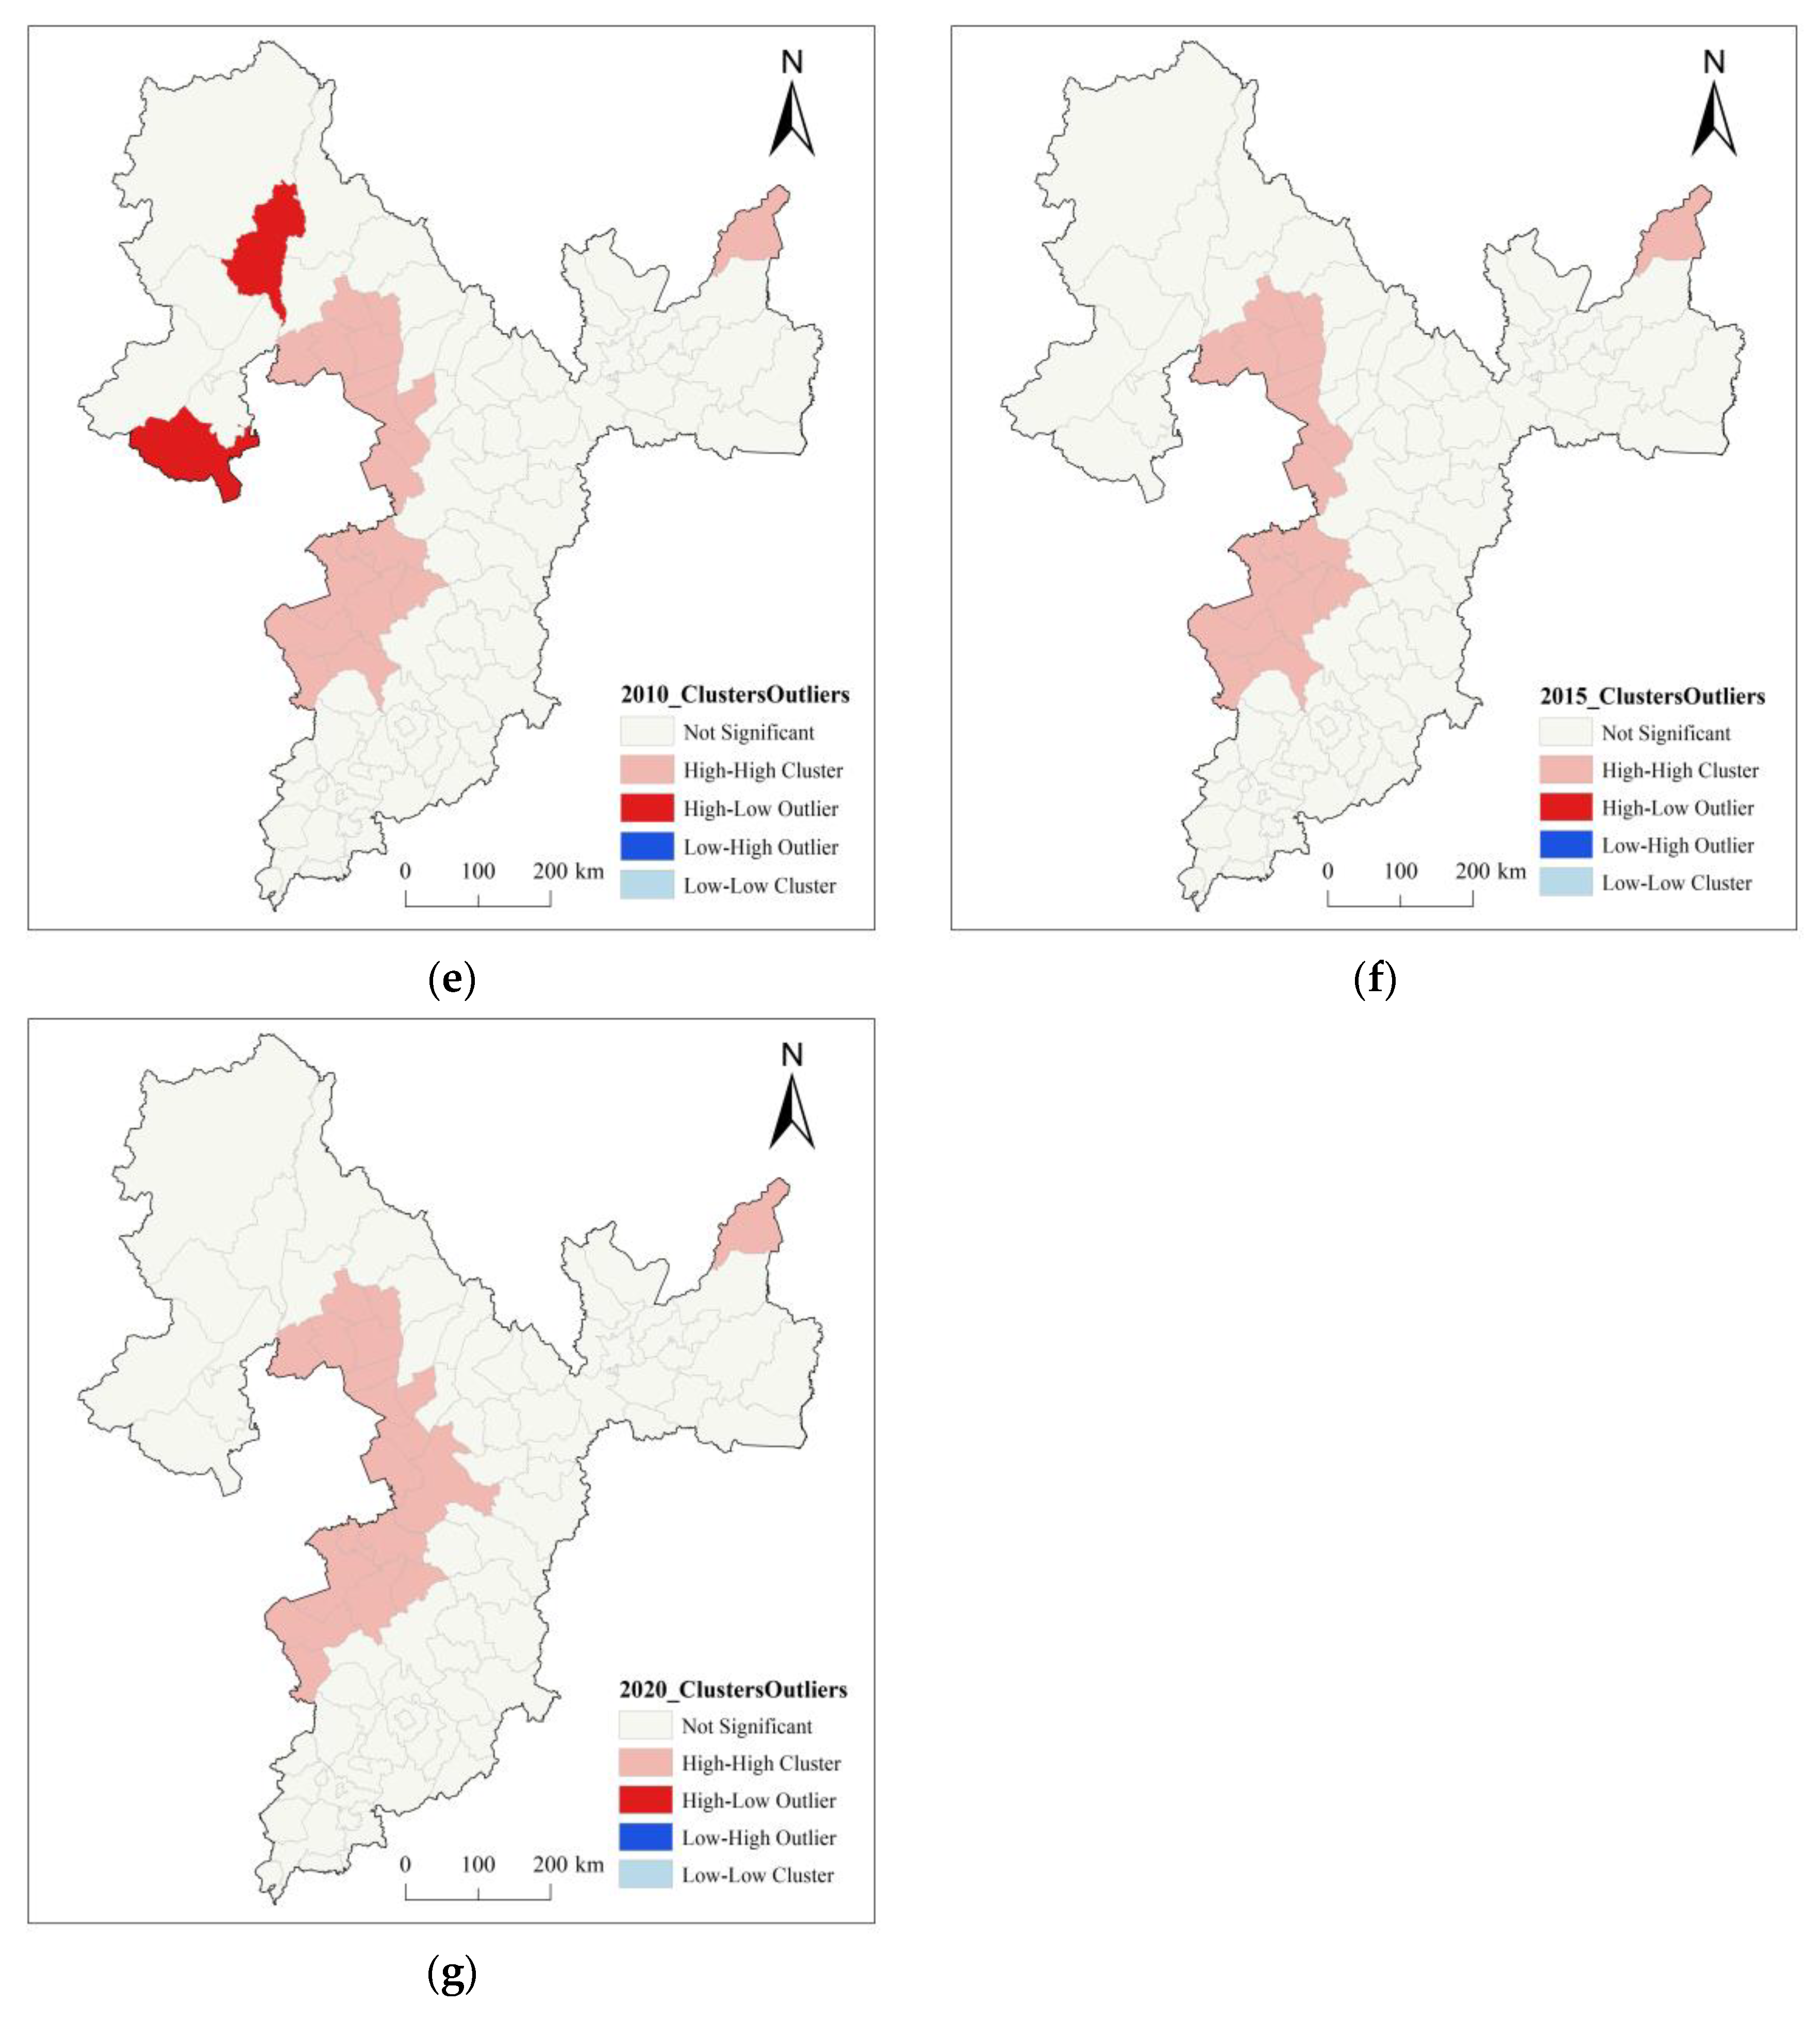
3.2.2. Local Autocorrelation Analysis
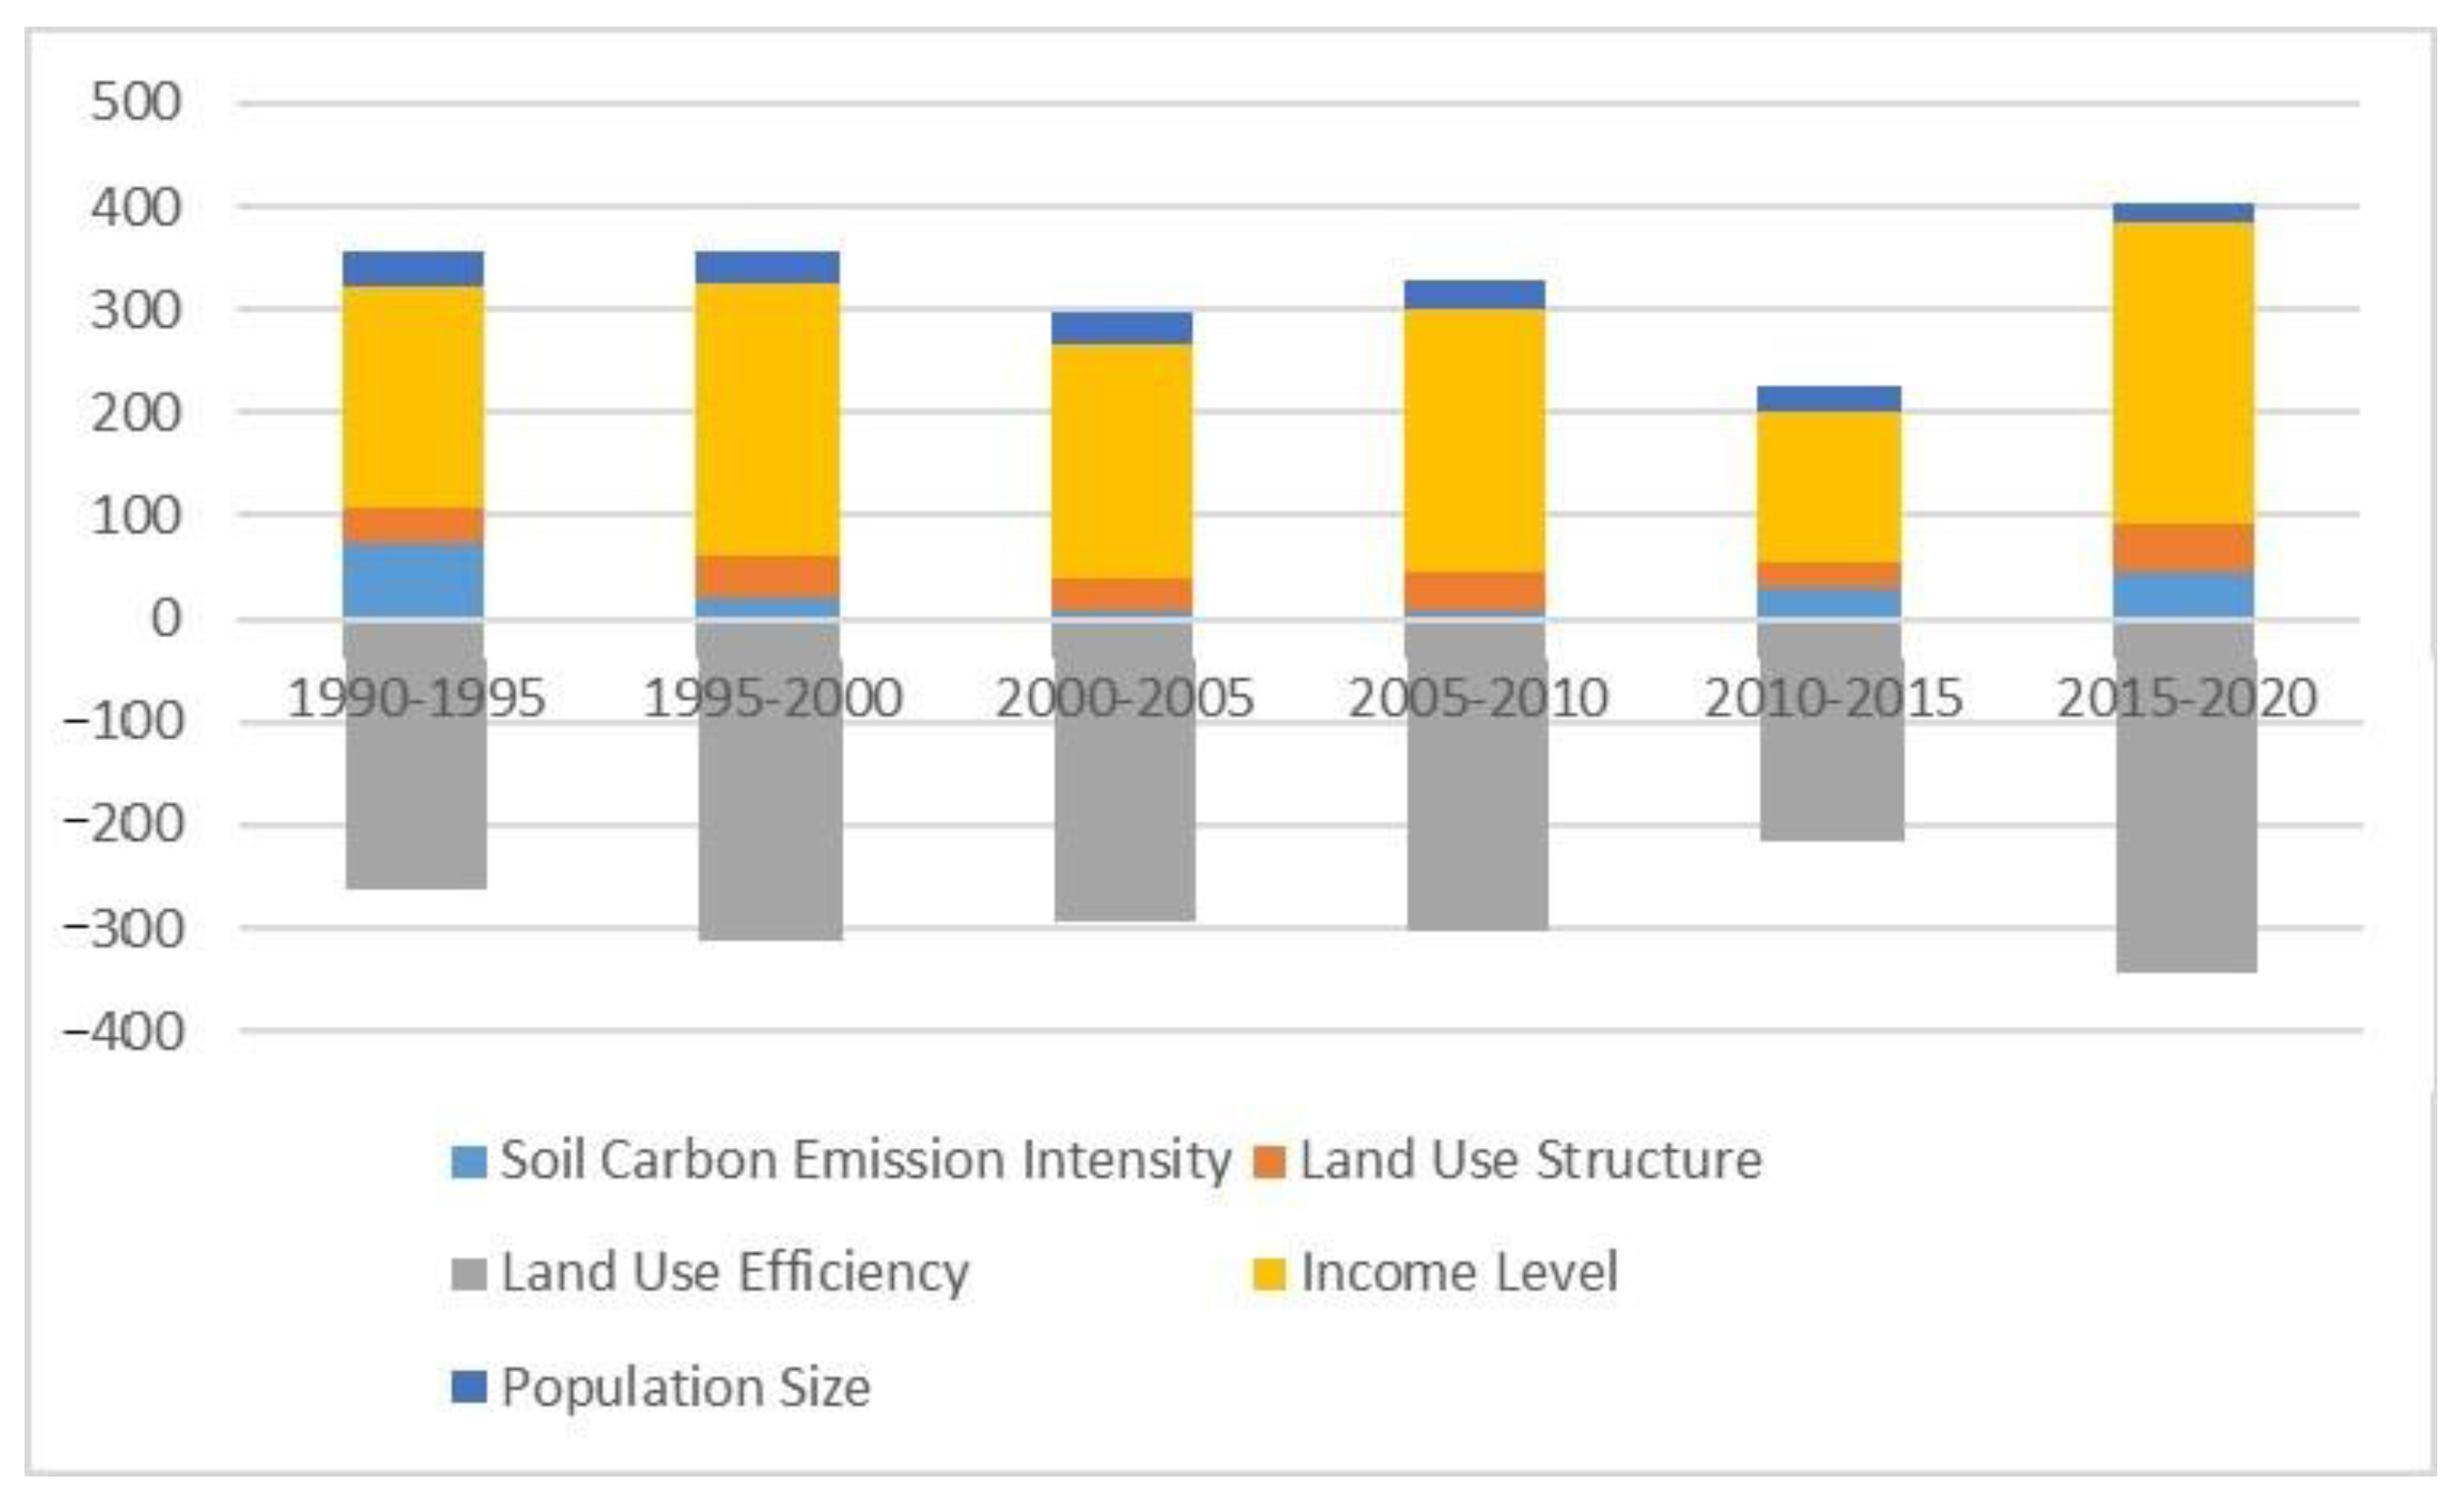
3.3. Decomposing the Influencing Factors of Land Use Related Carbon Emissions
4. Discussion
4.1. Interpretation of Findings
4.2. Policy Implications
5. Conclusions and Future Perspectives
5.1. Conclusions
5.2. Limitations and Future Directions
Author Contributions
Funding
Institutional Review Board Statement
Informed Consent Statement
Data Availability Statement
Conflicts of Interest
References
- Hu, M.; Li, Z.; Wang, Y.; Jiao, M.; Li, M.; Xia, B. Spatio-Temporal Changes in Ecosystem Service Value in Response to Land-Use/Cover Changes in the Pearl River Delta. Resour. Conserv. Recycl. 2019, 149, 106–114. [Google Scholar] [CrossRef]
- Cabral-Pinto, M.M.S.; Inácio, M.; Neves, O.; Almeida, A.A.; Pinto, E.; Oliveiros, B.; Ferreira da Silva, E.A. Human Health Risk Assessment Due to Agricultural Activities and Crop Consumption in the Surroundings of an Industrial Area. Expo Health 2020, 12, 629–640. [Google Scholar] [CrossRef]
- Cabral Pinto, M.M.S.; Ferreira da Silva, E.A. Heavy Metals of Santiago Island (Cape Verde) Alluvial Deposits: Baseline Value Maps and Human Health Risk Assessment. Int. J. Environ. Res. Public Health 2019, 16, 2. [Google Scholar] [CrossRef] [Green Version]
- Cao, W.; Yuan, X. Region-County Characteristic of Spatial-Temporal Evolution and Influencing Factor on Land Use-Related CO2 Emissions in Chongqing of China, 1997–2015. J. Clean. Prod. 2019, 231, 619–632. [Google Scholar] [CrossRef]
- Chase, T.N.; Pielke, R.A., Sr.; Kittel, T.G.F.; Nemani, R.R.; Running, S.W. Simulated Impacts of Historical Land Cover Changes on Global Climate in Northern Winter. Clim. Dyn. 2000, 16, 93–105. [Google Scholar] [CrossRef]
- Dixon, R.K.; Solomon, A.M.; Brown, S.; Houghton, R.A.; Trexier, M.C.; Wisniewski, J. Carbon Pools and Flux of Global Forest Ecosystems. Science 1994, 263, 185–190. [Google Scholar] [CrossRef]
- Lau, H.C.; Ramakrishna, S.; Zhang, K.; Radhamani, A.V. The Role of Carbon Capture and Storage in the Energy Transition. Energy Fuels 2021, 35, 7364–7386. [Google Scholar] [CrossRef]
- Hong, C.; Burney, J.A.; Pongratz, J.; Nabel, J.E.M.S.; Mueller, N.D.; Jackson, R.B.; Davis, S.J. Global and Regional Drivers of Land-Use Emissions in 1961–2017. Nature 2021, 589, 554–561. [Google Scholar] [CrossRef]
- Zhou, D.; Xiao, J.; Frolking, S.; Zhang, L.; Zhou, G. Urbanization Contributes Little to Global Warming but Substantially Intensifies Local and Regional Land Surface Warming. Earth’s Future 2022, 10, e2021EF002401. [Google Scholar] [CrossRef]
- Zhao, Y.; Ma, S.; Fan, J.; Cai, Y. Examining the Effects of Land Use on Carbon Emissions: Evidence from Pearl River Delta. Int. J. Environ. Res. Public Health 2021, 18, 3623. [Google Scholar] [CrossRef]
- Houghton, R.A. Magnitude, Distribution and Causes of Terrestrial Carbon Sinks and Some Implications for Policy. Clim. Policy 2002, 2, 71–88. [Google Scholar] [CrossRef]
- Quay, P.D.; Tilbrook, B.; Wong, C.S. Oceanic Uptake of Fossil Fuel CO2: Carbon-13 Evidence. Science 1992, 256, 74–79. [Google Scholar] [CrossRef] [PubMed] [Green Version]
- Wei, Y.-M.; Han, R.; Wang, C.; Yu, B.; Liang, Q.-M.; Yuan, X.-C.; Chang, J.; Zhao, Q.; Liao, H.; Tang, B.; et al. Self-Preservation Strategy for Approaching Global Warming Targets in the Post-Paris Agreement Era. Nat. Commun. 2020, 11, 1624. [Google Scholar] [CrossRef] [PubMed] [Green Version]
- Houghton, R.A.; House, J.I.; Pongratz, J.; van der Werf, G.R.; DeFries, R.S.; Hansen, M.C.; Le Quéré, C.; Ramankutty, N. Carbon Emissions from Land Use and Land-Cover Change. Biogeosciences 2012, 9, 5125–5142. [Google Scholar] [CrossRef] [Green Version]
- Zhu, E.; Deng, J.; Zhou, M.; Gan, M.; Jiang, R.; Wang, K.; Shahtahmassebi, A. Carbon Emissions Induced by Land-Use and Land-Cover Change from 1970 to 2010 in Zhejiang, China. Sci. Total Environ. 2019, 646, 930–939. [Google Scholar] [CrossRef]
- Knodt, M.; Schoenefeld, J.J. Harder Soft Governance in European Climate and Energy Policy: Exploring a New Trend in Public Policy. J. Environ. Policy Plan. 2020, 22, 761–773. [Google Scholar] [CrossRef]
- Höhne, N.; Gidden, M.J.; den Elzen, M.; Hans, F.; Fyson, C.; Geiges, A.; Jeffery, M.L.; Gonzales-Zuñiga, S.; Mooldijk, S.; Hare, W.; et al. Wave of Net Zero Emission Targets Opens Window to Meeting the Paris Agreement. Nat. Clim. Change 2021, 11, 820–822. [Google Scholar] [CrossRef]
- Yan, H.; Guo, X.; Zhao, S.; Yang, H. Variation of Net Carbon Emissions from Land Use Change in the Beijing-Tianjin-Hebei Region during 1990–2020. Land 2022, 11, 997. [Google Scholar] [CrossRef]
- Zhao, L.; Huang, W.; Chen, J.; Dong, Y.; Ren, B.; Geng, Y. Land Use/Cover Changes in the Oriental Migratory Locust Area of China: Implications for Ecological Control and Monitoring of Locust Area. Agric. Ecosyst. Environ. 2020, 303, 107110. [Google Scholar] [CrossRef]
- Rosan, T.M.; Goldewijk, K.K.; Ganzenmüller, R.; O’Sullivan, M.; Pongratz, J.; Mercado, L.M.; Aragao, L.E.O.C.; Heinrich, V.; Randow, C.V.; Wiltshire, A.; et al. A Multi-Data Assessment of Land Use and Land Cover Emissions from Brazil during 2000–2019. Environ. Res. Lett. 2021, 16, 074004. [Google Scholar] [CrossRef]
- Lin, Q.; Zhang, L.; Qiu, B.; Zhao, Y.; Wei, C. Spatiotemporal Analysis of Land Use Patterns on Carbon Emissions in China. Land 2021, 10, 141. [Google Scholar] [CrossRef]
- Si, R.; Aziz, N.; Raza, A. Short and Long-Run Causal Effects of Agriculture, Forestry, and Other Land Use on Greenhouse Gas Emissions: Evidence from China Using VECM Approach. Environ. Sci. Pollut. Res 2021, 28, 64419–64430. [Google Scholar] [CrossRef] [PubMed]
- Dong, N.; Liu, Z.; Luo, M.; Fang, C.; Lin, H. The Effects of Anthropogenic Land Use Changes on Climate in China Driven by Global Socioeconomic and Emission Scenarios. Earth’s Future 2019, 7, 784–804. [Google Scholar] [CrossRef] [Green Version]
- Gregg, J.S.; Andres, R.J.; Marland, G. China: Emissions Pattern of the World Leader in CO2 Emissions from Fossil Fuel Consumption and Cement Production. Geophys. Res. Lett. 2008, 35, L08806. [Google Scholar] [CrossRef]
- Ye, B.; Jiang, J.; Li, C.; Miao, L.; Tang, J. Quantification and Driving Force Analysis of Provincial-Level Carbon Emissions in China. Appl. Energy 2017, 198, 223–238. [Google Scholar] [CrossRef]
- Yang, J.; Li, Y.; Hay, I.; Huang, X. Decoding National New Area Development in China: Toward New Land Development and Politics. Cities 2019, 87, 114–120. [Google Scholar] [CrossRef]
- Liang, Y.; Niu, D.; Zhou, W.; Fan, Y. Decomposition Analysis of Carbon Emissions from Energy Consumption in Beijing-Tianjin-Hebei, China: A Weighted-Combination Model Based on Logarithmic Mean Divisia Index and Shapley Value. Sustainability 2018, 10, 2535. [Google Scholar] [CrossRef] [Green Version]
- Guan, D.; Meng, J.; Reiner, D.M.; Zhang, N.; Shan, Y.; Mi, Z.; Shao, S.; Liu, Z.; Zhang, Q.; Davis, S.J. Structural Decline in China’s CO2 Emissions through Transitions in Industry and Energy Systems. Nat. Geosci. 2018, 11, 551–555. [Google Scholar] [CrossRef] [Green Version]
- Liu, Z.; Guan, D.; Wei, W.; Davis, S.J.; Ciais, P.; Bai, J.; Peng, S.; Zhang, Q.; Hubacek, K.; Marland, G.; et al. Reduced Carbon Emission Estimates from Fossil Fuel Combustion and Cement Production in China. Nature 2015, 524, 335–338. [Google Scholar] [CrossRef] [Green Version]
- Mi, Z.; Meng, J.; Guan, D.; Shan, Y.; Song, M.; Wei, Y.-M.; Liu, Z.; Hubacek, K. Chinese CO2 Emission Flows Have Reversed since the Global Financial Crisis. Nat. Commun. 2017, 8, 1712. [Google Scholar] [CrossRef] [Green Version]
- Cai, W.; Peng, W. Exploring Spatiotemporal Variation of Carbon Storage Driven by Land Use Policy in the Yangtze River Delta Region. Land 2021, 10, 1120. [Google Scholar] [CrossRef]
- Wang, L.; Pei, J.; Geng, J.; Niu, Z. Tracking the Spatial–Temporal Evolution of Carbon Emissions in China from 1999 to 2015: A Land Use Perspective. Sustainability 2019, 11, 4531. [Google Scholar] [CrossRef] [Green Version]
- Xiao, D.; Niu, H.; Guo, J.; Zhao, S.; Fan, L. Carbon Storage Change Analysis and Emission Reduction Suggestions under Land Use Transition: A Case Study of Henan Province, China. Int. J. Environ. Res. Public Health 2021, 18, 1844. [Google Scholar] [CrossRef] [PubMed]
- Gao, L.; Wen, X.; Guo, Y.; Gao, T.; Wang, Y.; Shen, L. Spatiotemporal Variability of Carbon Flux from Different Land Use and Land Cover Changes: A Case Study in Hubei Province, China. Energies 2014, 7, 2298–2316. [Google Scholar] [CrossRef] [Green Version]
- Lienert, S.; Joos, F. A Bayesian Ensemble Data Assimilation to Constrain Model Parameters and Land-Use Carbon Emissions. Biogeosciences 2018, 15, 2909–2930. [Google Scholar] [CrossRef] [Green Version]
- West, T.O.; Marland, G. Net Carbon Flux from Agriculture: Carbon Emissions, Carbon Sequestration, Crop Yield, and Land-Use Change. Biogeochemistry 2003, 63, 73–83. [Google Scholar] [CrossRef]
- Bhan, M.; Gingrich, S.; Roux, N.; Le Noë, J.; Kastner, T.; Matej, S.; Schwarzmueller, F.; Erb, K.-H. Quantifying and Attributing Land Use-Induced Carbon Emissions to Biomass Consumption: A Critical Assessment of Existing Approaches. J. Environ. Manag. 2021, 286, 112228. [Google Scholar] [CrossRef]
- Lin, B.; Raza, M.Y. Analysis of Energy Related CO2 Emissions in Pakistan. J. Clean. Prod. 2019, 219, 981–993. [Google Scholar] [CrossRef]
- Ma, X.; Wang, C.; Dong, B.; Gu, G.; Chen, R.; Li, Y.; Zou, H.; Zhang, W.; Li, Q. Carbon Emissions from Energy Consumption in China: Its Measurement and Driving Factors. Sci. Total Environ. 2019, 648, 1411–1420. [Google Scholar] [CrossRef]
- Ye, L.; Wu, X.; Huang, D. Industrial Energy-Related CO2 Emissions and Their Driving Factors in the Yangtze River Economic Zone (China): An Extended LMDI Analysis from 2008 to 2016. Int. J. Environ. Res. Public Health 2020, 17, 5880. [Google Scholar] [CrossRef]
- Fu, C.; Min, W.; Liu, H. Decomposition and Decoupling Analysis of Carbon Emissions from Cultivated Land Use in China’s Main Agricultural Producing Areas. Sustainability 2022, 14, 5145. [Google Scholar] [CrossRef]
- Lu, X.; Kuang, B.; Li, J.; Han, J.; Zhang, Z. Dynamic Evolution of Regional Discrepancies in Carbon Emissions from Agricultural Land Utilization: Evidence from Chinese Provincial Data. Sustainability 2018, 10, 552. [Google Scholar] [CrossRef] [Green Version]
- Göpel, J.; Schüngel, J.; Schaldach, R.; Meurer, K.H.E.; Jungkunst, H.F.; Franko, U.; Boy, J.; Strey, R.; Strey, S.; Guggenberger, G.; et al. Future Land Use and Land Cover in Southern Amazonia and Resulting Greenhouse Gas Emissions from Agricultural Soils. Reg. Environ. Change 2018, 18, 129–142. [Google Scholar] [CrossRef]
- Wehr, R.; Munger, J.W.; Nelson, D.D.; McManus, J.B.; Zahniser, M.S.; Wofsy, S.C.; Saleska, S.R. Long-Term Eddy Covariance Measurements of the Isotopic Composition of the Ecosystem–Atmosphere Exchange of CO2 in a Temperate Forest. Agric. For. Meteorol. 2013, 181, 69–84. [Google Scholar] [CrossRef]
- Hu, H.; Wang, G.G. Changes in Forest Biomass Carbon Storage in the South Carolina Piedmont between 1936 and 2005. For. Ecol. Manag. 2008, 255, 1400–1408. [Google Scholar] [CrossRef]
- Li, Z.; Chen, Y.; Zhang, Q.; Li, Y. Spatial Patterns of Vegetation Carbon Sinks and Sources under Water Constraint in Central Asia. J. Hydrol. 2020, 590, 125355. [Google Scholar] [CrossRef]
- Acharya, B.S.; Rasmussen, J.; Eriksen, J. Grassland Carbon Sequestration and Emissions Following Cultivation in a Mixed Crop Rotation. Agric. Ecosyst. Environ. 2012, 153, 33–39. [Google Scholar] [CrossRef] [Green Version]
- Calanca, P.; Vuichard, N.; Campbell, C.; Viovy, N.; Cozic, A.; Fuhrer, J.; Soussana, J.-F. Simulating the Fluxes of CO2 and N2O in European Grasslands with the Pasture Simulation Model (PaSim). Agric. Ecosyst. Environ. 2007, 121, 164–174. [Google Scholar] [CrossRef]
- Jackson, R.B.; Banner, J.L.; Jobbágy, E.G.; Pockman, W.T.; Wall, D.H. Ecosystem Carbon Loss with Woody Plant Invasion of Grasslands. Nature 2002, 418, 623–626. [Google Scholar] [CrossRef]
- Chuai, X.; Huang, X.; Lu, Q.; Zhang, M.; Zhao, R.; Lu, J. Spatiotemporal Changes of Built-Up Land Expansion and Carbon Emissions Caused by the Chinese Construction Industry. Environ. Sci. Technol. 2015, 49, 13021–13030. [Google Scholar] [CrossRef]
- Wu, S.; Hu, S.; Frazier, A.E. Spatiotemporal Variation and Driving Factors of Carbon Emissions in Three Industrial Land Spaces in China from 1997 to 2016. Technol. Forecast. Soc. Chang. 2021, 169, 120837. [Google Scholar] [CrossRef]
- Wang, S.; Huang, Y.; Zhou, Y. Spatial Spillover Effect and Driving Forces of Carbon Emission Intensity at the City Level in China. J. Geogr. Sci. 2019, 29, 231–252. [Google Scholar] [CrossRef] [Green Version]
- Zheng, Y.M.; Lv, Q.; Wang, Y.D. Economic Development, Technological Progress, and Provincial Carbon Emissions Intensity: Empirical Research Based on the Threshold Panel Model. Appl. Econ. 2022, 54, 3495–3504. [Google Scholar] [CrossRef]
- Lai, L.; Huang, X.; Yang, H.; Chuai, X.; Zhang, M.; Zhong, T.; Chen, Z.; Chen, Y.; Wang, X.; Thompson, J.R. Carbon Emissions from Land-Use Change and Management in China between 1990 and 2010. Sci. Adv. 2016, 2, e1601063. [Google Scholar] [CrossRef] [Green Version]
- Xu, Q.; Dong, Y.; Yang, R. Influence of Different Geographical Factors on Carbon Sink Functions in the Pearl River Delta. Sci. Rep. 2017, 7, 110. [Google Scholar] [CrossRef]
- Wang, Q.; Wang, S.; Li, R. Determinants of Decoupling Economic Output from Carbon Emission in the Transport Sector: A Comparison Study of Four Municipalities in China. Int. J. Environ. Res. Public Health 2019, 16, 3729. [Google Scholar] [CrossRef] [Green Version]
- Kuang, B.; Lu, X.; Zhou, M.; Chen, D. Provincial Cultivated Land Use Efficiency in China: Empirical Analysis Based on the SBM-DEA Model with Carbon Emissions Considered. Technol. Forecast. Soc. Change 2020, 151, 119874. [Google Scholar] [CrossRef]
- Bhattacharyya, S.C.; Matsumura, W. Changes in the GHG Emission Intensity in EU-15: Lessons from a Decomposition Analysis. Energy 2010, 35, 3315–3322. [Google Scholar] [CrossRef]
- Xie, X.; Shao, S.; Lin, B. Exploring the Driving Forces and Mitigation Pathways of CO2 Emissions in China’s Petroleum Refining and Coking Industry: 1995–2031. Appl. Energy 2016, 184, 1004–1015. [Google Scholar] [CrossRef]
- Lin, B.; Benjamin, N.I. Influencing Factors on Carbon Emissions in China Transport Industry. A New Evidence from Quantile Regression Analysis. J. Clean. Prod. 2017, 150, 175–187. [Google Scholar] [CrossRef]
- Román, R.; Cansino, J.M.; Rodas, J.A. Analysis of the Main Drivers of CO2 Emissions Changes in Colombia (1990–2012) and Its Political Implications. Renew. Energy 2018, 116, 402–411. [Google Scholar] [CrossRef]
- Fernández González, P.; Landajo, M.; Presno, M.J. Tracking European Union CO2 Emissions through LMDI (Logarithmic-Mean Divisia Index) Decomposition. The Activity Revaluation Approach. Energy 2014, 73, 741–750. [Google Scholar] [CrossRef]
- Wang, S.; Ma, Y. Influencing Factors and Regional Discrepancies of the Efficiency of Carbon Dioxide Emissions in Jiangsu, China. Ecol. Indic. 2018, 90, 460–468. [Google Scholar] [CrossRef]
- Shen, L.; Sun, Y. Review on Carbon Emissions, Energy Consumption and Low-Carbon Economy in China from a Perspective of Global Climate Change. J. Geogr. Sci. 2016, 26, 855–870. [Google Scholar] [CrossRef] [Green Version]
- Ang, B.; Zhang, F.; Choi, K. Factorizing Changes in Energy and Environmental Indicators through Decomposition. Energy 1998, 23, 489–495. [Google Scholar] [CrossRef]
- Wu, Y.; Shen, J.; Zhang, X.; Skitmore, M.; Lu, W. The Impact of Urbanization on Carbon Emissions in Developing Countries: A Chinese Study Based on the U-Kaya Method. J. Clean. Prod. 2016, 135, 589–603. [Google Scholar] [CrossRef] [Green Version]
- Shuai, C.; Chen, X.; Wu, Y.; Tan, Y.; Zhang, Y.; Shen, L. Identifying the Key Impact Factors of Carbon Emission in China: Results from a Largely Expanded Pool of Potential Impact Factors. J. Clean. Prod. 2018, 175, 612–623. [Google Scholar] [CrossRef]
- Zhao, R.; Liu, Y.; Tian, M.; Ding, M.; Cao, L.; Zhang, Z.; Chuai, X.; Xiao, L.; Yao, L. Impacts of Water and Land Resources Exploitation on Agricultural Carbon Emissions: The Water-Land-Energy-Carbon Nexus. Land Use Policy 2018, 72, 480–492. [Google Scholar] [CrossRef]
- Xu, Q.; Yang, R.; Dong, Y.-X.; Liu, Y.-X.; Qiu, L.-R. The Influence of Rapid Urbanization and Land Use Changes on Terrestrial Carbon Sources/Sinks in Guangzhou, China. Ecol. Indic. 2016, 70, 304–316. [Google Scholar] [CrossRef]
- Zhao, Y.; Wang, S. The Relationship between Urbanization, Economic Growth and Energy Consumption in China: An Econometric Perspective Analysis. Sustainability 2015, 7, 5609–5627. [Google Scholar] [CrossRef] [Green Version]
- Fang, C.; Wang, S.; Li, G. Changing Urban Forms and Carbon Dioxide Emissions in China: A Case Study of 30 Provincial Capital Cities. Appl. Energy 2015, 158, 519–531. [Google Scholar] [CrossRef]
- Zhao, R.; Huang, X.; Liu, Y.; Zhong, T.; Ding, M.; Chuai, X. Carbon Emission of Regional Land Use and Its Decomposition Analysis: Case Study of Nanjing City, China. Chin. Geogr. Sci. 2015, 25, 198–212. [Google Scholar] [CrossRef]
- Auffhammer, M.; Carson, R.T. Forecasting the Path of China’s CO2 Emissions Using Province-Level Information. J. Environ. Econ. Manag. 2008, 55, 229–247. [Google Scholar] [CrossRef] [Green Version]
- Liu, X.; Duan, Z.; Shan, Y.; Duan, H.; Wang, S.; Song, J.; Wang, X. Low-Carbon Developments in Northeast China: Evidence from Cities. Appl. Energy 2019, 236, 1019–1033. [Google Scholar] [CrossRef] [Green Version]
- GB/T 21010-2017; Current Land Use Classification. Available online: https://openstd.samr.gov.cn/bzgk/gb/newGbInfo?hcno=224BF9DA69F053DA22AC758AAAADEEAA (accessed on 6 June 2023).
- TSURUTA, H.; MOSIER, A. Estimate of CH_4 Emissions from Year-Round Flooded Rice Fields During Rice Growing Season in China. Pedosphere 2005, 15, 66–71. [Google Scholar]
- Xiao, H.; Yuan, X.; Li, B.; Yan, W. The Effects of Land Use Changes on Carbon Emission C: Take Chongqing as an Example. J. Chongqing Norm. Univ. 2012, 29, 38–42+115. [Google Scholar]
- Shi, H.; Mu, X.; Zhang, Y.; Lv, M. Effects of Different Land Use Patterns on Carbon Emission in Guangyuan City of Sichuan Province. Bull. Soil Water Conserv. 2012, 32, 101–106. [Google Scholar] [CrossRef]
- Duan, X.; Wang, X.; Lu, F.; Ou, Y. Carbon sequestration and its potential by wetland ecosystems in China. Acta Ecol. Sin. 2008, 28, 463–469. [Google Scholar]
- Yan, J.; Huang, X.; Li, Y.; Zhang, X. Assessment, Prediction and Control of Carbon Emissions in Land Use Planning-A Case Study of Nanqiao Zone, Chuzhou, Anhui Province. Sci. Technol. Manag. Land Resour. 2010, 27, 19–24. [Google Scholar]
- Chong, C.; Ma, L.; Li, Z.; Ni, W.; Song, S. Logarithmic Mean Divisia Index (LMDI) Decomposition of Coal Consumption in China Based on the Energy Allocation Diagram of Coal Flows. Energy 2015, 85, 366–378. [Google Scholar] [CrossRef]
- Cui, Y.; Li, L.; Chen, L.; Zhang, Y.; Cheng, L.; Zhou, X.; Yang, X. Land-Use Carbon Emissions Estimation for the Yangtze River Delta Urban Agglomeration Using 1994–2016 Landsat Image Data. Remote Sens. 2018, 10, 1334. [Google Scholar] [CrossRef] [Green Version]
- Liu, X.; Ji, Y.; Guan, B.; Jing, X. Analysis of Energy Industry Upgrading in Northeast China. IOP Conf. Ser. Earth Environ. Sci. 2018, 113, 012121. [Google Scholar] [CrossRef] [Green Version]
- Li, H.; Ma, Z.; Sun, J. Efficiency Evaluation of Energy in Northeastern China Based on Data Envelopment Analysis. Discret. Dyn. Nat. Soc. 2021, 2021, 5725850. [Google Scholar] [CrossRef]
- Gao, Z.; Li, S.; Cao, X.; Li, Y. Carbon Emission Intensity Characteristics and Spatial Spillover Effects in Counties in Northeast China: Based on a Spatial Econometric Model. Land 2022, 11, 753. [Google Scholar] [CrossRef]
- Chen, J.; Gao, M.; Cheng, S.; Hou, W.; Song, M.; Liu, X.; Liu, Y.; Shan, Y. County-Level CO2 Emissions and Sequestration in China during 1997–2017. Sci Data 2020, 7, 391. [Google Scholar] [CrossRef]


| Land Use Types | Emission (Absorption) Coefficient | Unit |
|---|---|---|
| Farmland | 0.497 | t/hm2 |
| Woodland | −0.581 | t/hm2 |
| Grassland | −0.021 | t/hm2 |
| Water | −0.253 | t/hm2 |
| Unused Land | −0.005 | t/hm2 |
| Time | Unit | Farmland | Woodland | Grassland | Water | Construction Land | Unused Land | Total |
|---|---|---|---|---|---|---|---|---|
| 1990 | Area (km2) | 1938.33 | 1748.15 | 400.84 | 130.60 | 146.19 | 292.35 | 4656.48 |
| Proportion (%) | 41.63 | 37.54 | 8.61 | 2.80 | 3.14 | 6.28 | 100.00 | |
| 1995 | Area (km2) | 2053.89 | 1698.33 | 357.10 | 117.30 | 152.93 | 276.90 | 4656.48 |
| Proportion (%) | 44.11 | 36.47 | 7.67 | 2.52 | 3.28 | 5.95 | 100.00 | |
| 2000 | Area (km2) | 2116.57 | 1667.59 | 335.68 | 126.68 | 149.76 | 260.18 | 4656.48 |
| Proportion (%) | 45.45 | 35.81 | 7.21 | 2.72 | 3.22 | 5.59 | 100.00 | |
| 2005 | Area (km2) | 2122.77 | 1666.62 | 336.36 | 125.69 | 151.57 | 253.44 | 4656.48 |
| Proportion (%) | 45.59 | 35.79 | 7.22 | 2.70 | 3.26 | 5.44 | 100.00 | |
| 2010 | Area (km2) | 2130.97 | 1645.79 | 234.52 | 128.69 | 162.98 | 353.51 | 4656.48 |
| Proportion (%) | 45.76 | 35.34 | 5.04 | 2.76 | 3.50 | 7.59 | 100.00 | |
| 2015 | Area (km2) | 2124.10 | 1645.61 | 229.54 | 131.65 | 180.99 | 344.56 | 4656.48 |
| Proportion (%) | 45.62 | 35.34 | 4.93 | 2.83 | 3.89 | 7.40 | 100.00 | |
| 2020 | Area (km2) | 2220.88 | 1640.08 | 153.50 | 98.41 | 180.54 | 362.78 | 4656.48 |
| Proportion (%) | 47.70 | 35.22 | 3.30 | 2.11 | 3.88 | 7.79 | 100.00 |
| Carbon Source | Carbon Sink | Net Carbon Emissions | |||||||
|---|---|---|---|---|---|---|---|---|---|
| Farmland | Construction Land | Total Carbon Emissions | Woodland | Grassland | Water | Unused Land | Total Carbon Uptake | ||
| 1990 | 963.35 | 107.16 | 1070.51 | −1015.68 | −8.42 | −33.04 | −1.46 | −1058.60 | 11.91 |
| 1995 | 1020.78 | 112.10 | 1132.88 | −986.73 | −7.50 | −29.68 | −1.38 | −1025.29 | 107.59 |
| 2000 | 1051.94 | 109.77 | 1161.71 | −968.87 | −7.05 | −32.05 | −1.30 | −1009.27 | 152.44 |
| 2005 | 1055.02 | 111.10 | 1166.12 | −968.31 | −7.06 | −31.80 | −1.27 | −1008.44 | 157.68 |
| 2010 | 1059.09 | 119.46 | 1178.56 | −956.20 | −4.92 | −32.56 | −1.77 | −995.46 | 183.10 |
| 2015 | 1055.68 | 132.67 | 1188.34 | −956.10 | −4.82 | −33.31 | −1.72 | −995.95 | 192.39 |
| 2020 | 1103.78 | 132.34 | 1236.11 | −952.89 | −3.22 | −24.90 | −1.81 | −982.82 | 253.29 |
| Years | 1990 | 1995 | 2000 | 2005 | 2010 | 2015 | 2020 |
|---|---|---|---|---|---|---|---|
| Moran’s I index | 0.0630 | 0.0583 | 0.0552 | 0.0546 | 0.0568 | 0.0565 | 0.0556 |
| Z-Score | 2.8646 | 2.6978 | 2.5575 | 2.5459 | 2.6544 | 2.6373 | 2.5699 |
| p-Value | 0.0042 | 0.0070 | 0.0105 | 0.0109 | 0.0079 | 0.0084 | 0.0102 |
| Variance | 0.0007 | 0.0007 | 0.0007 | 0.0007 | 0.0006 | 0.0006 | 0.0007 |
| Soil Carbon Emission Intensity | Land Use Structure | Land Use Efficiency | Income Level | Population Size | Synergistic Effect | |
|---|---|---|---|---|---|---|
| 1990–1995 | 73.92 | 33.61 | −261.89 | 214.48 | 35.56 | 95.68 |
| 1995–2000 | 19.61 | 40.84 | −312.83 | 263.35 | 33.88 | 44.85 |
| 2000–2005 | 8.37 | 29.44 | −293.44 | 227.48 | 33.39 | 5.24 |
| 2005–2010 | 9.53 | 36.62 | −302.02 | 255.29 | 26.00 | 25.42 |
| 2010–2015 | 30.1 | 24.58 | −216.91 | 146.22 | 25.29 | 9.28 |
| 2015–2020 | 44.73 | 48.35 | −343.54 | 291.53 | 19.83 | 60.9 |
| 1990–2020 | 186.26 | 213.44 | −1730.63 | 1398.35 | 173.95 | 241.37 |
Disclaimer/Publisher’s Note: The statements, opinions and data contained in all publications are solely those of the individual author(s) and contributor(s) and not of MDPI and/or the editor(s). MDPI and/or the editor(s) disclaim responsibility for any injury to people or property resulting from any ideas, methods, instructions or products referred to in the content. |
© 2023 by the authors. Licensee MDPI, Basel, Switzerland. This article is an open access article distributed under the terms and conditions of the Creative Commons Attribution (CC BY) license (https://creativecommons.org/licenses/by/4.0/).
Share and Cite
Chen, L.; Hang, Y.; Li, Q. Spatial-Temporal Characteristics and Influencing Factors of Carbon Emissions from Land Use and Land Cover in Black Soil Region of Northeast China Based on LMDI Simulation. Sustainability 2023, 15, 9334. https://doi.org/10.3390/su15129334
Chen L, Hang Y, Li Q. Spatial-Temporal Characteristics and Influencing Factors of Carbon Emissions from Land Use and Land Cover in Black Soil Region of Northeast China Based on LMDI Simulation. Sustainability. 2023; 15(12):9334. https://doi.org/10.3390/su15129334
Chicago/Turabian StyleChen, Linhe, Yanhong Hang, and Quanfeng Li. 2023. "Spatial-Temporal Characteristics and Influencing Factors of Carbon Emissions from Land Use and Land Cover in Black Soil Region of Northeast China Based on LMDI Simulation" Sustainability 15, no. 12: 9334. https://doi.org/10.3390/su15129334