Abstract
National cultural parks are a new form of tourism in China. These parks focus on cultural heritage. Many studies have examined the cultural ecosystem services (CESs) that parks provide from visitors’ perspectives. However, there needs to be more research on the perceived heterogeneity of CESs among different social groups, especially residents, and the relationship between the supply and demand of CESs. This study uses visitor-employed photographs to reveal the landscape features offered by national cultural parks. This study also analyses the relationship between landscape elements in national cultural parks and CESs, as well as the heterogeneity of users’ perceptions of CESs. The results show that the resident group and visitor group agree on the importance of a sense of place in national cultural parks. However, there are differences between the two groups regarding their perceptions of inspiration, recreation, cultural heritage, and social relations in the parks. Residents are most concerned with the parks’ sense of place and social relations. In contrast, visitors are more interested in inspiration, recreation, heritage, and a sense of place. This study highlights the different needs of residents and visitors from the CESs provided by national cultural parks. It also provides insights for the landscape planning and ecotourism management of cultural heritage-type parks.
1. Introduction
In December 2019, China proposed a programme to construct national cultural parks. A national cultural park is a public cultural carrier formed by integrating significant cultural relics and resources that adopts a park-like management approach. There are three national cultural parks in China, covering 15 provinces, autonomous regions, and municipalities. National cultural parks differ from ecological parks, such as national parks, forest parks, and urban parks, in that they cover overlapping physical and spiritual spaces, requiring new methods of cultural heritage conservation [1,2,3]. According to the Charter for Sustainable Tourism [4], combining cultural heritage and tourism is a sustainable conservation and development model. Countries such as Spain [5,6] and Brazil [7] have already obtained remarkable results in the adaptive reuse of cultural heritage and sustainable tourism. As tourism development increasingly emphasises the balance and sustainability of ecological, cultural, social, and economic systems, national cultural parks are being recognised for the cultural ecosystem services or benefits they provide to society [8], such as cultural heritage, spirituality, and a sense of place. Researchers have improved the accuracy of the identification of culture and landscape in national cultural parks among different types of users [9] by enhancing the sense of tourism experience [10] and the sense of place [11] for the sustainable development and management of tourism destinations.
National cultural parks are being planned and managed with more significant consideration of their ecosystem services and less focus on cultural ecosystem services (CESs) than in the past [12]. The Millennium Ecosystem Assessment (MEA) defines CESs as ‘the nonmaterial benefits that people derive from ecosystems through spiritual enrichment, cognitive development, reflection, and aesthetic experience’ [13]. CESs are intangible and immaterial [14], and their quantitative valuation is complex [15]. While other ecosystem services (provisioning services, regulating services, supporting services) can be assessed through environmental data, CESs take a different approach and must be measured through humans’ behaviours and perceptions [16]. Because CESs are generated through human–nature interactions, humans’ willingness to engage with nature is related to health outcomes [17].
Marcinkeviciute and Pranskuniene [18] argue that CESs should arise from people’s perceptions and that cultural services exist only if people perceive their benefits. In turn, people’s values and sociocultural differences influence their preferences for management behaviours [19] and, ultimately, their access to cultural services [20]. The Council of Europe [21] argues that humans perceive landscapes and that landscape characteristics result from the interaction of natural and human factors. This suggests that human perception is essential in measuring a landscape’s value [22,23]. People rely mainly on sensory perceptions to perceive space, forming impressions and memories of space by observing landscape features and judging whether they match their preferences [24]. Researchers have used face-to-face questionnaires and interviews to investigate perceived landscape features, a sense of place [25], subjective well-being [26], and user perceptions of CESs [27] and to assess, map, and quantify perceived social value [28]. Other researchers have used a variety of metrics and methods to quantify CESs, ranging from biophysical to preference -based [29]. Text mining has been used to quantify user opinions and the characteristics of local CESs [30]. Text-mining-based studies combine geotagged photos and social media data [24] to construct landscape characterisation metrics from the natural, infrastructural, and sensory perspectives.
However, fewer researchers have described how differences in user preferences lead to heterogeneity in the perception of CESs related to cultural heritage [31]. We have found that heterogeneity in the perception of heritage destination CESs is quite complex, with differences in user identity and attitudes influencing the extent to which the landscape environment is perceived [32]. Previous studies have focused on tourists [33,34] and ignored the critical role of residents [35]. Residents living within the service radius of a national cultural park are the primary users. The functions provided by the national cultural park are closely related to their daily lives and work. The perceptions of residents are as important as those of visitors [36]. In general, this study is conducted based on the following five questions:
- What are the landscape characteristics of national cultural parks?
- What is the relationship between landscape characteristics and CESs?
- Are there significant differences between different types of users’ perceptions of CESs in national cultural parks?
- What are users’ needs for CESs?
- How can the development and management of cultural heritage tourism destinations be guided?
2. Materials and Methods
2.1. Study Area
In 2022, Guangchang County promoted the construction of a national cultural park (Fuzhou section), with Hunao Gao Town as the core scenic spot. Located in Guanqiao Village, Guangchang County, Fuzhou City, Jiangxi Province, China (Figure 1), the town covers an area of 3.5 ha. The city is the largest and most heavily invested (200 million yuan) tourism-oriented national cultural park in Guangchang County. The study area has a subtropical monsoon climate with an average annual temperature of 19.6 °C and an average yearly rainfall of 1712 mm (1985–2021). The elevation ranges from 258.5 to 305 m, with the lowest point being at the monument. The overall supply of CESs in the town is rich, as the town includes 21 architectural ruins and a monument. It is a new place for residents to relax, be closer to nature, and share their feelings. It has even become a popular tourist stop for visitors.
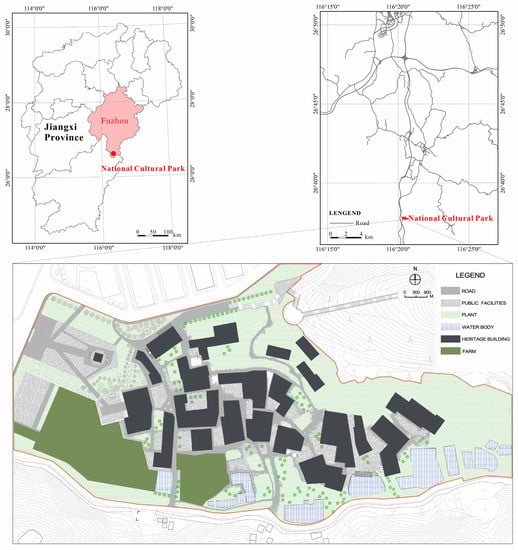
Figure 1.
Location and main landscape components of the national cultural park.
2.2. Experimental Design
This is a study on eight categories of national cultural park CESs based on face-to-face questionnaires and interviews conducted in the small town of Hunao Gao Town, China. We designed a research framework based on visitor-employed photography (VEP) [37,38,39] and included photographs, questionnaires, and interviews. The pictures were taken using Bigemap (http://www.bigemap.com, accessed on 10 August 2022) outdoor research software, which records the user’s stride, speed, and travel trajectory. The questionnaire collected personal information about the respondents, such as their gender, age, income, place of birth, family structure, education, and occupation. The interviews helped us understand the respondents’ motivations for visiting and the details of their activities in the national cultural park. In total, 140 respondents, that is, 70 residents and 70 visitors, were recruited for the survey. Given the size of our study site, 140 was a reasonable sample size for the experiment. Similar sample sizes have been used in previous studies [17,27,30,38,40].
The study was conducted in two phases. In the first phase, from 10–24 August 2022 (the low season for tourism in China), we collected data from the town’s residents. In the second phase, from 1–7 October 2022 (China’s National Day, the most popular period for tourism), accounting for the climatic conditions of the city and the season most suitable for tourism, we conducted the experiment with tourists. We randomly selected respondents in the national cultural park, excluding minors under 18. Before the start of the investigation, all participants were trained to use Bigemap software and were informed in advance about the purpose of the study and the meaning of the eight CES categories. The experiment was divided into three parts, the first of which was a tour and photo session. The respondents took pictures of places in the park that interested them [41,42]. We asked the respondents to take at least 30 photos to facilitate our analysis. We also asked them to complete the tour alone when possible so that they would not be disturbed by others. The second part involved screening the CES categories. At the end of this part, we collected the best photos that the respondents had taken and asked them to identify the CES category of each photo (only one category was allowed per photo). If multiple photographs were taken of the same object, the respondents were asked to select the first photograph taken. A total of 4272 pictures were obtained. The third part was a semistructured interview that revolved around three core questions: (1) why do you think this photo reflects this perception, (2) what factors influenced your choice, and (3) what aspects of the destination need improvement?
2.3. Data Analysis
Our work was based on the studies of Gai [27] and Zhang [32]. We used the eight CES categories provided by the MEA [13] (Table 1). The central aim of our study was to explore the perceived heterogeneity of CESs among different types of users. The statistical analysis of this study consisted of two parts, the first of which was correlation analysis. We chose Pearson correlation analysis to reveal the relationships between the 23 landscape elements and the 8 CES categories. We used multiple linear regression analysis in a statistical method to identify the independent influences of the CESs. Analysis of variance was the second part. This study used chi-square tests to test categorical variables for differences in sociodemographic variables between the two groups of users. Because neither the user type nor the CESs were characterised by normality, we used nonparametric tests to analyse the differences in the perceived frequency of CESs between the two groups of subjects. We performed all statistical analyses using IBM SPSS (26.0).

Table 1.
The eight categories of CESs and their descriptions of interest in this study, adopted from the MEA [13], Gai, Fu et al. [27], and Zhang, Tang et al. [32].
3. Results
3.1. Characteristics of the Respondents
Table 2 shows no significant difference among user types in terms of gender, age, monthly income, or occupation according to the chi-square test (p > 0.05). There were more females than males in both sample groups. The proportion of respondents older than 51 years was low, at 22.85%. Accordingly, young and middle-aged people were the primary respondents. Regarding monthly income, respondents earning CNY 3000–7000 were the most numerous, followed by those earning less than CNY 3000. The lowest number of respondents had a monthly income of over CNY 7000. However, the chi-square test results indicate that the variable differed between the two sample groups. Among the respondents, 71.43% had attended higher education, which helped them understand the experiment better. However, 98.57% of the respondents in the visitor group had a college education or higher. The educational levels of the resident group were concentrated in primary and secondary schools, with a total of 55.72%. There were more regular occupations in the visitor group and more unemployed or inactive individuals in the resident group, which is in line with expectations and social reality.
Table 2.
Sociodemographic information of the sample, including sample size (n), proportion (%), and chi-square test results.
3.2. Landscape Features of the National Cultural Park
Based on the respondents’ photo dataset and having filtered out recurring photos, we identified seven landscape categories and twenty-three landscape elements; the number of each type is shown in Table 3. Five landscape elements frequently appear in both user groups: architectural ruins, trees and jungles, monuments, paddy fields, and decorative archways. Trails, however, are the least frequent, with 28 occurrences. Traditional landscapes, such as architectural ruins, monuments, and decorative archways, appear relatively frequently in the descriptions of the visitor group. In contrast, modern landscapes, such as landscape seating, landscape lighting, and leisure plazas, appear more regularly in the reports of the resident group.
Table 3.
Landscape types in the national cultural park.
Figure 2 shows the total number and percentage of perceived CESs for both groups of users. Out of the eight perceptions, a sense of place and recreation were the most commonly identified CESs, while inspiration and spiritual or religious CESs were the two least commonly perceived categories. These results contrast with the findings of Riechers [43] and Zhang [32], who identified aesthetics as the most important CES. The results indicate that tourists are more likely than residents to perceive cultural heritage, inspiration, recreation, and education CESs in a destination. The resident group more easily perceived the social relations, spiritual or religious, and aesthetics categories.
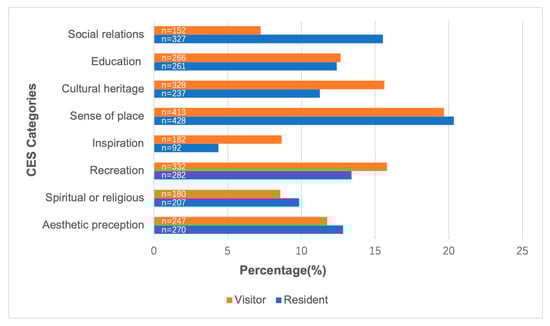
Figure 2.
Proportion (%) and total number (n) of different categories of CESs perceived by respondents in the visitor and resident groups.
3.3. Differences in Visitors’ and Residents’ Perceptions of CESs
There are slight differences between the visitor and resident groups for the CESs, and the box plot (Figure 3) shows how they differ. There are no significant differences (p > 0.05) between the two groups for four CES categories: aesthetics, spiritual or religious, a sense of place, and education. These results indicate that users in both groups feel the same about the aesthetics, spiritual or religious, sense of place, and education CESs of the national cultural park. However, significant differences (p < 0.05) are found for the other four CESs (recreation, inspiration, cultural heritage, and social relations). In this particular case, some differences are noted. Specifically, residents’ perception of social relations is significantly higher than that of visitors, indicating that the resident group values neighbourhood friendliness in the national cultural park the most. The visitor group, on the other hand, has higher perceptions of relaxation, inspiration, and cultural heritage than the resident group, suggesting that visitors seek relaxation, knowledge, and motivation from a destination.
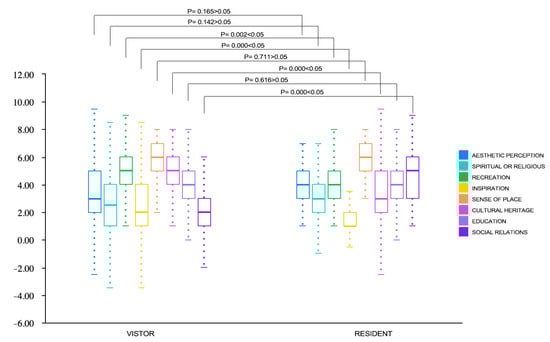
Figure 3.
Box plot of the differences between users for the CESs. Note: The top and bottom lines outside the boxes represent the maximum and minimum values. The line in the middle of the box is the median of the data. The boxes’ top and bottom lines are the data’s upper and lower quartiles.
We further investigated the differences between the two user groups in the frequency of landscape elements appearing in the photographs. On the one hand, three landscape elements of the national cultural park are very similar between the two groups of users (Table 4), with no significant differences between the resident and visitor groups for flowers and lawns, paths, or poultry (p > 0.05). However, the other twenty landscape elements show significant differences between the two user groups. In particular, the four landscape elements are architectural ruins, paddy fields, monuments, and trees and jungles. Specifically, architectural ruins and paddy fields appear most frequently and much more regularly in visitors’ photos than in residents’ photos (Table 4), indicating that visitors perceive architectural ruins and paddy fields to be more valuable than residents do. On the other hand, monuments, trees, and jungles appear most frequently in the resident group. Basketball courts, leisure plazas, and landscape seating are more common among the resident group than among the visitor group.
Table 4.
Results of the differences between users for the landscape elements.
3.4. Correlation of CESs with Landscape Features
Based on the results of the correlation analysis, Table 5 shows the correlations between the twenty-three landscape elements and the eight CES categories.
Table 5.
Correlation analysis between landscape elements and CESs.
Table 5 shows that there is a significant correlation between aesthetics (A) and decorative archways, landscape sketches, and leisure plazas. Among them, leisure plazas are significantly positively correlated with A (r = 0.205 > 0, p < 0.05), and decorative archways and landscape sketches show a significant negative correlation with A (r = −0.182 < 0/r = −0.214 < 0, p < 0.05). The other 20 landscape elements show no significant correlation with A (p > 0.05). Fish show a significant negative correlation with spiritual or religious elements (B) (r = −0.213 < 0, p < 0.05). The six landscape elements, i.e., monuments, decorative archways, architectural ruins, trees and jungles, landscape seating, and leisure plazas, are significantly correlated with recreation (C). Among them, monuments, trees and jungles, landscape seating, and leisure plazas are significantly negatively correlated with C, and decorative archways and architectural ruins are positively correlated. Pavilions, monuments, decorated archways, architectural ruins, trees and jungles, landscape sketches, landscape seating, leisure plazas, and paddy fields are significantly associated with inspiration (D). Pavilions are strongly linked with a sense of place (E). Cultural heritage (F) is associated with pavilions, monuments, decorative archways, architectural ruins, trees and jungles, shrubs, landscape sketches, landscape seating, basketball courts, leisure plazas, paddy fields, lotus ponds, main roads, fish, and wild birds. There is no significant correlation between social relations (H) and fortifications, shrubs, flowers and lawns, lotus ponds, trails, or poultry. However, there is a trend of association between H and the remaining 17 landscape elements (pavilion, monuments, decorative archways, architectural ruins, trees and jungles, landscape sketches, landscape seating, landscape lighting, basketball court, leisure plazas, fitness equipment, paddy fields, ponds, rivulets, main roads, fish, and wild birds). Among the 8 CESs, only education (G) is not significantly correlated with all 23 landscape elements (p > 0.05). Thus, it is not included in the second step of the regression analysis.
We further examined the degree of influence among specific CESs by landscape elements, and the results are shown in Figure 4. Among the twenty-three landscape elements, fortifications, flowers and lawns, trails, and poultry do not influence seven types of CESs (all but education). Pavilions, monuments, decorative archways, architectural ruins, trees and jungles, landscape sketches, landscape seating, leisure plazas, and wild birds are the main elements that influence CESs. Among them, decorative archways are the most important, affecting aesthetics, recreation, inspiration, cultural heritage, and social relations.
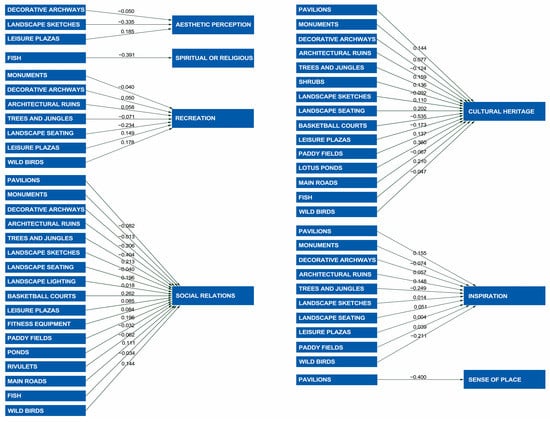
Figure 4.
Relationships between CESs and landscape elements.
The results in Table A1 show that the regression coefficient values for decorative archways, landscape sketches, and leisure plazas are all greater than 0.05. These results indicate that these three landscape elements individually do not have a meaningful relationship with aesthetics (A). Fish have a significant adverse effect on spiritual or religious aspects (B) (p = 0.012 < 0.05, B = −0.391 < 0). The more fish elements in the respondents’ photos, the lower their perception of B is. Monuments, decorative archways, architectural ruins, trees and jungles, landscape seating, leisure plazas, and wild birds do not have a meaningful relationship with recreation (C) (F = 1.972, p > 0.05). At least one of the following landscape elements has a meaningful relationship with inspiration (D) (F = 4.553, p = 0.000 < 0.05): pavilions, monuments, decorative archways, architectural ruins, trees and jungles, landscape sketches, landscape seating, leisure plazas, paddy fields, and wild birds. Trees and jungles significantly negatively influence D (p = 0.043 < 0.05, B = −0.249 < 0). Pavilions, monuments, decorative archways, architectural ruins, landscape sketches, landscape seating, leisure plazas, paddy paddies, and wild birds do not influence D (p > 0.05). However, pavilions exert a significant negative influence on a sense of place (E) (p = 0.0122 < 0.05, B = −0.400 < 0).
Regarding cultural heritage (F), Table A1 shows the results. Lotus ponds and basketball courts have a significant influence on F. Among them, lotus ponds have a meaningfully positive influence on F (p = 0.046 < 0.05, B = 0.360 > 0), and basketball courts have a significant negative influence (p = 0.035 < 0.05, B = −0.535 < 0). At the same time, the other 13 landscape elements had no impact on F (p > 0.05). H is most frequently associated with landscape elements (17), and these 17 landscape elements explain 44.6% of the relationships of H. Specifically, architectural ruins have a significant negative influence on H (p = 0.005 < 0.05, B = −0.404 < 0), and the remaining 16 landscape elements do not individually influence H (p > 0.05).
4. Discussion
4.1. The Perceived Landscape Environment Needs of Residents and Visitors
The landscape structure of national cultural parks is diverse and complex. In selecting CES categories, this study focused on the CESs most closely associated with the national cultural park. A sense of place is an essential need that is frequently mentioned both overall and within individual user perceptions [44], and our study confirms this point. The resident group values the social relations that the national cultural park provided. Visitors desire recreation and cultural heritage.
In addition, the educational value of the national cultural park is highly valued by both groups of users due to its excellent historical and cultural background. The construction of this kind of cultural heritage-themed national cultural park stimulates users’ intrinsic perceptions more than national ecological parks. In particular, the two groups differed in the relative importance of the four perceptions of inspiration, recreation, cultural heritage, and social relations. Based on their personal preferences, users in both groups judge the perceived value of what is important to them from the environment. The greater emphasis on social relations reflects the tendency of residents to seek opportunities for social interaction in national cultural parks. This is because national cultural parks are in rural areas of China, human relationships are an essential feature of Chinese agrarian society [45], and national cultural parks provide a place for residents to interact socially. In addition, the resident group values the modern elements of the national cultural park, such as the leisure plazas, landscape seating, fitness equipment, and main roads. The visitor group is more interested in the historical knowledge and cultural activities offered by the cultural heritage of the national cultural park. These findings reflect the nature of national cultural park construction from the perspective of user perception. Awareness of this influence can help park managers recognise the play preferences of different types of users in national cultural parks [32] and thus use the following ways to increase the sustainable impact of national cultural parks and meet the perceived needs differentiated by the purpose of people’s visit.
One of our motivations for this study is to explore the relative importance of different perceptions provided by the national cultural park landscape. In this research, respondents identify the perceived need for CESs in the national cultural park based on subjective perceptions. Residents and visitors relate these perceptions to the landscape based on their previous experiences and expectations during the destination visit. Visitors’ identification and evaluation results are eliminated through the process of experiencing and reflecting on the tour. These two groups generally have a differential relationship, as shown in Figure 3. Figure 4 further reflects the influence between CES perceptions and the landscape.
For example, regarding cultural heritage, visitors focus on architectural ruins and paddy fields, while residents’ concerns focus on monuments and trees and jungles. Our findings differ from previous views [32] that natural elements such as water and plants are the most common elements informing the sense of place and that natural elements strongly contribute to cultural heritage. In particular, the lotus pond, a characteristic feature of the national cultural park, not only enhances the landscape recognition of the park but can even directly determine the extent to which users are influenced by the cultural heritage. However, the nonnatural elements show strengths in terms of inspiration [5]. Residents believe that monuments and landscape seating can be inspiring. This park’s monument, which is already 90 years old, is a landmark of the park, records facts about the history and culture of the area, and has great significance in the residents’ minds. The landscape seating is new to residents and provides a place to rest and reflect. On the other hand, visitors are more familiar with architectural ruins and decorative archways as traditional sources of historical and cultural information.
Similar studies have widely reported the vital influence of vegetation on aesthetics [46,47]. However, our study found that participants’ aesthetic perception of national cultural parks is mainly reflected in three landscape elements: decorative archways, landscape sketches, and leisure plazas. This finding suggests that people’s CES-related aesthetic perceptions are broad, dispersed, and not limited to specific natural or nonnatural elements. In terms of social relations, residents are more adept at using the modern elements of the national cultural park landscape, but they also consider some trees and jungles as places for social relations. Unlike residents, visitors are more inclined to engage in social relations in areas that contain history, culture, and natural ecology.
These findings may be important, in addition to the fact that the provision of specific CESs for different types of users requires clear landscape cues and that different environments present other landscape elements. These findings can provide a direct basis for the differential configuration of heritage-type park landscape environments worldwide.
4.2. Implications for Landscape Planning and Tourism Management in National Cultural Parks
This study reveals differences in the perceived cultural value of national cultural parks between two groups of users, residents and visitors, through observations and measurements of two groups in a national cultural park. Cultural value has implications for landscape planning and tourism management in the cultural ecosystem of national cultural parks.
This study can be used as a preliminary investigation to inform the planning direction of national cultural parks. Our study of users’ perceived preferences for the nonmaterial benefits of cultural heritage parks can help reveal possible heterogeneity and contrasts in the needs of user groups in such parks. Using respondents hired to take photographs to capture the perceptions of different user groups in a national cultural park can provide a representative overview of individual preferences and needs. Between these two subgroups, the relative importance of other CESs can help park managers sort out the various priority benefits of cultural parks for resident and visitor groups (Figure 3). Notably, the perceived differences between residents and visitors are of particular concern. Architectural ruins, monuments, decorative archways, and paddy fields are critical areas of difference in value identification between the two user groups. At the same landscape sites, resident and tourist groups focus on different categories of CESs. The perception of landscape elements by visitor and resident groups can be used to further understand the importance of specific landscape elements in national cultural parks for both user groups and in terms of the potential that these elements may offer (Table 4). In addition, the correlation between CESs and landscape elements informs landscape planning in the park (Figure 4).
We find that traditional elements occupy an absolute place in the national cultural park, with 85.7% of CESs being related to historical and cultural landscapes. Seventy-four percent of visitors believe that too many modern facilities affect their emotional engagement with the park environment to some extent. Users’ perceptions of CESs reflect their expectations of national cultural parks. The correlation and influence between the number of landscape elements and CESs reflect users’ satisfaction with the CESs currently provided by national cultural parks.
Regarding landscape design and management, the results highlight that increasing users’ satisfaction can increase their behavioural motivation [27]. This suggests that if destination managers want to attract visitors, their landscape design and marketing management should emphasise the destination’s inspiration, recreation, and cultural heritage perception, significantly increasing the frequency of landscape elements such as architectural ruins, monuments, decorative archways, and paddy fields. If managers believe that residents should use certain area, the landscape design should meet residents’ social interaction needs. If national cultural park managers can find the key to user satisfaction, they can improve the efficiency and benefits of national cultural parks and thus enhance the well-being of people in the countryside.
5. Conclusions
A VEP experiment was conducted with 140 residents and visitors. Using the outdoor software ‘Bigemap’, we captured respondents’ perceptions of a national cultural park through photographs. We used statistical analysis to identify differences in the perception of cultural ecosystem services in national cultural parks among different types of users and to link the specific landscape features of such parks to cultural ecosystem services. The study found that visitors value the sense of place, recreation, and cultural heritage provided by national cultural parks, especially the landscape features associated with traditional elements. On the other hand, residents focus on the sense of place and social relationships created by modern facilities in CESs. Furthermore, this study shows that user perceptions play an essential role in the landscape planning and management of national cultural parks. The perceived heterogeneous characteristics of users can provide helpful information for park designers and landscape architects in improving the performance of park spaces.
Despite these contributions, there are certain limitations to this study. First, as the national cultural parks studied are located in rural areas, residents are limited by their education, and their perceptions of CESs and their perceived preferences may be biased. Second, only one region of the national cultural park was selected for the case study to measure the perceived heterogeneity of CESs, and fourteen other regions could not be followed up for data reasons. Therefore, a follow-up study could seek to obtain more comprehensive data to enable our study to cover the full range of regional and national cultural parks.
Author Contributions
Conceptualization, S.L. and W.H.; methodology, W.H.; software, W.H. and Y.G.; formal analysis, Y.G.; investigation, W.H.; data curation, Y.G.; writing—original draft preparation, W.H.; writing—review and editing, S.L. All authors have read and agreed to the published version of the manuscript.
Funding
This research was funded by The National Social Science Fund of China, grant number 19ZD27.
Informed Consent Statement
Informed consent was obtained from all subjects involved in the study.
Data Availability Statement
Not applicable.
Acknowledgments
The authors are grateful for the comments provided by reviewers to improve this paper.
Conflicts of Interest
The authors declare no conflict of interest.
Appendix A
Table A1.
Linear regression results of landscape elements and CESs.
Table A1.
Linear regression results of landscape elements and CESs.
| Dependent Variable | Unstandardized Coefficients | Standardized Coefficients | t | p | VIF | R2 | F | |
|---|---|---|---|---|---|---|---|---|
| B | Std. Error | Beta | ||||||
| Aesthetic perception | 0.068 | 3.306 | ||||||
| Constant | 4.315 | 0.589 | 7.321 | 0.000 ** | ||||
| H4 | −0.05 | 0.12 | −0.044 | −0.413 | 0.68 | 1.635 | ||
| P4 | −0.335 | 0.197 | −0.155 | −1.702 | 0.091 | 1.209 | ||
| PF4 | 0.185 | 0.144 | 0.131 | 1.283 | 0.202 | 1.521 | ||
| Spiritual or religious | 0.045 | 6.544 | ||||||
| Constant | 3.471 | 0.306 | 11.324 | 0.000 ** | ||||
| A1 | −0.391 | 0.153 | −0.213 | −2.558 | 0.012 * | 1 | ||
| Recreation | 0.095 | 1.972 | ||||||
| Constant | 4.531 | 1.207 | 3.753 | 0.000 ** | ||||
| H2 | −0.04 | 0.086 | −0.05 | −0.47 | 0.639 | 1.66 | ||
| H4 | 0.05 | 0.116 | 0.049 | 0.436 | 0.664 | 1.807 | ||
| H5 | 0.058 | 0.098 | 0.106 | 0.588 | 0.558 | 4.762 | ||
| P1 | −0.071 | 0.13 | −0.054 | −0.546 | 0.586 | 1.426 | ||
| PF1 | −0.234 | 0.175 | −0.147 | −1.333 | 0.185 | 1.784 | ||
| PF4 | 0.149 | 0.182 | 0.115 | 0.818 | 0.415 | 2.871 | ||
| A3 | 0.178 | 0.187 | 0.097 | 0.948 | 0.345 | 1.533 | ||
| Inspiration | 0.261 | 4.553 | ||||||
| Constant | 2.093 | 1.147 | 1.825 | 0.07 | ||||
| H1 | 0.155 | 0.148 | 0.089 | 1.045 | 0.298 | 1.252 | ||
| H2 | −0.074 | 0.081 | −0.091 | −0.906 | 0.367 | 1.775 | ||
| H4 | 0.057 | 0.108 | 0.054 | 0.525 | 0.6 | 1.878 | ||
| H5 | 0.148 | 0.107 | 0.272 | 1.378 | 0.171 | 6.81 | ||
| P1 | −0.249 | 0.122 | −0.189 | −2.04 | 0.043 * | 1.505 | ||
| P4 | 0.014 | 0.179 | 0.007 | 0.08 | 0.937 | 1.418 | ||
| PF1 | 0.051 | 0.163 | 0.032 | 0.315 | 0.753 | 1.835 | ||
| PF4 | 0.004 | 0.168 | 0.003 | 0.024 | 0.981 | 2.942 | ||
| F1 | 0.039 | 0.123 | 0.052 | 0.322 | 0.748 | 4.473 | ||
| A3 | −0.211 | 0.173 | −0.116 | −1.224 | 0.223 | 1.555 | ||
| Sense of place | 0.045 | 6.542 | ||||||
| Constant | 6.756 | 0.318 | 21.225 | 0.000 ** | ||||
| WH1 | −0.4 | 0.156 | −0.213 | −2.558 | 0.012 * | 1 | ||
| Cultural heritage | 0.304 | 3.616 | ||||||
| Constant | 0.792 | 1.333 | 0.594 | 0.553 | ||||
| H1 | 0.144 | 0.163 | 0.075 | 0.882 | 0.379 | 1.283 | ||
| H2 | 0.077 | 0.093 | 0.086 | 0.826 | 0.41 | 1.948 | ||
| H4 | −0.124 | 0.119 | −0.108 | −1.04 | 0.3 | 1.913 | ||
| H5 | 0.159 | 0.121 | 0.266 | 1.312 | 0.192 | 7.31 | ||
| P1 | 0.136 | 0.134 | 0.094 | 1.017 | 0.311 | 1.524 | ||
| P2 | −0.092 | 0.206 | −0.037 | −0.446 | 0.656 | 1.241 | ||
| P4 | 0.11 | 0.205 | 0.05 | 0.537 | 0.592 | 1.559 | ||
| PF1 | 0.202 | 0.181 | 0.115 | 1.114 | 0.268 | 1.912 | ||
| PF3 | −0.535 | 0.251 | −0.18 | −2.127 | 0.035 * | 1.271 | ||
| PF4 | −0.173 | 0.19 | −0.121 | −0.913 | 0.363 | 3.136 | ||
| F1 | 0.137 | 0.137 | 0.162 | 0.999 | 0.32 | 4.677 | ||
| F2 | 0.36 | 0.179 | 0.164 | 2.013 | 0.046 * | 1.178 | ||
| R1 | −0.067 | 0.253 | −0.022 | −0.264 | 0.793 | 1.187 | ||
| A1 | 0.21 | 0.151 | 0.119 | 1.393 | 0.166 | 1.291 | ||
| A3 | −0.047 | 0.193 | −0.024 | −0.245 | 0.807 | 1.639 | ||
| Social relations | 0.446 | 5.771 | ||||||
| Constant | 4.183 | 1.593 | 2.625 | 0.010 ** | ||||
| H1 | −0.082 | 0.197 | −0.033 | −0.417 | 0.677 | 1.353 | ||
| H2 | −0.013 | 0.108 | −0.011 | −0.12 | 0.905 | 1.9 | ||
| H4 | −0.206 | 0.142 | −0.137 | −1.45 | 0.15 | 1.973 | ||
| H5 | −0.404 | 0.141 | −0.517 | −2.859 | 0.005 ** | 7.199 | ||
| P1 | 0.213 | 0.16 | 0.113 | 1.335 | 0.184 | 1.573 | ||
| P4 | −0.04 | 0.241 | −0.014 | −0.167 | 0.868 | 1.565 | ||
| PF1 | 0.196 | 0.214 | 0.086 | 0.916 | 0.361 | 1.929 | ||
| PF2 | 0.018 | 0.235 | 0.006 | 0.077 | 0.939 | 1.182 | ||
| PF3 | 0.262 | 0.297 | 0.068 | 0.884 | 0.378 | 1.284 | ||
| PF4 | 0.085 | 0.224 | 0.046 | 0.38 | 0.705 | 3.165 | ||
| PF5 | 0.084 | 0.305 | 0.021 | 0.276 | 0.783 | 1.229 | ||
| F1 | 0.196 | 0.158 | 0.178 | 1.236 | 0.219 | 4.548 | ||
| BW1 | −0.032 | 0.185 | −0.013 | −0.173 | 0.863 | 1.201 | ||
| BW2 | −0.062 | 0.162 | −0.028 | −0.383 | 0.702 | 1.137 | ||
| R1 | 0.111 | 0.303 | 0.027 | 0.366 | 0.715 | 1.236 | ||
| A1 | −0.034 | 0.179 | −0.015 | −0.188 | 0.851 | 1.324 | ||
| A3 | 0.117 | 0.228 | 0.045 | 0.515 | 0.607 | 1.649 | ||
* p < 0.05; ** p < 0.01; n = 140.
References
- Yu, W.; Guo, H.Z.; Wang, J.W. Accurate positioning and essential designing-on the designing of Relic Parks based on YijiangShan island battle Relic Park. Chin. Landsc. Archit. 2020, 36, 94–98. [Google Scholar] [CrossRef]
- Li, L.; Xu, S.S.; He, J.M. Cultural Memory and Rural Revitalization: Community Participation in the Long March National Cultural Park: Based on the Case of Cable Bridge Hongjundu Construction Project of Guanyou Village in Qingzhen City. Guizhou Tour. Sci. 2022, 36, 72–90. [Google Scholar] [CrossRef]
- Liu, L.; Guo, Q.Q.; Wu, Q.H. Exploring New Paths in a New Era—Review of the Symposium on “National Cultural Park Construction and Heritage Revitalization. Tour. Trib. 2022, 37, 150–158. [Google Scholar] [CrossRef]
- World Tourism Organization. Charter for Sustainable Tourism|Charte du Tourisme Durable|Carta del Turismo Sostenible. UNWTO Declar.|Déclarations De L’omt|Declar. De La OMT; World Tourism Organization: Madrid, Spain, 1995; Volume 5, pp. 1–12. [Google Scholar] [CrossRef]
- Quintana, D.C.; Díaz-Puente, J.M.; Gallego-Moreno, F. Architectural and cultural heritage as a driver of social change in rural areas: 10 years (2009–2019) of management and recovery in Huete, a town of Cuenca, Spain. Land Use Policy 2022, 115, 106017. [Google Scholar] [CrossRef]
- Ruiz-Ortega, M.J.; García-Villaverde, P.M.; De La Gala-Velásquez, B.; Hurtado-Palomino, A.; Arredondo-Salas, Á.Y. Innovation capability and pioneering orientation in Peru’s cultural heritage tourism destinations: Conflicting environmental effects. J. Hosp. Tour. Manag. 2021, 48, 441–450. [Google Scholar] [CrossRef]
- Lopes, A.S.; Macedo, D.V.; Brito, A.Y.S.; Furtado, V. Assessment of urban cultural-heritage protection zones using a co-visibility-analysis tool. Computers. Environ. Urban Syst. 2019, 76, 139–149. [Google Scholar] [CrossRef]
- Taff, B.D.; Benfield, J.; Miller, Z.D.; D’antonio, A.; Schwartz, F. The Role of Tourism Impacts on Cultural Ecosystem Services. Environments 2019, 6, 43. [Google Scholar] [CrossRef]
- Shaykh-Baygloo, R. Foreign tourists’ experience: The tri-partite relationships among sense of place toward destination city, tourism attractions and tourists’ overall satisfaction—Evidence from Shiraz, Iran. J. Destin. Mark. Manag. 2021, 19, 100518. [Google Scholar] [CrossRef]
- Jepson, D.; Sharpley, R. More than sense of place? Exploring the emotional dimension of rural tourism experiences. J. Sustain. Tour. 2015, 23, 1157–1178. [Google Scholar] [CrossRef]
- Cottrell, J.R.; Cottrell, S.P. Sense-of-Place Influences on Perceived Environmental Change: Effects on Future Holiday Experiences to Saaremaa, Estonia. Scand. J. Hosp. Tour. 2015, 15, 425–446. [Google Scholar] [CrossRef]
- Radford, K.G.; James, P. Changes in the value of ecosystem services along a rural-urban gradient: A case study of Greater Manchester, UK. Landsc. Urban Plan. 2013, 109, 117–127. [Google Scholar] [CrossRef]
- Millennium Ecosystem Assessment. Ecosystems and Human Well-Being; Millennium Ecosystem Assessment: Washington, DC, USA, 2005. [Google Scholar]
- Cheng, X.; Van, D.S.; Li, L.; Uyttenhove, P. Evaluation of cultural ecosystem services: A review of methods. Ecosyst. Serv. 2019, 37, 100925. [Google Scholar] [CrossRef]
- Ko, H.; Son, Y. Perceptions of cultural ecosystem services in urban green spaces: A case study in Gwacheon, Republic of Korea. Ecol. Indic. 2018, 91, 299–306. [Google Scholar] [CrossRef]
- Johansson, M.; Pedersen, E.; Weisner, S. Assessing cultural ecosystem services. as individuals’ place-based appraisals. Urban For. Urban Green. 2019, 39, 79–88. [Google Scholar] [CrossRef]
- Wang, Y.; Shi, X.; Cheng, K.; Zhang, J.; Chang, Q. How do urban park features affect cultural ecosystem services: Quantified evidence for design practices. Urban For. Urban Green. 2022, 76, 127713. [Google Scholar] [CrossRef]
- Marcinkeviciute, L.; Pranskuniene, R. Cultural Ecosystem Services: The Case of Coastal-Rural Area (Nemunas Delta and Curonian Lagoon, Lithuania). Sustainability 2021, 13, 123. [Google Scholar] [CrossRef]
- Alazaizeh, M.; Hallo, J.C.; Backman, S.J.; Norman, W.C.; Vogel, M.A. Value orientations and heritage tourism management at Petra Archaeological Park, Jordan. Tour. Manag. 2016, 57, 149–158. [Google Scholar] [CrossRef]
- Gosal, A.S.; Geijzendorffer, L.R.; Václavík, T.; Poulin, B.; Ziv, G. Using social media, machine learning and natural language processing to map multiple recreational beneficiaries. Ecosyst. Serv. 2019, 38, 100958. [Google Scholar] [CrossRef]
- Council of Europe. European Landscape Convention and Explanatory Report; Council of Europe: Strasbourg, France, 2000. [Google Scholar]
- Ren, X. Consensus in factors affecting landscape preference: A case study. based on a cross-cultural comparison. J. Environ. Manag. 2019, 252, 109622. [Google Scholar] [CrossRef] [PubMed]
- Ross, D.; Saxena, G.; Correia, F.; Deutz, P. Archaeological tourism: A creative approach. Ann. Tour. Res. 2017, 67, 37–47. [Google Scholar] [CrossRef]
- Li, Y.; Xie, L.; Zhang, L.; Huang, L.; Lin, Y.; Su, Y.; AmirReza, S.; He, S.; Zhu, C.; Li, S.; et al. Understanding different cultural ecosystem services: An exploration of rural landscape preferences based on geographic and social media data. J. Environ. Manag. 2022, 317, 115487. [Google Scholar] [CrossRef] [PubMed]
- Wartmann, F.M.; Purves, R.S. Investigating sense of place as a cultural. ecosystem service in different landscapes through the lens of language. Landsc. Urban Plan. 2018, 175, 169–183. [Google Scholar] [CrossRef]
- Nowak-Olejnik, A.; Schirpke, U.; Tappeiner, U. A systematic review on subjective well-being benefits associated with cultural ecosystem services. Ecosyst. Serv. 2022, 57, 101467. [Google Scholar] [CrossRef]
- Gai, S.; Fu, J.; Rong, X.; Dai, L. Users’ views on cultural ecosystem. services of urban parks: An importance-performance analysis of a case in Beijing, China. Anthropocene 2022, 37, 100323. [Google Scholar] [CrossRef]
- Sherrouse, B.C.; Clement, J.M.; Semmens, D.J. A GIS application for. assessing, mapping, and quantifying the social values of ecosystem services. Appl. Geogr. 2011, 31, 748–760. [Google Scholar] [CrossRef]
- Xin, C.; Sylvie, V.D.; Luyuan, L.; Pieter, U. Taking “social relations” as a cultural ecosystem service: A triangulation approach. Urban For. Urban Green. 2020, 55, 126790. [Google Scholar] [CrossRef]
- Lee, J.-H.; Park, H.-J.; Kim, L.; Kwon, H.-S. Analysis of cultural ecosystem services using text mining of residents’ opinions. Ecol. Indic. 2020, 115, 106368. [Google Scholar] [CrossRef]
- Urbis, A.; Povilanskas, R.; Jurkus, E.; Taminskas, J.; Urbis, D. GIS-Based Aesthetic Appraisal of Short-Range Viewsheds of Coastal Dune and Forest Landscapes. Forests 2021, 12, 1534. [Google Scholar] [CrossRef]
- Zhang, K.; Tang, X.; Zhao, Y.; Huang, B.; Huang, L.; Liu, M.; Luo, E.; Li, Y.; Jiang, T.; Zhang, L.; et al. Differing perceptions of the youth and the elderly regarding cultural ecosystem services in urban parks: An exploration of the tour experience. Sci. Total Environ. 2022, 821, 153388. [Google Scholar] [CrossRef]
- Zwierzchowska, I.; Hof, A.; Iojă, I.C.; Mueller, C.; Poniży, L.; Breuste, J.; Mizgajski, A. Multi-scale assessment of cultural ecosystem services of parks in Central European cities. Urban For. Urban Green. 2018, 30, 84–97. [Google Scholar] [CrossRef]
- Ghermandi, A.; Camacho-Valdez, V.; Trejo-Espinosa, H. Social media-based analysis of cultural ecosystem services and heritage tourism in a coastal region of Mexico. Tour. Manag. 2020, 77, 104002. [Google Scholar] [CrossRef]
- Su, Y.; Zhu, C.; Lin, L.; Wang, C.; Jin, C.; Cao, J.; Li, T.; Su, C. Assessing the Cultural Ecosystem Services Value of Protected Areas Considering Stakeholders’ Preferences and Trade-Offs-Taking the Xin’an River Landscape Corridor Scenic Area as an Example. Int. J. Environ. Res. Public Health 2022, 19, 13968. [Google Scholar] [CrossRef]
- Dade, M.C.; Mitchell, M.G.; Brown, G.; Rhodes, J.R. The effects of urban greenspace characteristics and socio-demographics vary among cultural ecosystem services. Urban For. Urban Green. 2020, 49, 126641. [Google Scholar] [CrossRef]
- Haywood, K.M. Visitor-Employed Photography: An Urban Visit Assessment. J. Travel Res. 1990, 29, 25–29. [Google Scholar] [CrossRef]
- Heyman, E. Analysing recreational values and management effects in an urban forest with the visitor-employed photography method. Urban For. Urban Green. 2012, 11, 267–277. [Google Scholar] [CrossRef]
- Sun, F.; Xiang, J.; Tao, Y.; Tong, C.; Che, Y. Mapping the social values for ecosystem services in urban green spaces: Integrating a visitor-employed photography method into SolVES. Urban For. Urban Green. 2019, 38, 105–113. [Google Scholar] [CrossRef]
- Lis, A.; Zalewska, K.; Pardela, Ł.; Adamczak, E.; Cenarska, A.; Bławicka, K.; Brzegowa, B.; Matiiuk, A. How the amount of greenery in city parks impacts visitor preferences in the context of naturalness, legibility and perceived danger. Landsc. Urban Plan. 2022, 228, 104556. [Google Scholar] [CrossRef]
- Fairweather, J.R.; Swaffield, S.R. Visitor Experiences of Kaikoura, New Zealand: An interpretative study using photographs of landscapes and Q method. Tour. Manag. 2001, 22, 219–228. [Google Scholar] [CrossRef]
- Fung, C.K.W.; Jim, C.Y. Unraveling Hong Kong Geopark experience with visitor-employed photography method. Appl. Geogr. 2015, 62, 301–313. [Google Scholar] [CrossRef]
- Riechers, M.; Barkmann, J.; Tscharntke, T. Diverging perceptions by social. groups on cultural ecosystem services provided by urban green. Landsc. Urban Plan. 2018, 175, 161–168. [Google Scholar] [CrossRef]
- Ryfield, F.; Cabana, D.; Brannigan, J.; Crowe, T. Conceptualizing ‘sense of place’ in cultural ecosystem services: A framework for interdisciplinary research. Ecosyst. Serv. 2019, 36, 100907. [Google Scholar] [CrossRef]
- Wang, X.Y.; Lv, D.W. Relationships Weakening: Research on the Changes of Social Relations in Rural China in Recent Years. Study Pract. 2022, 4, 101–112. [Google Scholar] [CrossRef]
- Li, X.-P.; Fan, S.-X.; Kühn, N.; Dong, L.; Hao, P.-Y. Residents’ ecological. and aesthetical perceptions toward spontaneous vegetation in urban parks in China. Urban For. Urban Green. 2019, 44, 126397. [Google Scholar] [CrossRef]
- Qi, J.; Zhou, Y.; Zeng, L.; Tang, X. Aesthetic heterogeneity on rural landscape: Pathway discrepancy between perception and cognition. J. Rural Stud. 2022, 92, 383–394. [Google Scholar] [CrossRef]


Disclaimer/Publisher’s Note: The statements, opinions and data contained in all publications are solely those of the individual author(s) and contributor(s) and not of MDPI and/or the editor(s). MDPI and/or the editor(s) disclaim responsibility for any injury to people or property resulting from any ideas, methods, instructions or products referred to in the content. |
© 2023 by the authors. Licensee MDPI, Basel, Switzerland. This article is an open access article distributed under the terms and conditions of the Creative Commons Attribution (CC BY) license (https://creativecommons.org/licenses/by/4.0/).