Article

Study on the Spatiotemporal Evolution Characteristics and Influencing Factors on Green Building Development of City Clusters in the Yangtze River Delta Region in China

1
School of Transportation Engineering, Changsha University of Science and Technology, Changsha 410114, China
2
Yiyang Transportation Planning Survey and Design Institute Co., Ltd., Yiyang 413000, China
3
Hunan Commodity Quality Inspection Institute, Changsha 410114, China
*
Author to whom correspondence should be addressed.
Sustainability 2023, 15(12), 9457; https://doi.org/10.3390/su15129457
Submission received: 5 May 2023 / Revised: 5 June 2023 / Accepted: 7 June 2023 / Published: 12 June 2023

Abstract

:
This paper explores the spatiotemporal evolution characteristics and spatial correlation patterns of green building development differences in 41 cities in the Yangtze River Delta region from 2012 to 2020 by means of the gravity center analysis model and spatial autocorrelation analysis. In addition, it further clarifies the impact factors of the spatial differentiation pattern of green building development in combination with GeoDetector based on four dimensional factors of population and economy, market environment, policy, and other factors. The results showed that: (1) According to the analysis of the number of green buildings in each city from 2012 to 2020 and the natural discontinuity method, the development pattern of green buildings in the Yangtze River Delta region city clusters shows an imbalance, being highly concentrated in the eastern coastal areas with Suzhou (1) and Shanghai as the core. The overall trajectory of the center of gravity shows the development from southeast to northwest. (2) The global Moran’s I of green buildings in the Yangtze River Delta region city clusters is greater than 0, and all passed the significance test (Z > 1.96, p < 0.01), indicating that the green buildings in the Yangtze River Delta region city clusters show typical spatial aggregation characteristics. By using the local LISA index, it is found that in the H-H spatial autocorrelation distribution pattern with Suzhou (1) and Shanghai as the core, the core city has a strong attraction ability and relatively low radiation ability. (3) Based on the explanatory power mean, the main driving factors of the spatial differentiation pattern of green building development in the Yangtze River Delta region city clusters are education level (0.6656), technical level (0.6269), and the gross domestic product (0.6091). The factor interaction shows a two-factor enhancement and nonlinear enhancement effect, and there is neither a weakening nor an independent relationship.

1. Introduction

With the growth in urbanization and the deepening of industrialization, total global carbon emissions have shown an increasing trend, although the speed of growth has slowed in recent years [1]. Many countries have begun to reduce CO2 emissions as much as possible and have taken actions to reduce emissions through legislation, policy pledges, and other measures. In the face of an increasingly serious climate change problem, China has proposed “3060” carbon peaking and carbon neutrality goals, striving to realize carbon peaking by 2030 and work toward carbon neutrality by 2060 [2]. In China’s total carbon emissions, the building industry accounts for more than half [2] (the building energy consumption and carbon emissions are shown in Figure 1 and Figure 2). The building industry is the key to achieving carbon peaking and carbon neutrality in cities, and green building (GB) is one of the most important ways of doing so. In the context of carbon peaking and carbon neutrality goals, the high-quality development of GBs has become an essential element in solving environmental and energy problems in China [3].
Along with socio-economic development and accelerated urbanization, GBs have received more and more attention as a vehicle for urban development. At present, China has not only put forward specific requirements for GB development but also made comprehensive arrangements for the construction of GB industry chains. GB is an important carrier in implementing national sustainable development and the green development concept [4]. The GB evaluation standard points out that GB refers to a high-quality building that saves resources, protects the environment, reduces pollution, provides people with a healthy, practical, and efficient space for use, and maximizes the harmonious coexistence of man and nature during the whole life cycle [5]. In 2008, China began to explicitly propose GB, vigorously promote the concept of GB, construct the GB evaluation standard, and establish a GB labeling project evaluation platform, thus promoting the greening of buildings. GBs are generally developed by real estate companies. The evaluation of GBs should not only meet the requirements of the GB evaluation standard but also meet the current national standards. The development degree of carbon reduction and carbon neutrality in the building industry has a vital influence on the achievement of China’s carbon peaking and carbon neutrality goals, and carbon reduction is urgent in terms of the importance and urgency of promoting the high-quality development of GB [6]. GB development has become an important support for green and low-carbon lifestyles and the green living environment of the whole society under the “3060” carbon peaking and carbon neutrality goals and is also a key path for the building industry to achieve green and sustainable development [3].
In recent years, studies on the spatiotemporal evolution of GB development have attracted extensive attention worldwide. Most studies have shown some variation and aggregation in the geographical distribution of GBs [7,8,9]. Qiu et al. analyzed commercial GBs using a space score logit model and instrumental variables, and the study showed that the proliferation of GBs has a strong spatial correlation [10]. Cildell collected data and completed statistics on the spatial distribution of GBs in the U.S. showing that GBs have a geospatial distribution from the coastal cities to the whole country [11]. Kaza and Kahn studied the space–time aggregation characteristics and spatial evolution of GBs in the United States and California, respectively [12,13]. Guo et al. analyzed the geographical distribution and spatial correlation of GBs with different star ratings at the provincial and municipal levels using the natural discontinuity method and Moran’s index [14]. Li found that GB development in China showed significant geographical variability not only in terms of scale but also in terms of market characteristics such as green technology system selection, application level, operational implementation, product types, and development subjects [15]. Other scholars studied the spatiotemporal evolution characteristics of GBs through the natural discontinuity method and variation coefficient and found that overall GBs in China are at a low level and have geographical variability, with a smaller degree of variation in the east [16,17]. Based on a literature review and summary, GB development in China has specific spatiotemporal evolution characteristics, and the spatial development shows a pattern of pole core plus circle from point to surface and develops along the axis. From the time development pattern, GB development around the provinces is not consistent, and the overall number is increasing year by year. More domestic scholars have analyzed the spatiotemporal evolution rule of GB development at the provincial scale, and this research has certain limitations, finding it difficult to reveal the spatiotemporal evolution characteristics of GB development in each city, and being unable to provide specific suggestions for GB development in each city.
More researchers have conducted a large number of studies on the impact factors of GB development from economic, policy, and social perspectives. Based on the geographic distribution variability of GBs in China, Ye analyzed the influence of the macroeconomic environment and real estate environment on the distribution pattern of GBs, and the variability of a geographic location is strongly correlated with local economic market conditions [3]. Gao et al. argued that the differences in the geographical distribution of GBs are attributed to variations in the economy and real estate markets of various urban areas [9]. Guo et al. studied the geographic location and influencing factors of GB. He found that differences in geography were more significantly spatially correlated with GBs, and there were more GBs in economically developed cities than in surrounding cities [14]. Liu et al. studied the spatiotemporal evolution of GB regions in China and found that the development of GBs in China is mainly path-dependent, with many low-level provinces and cities. Indicators such as per capita GDP, urban population, and environmental protection expenditures have a noticeable positive effect on the spatial distribution pattern of GB regions [18]. By identifying and analyzing factors influencing GB development, it was realized that technical input was the core influencing factor: GB technology provides technology support for GB development, and its development status affects the overall level [19]. Many domestic and international scholars have studied the influencing factors of GB, but few have studied the interaction relationship of factors influencing GB development.
With the “One Belt One Road” and “Yangtze River Economic Belt” strategies, the Yangtze River Delta (YRD) region has become an important target for China’s development and will have the most potential for GB development [17]. The YRD region consists of the four provinces and cities of Jiangsu, Zhejiang, Anhui, and Shanghai, with a total of 41 cities. The region is 358,000 square kilometers in size, and the urbanization rate of the resident population is more than 60%. It is committed to building a model for the high-quality development of GBs, but there are still significant differences and unbalance in the development of GBs in each city. As a new technological innovation product, GB exhibits certain spatiotemporal evolution characteristics in the mass production process. Therefore, this paper took GBs in the YRD region city clusters as research objects, analyzed their spatiotemporal evolution characteristics by spatial autocorrelation, and visualized their development trend. It also analyzed the factors driving GB development in the YRD region city clusters based on four dimensions: population and economy, policy, market environment, and other factors, and measured the driving factors with the spatial distribution characteristics of GBs and the correlation of different factors to GB development with the help of GeoDetector.
The research objectives of this paper were as follows: (1) to study the spatiotemporal distribution pattern of GB development in the YRD region city clusters from the perspective of the city; (2) to explore the main factors affecting the spatial differentiation pattern of GB development; and (3) provide a reference for global urban GB planning and development. The broader aims of this paper are as follows: to study the spatiotemporal evolution characteristics of GB development from the perspective of the city, to deeply analyze the influence of driving factors on the development of GB, to further clarify the reasons for the imbalance in and inadequacy of GB development, to help the effective practice of GB development and innovation in global cities and the scientific formulation of planning policies, to narrow the regional differences in the level of green development of global cities, and to promote the level of green development of cities.
The remainder of this paper is structured as follows: Section 2 discusses the data and methodology used in this paper, with data collected on indicators related to GB development in a total of 41 cities for the period 2012–2020. Section 3 analyses the level of GB development, geographical distribution, and spatial correlation at the municipal level through the coefficient of variation, Moran’s index, and the natural discontinuity grading method, and determines that there are differences in the development of GBs, forming a pattern of “strong in the north and weak in the south, strong in the east and weak in the west”. Section 4 examines the extent to which 12 influencing factors contribute to differences in GB development in the YRD region city clusters through GeoDetector and analysis of the extent to which the influencing factors interact with each other. Section 5 includes the conclusions and recommendations for future research.

2. Materials and Methods

2.1. Research Objects

This paper took the GB development of the YRD region city clusters as a research object. It is one of the regions with the most active development, highest openness, and most innovation in China. It is also one of the three poles of China’s GB development. The region has a significant level of economic development and continues to actively advance the concept of green development. The region’s GB trend is remarkable, being the highest in China, and the data on GB development are relatively rich.

2.2. Data Sources

This paper collected the number of GBs in the YRD region city clusters from 2012 to 2020 from the Green Building Evaluation Marking Network and Provincial and Municipal Housing and Urban–rural Construction Departments. The data on the GB development impact factors of the YRD region city clusters are obtained from Provincial and Municipal Statistical Yearbooks and the Thematic Full-text Database of China’s important Newspapers, and the detailed information is shown in the Table 1.

2.3. Research Methods

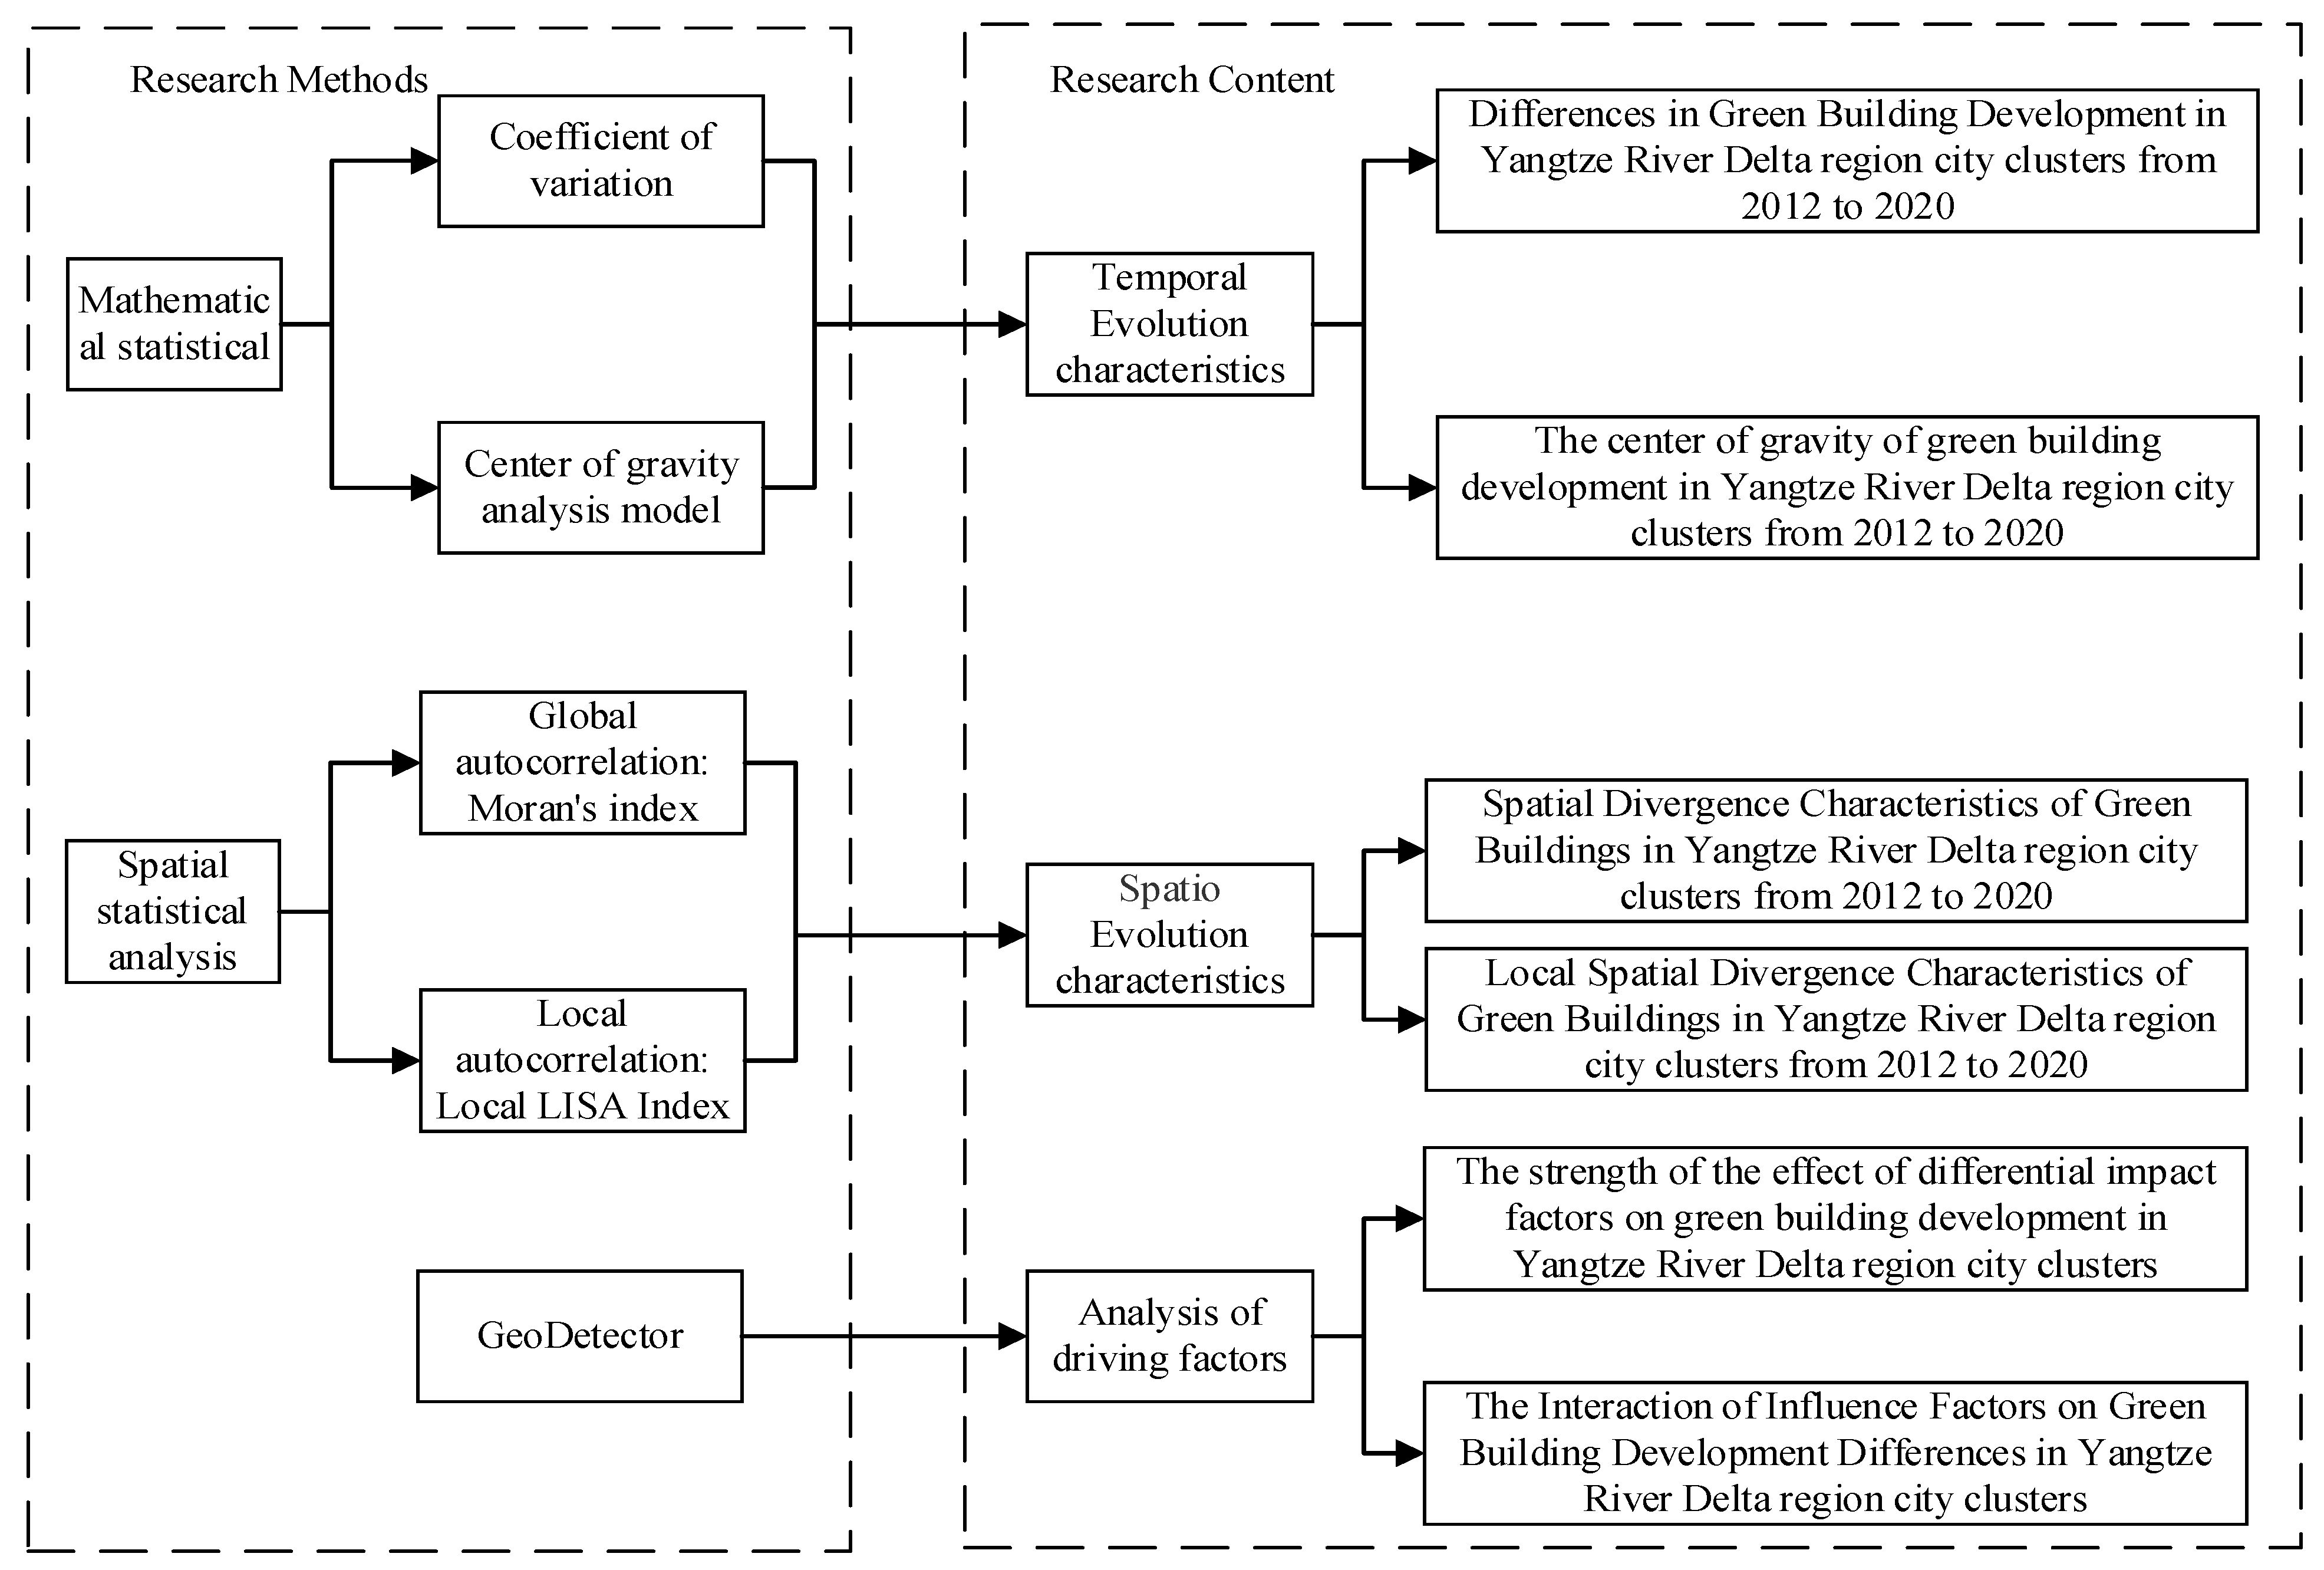
This paper mainly used mathematical statistics, spatial statistics, and literature analysis to explore the spatiotemporal distribution and influence factors of GBs in the YRD region city clusters, as shown in Figure 3.

2.3.1. Mathematical Statistical Analysis

(1)
Coefficient of variation
To discern the differences in GB development in the YRD region, the coefficient of variation was used to measure the dispersion or divergence of GBs in the study region, and the formula was calculated as follows [16]:
C V = 1 X ¯ i = 1 n ( X i X ¯ ) 2 n
where CV is the coefficient of variation of GBs; X ¯ is the average number of GBs; Xi is the number of GBs in city i; n is the number of cities.
(2)
Center of gravity analysis model
The center of gravity analysis model can reflect the spatial distribution and variation of targets in the study region and is calculated as follows [20]:
x = i = 1 n M i x i i = 1 n M i y = i = 1 n M i y i i = 1 n M i
where the center coordinate of city i is ( x i , y i ) , and M i is the number of GBs in city i.

2.3.2. Spatial Statistical Analysis

Spatial statistics is the application and expansion of statistical analysis in spatial science, using mathematical statistical models to describe and simulate spatial phenomena and processes, transforming geographic space into mathematical statistical models for quantitative operations.
(1)
Moran’s index (Moran’s I)
The Moran index is a reflection of potential spatial interdependence between observations of variables within the same study region. The spatial distribution patterns of GB development in the study region (clustered, discrete, and random patterns) are analyzed based on element locations and element values to measure spatial autocorrelation. The significance of this index is assessed by calculating Moran’s I value, Z-score, and p-value, Moran’s I > 0 indicates a positive correlation, and the larger the value the more significant the spatial clustering phenomenon. Moran’s I < 0 indicates a negative correlation, and the larger the absolute value, the greater the spatial variation. Moran’s I = 0 indicates a random distribution of elements. The equation is calculated as follows [9]:
I = n i = 1 n j = 1 n W i j × i = 1 n j = 1 n X X ¯ i = 1 n X X ¯ 2
where n is the number of study units, X i , X j are the observed values of spatial units i and j; X ¯ is the observed value of spatial units, and W i j is the weight matrix of spatial units i and j.
(2)
Local LISA Index  I i
The local LISA index can reflect the different status between adjacent spatial units and indicate the degree of aggregation in different regions. Ii > 0 means a high value is surrounded by a high value (H-H), or a low value is surrounded by a low value (L-L). Ii < 0 means a low value is surrounded by a high value (L-H), or a high value is surrounded by a low value (H-L). The significance of this index was assessed by calculating the Z-score and p-value. The formula is calculated as follows [20]:
I i = n X i X ¯ j = 1 n W i j X j X ¯ i = 1 n X i X ¯ 2

2.3.3. GeoDetector

GeoDetector is a method of spatial analysis suitable for measuring the determination strength of the spatial divergence of factor X to Y and revealing the driving force behind it, as proposed by Jinfeng Wang [21], and calculated as follows:
q = 1 h = 1 L N h σ h 2 N σ 2
where q denotes the explanatory power of the driver X on the spatiotemporal variation of Y, h is the number of classifications or partitions of the factor, L and N are the numbers of driver samples and cells in the study region, respectively, and σ 2 denotes the regional variance. q ( 0 , 1 ) , and the larger its value, the stronger the spatial heterogeneity.
GeoDetector also has the function of interactive detection, able to identify the interaction between different factors. It evaluates whether to enhance or reduce the explanatory power of variable Y with the interaction of factors X1 and X2 and calculates whether these factors are independent of each other [22]. The method is: first calculate the q-values of the two factors X1 and X2 for Y: q(X1) and q(X2); then calculate the q-values under the interaction: q(X1 ∩ X2); and, finally, compare q(X1), q(X2), and q(X1 ∩ X2), and the relationship between the two factors is shown in Table 2.

3. Results

3.1. GB Distribution Pattern of YRD Region City Clusters

3.1.1. GB Year-by-Year Development Level

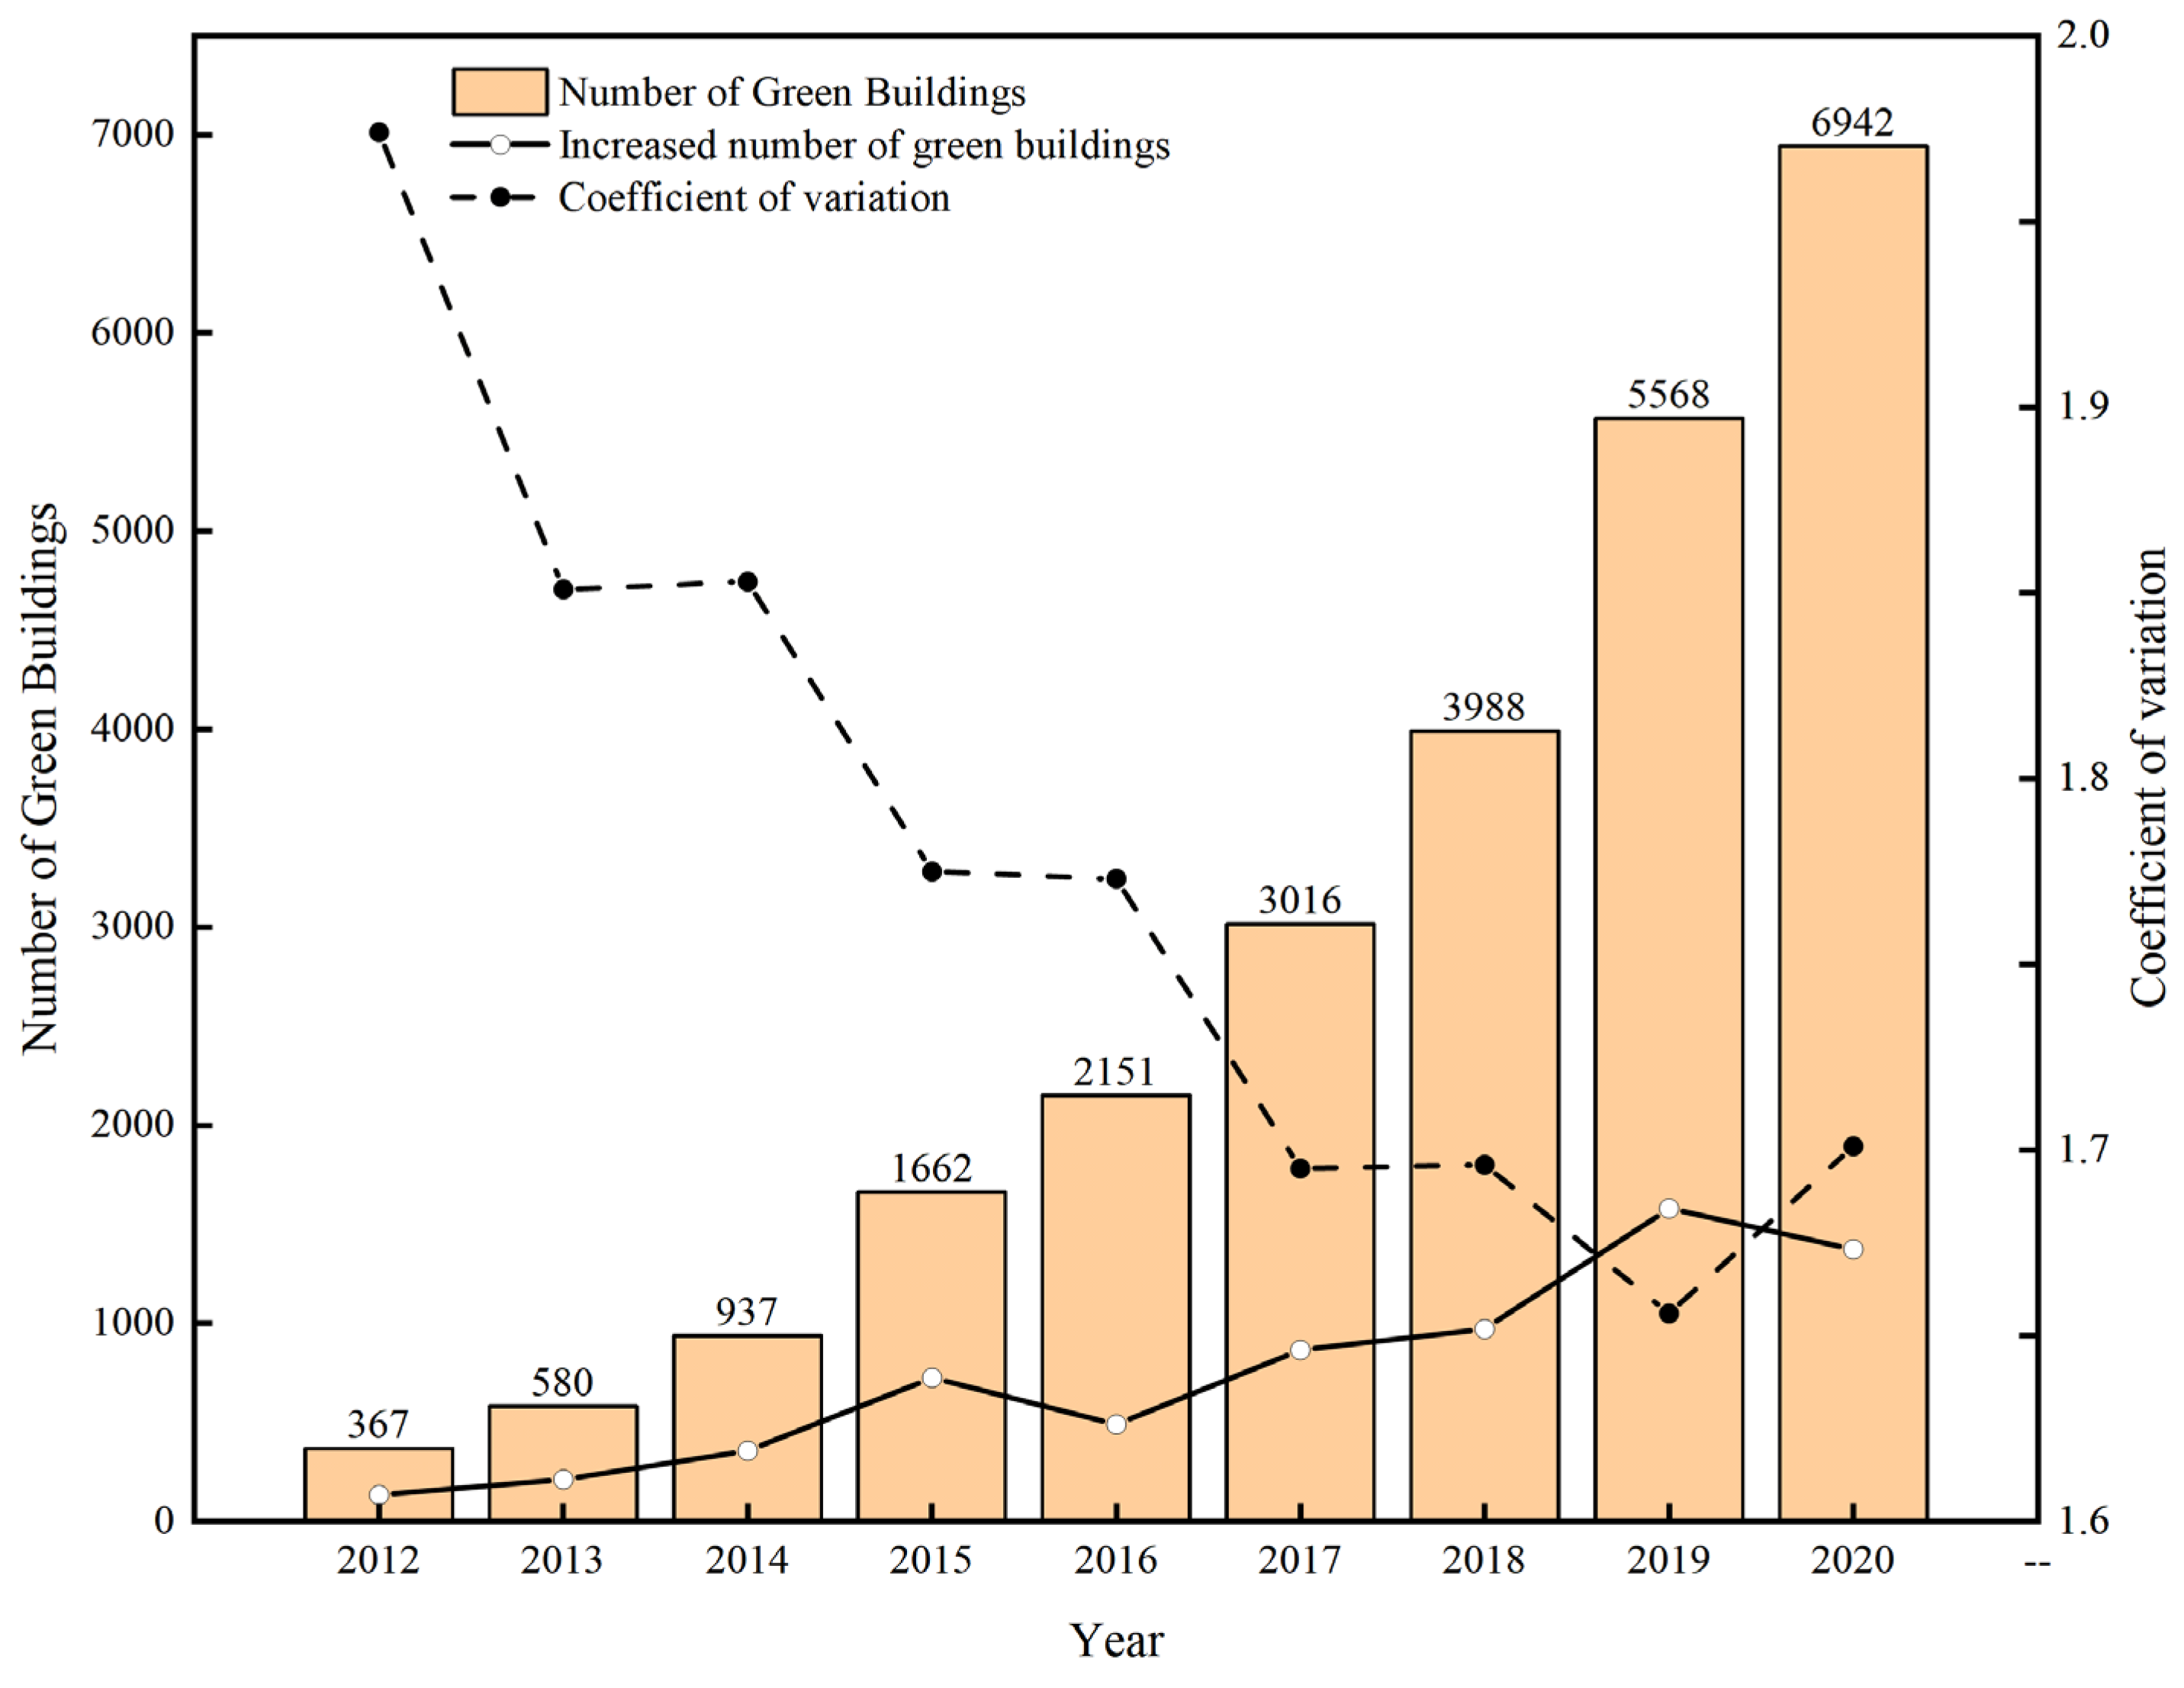
Based on the number of GBs in the YRD region city clusters year by year, the increment trend of GBs was analyzed. The coefficient of variation was used to reflect the dispersion of GB quantity in the YRD region city clusters, as shown in Figure 4.
As shown in Figure 4, the number of GBs in the YRD region city clusters is growing year by year, with an average annual growth rate of 44.41% from 2012 to 2020. The number of GBs increased from 367 in 2012 to 6942 in 2020, representing an increase of 1792%.
In terms of annual growth, the annual increment of GB in the YRD region city clusters mainly shows a zigzag upward trend of “slowly rising → falling → rapidly rising → falling”. GBs grew fastest in 2019 with 1580, and the slowest in 2012 with 134. The overall development of GBs in the YRD region city clusters is growing. The number of GBs rose slowly from 2012 to 2015, indicating that a series of national policies guiding GB practices may have played an important role during this period. A decline in GBs in 2016 may be due to the GB Evaluation Standard (GB/T50378-2014) [23] implementation in 2015. The evaluation criteria are stricter, making GB evaluation more difficult, so there was a brief fallback in the adoption of new standards for GBs for comprehensive quantitative assessment. Another rapid upward trend appears from 2017–2019. The decline in 2020 may be due to the implementation of the new GB Evaluation Standard (GB/T50378-2019) [5] in 2019. The standard regulates the time node of GB labeling evaluation, effectively restraining the GB technology to land, so it greatly impacts the evaluation of labeling certificates. The period 2017–2020 saw significant growth in GB quantity in the YRD city cluster, increasing by 4791, and accounting for 60% of the total growth.
The variation coefficient of GB quantity in the YRD region city clusters from 2012 to 2020 mainly presents a declining year-by-year trend. This is reflected in a decrease from 1.974 in 2012 to 1.701 in 2020, a decrease of 13.83%. This shows that the spatial differences in GB development in the urban agglomerations in the YRD region are great, but the gap in GB development is gradually narrowing, and the spatial aggregation is gradually increasing.

3.1.2. Distribution of GB Development in YRD Region City Clusters by City

The overall development of GBs in the YRD region city clusters has been relatively rapid, and the year-by-year development distribution of GBs in each city is shown in Figure 5, Figure 6 and Figure 7.
As shown in Figure 5, the increment in GBs in most cities shows a fluctuating upward trend. Suzhou (1), Wuxi, and Shanghai have great GB development, but many cities are slow. Most cities experienced a downward trend in incremental GB in both 2016 and 2020, mainly due to a decrease in the number of rated GB projects as a result of the promulgation and implementation of new standards. In 2017–2020, the incremental GB in Suzhou (1) and Wuxi was significant, obviously above other cities. This is mainly because Suzhou (1) and Wuxi have more developed economies, and their local governments actively implement regulations regarding GBs and have introduced a large number of policies to boost the reform and development of the building industry.
From Figure 6, it can be seen that Suzhou (1) had the most GBs in the YRD region city clusters by the end of 2020 with a total of 1499, followed by Wuxi and Shanghai with 863 and 756, respectively. As shown in Figure 7, by the end of 2020, the development of GBs in the northeast coastal region was significantly higher than in other regions, and the spatial distribution of GBs in the YRD region city clusters still shows sharp differences.
The spatial visualization of GBs in the YRD city cluster in 2012, 2016, and 2020 is carried out by using the natural discontinuity grading method [13] (see Figure 8). From Figure 8a, it can be seen that GBs in the YRD region city clusters in 2012 are relatively few. Being in the budding stage, they is mainly concentrated in economically developed cities such as Suzhou (1), Shanghai, Nanjing, and Wuxi (see red and orange), while other cities with sparse GBs show contiguous distribution (see green). The development of GBs in the central coastal region is significantly better than in other regions. As shown in Figure 8b, the overall GBs in the YRD region city clusters increased in 2016, with significant growth in Hefei and Hangzhou, becoming development highlands in the west and south. From Figure 8c, the number of GBs continued to grow in 2020, and GBs have been vigorously promoted. The cities with high numbers of GBs are more concentrated on the northeast coast, and the western and southern regions are still developing depressions.
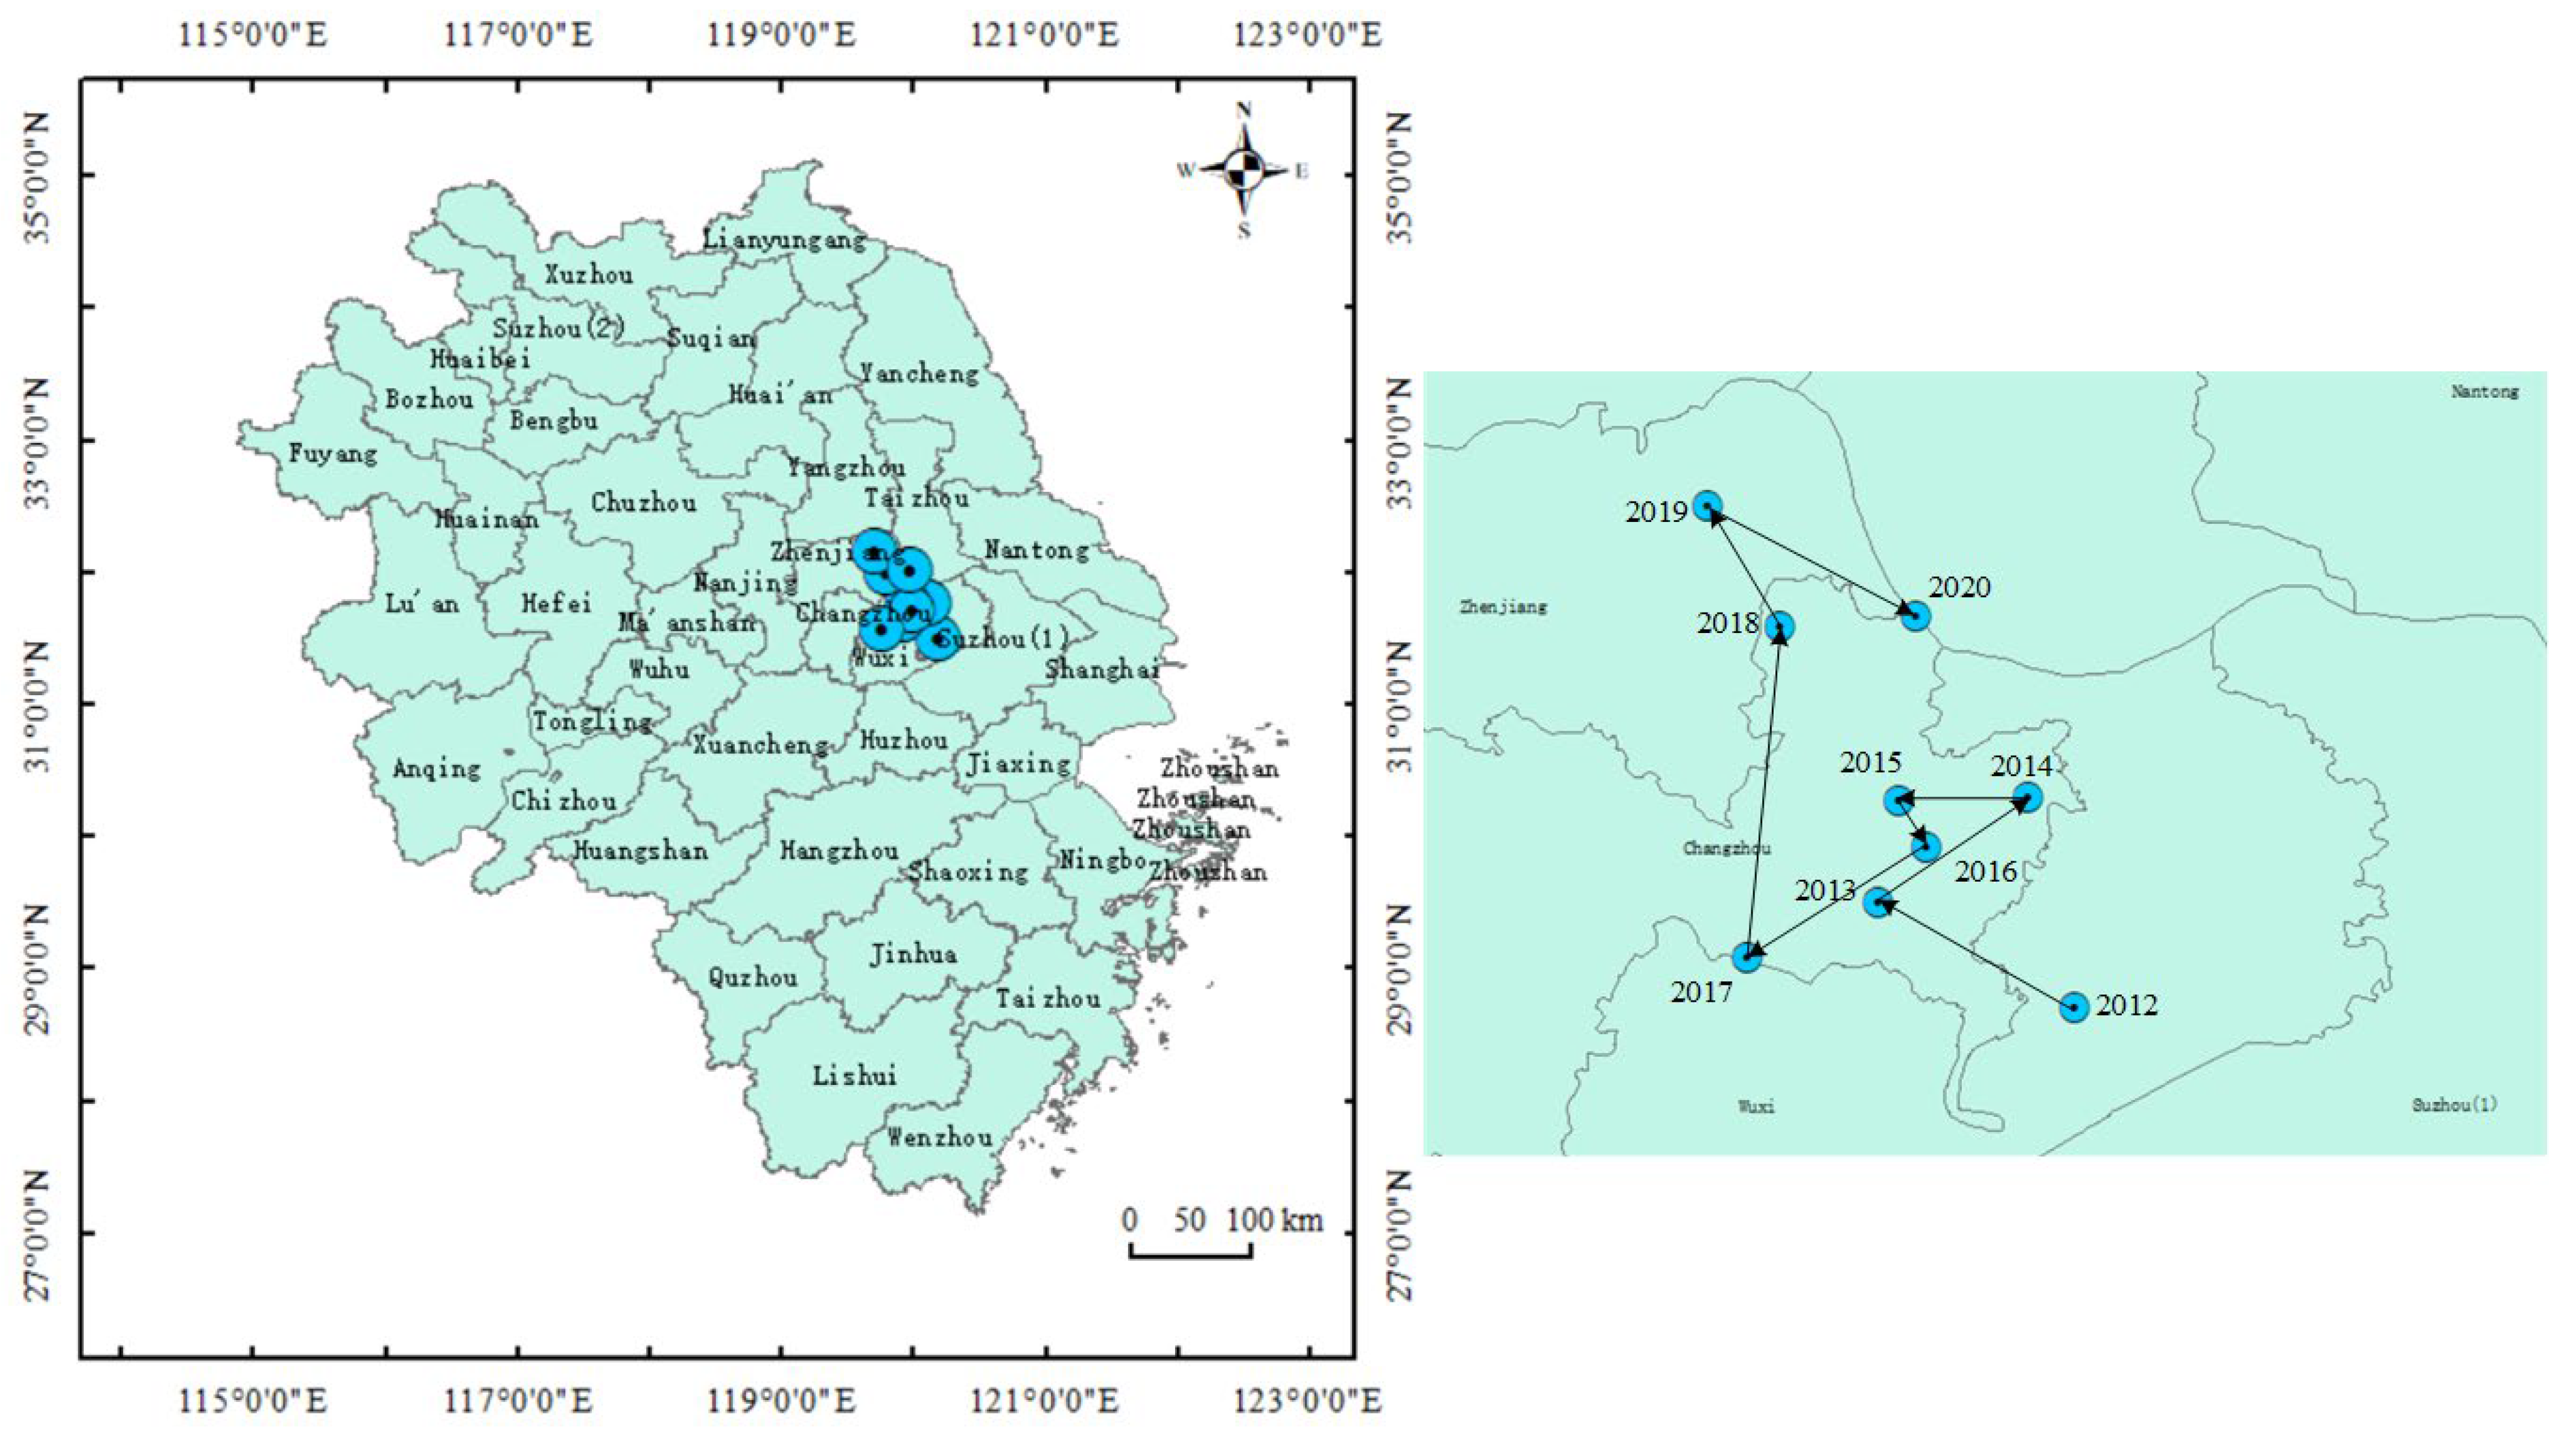
The spatial distribution and changes in GBs in the YRD region city clusters from 2012 to 2020 were analyzed by use of the gravity center analysis model, as shown in Figure 9. It is clear that the focus of GB development in the YRD region city clusters is mainly in east Changzhou, north Wuxi, and east Zhenjiang, with an overall bias toward the central-eastern part of the YRD region. Its overall track is to the northwest; in 2012–2013, heavily to the northwest; in 2014–2017, moving to the southwest direction; and in 2018–2019, again directed to the northwest. GBs from the aggregation of regions to discrete regional radiation were attracted back to the southeast in 2020 by core regions (Suzhou (1), Wuxi, and Shanghai). The north–south difference in the development of GBs in the YRD region city clusters has gone from fast development to quick weakening, from a certain fluctuation to rapid increase, showing an overall “strong in the north and weak in the south” pattern. The difference between east and west is small, staying “strong in the east and weak in the west”.

3.1.3. Spatial Differentiation of GBs in the YRD Region City Clusters

Spatial autocorrelation analysis was used to further explore the spatial differentiation of GBs in the YRD region city clusters, and the spatial clustering effect of GBs in 41 cities in the region from 2012 to 2020 was analyzed. The global Moran’s I of green buildings in the YRD region city clusters is greater than 0, and all passed the significance test (Z > 1.96, p < 0.01), indicating that there is a significant spatial correlation of GBs in the YRD region city clusters. As can be seen from Figure 10, Moran’s I reached the maximum value (0.5251) in 2020, indicating that the development of GBs in the YRD city cluster in 2020 shows an aggregation pattern in space, and the core cities give full play to the attraction effect. Moran’s I minimum value (0.3010) was observed in 2017, showing that the spatial aggregation effect of GB development in the YRD region city clusters was weakened to some extent in 2017.
The incremental GBs in the YRD region city clusters in 2012, 2016, and 2020 were clustered using the local LISA index, and the results are shown in Figure 11.
As shown in Figure 11, only some cities have obvious spatial agglomeration and can be mainly divided into four spatial autocorrelation regions, namely H-H, L-L, H-L, and L-H. There is only one H-H space autocorrelation cluster in the YRD region city clusters from 2012 to 2020. Its core is Shanghai–Suzhou (1)–Wuxi chain radiation belt, indicating that the three cities have economic strength, a good foundation for the development of the building industry, and strong support for the development of the GB industry. There are five scattered L-L space autocorrelated clustering regions, indicating that GB development in these five regions and their surroundings is not very satisfactory. Hefei was in an H-L spatial autocorrelation region in 2016, meaning that GB development here was not good, all at a low stage with its surroundings. According to the distribution of L-H spatial autocorrelation, GBs in Huzhou and Jiaxing appeared at low values many times during 2012–2020, and the development of GBs in the two cities is relatively slow. Increased GB promotion and incentive measures as well as improved implementation of policies are suggested. From the perspective of city leap, Nantong began to enter H-H spatial autocorrelation in 2016, indicating that Nantong, driven by neighbor cities, started to strengthen the close connection in GB development with its neighboring cities, and achieved some improvement in GBs. The withdrawal of Changzhou from the H-H spatially autocorrelated region in 2016 showed that the GB Evaluation Standard implemented in 2015 had a significant impact on GB development. After the vigorous development of GBs in Changzhou, it moved back into an H-H spatially autocorrelated region in 2020.

3.2. Impact Analysis of GB Increment in the YRD Region City Clusters

3.2.1. Selection of Influence Factors

Influenced by a combination of economy, society, culture, and policy in the region, the development of GBs in the YRD region city clusters is characterized by gradualism, complexity, differences, relativity, and stages. In this paper, through an analytical study of the literature on the drivers of GB development, 4 dimensional factors of population and economy, market environment, policy, and other factors, as well as 12 specific influence factors, were selected (see Table 3).
As shown in Table 3, the development of GBs in the YRD region city clusters is mainly influenced by population and economy, market environment, policies, and other factors. The population and economy dimension mainly includes GDP and disposable income per capita, which are related to the level of economic development. They measure the economic development and finance of a city and have a significant role to play in the development of GBs. The market environment dimension mainly includes the level of real estate development and technology development, which are connected to the level of real estate developed in the YRD. The motivation of real estate enterprises to develop GBs depends largely on the condition of the local real estate market, and the size of the real estate market is related to the number of GBs. The technology of the building industry and the number of enterprises are important factors supporting the development of GBs. The policy dimension mainly includes the relevant guiding policies and level of importance, which are related to the support for GB development in China and have a significant impact on GB development. A series of laws and regulations formulated in China provide a strong guarantee for GB development. The other factors dimension includes the natural environment and propaganda efforts. Due to different natural conditions, such as complex terrain and climate in the YRD region, the selection of design requirements, materials, and technologies for GBs will be different in each region, so the natural environment will influence the development of GBs. Different publicity efforts in each city will affect consumers’ acceptance of GBs, thus affecting the development of GBs.
Based on the analysis results of the spatiotemporal evolution of GB development in the YRD region city clusters, the GBs with an early start and higher development are mainly located in cities with developed economies, active real estate markets, and satisfactory policies, indicating that the start and degree of GB development is affected by the combination of economic, market, and policy factors.

3.2.2. Analysis of Factor Detection Results

(1)
Single Factor Analysis
The results of exploring the extent to which the influencing factors in 2012, 2016, and 2020 play a role in the differences in GB development in the YRD region city clusters with the help of GeoDetector are shown in Table 4.
Based on the mean explanatory power of factors influencing development difference in GB shown in Table 4, education level (X4), technology development level (X6), and GDP (X1) rank top in influencing GB development in the YRD region city clusters; their mean explanatory power exceeds 0.6, suggesting that these three factors play a dominant role in the differences in the distribution of GB. Among them, GDP (X1) is an important indicator for measuring the economic condition and development level of a region. To further reveal the relationship between GB development and gross product, the gross product of the YRD region city clusters in 2012, 2016, and 2020 is coupled with its incremental GB, and the outcome is seen in Figure 12. The development of GBs in the YRD region city clusters is mostly concentrated in regions with high GDP such as Shanghai, Suzhou (1), and Wuxi (blue region), and there is a close functional coupling between them. A higher GDP (X1) can provide good conditions for the building industry, promote its development, and drive the rapid development of GBs. Cities with high GDP (X1) have higher consumption capacity and recognition of GBs, which increases the demand for GBs and brings more market opportunities. The coupling effects of education level, technology development level, and GB development in the YRD region city clusters are analyzed analogously.
As shown in Table 4, through comparison of the effect degree of each influence factor in different years, the population and economy dimension (except for education level) and market environment dimension show a significant downward trend in influencing GB development. Education level (X4) presents an increasingly important influence in the development differences of GBs. As the level of education in each prefecture improves, the importance of environmental protection and a sustainable living environment is increasingly recognized; in this context, GBs can better meet the requirements of users than traditional buildings, and there is a need to vigorously promote the market development of GB. The population and economy have been the basis of GB development. When the development of the population and economy (except education level) reaches a certain level, their effect on the promotion of GB development will be reduced. Due to the lack of practical experience in GB development in the early stage, though the economic level and urban development in the YRD region city clusters are the among the highest in China. Green and technology levels need economic support, leading to faster development of GBs in cities with large economies in the early stage. However, with the planning and development of the YRD urban agglomeration, due to the radiation effect of the economic center of gravity, the economic strength of the entire region has increased greatly, environmental awareness has been raised, and the demand for GBs has increased, so the degree of influence on the spatial differences in the development of GBs in the YRD urban agglomeration appears to be insufficient for the late-stage potential. In the same way, the influence of the market environment is also reduced.
The influence of related guiding policies (X8) on GB development in the policy dimension is relatively stable, while the influence of the level of importance (X9) on GB development is fluctuating downward. The explanatory power value of the policy dimension with regard to development differences in GB is low, and the results of GeoDetector suggest that the policy dimension has little effect on the spatial development of GBs. This is mainly because the current GB-related policies are universal, and the GB-related policies of the YRD region city clusters are mainly incentive policies (GB Demonstration Project Special Support Measures, GB Creation Action Plan, Technical Guidelines for Passive Ultra-low Energy Consumption GBs, 13th Five-Year Plan for Energy Conservation and Emission Reduction, Opinions on Promoting the Sustainable and Healthy Development of the building industry, 13th Five-Year Plan for Building Energy Conservation and GB Development). Incentive policies are based on national policies, and each city proposes targeted policies on the degree of GB incentives and subsidy levels. Therefore, the spatial differentiation of the policy dimension is weak. In recent years, the government has attached great importance to the goals of carbon peaking and carbon neutrality, resulting in no major differences in the policy environment for GB development in the YRD region city clusters.
Among other factor dimensions, the impact of the primary energy supply rate (X10) on GB development is relatively stable, while the natural environment (X11) and publicity efforts (X12) can stimulate GB development. The influence of the natural environment (X11) on GB development is reflected in conformity with local suitability. When the climate and terrain are superior, the technical requirements for GBs are relatively simple and the economic costs are correspondingly low, and the technical and cost resistance to the development of GBs will be reduced. In general, the more cities with good natural conditions pay attention to ecological protection, the more GBs are promoted. Publicity efforts (X12) have a certain role in promoting the spatial patterns of GB development in cities. The publicity of GBs can plant green concepts into the hearts of people, and at the same time can improve the reputation of government and enterprises, thus promoting the development of GBs.
(2)
Two-Factor Interaction Analysis
To clarify the interaction of factors influencing GB development in the YRD region city clusters, the interaction between factors was explored using GeoDetector, and the outcome is shown in Table 5.
As shown in Table 5, the interactive utility of factors in the YRD region city clusters shows two-factor enhancement and nonlinear enhancement, and there is neither an independent nor a weakening relationship. This suggests that the influence of two-factor interactions is greater than that of single-factor ones, and the development of GB is the outcome of a combination of influencing factors. The two-factor enhancements in 2012, 2016, and 2020 were 83.33%, 74.24%, and 63.63%, respectively.
The core interaction factors influencing GB development in 2012 were GDP (X1) and the natural environment (X11), whose interaction influence exceeds 0.97. The explanatory power for GB development is the greatest when they work together. On the other hand, the interaction between related guiding policies (X8) and the level of importance (X9) is low, with an interaction influence of 0.3468, and has little explanatory power. The core interacting factors influencing GB development in 2016 were education level (X4) and the natural environment (X11), with an interaction influence of more than 0.97. When working together, they have the greatest explanatory power for GB development. Meanwhile, related guiding policies (X8) and the level of importance (X9) have the lowest interaction influence of 0.1527 and the least explanatory power. The core interacting factors influencing GB development in 2020 were the real estate development level (X5) and the natural environment (X11), whose interactive influence exceeds 0.97, and these two factors have the greatest explanatory power for GB development when working together. By contrast, the lowest interaction is related to guiding policies (X8) and the level of importance (X9), with an interactive influence of 0.1558, having the least explanatory power for GB development.
The interaction between the natural environment (X11) and other factors is the most obvious, indicating that the natural environment (X11) plays a dominant role in the differential distribution of GB development, and its influence on the spatial distribution of GBs is strengthened by interaction. In addition, the low two-factor interaction under the policy dimension indicates that the policy dimension’s influence on divergent characteristics of GBs is not obvious, and the spatial divergence is also weak from a single-factor perspective in the policy dimension, so the interaction of the factors in policy dimension does not produce an obvious enhancement. However, the interaction between the policy dimension and other factors can significantly enhance the explanatory power of the policy dimension for the spatial differentiation of GBs.

4. Discussion

The scientific significance of exploring the spatiotemporal evolution of GBs in the YRD region city clusters is that it can elucidate the spatial differences, distribution patterns, and changing trends of GBs at the macroscopic scale. Compared with existing studies on GBs at the provincial level [9,16,17,22], this study helps scholars understand the characteristics of the spatiotemporal evolution of GBs at the municipal level. As the first urban agglomeration in China, exploring the spatial and temporal evolution characteristics and driving factors of the YRD region city clusters can provide a scientific basis for promoting the coordinated green development of the regional economy and for the development of GBs in other cities [38].
Based on mathematical and statistical analysis, the average annual growth rate from 2012 to 2020 reached 44.41%, the number of GBs showed a yearly growth trend, and the decrease in the coefficient of variation from 2012 to 2020 reached 13.83%; the gap in GB development levels is gradually decreasing, and the development is consistent with the overall development of China [16]. Based on spatial statistical analysis, GBs in the YRD region city clusters show typical spatial aggregation characteristics, with Suzhou (1) and Shanghai as the core of the H-H spatial autocorrelation type distribution pattern, and the core cities have strong attraction ability but relatively low radiation ability [17,38]. This paper argues that education level, technology development level, and gross product are the main driving factors of the spatial divergence pattern of GB development in the YRD region city clusters, which is consistent with the findings of Gao et al. [9]. This paper enriches the study of GB distribution and its driving factors in the YRD region city clusters, which can provide a basis and reference for other related studies.

5. Conclusions

This paper takes the YRD region city clusters as the study area and the city as the study unit. The coefficient of variation, center of gravity analysis, the global Moran’s index, and the local LISA index are used to comprehensively explore the spatiotemporal evolution characteristics and spatial association patterns of GB development differences in the YRD region city clusters. The influence factors of GB development were analyzed with the help of GeoDetector to clarify the main driving factors of the spatial differentiation pattern of GB development, and the following conclusions were obtained:
(1)
The number of GBs in the YRD region city clusters group is growing year by year, but the spatial difference in GB development is significant, and the overall pattern is “strong in the north and weak in the south; strong in the east and weak in the west”. The cities with low levels of GB development should connect GB development with economic development, pay attention to regional policies, and use their regional advantages to promote GBs. Cities with higher levels of GB development should break through the GB technology developed, establish GB demonstration bases, and promote the development of GBs in the direction of intelligence and architecture.
(2)
The development of GBs is spatially positively correlated, showing a high aggregation pattern and obvious polarization phenomenon, gradually forming a Shanghai–Suzhou (1)–Wuxi chain radiation zone. The clustering results show that the YRD urban agglomeration lacks an H-H spatial autocorrelation distribution pattern except for the core cities, and there are several L-L spatial autocorrelation regions, indicating that the core cities have strong attraction ability but relatively low radiation ability. Therefore, the planning and construction of ecological cities should not only pay attention to their elemental conditions but also make full use of the geographical conditions, such as the regional characteristics of those areas where GB development is concentrated. The cities with high levels of GB development are used as the centers to radiate the surrounding cities, drive the development of the surrounding cities, strengthen the exchange activities of eco-city construction between regions, expand the scope and intensity of GB development, and realize leapfrog development.
(3)
The main driving factors of the spatial differentiation pattern of GB development in the YRD region city clusters are education level, technical level, and gross domestic product. In order to break the uneven development of GBs, cities with lower levels of GB development should focus on the following measures: improve education level and enhance consumers’ awareness of green and low-carbon; actively strengthen technical investment in GB and integrate new technologies into the development of GBs; and promote economic development and stimulate the willingness of real estate companies to develop GBs.
Given the above conclusions, the following suggestions are made:
(1)
The government should pay great attention to the spatiotemporal distribution pattern of GBs and introduce differentiated regulation policies according to their development status.
(2)
Introduce advanced GB technologies according to local conditions.
(3)
Establish a GB information sharing and exchange mechanisms to promote information sharing and exchange among cities. The cities with lower levels of green development can learn from the development mode of cities with higher levels.
(4)
Each city should combine its resource advantages, reasonably allocate resources, and focus on the synergistic development of each region.
(5)
Cities that invest too much in redundancy need to increase their talent pool and improve their innovation capacity and resource allocation efficiency.
There are still some limitations in this study and also directions for further research in the future. Limited by the availability of data, only GB numbers were selected to measure the spatiotemporal evolution of their development in the YRD city cluster, and the evolutionary characteristics of GBs with different star ratings were not analyzed. In addition, GB development should be influenced by more factors, yet in this study, the factors selected are merely based on available data and existing research, and thus possibly not comprehensive. In future studies, more comprehensive data variables should be used in the analysis.

Author Contributions

W.Z.: conceptualization, methodology, and writing—original draft; J.Z.: software and writing—original draft; J.D.: conceptualization and data curation; D.W.: data curation and methodology; C.M.: visualization and writing—reviewing and editing; Y.X.: writing—reviewing and editing; Y.C.: methodology and visualization. All authors have read and agreed to the published version of the manuscript.

Funding

This work was supported by the Natural Science Foundation of Hunan Province (grant number 2023JJ30056), and the Changsha Natural Science Foundation Project (grant number kq2208237).

Institutional Review Board Statement

Not applicable.

Informed Consent Statement

Not applicable.

Data Availability Statement

The data that support the findings of this study are available from the corresponding author upon reasonable request.

Conflicts of Interest

The authors declare no conflict of interest.

References

  1. Dong, R. International Energy Agency: Analysis of Global Carbon Dioxide Emissions in 2022. China Electr. Enterp. Manag. 2023, 7, 94–95. [Google Scholar]
  2. Zhang, K.; Lu, Y.M.; Lu, H.S. Countermeasures for High Quality Development of Green Buildings in China under the Background of “Double Carbon” Goal. Constr. Econom. 2022, 43, 14–20. [Google Scholar] [CrossRef]
  3. Ye, Z.D. The Geography of Green Buildings in Chinese Cities. Mod. Urban Res. 2012, 27, 42–48. [Google Scholar]
  4. Wang, B.; Liao, F.W.; Zhang, J.Q. Evolutionary Game and Simulation of Key Subjects in Green Building Development. J. Technol. Econom. Manag. 2021, 7, 109–114. [Google Scholar]
  5. GB/T 50378-2019; Green Building Evaluation Standard. National Standards of the People’s Republic of China: Beijing, China, 2019.
  6. Qiao, W.; Dong, P.; Ju, Y. Synergistic development of green building market under government guidance: A case study of Tianjin, China. J. Clean. Prod. 2022, 340, 130540. [Google Scholar] [CrossRef]
  7. Chen, L.; Chan, A.P.; Darko, A.; Gao, X. Spatial-temporal investigation of green building promotion efficiency: The case of China. J. Clean. Prod. 2022, 362, 132299. [Google Scholar] [CrossRef]
  8. Zhao, H.; Xu, N.; Li, F. Research on development level of urban green building industry: A case study of Shandong Province. J. Shandong Jianzhu Univ. 2018, 33, 22–28. [Google Scholar]
  9. Gao, Y.; Yang, G.; Xie, Q. Spatial-Temporal Evolution and Driving Factors of Green Building Development in China. Sustainability 2020, 12, 2773. [Google Scholar] [CrossRef] [Green Version]
  10. Qiu, Y.; Tiwari, A.; Wang, Y.D. The diffusion of voluntary green building certification: A spatial approach. Energy Effic. 2014, 8, 449–471. [Google Scholar] [CrossRef]
  11. Cidell, J. Building Green: The Emerging Geography of LEED-Certified Buildings and Professionals. Prof. Geogr. 2009, 61, 200–215. [Google Scholar] [CrossRef]
  12. Kaza, N.; Lester, T.W.; Rodriguez, D.A. The Spatio-temporal Clustering of Green Buildings in the United States. Urban Stud. 2013, 50, 3262–3282. [Google Scholar] [CrossRef]
  13. Kahn, M.E.; Vaughn, R.K. Green Market Geography: The Spatial Clustering of Hybrid Vehicles and LEED Registered Buildings. BE J. Econ. Anal. Policy 2009, 9, 2030. [Google Scholar] [CrossRef]
  14. Guo, K.; Yuan, Y. Geographic Distribution and Influencing Factor Analysis of Green Residential Buildings in China. Sustainability 2021, 13, 12060. [Google Scholar] [CrossRef]
  15. Li, D.H. Regional Differences among the Development Models of Green Buildings in China—Based on statistical data from 2006 to 2014. Hous. Sci. 2019, 39, 35–43. [Google Scholar]
  16. Zhang, B.; Zhong, M. Measuring the Development Level and Temporal-Spatial Evolution Characteristics of Green Buildings. J. Eng. Manag. 2022, 36, 80–85. [Google Scholar] [CrossRef]
  17. Qiu, B.X.; Li, D.H.; Wu, Z.Q. Study on the Character of Chinese Green Building Spatial Evolution. Urban Dev. Stud. 2017, 24, 1–10. [Google Scholar]
  18. Liu, X.J.; Li, P. Spatial and Temporal Evolution and Driving Mechanism of Green Building Area in China. Ecol. Econ. 2021, 37, 88–94, 142. [Google Scholar]
  19. Zhang, S.S.; Liu, C.X.; Zhou, H. The Influence Factors Analysis of Green Building Development Based on Fuzzy Clustering: Taking Shenyang as an Example. J. Shenyang Jianzhu Univ. 2016, 18, 162–168. [Google Scholar]
  20. Guo, K.; Yuan, Y. Research on Spatial and Temporal Evolution Trends and Driving Factors of Green Residences in China Based on Weighted Standard Deviational Ellipse and Panel Tobit Model. Appl. Sci. 2022, 12, 8788. [Google Scholar] [CrossRef]
  21. Wang, J.; Xu, C. Geodetector: Principle and prospective. Acta Geogr. Sin. 2017, 73, 219–231. [Google Scholar]
  22. Liu, K.; Xue, Y.; Chen, Z.; Myao, Y. The spatiotemporal evolution and influencing factors of urban green innovation in China. Sci. Total Environ. 2023, 857, 159426. [Google Scholar] [CrossRef]
  23. GB/T 50378-2014; Green Building Evaluation Standard. National Standards of the People’s Republic of China: Beijing, China, 2014.
  24. Zou, Y.H.; Zhao, W.X.; Zhong, R.J. The spatial distribution of green buildings in China: Regional imbalance, economic funda-mentals, and policy incentives. Appl. Geogr. 2017, 88, 38–47. [Google Scholar] [CrossRef]
  25. Cidell, J.; Cope, M.A. Factors explaining the adoption and impact of LEED-based green building policies at the municipal level. J. Environ. Plan. Manag. 2013, 57, 1763–1781. [Google Scholar] [CrossRef]
  26. Zhang, Y.; Kang, J.; Jin, H.; Zhang, Y. Influencing Factors of the Development of Green Building by Designers Based on Grounded Theory. Int. J. Struct. Civ. Eng. Res. 2022, 11, 35–41. [Google Scholar] [CrossRef]
  27. Braun, T.; Cajias, M.; Hohenstatt, R. Societal Influence on Diffusion of Green Buildings: A Count Regression Approach. J. Real Estate Res. 2017, 39, 1–38. [Google Scholar] [CrossRef]
  28. Kok, N.; McGraw, M.; Quigley, J.M. The Diffusion of Energy Efficiency in Building. Am. Econ. Rev. 2011, 101, 77–82. [Google Scholar] [CrossRef] [Green Version]
  29. Kontokosta, C. Greening the Regulatory Landscape: The Spatial and Temporal Diffusion of Green Building Policies in U. S. Cities. J. Sustain. Real Estate 2011, 3, 68–90. [Google Scholar] [CrossRef]
  30. Li, G.; Ma, X.; Song, Y. Green Building Efficiency and Influencing Factors of Transportation Infrastructure in China: Based on Three-Stage Super-Efficiency SBM–DEA and Tobit Models. Buildings 2022, 12, 623. [Google Scholar] [CrossRef]
  31. Dong, S.X.; Liu, Y.M. Promotion Strategy of Green Building Large-scale Development Based on System Dynamics. J. Eng. Manag. 2013, 27, 16–20. [Google Scholar]
  32. Hu, W.F.; Kong, D.L.; He, X.H. Analysis on Influencing Factors of Green Building Development Based on BP-WINGS. Soft Sci. 2020, 34, 75–81. [Google Scholar]
  33. Zhou, Q.; Wang, H.P.; Xue, H.Y. A Study of the Driving Mechanism for Green Building Development in China. J. Xi’an Univ. Archit. Technol. 2019, 38, 28–38. [Google Scholar] [CrossRef]
  34. Song, Y.; Li, C.; Zhou, L.; Huang, X.; Chen, Y.; Zhang, H. Factors affecting green building development at the municipal level: A cross-sectional study in China. Energy Build. 2020, 231, 110560. [Google Scholar] [CrossRef]
  35. Chen, L.W.; Zhao, S.H.; Zhang, Z.J. Research on Related Drivers for GreenBuilding Development—A Literature Review. Resour. Dev. Mark. 2018, 34, 1229–1236. [Google Scholar] [CrossRef]
  36. Zhu, W.X.; Dai, J.F.; Chen, Y. Research on the dynamic evolution model and simulation of green construction technology innovation in construction enterprises. J. Chang. Univ. Sci. Technol. 2023, 20, 1–10. [Google Scholar]
  37. Zhu, W.X.; Zhang, J.; Wang, D.; Ma, C.; Zhang, J.; Chen, P. Study on the Critical Factors Influencing High-Quality Development of Green Buildings for Carbon Peaking and Carbon Neutrality Goals of China. Sustainability 2023, 15, 5035. [Google Scholar] [CrossRef]
  38. Miao, W.Y. Study on the spatial and temporal patterns of green development efficiency in the Yangtze River Delta urban ag-glomeration–an empirical investigation based on 41 cities in the Yangtze River Delta region from 2006 to 2020. China Arab. Sci. Technol. Forum 2023, 5, 18–22. [Google Scholar]
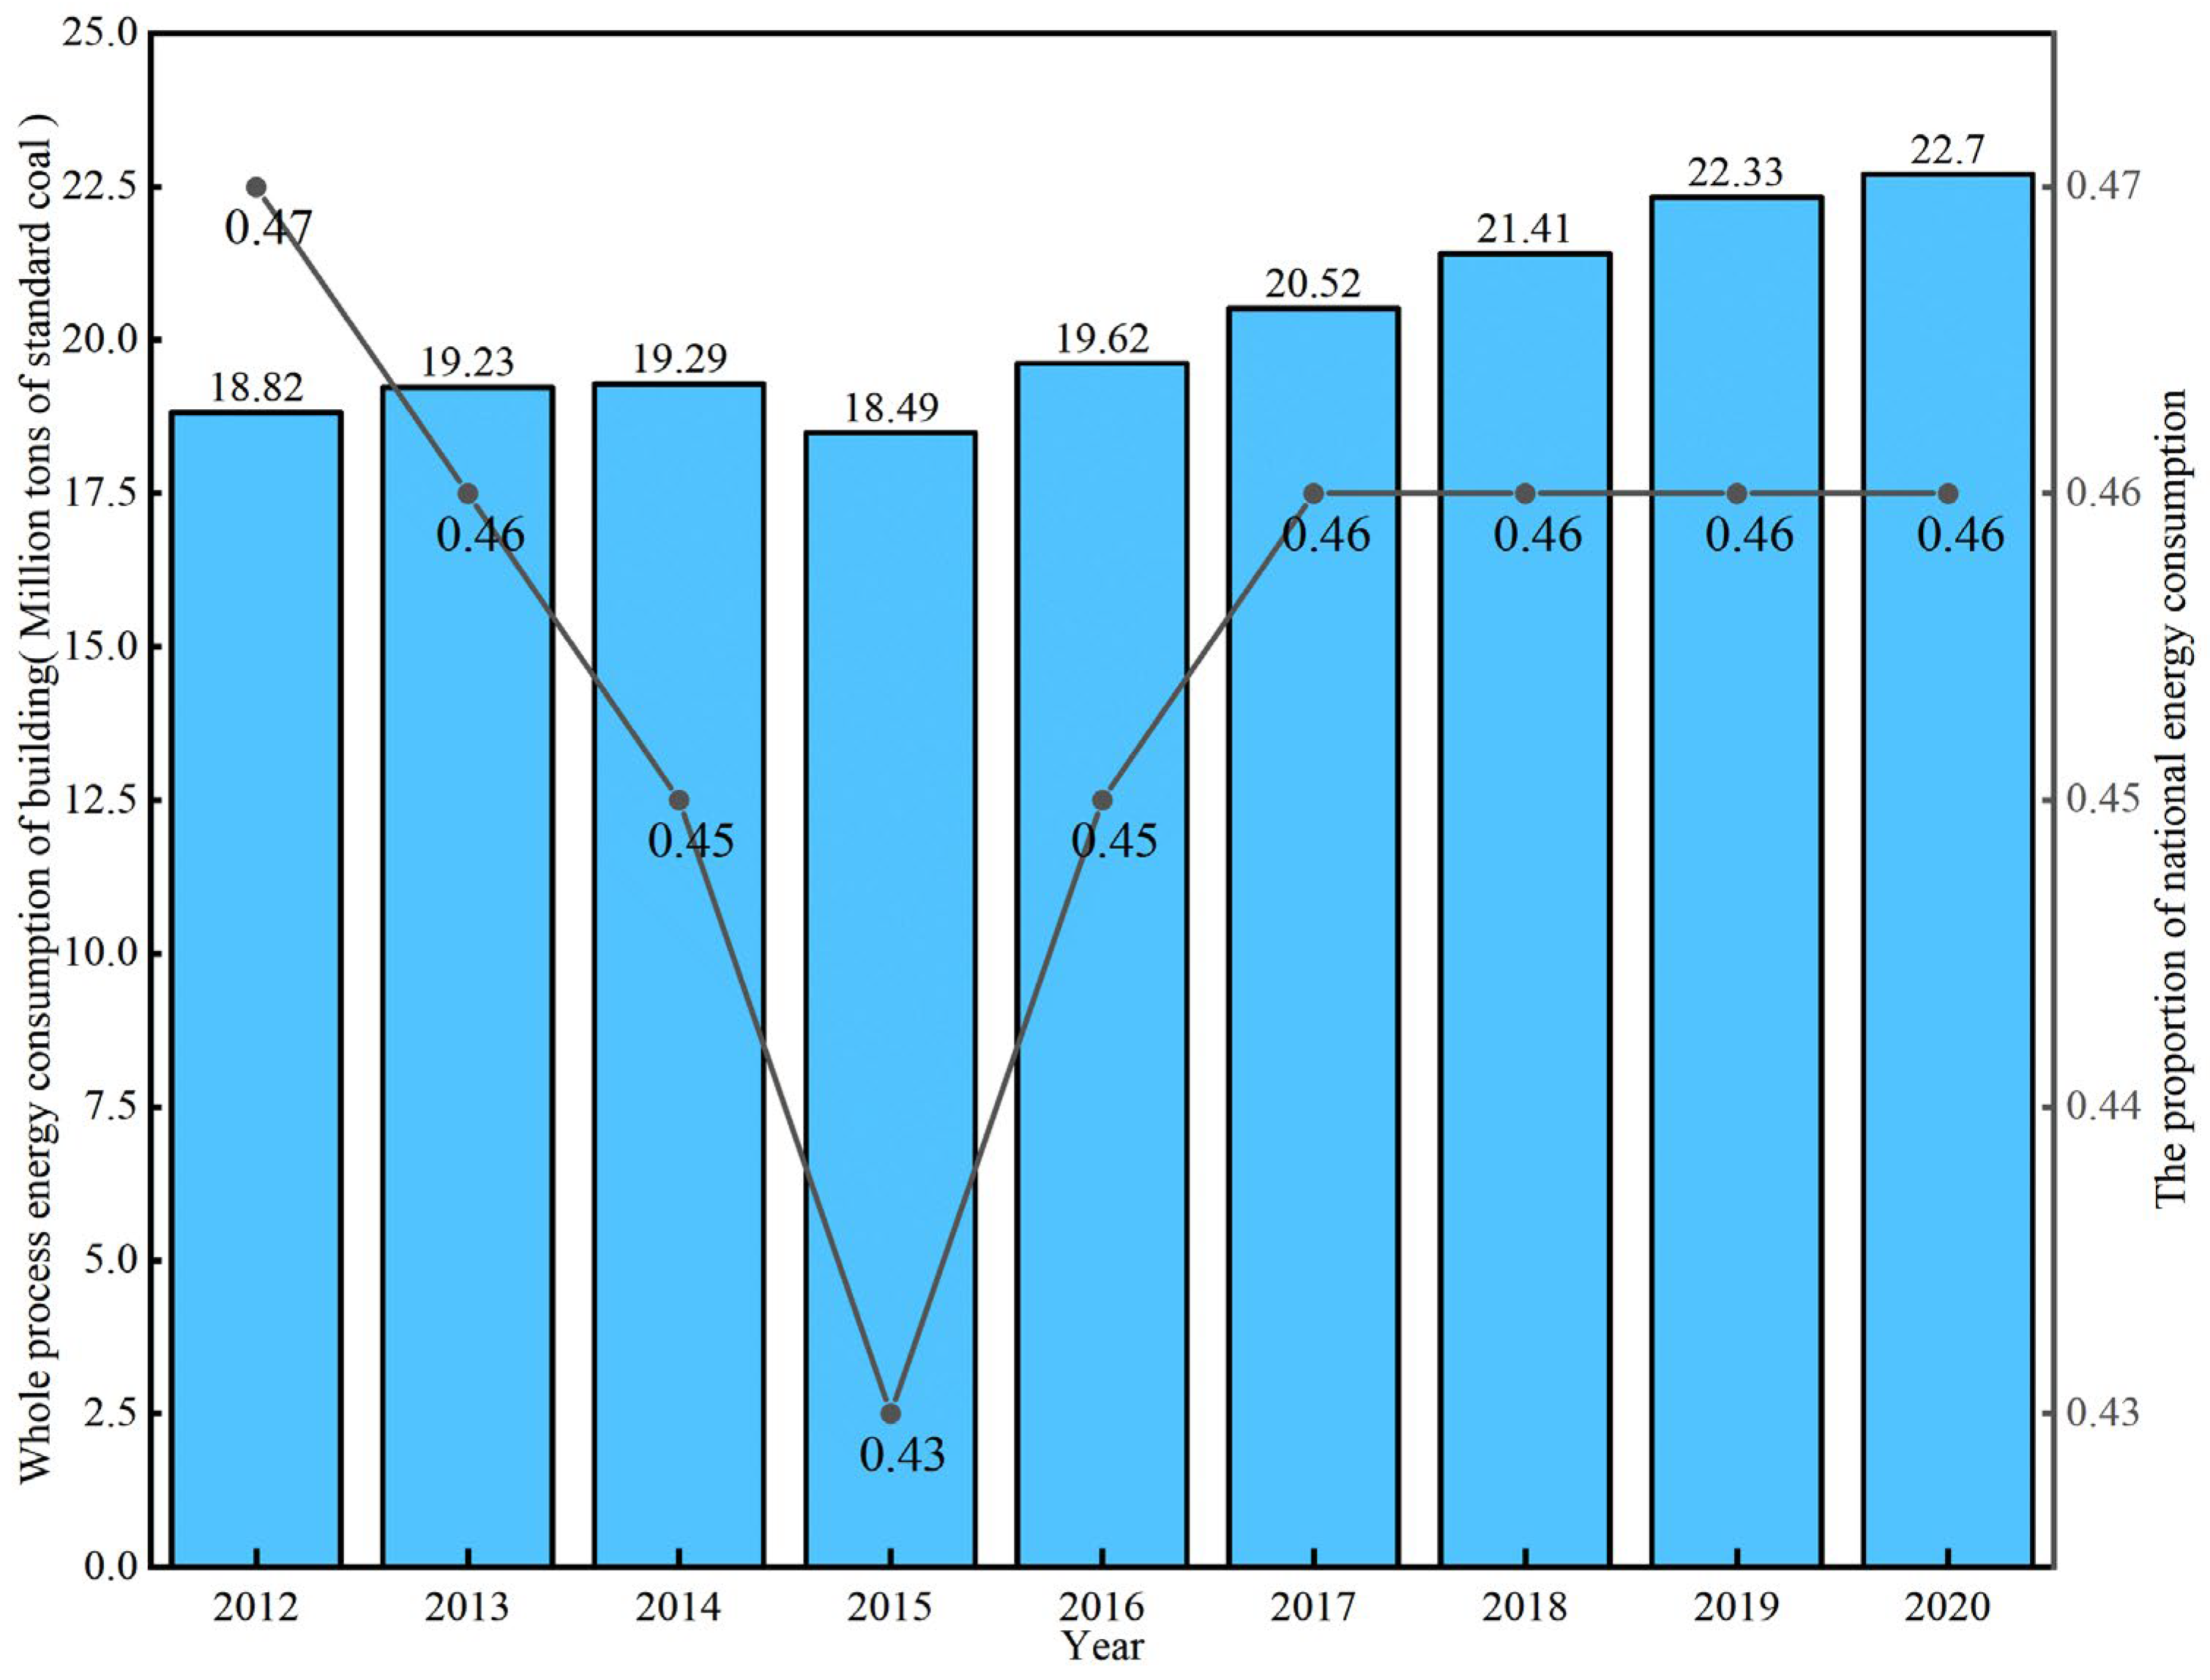
Figure 1. The whole process of building energy consumption over the years.
Sustainability 15 09457 g001
Figure 2. The whole process of building carbon emissions over the years.
Sustainability 15 09457 g002
Figure 3. Technology Roadmap.
Sustainability 15 09457 g003
Figure 4. GB Development in YRD region city clusters from 2012 to 2020.
Sustainability 15 09457 g004
Figure 5. The incremental development level of GBs in the YRD region city clusters. Where (a) represents cities with fast green building development, (b) represents cities with medium green building development, and (c) represents cities with slow green building development. Suzhou (1) prefecture-level city in Jiangsu. Suzhou (2) prefecture-level city in Anhui.
Sustainability 15 09457 g005
Figure 6. Total GBs in 2020.
Sustainability 15 09457 g006
Figure 7. Distribution of total GBs in 2020.
Sustainability 15 09457 g007
Figure 8. Spatiotemporal evolution of GBs in the YRD region city clusters. Where (ac) represents the spatial visualization of GBs in the YRD region city clusters in 2012, 2016, and 2018, respectively.
Sustainability 15 09457 g008
Figure 9. Trajectory of the GB center of gravity in the YRD region city clusters.
Sustainability 15 09457 g009
Figure 10. Global Moran’s I for incremental GB in the YRD region city clusters.
Sustainability 15 09457 g010
Figure 11. Aggregation chart of incremental GB in the YRD region city clusters.
Sustainability 15 09457 g011
Figure 12. Coupling of incremental GB and GDP. The black dots in the graph represent incremental green building.
Sustainability 15 09457 g012
Table 1. Data sources.
Data TypeUnitData SourcesUpdate FrequencySpatiotemporal Scales
GB data Number of GBsIndGreen Building Evaluation Marking Network, Provincial and Municipal Housing and Urban–rural Construction DepartmentsReal-time updateYear
Influencing factor dataGross Domestic ProductBillionProvincial and Municipal Statistical YearbooksAnnual
Disposable income
per capita
Yuan
Urbanization rateNone
Education levelTen thousand persons
Real estate
development level
Billion
Technology
development level
Pieces
Industry scaleDoor
Related guiding policiesBand
Level of importanceNone
The primary
energy supply rate
Billion cubic meters
Natural environmentMeter
Publicity effortsPartThematic Full-text Database of China’s important NewspapersReal-time update
Table 2. Interaction detection types.
JudgmentInteraction
q(X1 ∩ X2) < Min(q(X1), q(X2))Nonlinear weakening
Min(q(X1), q(X2)) < q(X1 ∩ X2) < Max(q(X1), q(X2))Single-factor nonlinear weakening
q(X1 ∩ X2) > Max(q(X1), q(X2))Two-factor enhancement
q(X1 ∩ X2) = q(X1) + q(X2)Independent
q(X1 ∩ X2) > q(X1) + q(X2)Nonlinear enhancement
Table 3. Factors influencing GB development in the YRD region city clusters.
DimensionInfluence FactorsExplanationReferences
Population and EconomyGross Domestic Product (GDP) X1Total final production of all resident units in the YRD region during a given periodZou et al. [24], Cidell et al. [25], and Zhang et al. [26]
Disposable income
per capita X2
Discretionary income available to residentsBraun et al. [27], Kok [28], and Kontokosta [29]
Urbanization rate X3The proportion of resident population in cities and towns to total population in the YRD regionZhang et al. [16] and Li et al. [30]
Education level X4The average number of college students per 10,000 populationGuo et al. [14]
Market EnvironmentReal estate
development level X5
Investment in real estate developmentDong et al. [31] and Zhang et al. [26]
Technology
development level X6
Granted patentHu et al. [32], Zhou et al. [33], and Zhang et al. [26]
Industry scale X7Number of construction enterprisesZhang et al. [16]
PolicyRelated guiding policies X8GB-Related PoliciesCidell et al. [25], Song et al. [34], and Chen et al. [35]
Level of importance X9Proportion of expenditure on energy saving and environmental protection in public expenditureHu et al. [32], Zhang et al. [26], and Zhu et al. [36]
Other FactorsThe primary
energy supply rate X10
Total water resourcesGuo et al. [14]
Natural environment X11Average altitudeKontokosta [29] and Braun et al. [27]
Publicity efforts X12Number of special reports by mainstream mediaKontokosta [29], Zhang et al. [26], and Zhu et al. [37]
Table 4. The intensity of influencing factors of GB development difference in the YRD region city clusters.
YearX1X2X3X4X5X6X7X8X9X10X11X12
20120.65180.53320.64030.55370.40640.72770.71470.00070.34650.42630.22080.5332
20160.73700.49850.68230.62220.47330.63890.65170.10510.10210.51710.44240.3140
20200.43860.32080.35980.82080.11690.51420.35490.00110.15360.41150.61610.5679
Explanatory power mean0.60910.45080.56080.66560.33220.62690.57380.03560.20080.45160.42640.4717
Note: All characteristic variables are significant at the 1% confidence level.
Table 5. Interaction of GB development factors in the YRD region city clusters.
Interaction Type201220162020Interaction Type201220162020Interaction Type201220162020
X1 ∩ X20.7399 *0.9702 *0.8705 **X3 ∩ X50.9200 *0.8974 *0.7388 **X5 ∩ X120.6799 *0.7449 *0.7905 **
X1 ∩ X30.7743 *0.8411 *0.7501 *X3 ∩ X60.8886 *0.8420 *0.7712 *X6 ∩ X70.8318 *0.7828 *0.6910 *
X1 ∩ X40.8265 *0.9425 *0.9569 *X3 ∩ X70.8481 *0.8331 *0.8226 **X6 ∩ X80.7279 *0.8337 **0.5146 *
X1 ∩ X50.8107 *0.9079 *0.8871 **X3 ∩ X80.6403 *0.8329 **0.3612 *X6 ∩ X90.8715 *0.8347 **0.7288 **
X1 ∩ X60.8967 *0.9362 *0.8121 *X3 ∩ X90.7839 *0.7869 **0.5234 **X6 ∩ X100.8787 *0.9207 *0.8385 *
X1 ∩ X70.8443 *0.7526 *0.5979 *X3 ∩ X100.9639 *0.9493 *0.8909 **X6 ∩ X110.8794 *0.9623 *0.9461 *
X1 ∩ X80.6519 *0.9010 **0.4390 *X3 ∩ X110.9248 **0.9408 *0.9147 *X6 ∩ X120.8726 *0.7722 *0.8304 *
X1 ∩ X90.9043 *0.8097 *0.6753 **X3 ∩ X120.7540 *0.8121 *0.8678 *X7 ∩ X80.7148 *0.8488 **0.3554 *
X1 ∩ X100.9490 *0.9499 *0.8011 *X4 ∩ X50.7533 *0.8099 *0.9344 *X7 ∩ X90.8855 *0.7953 **0.6115 **
X1 ∩ X110.9745 **0.9457 *0.9229 *X4 ∩ X60.8590 *0.8643 *0.9074 *X7 ∩ X100.8771 *0.9334 *0.8467 **
X1 ∩ X120.7172 *0.7822 *0.8855 *X4 ∩ X70.8022 *0.9094 *0.9489 *X7 ∩ X110.9082 *0.9108 *0.8578 *
X2 ∩ X30.8480 *0.9140 *0.7990 **X4 ∩ X80.5540 *0.7169 *0.8209 *X7 ∩ X120.7709 *0.7429 *0.9103 *
X2 ∩ X40.8365 *0.8703 *0.9749 *X4 ∩ X90.8997 *0.7757 **0.8738 *X8 ∩ X90.3468 *0.1527 *0.1558 **
X2 ∩ X50.8116 *0.8583 *0.5663 **X4 ∩ X100.8056 *0.9254 *0.8958 *X8 ∩ X100.4268 *0.5414 *0.4119 *
X2 ∩ X60.7588 *0.8469 *0.6781 *X4 ∩ X110.9695 **0.9707 *0.9686 *X8 ∩ X110.2210 *0.5260 *0.6162 *
X2 ∩ X70.8088 *0.9243 *0.8740 **X4 ∩ X120.7352 *0.8242 *0.8379 *X8 ∩ X120.4551 *0.5376 **0.5682 *
X2 ∩ X80.5335 *0.6416 **0.3215 *X5 ∩ X60.8300 *0.8381 *0.5831 *X9 ∩ X100.9436 **0.8497 **0.7326 **
X2 ∩ X90.9056 **0.7274 **0.7309 **X5 ∩ X70.7873 *0.8477 *0.6593 **X9 ∩ X110.6593 **0.6340 **0.7247 *
X2 ∩ X100.9423 *0.9514 *0.9405 **X5 ∩ X80.4065 *0.5979 **0.1179 *X9 ∩ X120.6008 *0.3624 *0.7284 **
X2 ∩ X110.9635 **0.9686 **0.9471 **X5 ∩ X90.7771 **0.7860 **0.5298 **X10 ∩ X110.9307 **0.9405 *0.8058 *
X2 ∩ X120.7140 *0.6570 *0.8490 *X5 ∩ X100.9463 **0.9338 *0.7821 **X10 ∩ X120.8602 *0.6544 *0.6771 *
X3 ∩ X40.8791 *0.9219 *0.9106 *X5 ∩ X110.9709 **0.9254 **0.9703 **X11 ∩ X120.5261 *0.6633 *0.7743 *
Note: * indicates two-factor enhancement; ** indicates nonlinear enhancement.
Disclaimer/Publisher’s Note: The statements, opinions and data contained in all publications are solely those of the individual author(s) and contributor(s) and not of MDPI and/or the editor(s). MDPI and/or the editor(s) disclaim responsibility for any injury to people or property resulting from any ideas, methods, instructions or products referred to in the content.