Abstract
Worldwide, smart/co-working spaces are growing significantly, and prefabricated movable buildings for such an application could (i) save energy, CO2 emissions, and costs; (ii) enhance the worker’s perceived sense of surroundings; and (iii) support the rebirth of small villages with high regenerative potential. Innovative prefabricated movable building configurations to be used as an office for smart/co-working by a maximum of 6 persons have been designed and analyzed based on simulation data. In particular, 10 case studies corresponding to building configurations differing in terms of innovative energy-efficient measures related to the building envelope (smart windows operated under various control logics) and the energy systems serving the building (photovoltaic panels, small wind turbines, and electric storages) have been modeled and simulated by applying detailed dynamic simulation models via the simulation software TRNSYS. The performance of the 10 case studies has been compared from energy, environmental, and economic points of view with respect to a baseline system characterized by conventional building envelope and energy systems, with the aim of assessing the proposed measures and identifying the most efficient configuration. The simulation results highlighted that: (i) all the proposed alternative configurations allow to save primary energy (from 10.3% up to 100%), equivalent CO2 emissions(from 10.3% up to 100%), and operating costs (from 8.5% up to 100%) with respect to the baseline building; (ii) the building configurations including the smart windows only are not economically feasible in terms of simple pay-back (SPB) period, while the building configurations equipped with photovoltaic panels and/or electric storages and/or wind turbine represent a suitable investment thanks to an SPB lower than 15.2 years; (iii) a stand-alone building configuration for smart/co-working with energy demands totally covered by means of renewable sources can be obtained by combining smart windows, photovoltaic panels, electric storages and wind turbine.
1. Introduction
1.1. Motivation and Background
Homeworking is becoming more and more popular [1]; in particular, the worldwide smart/co-working spaces have grown significantly (from 160 in 2008 up to 19,000 in 2018), involving 16 million workers and heavy investments [2]. According to predictions [3], there will be 41,975 coworking spaces globally by the end of 2024. This could provide a potential reduction in the energy demand of the transport sector [4], which accounts for about 26% of worldwide consumption [5].
According to [6], the building sector is considered the “last mile” of the roadmap toward the carbon neutrality century; in particular, it is in charge of 36% of final energy use and 37% of CO2 emissions in 2020 (with 75% of the EU’s buildings being energy inefficient [7]). For example, the latest evidence shows that China’s building sector consumed 1.6 Gtoe and emitted nearly 5 Gt of CO2 in 2019 (which accounts for 50.0% of the anthropogenic emissions) [8]. Scientific studies [9,10] demonstrated how homeworking may negatively impact well-being and work performance as well as increase energy demand in the building sector. The quality of the work environment and job performance are closely related. In settings in which the worker can continuously regenerate, both physically and psychologically, productivity is positively affected. Beyond internal comfort conditions, the parameters that can exert an overall positive influence on the continuous regeneration of individuals concern the worker’s perceived sense of surroundings (such as fascination, being away, coherence, and scope) [11]. The latter can be influenced by physical environmental factors (microclimate, sound, light, colors/textures) and emotional factors related to the presence of elements with historical, architectural, and naturalistic values.
The revised “Energy Performance of Buildings Directive” [12] sets out how Europe can achieve a zero-emission and fully decarbonized building stock by 2050. This goal can be achieved through a multidisciplinary approach addressing bioclimatic design and energy efficiency guidelines. From the perspective of building operations, end-use electrification should be promoted, and the proportion of renewable energy in building operations should be significantly increased [8]. Among the renewable-based energy systems, the global renewable power sector is predicted to grow by 50% between 2019 and 2024, with solar photovoltaic (PV) panels accounting for about 60% of the expected expansion thanks to their capability to harness electrical energy from solar energy [13]. The use of wind power is also rapidly growing in popularity in the last few years, with wind turbines allowing to generate electricity from wind with a power output ranging from a few hundred watts to hundreds of kilowatts and even megawatts [14,15]. In terms of power generation, it should also be highlighted that coupling electric energy batteries with photovoltaic panels or wind turbines could assist in improving the electric energy generated and self-consumed, thus (i) lowering the costs associated with the electricity for end-users, (ii) reducing the overload on electric infrastructure in the case of peaks, and (iii) enhancing the reliability and quality of the electric grid [16]. In addition, the targets in terms of energy efficiency can be achieved by usefully adopting several solutions regarding the building envelope. For example, smart windows can be effectively used in order to control the amount of solar energy transmitted into buildings based on personal preference or weather conditions, thereby reducing the amount of energy consumed by buildings for lighting, heating, and cooling purposes [17].
In this scenario, prefabricated buildings could emerge as cost-emission-and-energy-saving solutions to be designed according to sustainable construction practices, and they have been vastly applied in disaster relief reconstructions as well as in schools, exhibitions, medical services, military fields, construction sites, and greenhouses [18,19] thanks to convenient transport, installation, and construction time. Prefabricated buildings differ substantially from conventional buildings, taking into account that [19,20]: (1) the building envelope is made of lighter materials that must allow for transportability and, therefore, is characterized by a generally much lower thermal inertia; (2) the glazed surface area in relation to the total surface area of the building envelope is usually more significant; (3) air tightness is reduced. These differences in the characteristics of the building envelope result in: (1) enhanced solar gains/loads; (2) much more variable thermal/cooling loads and indoor air temperatures over time depending on external climatic conditions. This implies that (1) achieving the indoor is more challenging (with the risk of overcooling or overheating phenomena) in prefabricated buildings, and (2) the analysis of these types of buildings is quite complicated and cannot be performed under the assumptions of a steady-state regime, but it must necessarily be conducted by considering the transient operation associated with the relevant variability of energy demands as boundary conditions change. Therefore, the utilization of a dynamic simulation platform is essential to (1) accurately calculate the thermal and cooling loads of the prefabricated building with due consideration of external climatic conditions, and (2) assess the dynamic performance of building-integrated energy systems as a function of the technology and size of components as well as the operating scenarios.
In addition, it should be underlined that many small villages in Italy, representing 70% of Italian cities and 11,000,000 citizens, are facing depopulation, job opportunities scarcity, and a lack of essential services, but they have relevant regenerative potential and could be suitable for smart/co-working applications [21,22]. Therefore, developing a renewable energy-based, self-sustaining energy-use, eco-friendly, modular, and flexible-set-up prefabricated movable building for smart/co-working could also facilitate the social and economic rebirth of such small villages with significant regenerative potential.
1.2. Literature Review of Prefabricated Movable Buildings Exploiting Renewable Sources and Research Gaps
In a previous paper [23], the authors found and analyzed five significant examples of prefabricated movable buildings where the indoor air temperature is controlled during both winter and summer by exploiting renewable sources. The analysis was performed by considering the purpose, the geometry, the thermo-physical characteristics of the building envelope, the energy demands, as well as the technologies and energy sources used for controlling the indoor comfort conditions. In particular, the following prefabricated and movable buildings were discussed:
- the “Smart-POD” model proposed by Ceranic et al. [24] was designed as a response to an unexpected increase in pupil numbers in schools, as a replacement during the refurbishing of existing schools, or to support the continuous operation of unsafe/damaged schools. The model has a net floor area of 117 m2. It satisfies the electric demand through the installation of 40 m2 of photovoltaic (PV) panels on the roof; the electric surplus is sold to the electric central grid or stored in a lithium-ion battery. Heating requirements are covered by means of a thermal storage of 9 m × 6 m × 0.5 m crushed rock bed, a mechanical ventilation heat recovery system, and/or an air-to-air electrically driven vapor-compression heat pump, depending on boundary conditions. Both the thermal storage and the mechanical ventilation heat recovery system could also be used for cooling purposes. The installed LED appliances are controlled according to illuminance levels and occupancy sensors. Rainwater harvesting could be adopted for toilet and/or drinking purposes thanks to the use of filters and UV treatment;
- the “Pre-fab Eco Smart House” model was developed by a research team from the University of Cyprus [25,26]. A mobile “kit-of-parts” system was developed; it consists of seven structural components that can be juxtaposed in different configurations. Windows, walls, and shading devices were also developed with a “plug n’ play” logic since they are modular, with dimensions of 1.00 m width and 2.70 m height. The internal space has a total net floor area of 20.7 m2 and a height of 2.7 m. The total volume is 55.89 m3. The building envelope has the following thermal transmittance values: 0.280 W/m2 K for exterior walls, 0.316 W/m2 K for the floor, 0.263 W/m2 K for the roof, and 2.00 W/m2 K for the glazings. The heating/cooling demands are covered by an electric reversing heat pump. C. Vassiliades et al. [26] investigated the adoption of two hybrid building-integrated photovoltaic/thermal (BIPV/T) solar systems consisting of a single PV panel (1 m × 2.50 m) with a 0.08 m thick insulation on the back. An air gap of 0.05 m is adopted between the back of the PV panel and the insulating layer; to enhance the heat removal from PV cells, a set of four fans is placed within the air gap. The electric output of the systems is used to power an air-to-air electrically driven vapor-compression reversing heat pump; the surplus is sold to the central grid, which is also used to cover peak demands;
- the “Ecocapsule Original” model designed by the Nice Architects Studio of Bratislava in 2018 [27], for medium-term off-grid living of 1/2 people. It can become a cottage, pop-up hotel, mobile office, research station, or be used for interventions in emergency areas. It has a length of 4.67 m, a width of 2.20 m, and a height of 2.50 m, with a net floor area of 6.3 m2 and a total volume of 25.68 m3. It has two openable and two fixed triple-glazed windows. The exterior part is made of insulated fiberglass shells overlaying a steel framework. Solar and wind sources are used to cover the energy demands. The PV panels, with an area of 2.6 m2 and a peak power of 880 W, are installed on the roof, while the wind turbine, delivering up to 750 W, is positioned on a telescopic pole. Both systems can store energy in lithium-iron phosphate (LFP) batteries with a nominal total capacity of 9.7 kWh. The model features a specially customized plant providing cooling (up to 970 W) and heating (up to 1050 W) by means of a vapor-compression electric reversing heat pump; the required air change rates are satisfied by means of a mechanical ventilation heat recovery system (up to 130 m3/h). In the model, there are three tanks: (i) a harvested water tank (96 L) containing rainwater that is disinfected via a pre-filtration system and a UV LED lamp; (ii) a grey water tank (96 L) containing wastewater from the shower and sinks; and (iii) a black water tank (24 L) containing urine. The capital cost of the model is EUR 79,900;
- the “Living Box” model proposed by [28] was designed considering two cell typologies (A-type and B-type): the A-type cell has a net internal height equal to 2.70 m, while the B-type cell has a net internal height equal to 2.40 m. It has a length of 8 m, a width of 8.80 m, and a height of 3 m, with a net floor area of 45 m2 and a total volume of 211.2 m3. The model has two openable and five fixed double-glazing windows, characterized by a thermal transmittance equal to 1.5 W/m2 K. The thermal transmittance of the walls is 0.207 W/m2 K for the A-type cell and 0.308 W/m2 K for the B-type cell; the thermal transmittance of the roof is 0.138 W/m2 K. A heating, ventilation, and air-conditioning plant, including an air-to-air electrically driven vapor-compression reversing heat pump, is used to control the indoor thermal comfort. Domestic hot water (DHW) is produced by means of an air-to-water heat pump, connected to a 150 L storage tank. A PV plant of 36 modules, each having a peak power of 87.5 W, was architectonically integrated in the roof of the A-type cells; solar thermal devices are installed over the roof of the B-type to supplement the production of DHW;
- the “Biosphera Equilibrium” model was realized by Aktivhaus in 2018 [29]. It can become a real home for 2 people, a classroom for 11 people, or a mobile office for 3 people. It has a length of 15.3 m, a width of 2.97 m, and a height of 3.28 m, with a net floor area of 30.45 m2 and a total volume of 67.16 m3. It has three openable and two fixed triple-glazing windows. The external structure of the model is characterized by 5-layer X-LAM timber panels and is insulated with rockwool. It uses the solar source to cover the energy demands through two generation systems: the first consists of 19 PV panels positioned on the roof, while the second is an innovative PV system applied to the façade of the model. The total peak power of the PV system is 8 kW, with an annual electricity production capacity of 8000 kWh/year. Taking into account that the model is characterized by a nominal annual electricity consumption of 2000 kWh/year, the electricity surplus produced by the PV system is stored in the “ZHERO” battery (with a storage capacity of 20 kWh). In the model, the cooling/heating demand is covered by using radiant panels installed into the ceiling as hydraulic terminal units. As for lighting, LED lamps that allow for both a variable luminous flux and a correlated color temperature are used.
Table 1 summarizes the main characteristics of the selected case studies, highlighting the volume, the net floor area, the thermal transmittance of walls and windows, the technology of lighting appliances, the specific annual electric energy demand, and the technologies used for (i) ventilation, (ii) electricity generation and storage, and (iii) cooling and heating purposes.

Table 1.
Main characteristics of the five reviewed prefabricated movable modular building solutions.
The analysis of the selected case studies revealed the following research/knowledge gaps:
- (a)
- there are few studies focused on prefabricated movable buildings exploiting renewable sources, and, therefore, further research has to be performed;
- (b)
- the use of smart windows is not considered in the analyzed case studies, and its suitability from energy, environmental, and economic points of view has to be addressed;
- (c)
- the utilization of small wind turbines is investigated only in one of the selected examples [27]; as a consequence, the possibility of covering the building’s electric demand with the power generated by small wind turbines has to be further analyzed;
- (d)
- there are no quantitative analyses reporting the energy, environmental, and economic savings that could potentially be achieved with the use of alternative and innovative energy measures compared to the case of using traditional systems; the potential impact of such technologies should be assessed in more detail;
- (e)
- there are no cases in which the simultaneous use of smart windows, photovoltaic panels, small wind turbines, and electric energy storages is envisaged (with the exception of the “Ecocapsule Original” model [27], which considers the combined utilization of photovoltaic panels, a wind turbine, and an electric energy storage, which, however, relates to an office application for only 1–2 people); in particular, it should be verified if prefabricated movable buildings that are 100% self-sufficient from an energy point of view (thanks to the adoption of different renewable sources) can be realized in an economically feasible way.
Moreover, it should be underlined that research on prefabricated movable buildings for smart/co-working applications to be placed in key points of small villages is at an early stage [31]. In the past, such buildings have been mainly designed to meet the specific needs of post-disaster groups; usually, obsolete design approaches have been adopted [32], neglecting construction modularity and flexibility, locally sourced eco-friendly materials, innovative methods for optimizing building systems, occupants’ well-being, and integration with outdoor features [33].
1.3. Goals and Organization of the Study
The analysis of building-integrated energy systems can be carried out based on data derived from (i) lab/field experiments or (ii) simulations. Data derived from lab/field experiments reflect the operation in reality, but they are difficult to derive for a number of reasons: (a) several significant key operating parameters in building-integrated energy systems are generally not measured; (b) obtaining such data is labor-intensive as well as time- and cost-consuming; and (c) these data can be generally obtained only with reference to limited ranges of weather and thermal/cooling load scenarios. The utilization of accurate simulation models could represent one of the most promising options to address and overtake the above-mentioned barriers, taking into account that they allow to: (a) evaluate all the key operating parameters of building-integrated energy systems; (b) obtain a huge amount of data with reduced time and costs of investigation; (c) explore a wider range of weather/load scenarios; and (d) more easily investigate alternative design scenarios and control logics to identify the best solution before committing to technology investments. In this study, the energy, environmental, and economic performance of innovative energy-efficient movable prefabricated buildings for smart/co-working applications is analyzed using the TRaNsient SYStems simulation tool (TRNSYS) [34]. This software has been used by many scientific researchers with the aim of assessing the performance of building-integrated energy systems based on RES [35,36], and related results are reported in well-reputed, international scientific journals. These studies demonstrated that the TRNSYS program may be used in the analysis of the energy performance of buildings and renewable energy systems with high reliability, so that one can be confident of the accuracy of the predictions.
In particular, the building in a basic configuration (baseline), i.e., in the case where thermal, cooling, and electrical loads are covered by means of traditional energy systems typically adopted in the Italian scenario, is first analyzed. Subsequently, three main alternative building configurations, including innovative energy efficiency measures (smart windows, photovoltaic panels, wind turbines, and electric storages), are proposed, modeled, analyzed, and compared with the performance of the baseline configuration in order to assess their potential effects in terms of reduction of primary energy consumption, equivalent CO2 emissions, and operating costs.
In particular, the following three alternative building configurations have been considered:
- Configuration A, based on the adoption of smart windows operated under different logics controlling their state;
- configuration B, based on the utilization of both smart windows and photovoltaic panels combined with electric energy storages;
- configuration C, based on the utilization of both smart windows together with photovoltaic panels as well as a small wind turbine combined with electric energy storages.
The goals of this research can be summarized as follows:
- ➢
- evaluate the energy, environmental, and economic performance of an innovatively designed prefabricated movable building under various configurations differing in terms of building envelope and energy systems;
- ➢
- assess the potential benefits of smart windows and related control logics in the case of prefabricated movable buildings;
- ➢
- characterize the operation of photovoltaic panels eventually combined with electric storages when applied to a prefabricated movable building;
- ➢
- estimate the performance associated with building configurations simultaneously including photovoltaic panels, electric storages, and a wind turbine;
- ➢
- identify an energy-self-sufficient prefabricated movable building that can be used as a stand-alone system for smart/co-working.
In this paper, Section 2 details the design, the characteristics of the building envelope, the simulation model, and the performance of the baseline building configuration. Section 3 describes the alternative building configurations proposed in this study, providing detailed information regarding the adopted energy-efficient measures and related simulation models. Section 4 illustrates the methods used for comparing the simulation results associated with the baseline building with those associated with the proposed alternative configurations. Finally, Section 5 reports the results of the energy, environmental, and economic comparisons, showing the effects associated with the adoption of the proposed energy-efficient measures.
2. Baseline Building
The energy, environmental, and economic performance of the proposed energy-efficient movable building in a basic configuration (baseline) is first assessed by using the dynamic simulation software TRNSYS 18 [34].
This section of the paper describes the baseline building in terms of geometry and design (Section 2.1), characteristics of the building envelope (Section 2.2), the TRNSYS simulation model (Section 2.3), as well as energy, environmental, and economic performance calculated based on the simulation results (Section 2.4).
2.1. Baseline Building Geometry and Design
The designed baseline building mainly consists of 6 indoor spaces (3 identical offices, 1 relaxation area, 2 toilets): (1) office A, (2) office B, (3) office C, (4) relaxation area, (5) ante bathroom, (6) toilet WC1, and (7) toilet WC2. In addition, the baseline building includes an outdoor laboratory area, a small outdoor garden, and an impluvium for the recovery of rainwater. A central corridor provides access to the offices, relaxation area, and toilets, while access to both the laboratory area and the small garden is provided from the outside. Figure 1 describes the floor plan of the baseline building, highlighting the indoor and outdoor space distribution as well as the corresponding dimensions.
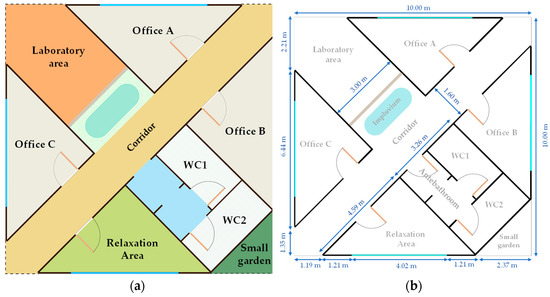
Figure 1.
Floor plan of the baseline building: (a) indoor and outdoor spaces distribution, (b) indoor and outdoor spaces dimensions.
Each office has been designed to accommodate a maximum of 2 people in smart/co-working mode, for a total of 6 people. Table 2 shows the floor area and the orientation for each indoor and outdoor space of the baseline building.
Table 2.
Floor area and orientation of indoor and outdoor spaces of the baseline building.
Figure A1a,b in Appendix A reports two renders describing the design of the proposed baseline building. The design of the baseline building has been defined by following a multidisciplinary approach, taking into account that aspects of health, well-being, and productivity are not only affected by indoor thermo-hygrometric conditions but also by additional factors concerning the sense that end-users perceive of the surrounding environment (such as fascination, being away, coherence, and scope). These factors can be influenced by physical environmental parameters (microclimate, sound, and light) as well as emotional factors linked to the presence of elements/artifacts of historical/architectural/naturalistic value.
2.2. Baseline Building Envelope
Table 3 describes the characteristics of the opaque walls of the baseline building by specifying the number of layers as well as the corresponding material, thickness, thermal conductivity, specific heat capacity, and density. In particular, the opaque walls of the offices, relaxation area, and toilets have been assumed to be identical, and related thicknesses/materials have been defined according to typical best practices adopted in the case of movable buildings in the Italian scenario [37]. The thermo-physical properties of materials have been defined according to the information provided by the manufacturers or available in the scientific literature.
Each office is equipped with only one window. The windows of all the offices have been assumed to be identical. Table 4 reports the characteristics of the window by specifying the window type, geometry (thickness of layers), spacing gas, area of the frame (Af), area of the glazing (Ag), thermal transmittance of both the frame (Uf) and the glazing (Ug), solar heat gain coefficient (SHGC), and visible transmission coefficient (τvis). The characteristics of the window have been selected according to the typical best practices adopted in the case of movable buildings in Italy [38,39].
Table 3.
Characteristics of the opaque walls of the baseline building.
Table 3.
Characteristics of the opaque walls of the baseline building.
| Layer Material (from Outside to Inside) | Thickness (m) | Thermal Conductivity (W/mK) | Specific Heat Capacity (kJ/kgK) | Density (kg/m3) | |
|---|---|---|---|---|---|
| Ceiling of the offices, relaxation area, and toilets | Galvanized corrugated sheet | 0.0050 | 52 [40] | 0.460 [40] | 7800 [40] |
| Rock wool | 0.0400 | 0.042 [41] | 0.835 [40] | 70 [41] | |
| Steel sheet | 0.0040 | 52 [40] | 0.460 [40] | 7800 [40] | |
| Polyurethane resins (PUR) | 0.0720 | 0.02 [42] | 1.255 [40] | 39 [42] | |
| Steel sheet | 0.0040 | 52 [40] | 0.460 [40] | 7800 [40] | |
| Fir timber panel | 0.0100 | 0.12 [43] | 2.72 [40] | 450 [43] | |
| Floor of the offices, relaxation area, and toilets | Galvanized and pre-painted steel profile | 0.0015 | 52 [40] | 0.460 [40] | 7800 [40] |
| Galvanized sheet | 0.0060 | 52 [40] | 0.460 [40] | 7800 [40] | |
| Steel sheet | 0.0040 | 52 [40] | 0.460 [40] | 7800 [40] | |
| Polyurethane resins (PUR) | 0.0720 | 0.02 [42] | 1.255 [40] | 39 [42] | |
| Steel sheet | 0.0040 | 52 [40] | 0.460 [40] | 7800 [40] | |
| Timber panel | 0.0180 | 0.12 [5] | 2.090 [40] | 600 [5] | |
| Porcelain stoneware | 0.0100 | 2.3 [40] | 0.835 [40] | 2300 [40] | |
| External vertical walls of the offices, relaxation area, and toilets | Fir timber panel | 0.0100 | 0.12 [43] | 2.72 [40] | 450 [43] |
| Steel sheet | 0.0040 | 52 [40] | 0.460 [40] | 7800 [40] | |
| Polyurethane resins (PUR) | 0.0720 | 0.02 [42] | 1.255 [40] | 39 [42] | |
| Steel sheet | 0.0040 | 52 [40] | 0.460 [40] | 7800 [40] | |
| Fir timber panel | 0.0100 | 0.12 [43] | 2.72 [40] | 450 [43] | |
| Internal vertical walls of the offices, relaxation area, and toilets | Fir timber panel | 0.0100 | 0.12 [43] | 2.72 [40] | 450 [43] |
| Steel sheet | 0.0040 | 52 [40] | 0.460 [40] | 7800 [40] | |
| Polyurethane resins (PUR) | 0.0320 | 0.02 [42] | 1.255 [40] | 39 [42] | |
| Steel sheet | 0.0040 | 52 [40] | 0.460 [40] | 7800 [40] | |
| Fir timber panel | 0.0100 | 0.12 [43] | 2.72 [40] | 450 [43] |
Table 4.
Characteristics of the windows of the baseline building.
Table 4.
Characteristics of the windows of the baseline building.
| Window Type | Geometry (mm) | Spacing Gas | Af (m2) | Ag (m2) | Uf (W/m2 K) | Ug (W/m2 K) | SHGC (-) | τvis (-) |
|---|---|---|---|---|---|---|---|---|
| Double glazing | 9.1/12/4 | Krypton | 1.6 | 9.4 | 1.00 | 1.10 | 0.40 | 0.60 |
2.3. TRNSYS Simulation Model of the Baseline Building
In this study, the software TRNSYS [34] has been used to model and analyze the energy, environmental, and economic performance of the baseline building. TRNSYS is widely adopted in the scientific literature for assessing the performance of building-integrated energy systems [35,44].
The software TRNSYS [34] consists of two software packages (TRNBuild and Simulation Studio). In the Simulation Studio package, individual mathematical models (named “Types”) are used to model each sub-system. In this study, the “Types” have been selected from the TRNSYS library and calibrated according to the information provided by the manufacturers or data available in the scientific literature. In order to take into account the uncertainties of RES, detailed TRNSYS models have been used in this study to accurately simulate the RES-based systems and predict their time-varying behavior according to the boundary conditions. All the adopted simulation models have been validated in contrast with experimental data in order to assess their prediction performance. In addition, the models used in this study are also able to take transient and steady-state operations into account as a function of the operating scenarios.
Figure 2a,b shows the 3D geometrical model of the baseline building developed by means of the software SketchUp [45] according to the baseline building geometry and design described in the previous Section 2.1. In these figures, the assumed orientations are also indicated.
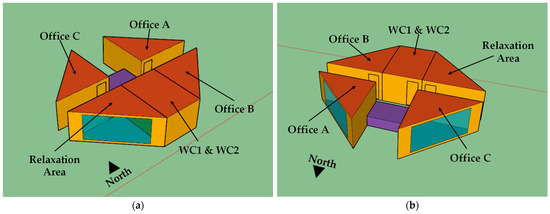
Figure 2.
Two different views (a,b) of the 3D geometrical model of the baseline building.
In the TRNBuild tool, the walls and windows have been modeled according to the characteristics reported in Table 3 and Table 4, respectively, by means of TRNSYS Type 56a. The internal and external convective heat transfer coefficients, respectively, have been assumed to be equal to 7.7 W/m2 K and 25 W/m2 K for both walls and windows (according to the values generally adopted in the scientific literature [46]).
Internal gains/loads associated with persons, lighting systems, and electric appliances (laptops, mobile phones, printers, Wi-Fi router, coffee machine, mini fridge, microwave oven, and hand dryer) have been taken into consideration by means of TRNSYS Type 56a.
In particular, the assumed occupancy profiles (i.e., the number of persons as a function of time) for the offices, both the toilets and the relaxation area are reported in Figure 3 in the case of weekdays (no people are expected to be present in the building during weekends). The overall number of occupants inside the baseline building (considering the offices, relaxation area, and toilets) is always equal to 6 from 8:30 a.m. up to 6:30 p.m. during the weekdays. Sensible heat gain/load associated with each occupant has been assumed to be equal to 115 W according to the values recommended by ASHRAE [47] in the case of seated/very light work as a degree of activity.
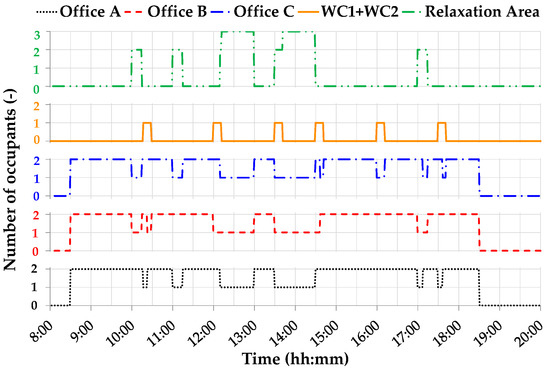
Figure 3.
Occupancy profiles during weekdays of the baseline building.
Light-emitting diode (LED)-based luminaires (model Liquid Line-A3 manufactured by Lightnet [48]) have been selected as artificial lighting systems serving the baseline building in order to guarantee visual comfort; each luminaire is characterized by a nominal electric power of 9.6 W with a corresponding thermal gain/load assumed to be equal to 7.2 W (equal to 75% of the nominal electric power). The number and arrangement of the selected luminaires have been defined by means of the software DIALux [49] with the aim of obtaining the values of average illuminance and illuminance uniformity suggested by the UNI EN Standard 12,464 [50] on the identified task/surrounding/background areas. According to the simulation results, 16 luminaires are required for each of the offices A, B, and C, as well as for the relaxation area, while 4 luminaires have to be used for each of the toilets WC 1 and WC 2. The luminaires have been assumed to be switched ON only in the case of at least one occupant being inside the corresponding indoor space, according to the occupancy profiles reported in Figure 3.
Table 5 reports the number of electric appliances (laptops, mobile phones, printers, Wi-Fi router, coffee machine, mini fridge, microwave oven, and hand dryer) as a function of the indoor space for each type of appliance; the same table indicates both the electric power consumption during both stand-by (Pel,Stand-by) and operation (Pel,ON) and the sensible thermal gain/load during both stand-by (Pth,Stand-by) and operation (Pth,ON) associated with every single electric appliance.
Figure 4 indicates the time of use of all the electric appliances (printers, coffee machine, microwave oven, hand dryer, mini fridge) as a function of the time during weekdays (during weekends, all the electric appliances are assumed to be switched off, taking into account that no people are expected to be present in the building during weekends). In particular, three different operating states (OFF, stand-by, and ON) are indicated in this figure as a function of both the time and the type of electric appliance. The laptops, mobile phones, and Wi-Fi router are switched ON during the entire period from 8:30 a.m. up to 6:30 p.m. during the weekdays.
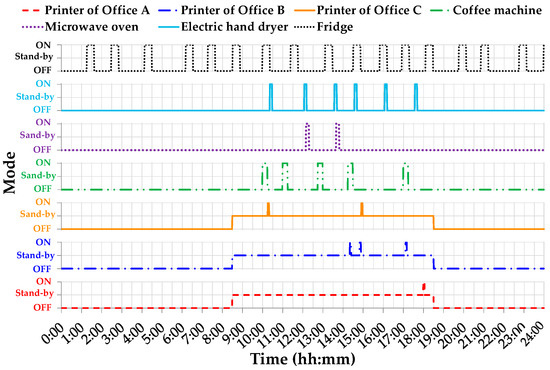
Figure 4.
Operating schedules of electric appliances in the baseline building.
Table 5.
Electric appliances of the baseline building.
Table 5.
Electric appliances of the baseline building.
| Type of Appliance | Numbers of Appliances | Pel,ON/ Pel,Stand-by (W) | Pth,ON/ Pth,Stand-by (W) | ||||
|---|---|---|---|---|---|---|---|
| Office A | Office B | Office C | Relaxation Area | WC1 + WC2 | |||
| Laptop [51] | 2 | 2 | 2 | 0 | 0 | 59/0 | 53/0 |
| Mobile phone [51] | 2 | 2 | 2 | 0 | 0 | 5/0 | 5/0 |
| Printer [52] | 1 | 1 | 1 | 0 | 0 | 351/4 | 101/1.2 |
| Wi-Fi router [53] | 0 | 0 | 0 | 1 | 0 | 7/0 | 7/0 |
| Coffee machine [51] | 0 | 0 | 0 | 1 | 0 | 1400/0 | 385/0 |
| Mini fridge [51] | 0 | 0 | 0 | 1 | 0 | 130/0 | 125/0 |
| Microwave oven [51] | 0 | 0 | 0 | 1 | 0 | 1000/0 | 713/0 |
| Electric hand dryer [54] | 0 | 0 | 0 | 1 | 0 | 900/0 | 900/0 |
| Lighting appliances [48] | 16 | 16 | 16 | 16 | 4 | 9.6/0 | 7.2/0 |
The air change of infiltration has been assumed to be constant and equal to 0.5 h−1 according to the value suggested in the study of Ye et al. [19], which focused on a prefabricated temporary house.
The building has been assumed to be located in the city of Naples (in the south of Italy). RES generation fluctuates considerably, seriously affecting the operation performance of RES-based systems. In particular, RES generation mainly depends on weather data; therefore, accurate hourly data of meteorological parameters such as solar radiation, dry bulb temperature, relative humidity, wind speed, etc. are really important in order to simulate RES generation and building energy performance. With reference to the climatic data, it should be underlined that, in this study, the variability of electricity generation by photovoltaic panels and/or wind turbines upon changing climatic conditions has been taken into account by using in TRNSYS a detailed and representative EnergyPlus weather file [55] based on the data available within the older TMY weather format. TMY weather data files are composed of 12 separate months of data, each chosen to be the most “typical” month from the total years of data (which can vary depending on data availability) [56]. TMY data selection is carried out using the Sandia method, which is an empirical approach that selects individual months from different years of the period of record. The Sandia method selects a “typical” month based on nine daily indices consisting of: the maximum, minimum, and mean dry bulb and dew point temperatures; the maximum and mean wind velocity; and the total global horizontal solar radiation [57]. For each month of the calendar year, five candidate months with cumulative distribution functions (CDFs) for the daily indices that are the closest to the long-term CDFs are selected. The CDF gives the proportion of values that are less than or equal to a specified value of an index. Candidate monthly CDFs are compared to the long-term CDFs by using the Finkelstein–Schafer (FS) statistics for each index [57]. Using this type of file makes it possible, for each city, to take into account climatic data that is truly representative of the city and, therefore, enables the performance of RES systems to be estimated effectively.
A specific EnergyPlus weather data file [55] has been considered for modeling the weather data of the city of Naples by means of TRNSYS Type 15-3. According to this file, Figure 5 highlights the outside air temperature (ranging from a minimum of −2.5 °C up to a maximum of 34.5 °C), wind velocity (ranging from a minimum of 0 m/s up to a maximum of 26.1 m/s), and global solar irradiation on the horizontal plane (ranging from a minimum of 0 W/m2 up to a maximum of 996.6 W/m2) as a function of the time during the entire year.
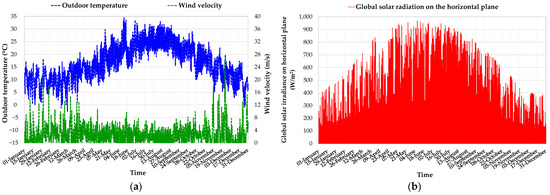
Figure 5.
Outdoor air temperature, wind velocity (a) and global solar radiation on the horizontal plane (b) in Naples.
The baseline building is assumed to be served by energy systems able to control the indoor air temperature during both winter and summer. In particular, indoor air temperature is assumed to be controlled in both the offices and the relaxation area (while it is not controlled in the toilets) during both the heating period (from 15 November to 31 March) and the cooling period (from 1 April to 14 November). The target temperature has been set to 20 °C during the heating season (with a deadband of ±1 °C) and 26 °C during the cooling season (with a deadband of ±1 °C); target values are assumed to be maintained in the case of at least one occupant being inside the offices and/or the relaxation area (otherwise the indoor air temperature is not controlled). The duration of heating/cooling periods and the corresponding target temperatures have been managed via the Simulation Studio tool by means of TRNSYS Type 56a.
2.4. Performance of the Baseline Building
The model time step is also an important parameter when running the simulation models; increasing the time step reduces the amount of time needed to run the simulation, but it also reduces the accuracy of the representation of sub-daily processes. The above-described model of the baseline building has been simulated via the software TRNSYS with reference to the entire year by using a simulation time step of 2 min in order to accurately calculate the corresponding heating and cooling loads for space heating and cooling purposes as a function of time. Figure 6a,b reports, respectively, thermal and cooling load-duration diagrams of the baseline building (with the values sorted in descending order). These types of diagrams are really informative, taking into account that (1) the area under the load–duration diagrams represents the total energy required by the building for heating/cooling purposes; (2) reporting the thermal and cooling load–duration diagrams associated with the different indoor environments in the same figure allows to easily compare the corresponding total energy demands; (3) make it easy to recognize (a) the maximum load, (b) the duration of the period during which the load is larger than zero, and (c) the number of hours for which the particular load lasts.
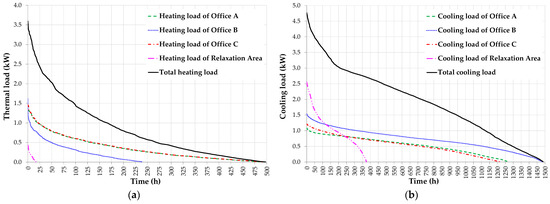
Figure 6.
Thermal load–duration diagram (a) and cooling load–duration diagram (b) of the baseline building.
Figure 6a,b highlights that:
- the heating demand of office A (north-east oriented) has a duration of about 495.0 h, with a maximum value of about 1.5 kW (Figure 6a);
- the heating demand of office B (south-east oriented) has a duration of about 245.0 h, with a maximum value of about 1.6 kW (Figure 6a);
- the heating demand of office C (north-west oriented) has a duration of about 496.0 h, with a maximum value of about 1.5 kW (Figure 6a);
- the heating demand of the relaxation area (south-west oriented) has a duration of about 18.0 h, with a maximum value of about 0.5 kW (Figure 6a);
- the total heating demand of the baseline building has a duration of about 503.0 h, with a maximum value of about 3.6 kW (Figure 6a);
- the cooling demand of office A (north-east oriented) has a duration of about 1282.0 h, with a maximum value of about 1.1 kW (Figure 6b);
- the cooling demand of office B (south-east oriented) has a duration of about 1498.0 h, with a maximum value of about 1.6 kW (Figure 6b);
- the cooling demand of office C (north-west oriented) has a duration of about 1228.0 h, with a maximum value of about 1.2 kW (Figure 6b);
- the cooling demand of the relaxation area (south-west oriented) has a duration of about 378.0 h, with a maximum value of about 2.6 kW (Figure 6b);
- the total cooling demand of the baseline building has a duration of about 1504.0 h, with a maximum value of about 4.8 kW (Figure 6b).
An air-to-air vapor-compression electric reversing heat pump (EHP) has been used in order to control the indoor air temperature of the baseline building. According to the values indicated in Figure 6a,b, four identical mono-split EHPs (model Bluevolution FTXJ+RXJ manufactured by Daikin [58]) have been selected in order to cover the calculated heating and cooling loads during 99% of the time corresponding to the heating and cooling periods. Each unit serves a specific indoor space (3 offices and 1 relaxation area), and it is characterized by a nominal heating capacity of 2.5 kW (with a coefficient of performance (COP) equal to 5.0) together with a nominal cooling capacity of 2.0 kW (with an energy efficiency ratio (EER) equal to 4.7) [58]. Figure A2 of Appendix A highlights the four identical EHPs serving office A (EHPOA), office B (EHPOB), office C (EHPOC), and the relaxation area (EHPRA) as installed in the baseline building.
The EHP has been modeled via TRNSYS Type 786, relying on user-provided performance data files containing normalized capacity and coefficient of performance ratios as a function of normalized return air flow rate, return air temperature, and outdoor air temperature. Figure 7a shows the performance map of the selected EHP operating as a heat pump, reporting its COP as a function of the outside and return air temperatures according to the manufacturer data (as modeled via Type 786). Figure 7b shows the performance map of the selected EHP operating as a refrigerating system, reporting its EER as a function of the outside and the return air temperatures according to the manufacturer data (as modeled via Type 786). Based on the manufacturer’s data, the maximum value of COP is 5.2, while the maximum value of EER is 5.6.
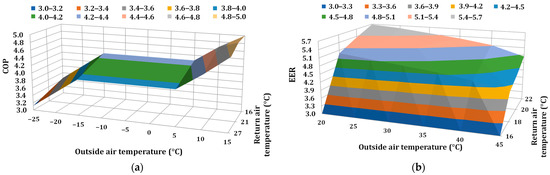
Figure 7.
Performance map of the selected EHP: (a) COP as a function of the outside and return air temperatures; (b) EER as a function of the outside and return air temperatures.
TRNSYS Type 786 uses as inputs the activation/deactivation signal (provided by TRNSYS Type 166) based on (i) the difference between the set-point indoor air temperature and the return air temperature, (ii) the target supply air temperature, and (iii) the return air temperature and the outside air temperature. TRNSYS Type 786 provides as outputs the supplied air temperature, the supplied thermal/cooling power, and the consumed electric power.
The baseline building integrated with the above-mentioned 4 EHPs has been modeled and simulated via the software TRNSYS with reference to the entire year by using a simulation time step of 2 min in order to accurately model the time-varying behavior of the RES-based systems and assess energy, environmental, and economic performance.
Figure 8a,b highlights the thermal and cooling energy demands of the offices and the relaxation area of the baseline building as a function of the month, according to the simulation results. In particular, the figures indicate that the annual cooling-related energy demands are approximately 6.5 times higher than the annual heating-related energy demands. In more detail, office A (north-east oriented) and office C (north-west oriented) are characterized by the largest annual heating demands, while office B (south-east oriented) has the greatest annual cooling energy demand.
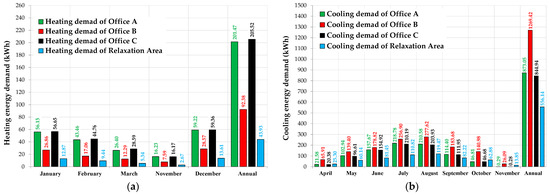
Figure 8.
Heating energy demand (a) and cooling energy demand (b) of the baseline building as a function of the month of the year.
Figure 9 shows the electric energy demand of the EHPs of the baseline building as a function of the month, according to the simulation results. This figure underlines that office B has the highest annual EHP electricity consumption, while the electricity consumption of the EHPs serving office A and office C is lower by about −23%.
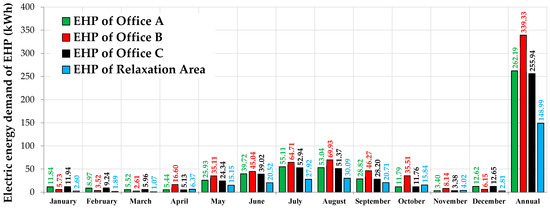
Figure 9.
Electric energy demand of EHPs of the baseline building as a function of the month.
3. Proposed Alternative Building Configurations
In the previous Section 2, the characteristics and performance of the designed prefabricated movable building for smart/co-working in a basic configuration (baseline) have been described; in the case of the baseline configuration, the thermal, cooling, and electrical loads are covered by means of traditional energy systems typically adopted in the Italian scenario.
In this study, alternative building configurations (including innovative energy efficiency measures) are proposed, modeled, analyzed, and compared with the performance of the baseline configuration (via the software TRNSYS) with the aim of evaluating their potential effects in terms of the reduction in primary energy consumption, equivalent CO2 emissions, operating costs, and capital costs.
In particular, Table 6 summarizes the three alternative building configurations (A–C), for a total of 10 case studies, investigated in this paper.
Table 6.
Alternative building configurations and case studies investigated in this study.
Configuration A of the building differs with respect to the baseline building only in terms of windows; in particular, conventional windows are used in the case of the baseline building, while smart windows are adopted for case studies 1, 2, and 3 of building configuration A. Intelligent light transmission and reflection are key features of smart windows, which help reduce heat intake and loss via the building envelope. These specific types of windows have the ability to adaptively react to their surroundings and internal conditions. Gasochromic, electrochromic, photochromic, and thermochromic windows are examples of this sort of smart window. The utilization of smart windows, especially in the case of large glazed surfaces, is expected to significantly improve the energy efficiency of buildings since they allow for the dynamic control of solar loads/gains through transparent surfaces. In this study, electrochromic smart windows are considered a solution to enhance the performance of the designed building. Such windows can be operated in different states depending on the end-users preference. In particular, in this study, the authors considered four different states (fully clear, intermediate 1, intermediate 2, and fully dark) of the selected smart windows and three different strategies controlling their states. The design of control strategies plays a fundamental role in the performance of smart windows [59]. Rule-based control strategies are the most commonly employed control algorithms for the management of smart windows; they are formulated to enable operations where, if a condition occurs, a given control action is applied. In particular, several scientific studies investigating the application of control strategies based on incident solar radiation [60,61] are available in the literature. However, scientific works suggesting controlling the smart window operation based on the indoor temperature can also be found in the literature [62,63]. The main aim of both strategies is to maintain the desired indoor air temperature by minimizing the solar loads during the summer (and, therefore, reducing the induced overheating phenomena) thanks to a change in the smart windows’ state according to the incident solar radiation or indoor air temperature.
With respect to building configuration A, photovoltaic panels without or coupled with one or two electric storages have been added in configuration B of the building; in comparison to the baseline building, configuration B includes the electrochromic smart windows (instead of the conventional windows) selected in configuration A and controlled via a logic based on the indoor air temperature (as in case 3) together with 10.34 kWp PV panels without electric storages (case 4) or coupled with one (case 5) or two (case 6) 13.5 kWh lithium-ion electric storages.
The proposed building configuration C consists of the electrochromic smart windows (instead of the conventional windows) selected in configuration A and controlled via a logic based on the indoor air temperature (case 3), photovoltaic panels, a 300 W wind turbine (cases 7 and 8) or a 700 W wind turbine (cases 9 and 10), as well as two (cases 7 and 9) or three (cases 8 and 10) 13.5 kWh lithium-ion electric storages. The addition of a wind-based system has been considered, taking into account that, unlike the PV panels, it does not depend on the sun to generate power and can potentially produce electricity around the clock (even if the weather is still a challenge for both wind and solar power systems). Vertical wind turbines (VWT) are deemed more suitable to be used in urban areas with respect to horizontal ones, mainly thanks to the fact that they can harness wind energy from all directions. It should also be noted that a VWT might harness less wind energy than a horizontal wind turbine in steady wind, even though it is fairly efficient in capturing rapidly changing wind (such as gusts). Finally, the low operating rotational speed of VWTs ensures the safe flight of birds and also produces a lower level of noise. Despite a general superiority in comparison with horizontal wind turbines, VWTs also have their disadvantages, such as the relatively lower efficiency because the wind strikes on both sides of the rotor blade (i.e., one following the wind direction and the other countering it), thereby neutralizing part of the available wind force.
Additional details regarding the proposed configurations A, B, and C are reported in the following sections.
3.1. Building Configuration A with Smart Windows (SWs)
Configuration A of the building differs with respect to the baseline building in terms of windows. The electrochromic smart window (SW) modeled and simulated in this work is an electronically tintable double glazing system (model Climaplus Classic) developed and commercialized by the company SageGlass [38] and characterized by four states (clear, intermediate 1, intermediate 2, and dark). The windows of the offices and the relaxation area have been assumed to be identical. Table 7 reports the characteristics of the selected smart window by specifying the window state, the type, the geometry (in terms of thickness of layers), the spacing gas, the area of the frame (Af), the area of the glazing (Ag), the thermal transmittance of both the frame (Uf) and the glazing (Ug), the solar heat gain coefficient (SHGC) and the visible transmission coefficient (τvis). The values reported in Table 7 have been derived from the manufacturer’s data upon varying the window’s state. It should be underlined that the selected smart window with a clear state perfectly corresponds to the conventional window used in the case of the baseline building (see Table 4). With reference to the windows, TRNSYS relies on specialized software to create new additional models of windows. In particular, the software WINDOWS 7.5, developed by the Lawrence Berkeley National Laboratory (Berkeley, California), has been used to model the behavior of selected smart windows as well as create files that can be imported into TRNSYS [62].
Table 7.
Characteristics of the smart windows adopted in configuration A of the building.
The following three different case studies (1–3) have been considered to be characterized by three different strategies controlling the operating state of all the smart windows replacing conventional windows:
- Case 1:
- the state of all the smart windows is always dark;
- Case 2:
- the state of each smart window is controlled based on the vertical solar radiation incident on the corresponding smart window, φs,i;
- Case 3:
- the state of each smart window is controlled based on the indoor air temperature achieved in the corresponding thermal zone, Ti.
The smart windows’ controls and the corresponding threshold values associated with the above-mentioned case studies are summarized in Table 8; such values have been defined according to Isaia et al. [59].
Table 8.
Smart window control strategies in configuration A of the building.
3.2. Building Configuration B with PhotoVoltaic Panels (PVs) and Electric Storages
In comparison to the baseline building, configuration B includes the electrochromic smart windows (instead of the conventional windows) selected in case 3 together with 10.34 kWp PV panels without electric storages (case 4) or coupled with one (case 5) or two (case 6) 13.5 kWh electric storages.
Photovoltaic panels, commercialized by TRIENERGIA [64], have been adopted in configuration B of the building. In order to cover the largest part of the roof with PV panels, three PV models (TRI120TM-BB, TRI240TM-BB, and TRI380HP-BB) were chosen, taking into account that all the offices and the relaxation area have a triangle shape. In particular, the model TRI120TM-BB has the shape of a triangle, while the models TRI240TM-BB and TRI380HP-BB have a square shape. The PV panels are installed on the roofs of office A, office B, office C, relaxation area, and toilets, for a total area of about 53 m2.
The adoption of lithium-ion electric storage, commercialized by the company Tesla [65], has also been considered. The capacity of the electric storage has been selected by following the criteria suggested by the manufacturer [65] according to the daily average electricity demand (equal to about 15 kWh/day). A sensitivity analysis has been carried out in order to determine the optimal size of the electric storage; in particular, the following three cases have been evaluated:
- Case 4:
- Smart windows (controlled based on the indoor air temperature) + 10.34 kWp PV panels without electric storage;
- Case 5:
- Smart windows (controlled based on the indoor air temperature) + 10.34 kWp PV panels + a single 13.5 kWh electric storage;
- Case 6:
- Smart windows (controlled based on the indoor air temperature) + 10.34 kWp PV panels + two electric storages (13.5 kWh per each).
Figure A3 of Appendix A describes the arrangement of the PV panels on the roofs of building configuration B.
Table 9 reports the main characteristics of both the PV panels and the electric storage.
Table 9.
Main characteristics of the PV panels and the electric storage adopted in building configurations B and C.
The PV panels have been modeled via TRNSYS Type 190. This component determines the electrical performance of a photovoltaic array. The model of the PV panels is described in De Soto et al. [66]; in particular, this model is a five-parameter model able to predict the current I and the voltage V, and thus the power delivered to the load, according to the following formula:
where the shunt resistance Rsh = 53.6 Ω, the series resistance Rs = 0.2136 Ω, the light current IL = 18.37 A, and the diode reverse saturation current IO = 8.809 × 10⁻⁹ A; the modified ideality factor a (equal to 2.015 V) is defined by the following Equation (2):
where the electron charge q and Boltzmann’s constant kBo are known, nI is the usual ideality factor, Ns is the number of cells in series, and Tc is the cell temperature.
The electric storage has been modeled by means of TRNSYS Type 47a [34] (calibrated according to manufacturer information [65]), while the inverter/charge controller has been modeled based on TRNSYS Type 48b [34]. TRNSYS Type 48b is made up of two devices, the first of which is a regulator that distributes DC power from a solar cell array to and from a battery (in systems with energy storage), and the second of which is an inverter. TRNSYS Type 47a describes how the battery state of charge varies over time, given the rate of charge or discharge. Parts of the array are turned off to either dump or not collect surplus power if the battery is completely charged or only requires a taper charge. The inverter then converts the DC power to AC power and sends it to the load or feeds it back to the utility.
The inverter/charger controller receives the electric energy generated by the PV panels and uses it to first satisfy the electric demands; if the electric generation is larger than the overall electric demand, the surplus is used to charge the electric storage when its charging level is lower than 100%. When the amount of electric energy produced by the PV panels exceeds the total amount of electric demand and the level of the electric storage charge is equal to 100%, the excess electric energy is sold to the main grid. The electric storage is discharged only when its charging level is greater than 10%; its discharging is stopped when its charging level is lower than 10%. The central grid is also used to cover peak demands in the event that the electricity provided by the PV panels is unable to completely cover the electric requirement.
3.3. Building Configuration C with Photovoltaic Panels (PVs), wind Turbine and Electric Storages
The proposed building configuration C consists of the electrochromic smart windows (instead of the conventional windows) selected in case 3, photovoltaic panels, a 300 W wind turbine (cases 7 and 8) or a 700 W wind turbine (cases 9 and 10), as well as two (cases 7 and 9) or three (cases 8 and 10) lithium-ion electric storages.
Two different small vertical wind turbines, commercialized by the company ETNEO [67,68] and characterized by different nominal electric outputs (300 W and 700 W), have been selected in this study. Table 10 reports the main characteristics of the selected wind turbines.
Table 10.
Main characteristics of the wind turbines adopted in building configuration C.
A sensitivity analysis has been performed with the aim of determining the best configuration in terms of wind turbine’ electric output and electric storage’ capacity, allowing optimization of the energy, environmental, and economic performance associated with configuration C; in particular, the following four cases have been evaluated:
- Case 7:
- Smart windows (controlled based on the indoor air temperature) + 10.34 kWp PV panels (as in cases 4–6) + a single wind turbine (DS300) with a nominal electric output of 300 W + 2 electric storages (same model used in cases 5–6) with a nominal electric capacity of 13.5 kWh per each.
- Case 8:
- Smart windows (controlled based on the indoor air temperature) + 10.34 kWp PV panels (as in cases 4–6) + a single wind turbine (DS300) with a nominal electric output of 300 W + 3 electric storages (same model used in cases 5–6) with a nominal electric capacity of 13.5 kWh per each.
- Case 9:
- Smart windows (controlled based on the indoor air temperature) + 10.34 kWp PV panels (as in cases 4–6) + a single wind turbine (DS700) with a nominal electric output of 700 W + 2 electric storages (the same model used in cases 5–6) with a nominal electric capacity of 13.5 kWh per each.
- Case 10:
- Smart windows (controlled based on the indoor air temperature) + 10.34 kWp PV panels (as in cases 4–6) + a single wind turbine (DS700) with a nominal electric output of 700 W + 3 electric storages (the same model used in cases 5–6) with a nominal electric capacity of 13.5 kWh per each.
Figure A4 of Appendix A describes building configuration C, including the PV panels, the wind turbine, and the electric storages.
The inverter/charger controller operates with exactly the same logic already explained for building configuration B in the previous section.
The wind turbines are modeled by means of TRNSYS Type 90 [34], according to the manufacturer’s data [67,68]. The model calculates the power output of the wind turbine as a function of air density, power coefficient, rotor area, and wind speed; in order to calculate the power produced by the wind turbine, TRNSYS Type 90 requires an external file, where the geometry of the wind turbine and the characteristic curve of power as a function of the wind speed are provided. In particular, in this paper, the model has been calibrated in order to generate a power Pel,WT (W) according to the following equations (specified by the manufacturer ETNEO [67,68]) as a function of the wind speed vwind (m/s) varying between 2.2 m/s (cut-in wind speed) and 15.5 m/s (cut-out wind speed):
where Equation (3) refers to the wind turbine DS300, while Equation (4) is for the wind turbine DS700; the values of the wind speed in the equations have been obtained from the EnergyPlus weather data file of Naples [55] described in the previous Section 2.3.
4. Comparison between Baseline Building and Alternative Building Configurations: Methods of Analysis
The performance of the proposed alternative building configurations (PB) is compared with that of the baseline building (BB) in terms of primary energy consumption, CO2 equivalent emissions, operating costs, and capital costs. The comparison has been carried out by applying the same boundary conditions (described in Section 2.3) in terms of heating/cooling periods, temperature targets, occupancy profiles, climatic conditions, etc.
In particular, the comparison in terms of primary energy consumption has been performed by evaluating the primary energy saving (PES) according to the following formula:
where is the annual primary energy consumption of the baseline building and is the annual primary energy consumption of the proposed alternative building configuration. The following formulas have been used for calculating the values of and :
where Eel,import is the electricity imported from the central grid, ηPP is the power plant average efficiency in Italy (the value of ηPP is considered equal to 0.495 according to the data suggested in [69], taking into account also the transmission losses), Eel,lighting is the electric energy consumed by the lighting systems, Eel,appliances is the electric energy consumed by the electric appliances, and Eel,EHPs is the electric energy consumed by the EHPs.
The CO2 equivalent emissions of the baseline and alternative configurations of the building have been compared by means of the following parameter ΔCO2:
where is the mass of the CO2 equivalent emissions associated with the proposed alternative building configuration and is the mass of the CO2 equivalent emissions associated with the baseline building.
The assessment of the pollutant emissions has been performed in this study through the energy output-based emission factor approach suggested by Chicco and Mancarella [70]. According to this approach, the mass mx of a given pollutant x emitted while producing the energy output E can be worked out as:
where is the energy output-based emission factor, that is, the specific emissions of x per unit of E. This factor depends upon several operating and structural variables, such as partial load operation, type of equipment, state of maintenance, age, pollutant abatement systems, outdoor conditions, etc.
The values of and used in Equation (8) have been computed as reported below, according to Equation (9):
where α represents the CO2 equivalent emission factor associated with electricity generation. In particular, α is set equal to 0.314 gCO2/kWhel, according to the data indicated in [69] for the Italian scenario.
Finally, the operating costs of the baseline and alternative configurations of the building have been determined via the parameter ΔOC, calculated by means of the following formula:
where OCPB represents the operating costs associated with the proposed alternative building configuration and OCBB represents the operating costs associated with the baseline building. The following formulas have been used for calculating the values of OCPB and OCBB:
where UCel is the unit cost of electricity purchased from the central grid, UCNS,t is the unit cost related to the electricity transmission network, and CNS is the cost related to network services (distribution and measurement). Table 11 reports the monthly average values of UCel as a function of the daily time slots F1, F2, and F3 (F1: 8:00–19:00 from Monday to Friday; F2: 7:00–8:00 and 19:00–23:00 from Monday to Friday, 19:00–23:00 during Saturday; F3: 0:00–7:00 and 23:00–24:00 from Monday to Saturday, 0:00–24:00 during Sunday and non-working days) as well as the month. The values reported in this table have been estimated in accordance with [71] by taking into account the data related to the 3-year period 2020–2022. The value of UCNS,t has been assumed to be equal to 0.00778 EUR/kWh, while the value of CNS has been considered equal to 20.12 EUR·NPOD + 20.8 EUR/kW·Pel,PODmax (where NPOD is the withdrawal point and Pel,PODmax is the max electric power to the withdrawal point) according to [72] by considering the data associated with the 3-year period 2020–2022.
Table 11.
Monthly average unit costs (UCel) of electricity [71].
The economic analysis has also been performed in terms of return on investment (ROI), calculated according to the following formula suggested by Formica and Pecht [73]:
where ARPB is the annual revenues obtained with the proposed alternative building configurations thanks to the electric energy sold to the central grid, and ECIPB is the cost of investment associated with the components added to the baseline building configuration in order to obtain the proposed alternative building configurations. The ROI is a performance measure used to evaluate the efficiency or profitability of an investment or compare the efficiency of different investments; it tries to directly measure the amount of return on a particular investment with respect to the investment’s cost. In the case where the ROI is positive, this means that the investment is providing a net profit; in particular, the greater the ROI, the greater the net profit with respect to the investment. The following formulas have been used for calculating the values of ARPB and ECIPB:
where UCel,sold is the unit price of the electric energy sold to the central grid, Eel,sold is the electric energy sold to the central grid in the case of the proposed alternative building configurations, is the extra cost of a single smart window selected for the proposed alternative building configurations with respect to the cost of a single traditional window used in the baseline building configuration, is the total area of the smart windows selected in the case of the proposed alternative building configurations (equal to 44 m2), is the unit cost of investment related to the selected photovoltaic panels selected for the proposed alternative building configurations, is the peak power of the photovoltaic panels selected in the case of the proposed alternative building configurations (equal to 10.34 kWp), is the cost of investment associated with a single electric storage selected for the proposed alternative building configurations, NESPB is the number of electric storages selected for the proposed alternative building configurations (equal to 1 for the configuration 5, equal to 2 for configurations 6, 7, and 9, and equal to 3 for the configurations 8 and 10), is the cost of investment associated with the selected wind turbine in the case of the proposed alternative building configurations, and EI represents the economic incentives guaranteed by the Italian development agency INVITALIA [74] (owned by the Italian Ministry of Economy) aspiring to boost Italy’s economic growth with reference to strategic sectors for development and employment in order to promote the establishment of new business activities. The value of UCel,sold has been assumed to be equal to 0.0521 EUR/kWh according to Paiano et al. [75] for the Italian scenario; according to [76], the value of has been assumed to be equal to 805 EUR/m2, taking into account that the cost of a single smart glazing window is approximately equal to 920 EUR/m2, while the cost of a single conventional window can be estimated equal to 115 EUR/m2. The value of is assumed to be equal to 1351 EUR/kWp, as suggested in [77]. The value of has been determined by considering the Tesla Powerwall battery and is assumed to be equal to EUR 9999.0 in Italy [78]. The value of has been assumed to be equal to EUR 2950.0 [79] and 6500.0 [80], respectively, for the wind turbine DS300 (selected in configurations 7 and 8) and the wind turbine DS700 (selected in configurations 9 and 10), according to the manufacturer data. The value of EI has been assumed to be equal to 80% of ECIPB based on the CULTURE CREA 2.0 [81] call for proposals promoted by the INVITALIA to support the birth and growth of businesses and nonprofit initiatives in the tourism-cultural sector through non-repayable financing.
The economic analysis has been completed by calculating the so-called simple pay-back (SPB) period, which represents the time required to recover the extra initial investment cost. The following formula has been used according to [82]:
5. Results and Discussion
The 10 case studies corresponding to the 3 building configurations (A, B, and C) described in Table 6, together with the baseline building configuration, have been modeled, simulated, and analyzed over a period of 1 year; the associated simulation results have been compared with the performance of the baseline building (described in Section 2) according to the methods indicated in Section 4. The analysis has been performed by means of the dynamic simulation software TRNSYS, using a simulation time step of 2 min.
Table 12 reports (i) the annual electric energy demand by lighting and appliances, (ii) the annual primary energy consumption (calculated via Equation (7)), (iii) the annual CO2 equivalent emissions (calculated via Equation (11)), and (iv) the annual operating costs (calculated via Equation (14)) of the baseline building.
Table 12.
Annual energy, environmental, and economic performance of the baseline building.
In the next sections, the performance of the baseline building is discussed in comparison to that associated with the proposed alternative building configurations.
5.1. Comparison between the Proposed Alternative Building Configuration A and the Baseline Building
Figure 10a,b compares the performance of the baseline building with those associated with case studies 1, 2, and 3 of building configuration A (see Table 6). In particular, Figure 10a reports the energy difference (EBB–EPB) between the baseline building (EBB) and the proposed alternative configuration (EPB) in terms of annual heating demand, annual cooling demand, and annual EHP electric energy demand upon varying the case study. A positive value of the parameter (EBB–EPB) means that the baseline building is consuming more energy than the proposed alternative configuration. Figure 10b shows the values of PES, ΔCO2, and ΔOC calculated via Equations (5), (8), and (12), respectively, as a function of the case study.
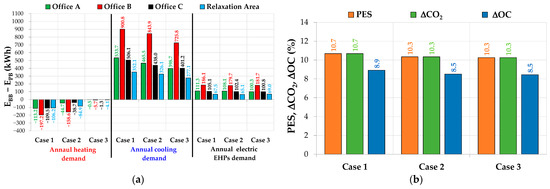
Figure 10.
Comparison between baseline building and building configuration A: (a) difference in terms of annual energy demands; (b) values of PES, ΔCO2, and ΔOC.
These figures demonstrate that:
- (a)
- the values of (EBB–EPB) are negative with reference to the annual heating demand for all the case studies; this means that the baseline building is characterized by a lower annual heating demand due to the fact that the smart windows reduce the solar gains with respect to the baseline case characterized by traditional windows that are always clear;
- (b)
- the values of (EBB–EPB) are positive with reference to both the annual cooling demand and the annual EHP electric demand, whatever the case study is. These results indicate that smart windows allow for reducing the cooling (up to 50%) and electric (up to 46%) demands of the building with respect to the conventional windows (always characterized by a clear state) thanks to the fact that the smart windows reduce the solar loads during summer; the difference is more significant in terms of annual cooling demand with respect to electric consumption;
- (c)
- case study 1 is characterized by the largest reduction in terms of both cooling energy demand and EHP electric demand with respect to the baseline building, but it results in the worst configuration with reference to the annual heating demand. This is due to the fact that in case 1, the state of the smart windows is always dark (this helps in reducing the solar gains during the summer, but it is negative during the heating period), while in cases 2 and 3, the state of the smart windows is dark only when the incident solar radiation is larger than 400 W/m2 (case 2) or the indoor air temperature is greater than 25.5 °C (case 3);
- (d)
- the values of PES, ΔCO2, and ΔOC are always positive, whatever the simulation case is; this means that all the proposed case studies of building configuration A allow for reducing the primary energy consumption, the equivalent CO2 emissions, as well as the operating costs in comparison to the baseline building; these results are obtained thanks to the fact that the adoption of smart windows allows reducing the cooling energy demand;
- (e)
- the values of PES, ΔCO2, and ΔOC are almost constant, whatever the case study is; in particular, the values of PES and ΔCO2 are characterized by a value a bit larger than 10%, while the value of ΔOC has a value of about 8.5%. This is mostly related to the fact that the thermal/cooling energy demands are almost the same, whatever the building configuration under consideration is. Case 1 is characterized by values slightly better in comparison to cases 2 and 3, thanks to the fact that the electric demand of the EHP corresponding to case 1 is a bit lower in contrast with the other two cases.
According to the date reported in Figure 10a,b, the control logic of case study 3 has been selected taking into account that:
- in case 1, the windows’ state is always dark, so that the visual interaction with the outside world is completely prevented (even if it is characterized by the largest values of PES, ΔCO2, and ΔOC);
- the difference in terms of PES, ΔCO2, and ΔOC between case 2 and case 3 is negligible, but, with respect to case 2, case 3 is characterized by a lower heating demand during the winter (thanks to more significant solar gains).
5.2. Comparison between the Proposed Alternative Building Configuration B and the Baseline Building
Figure 11a describes the annual electric energy flows (electric energy produced by the PV panels, electric energy discharged from the battery, electric energy sold to the central grid, and electric energy purchased from the central grid) associated with case studies 4, 5, and 6 of building configuration B (the total annual electric energy demand for lighting systems, electric appliances, and EHPs operation is 3945.8 kWh). Figure 11b indicates the values of PES, ΔCO2, and ΔOC calculated by comparing the baseline building and building configuration B (via Equations (5), (8), and (12), respectively) as a function of the case study.
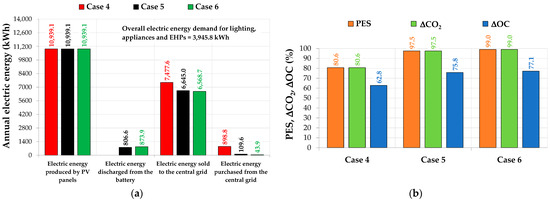
Figure 11.
Electric energy flows of building configuration B (a) and values of PES, ΔCO2, and ΔOC associated with the comparison between building configuration B and the baseline building (b).
These figures demonstrate that:
- (a)
- the values of the electric energy produced by the PV panels are constant upon varying the case study and equal to about 11,000 kWh; this result was expected, taking into account that all the case studies are characterized by the same number, type, and orientation of the PV panels;
- (b)
- the electric energy sold to the central grid is maximum for case 4 (thanks to the fact that this building configuration is not equipped with electric storages); it is minimum for case 6 due to the adoption of two electric storages;
- (c)
- the electric energy purchased from the central grid is maximum for case 4 (as a consequence of the fact that this building configuration is without electric storages), while it is minimum for case 6 thanks to the operation of the two electric storages;
- (d)
- the value of electric energy discharged from the battery and used to satisfy the energy demands of the building is maximum for case 6 (thanks to the fact that this configuration is equipped with two electric storages);
- (e)
- the values of PES, ΔCO2, and ΔOC are always positive, whatever the simulation case is; this means that all the proposed configurations allow to always reduce the primary energy consumption, the equivalent CO2 emissions, as well as the operating costs in comparison to the baseline building; this is thanks to the fact that using the PV panels with or without electric storage allows reducing the electric energy imported from the central grid;
- (f)
- the values of PES, ΔCO2, and ΔOC are maximum for case 6 (with the values of PES and ΔCO2 equal to 99.0% and the value of ΔOC equal to about 77%) thanks to a greater number of electric batteries allowing for better exploitation of electric energy generated by the PV panels. Taking into account that a value of PES close to the maximum has been achieved, a further case study with four batteries has not been investigated;
- (g)
- a further case study with three batteries was not considered because of the fact that the PES value is already 100% with reference to the cooling period in case 6, whereas in the heating period, the two batteries in case 6 already fail to charge due to the reduced availability of solar radiation;
- (h)
- the values of PES, ΔCO2, and ΔOC associated with configuration B are much higher than those obtained in the case of configuration A (whatever the case is), thanks to the electric energy generated by the PV panels (which allows reducing the amount of electricity imported from the central grid).
Case 6 is the best option in terms of primary energy demand, equivalent CO2 emissions, and operation costs thanks to a larger capacity of the electric energy storages, allowing to obtain:
- a lower value of the electric energy purchased from the national electric grid in comparison to both cases 4 and 5;
- a greater value of the electric energy discharged from the battery and used to satisfy the electric demands with respect to cases 4 and 5;
- bigger values of PES (99.0%), ΔCO2 (99.0%), and ΔOC (77.1%) than cases 4 and 5.
5.3. Comparison between the Proposed Alternative Building Configuration C and the Baseline Building
Figure 12a describes the annual electric energy flows (electric energy produced by the wind turbine, electric energy produced by the PV panels, electric energy discharged from the batteries, electric energy sold to the central grid, and electric energy purchased from the central grid) associated with case studies 7, 8, 9, and 10 of building configuration C (with a total annual electric energy demand for lighting systems, electric appliances, and EHPs operation of 3945.8 kWh). Figure 12b reports the values of PES, ΔCO2, and ΔOC calculated by comparing the baseline building and building configuration C (via Equations (5), (8), and (12), respectively) as a function of the case study.
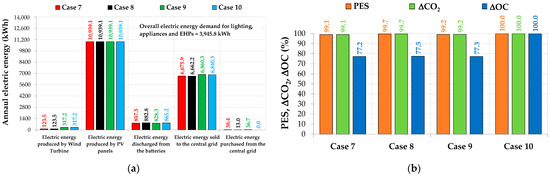
Figure 12.
Electric energy flows of building configuration C (a) and values of PES, ΔCO2, and ΔOC associated with the comparison between building configuration C and the baseline building (b).
These figures indicate that:
- (a)
- the electric energy produced by the wind turbine is up to about 3% of the electricity generated by the PV panels;
- (b)
- the electric energy sold to the central grid is maximum in case 9 (configuration with the 700 W wind turbine coupled with two batteries) thanks to the facts that (i) in cases 7 and 8 a wind turbine with lower capacity (300 W instead of 700 W) is adopted, (ii) while in case 10 the capacity of the electric batteries is larger (three electric storages instead of two), thus allowing for a more significant amount of stored electricity;
- (c)
- the electric energy purchased from the central grid is generally very low and maximum for case 7 (due to the fact that this building configuration is equipped with the wind turbine of lower capacity (300 W) and two electric storages only), while it is minimum (equal to 0) for case 10 thanks to the adoption of the wind turbine with higher electric capacity (700 W) and three electric storages;
- (d)
- the electric energy discharged from the battery and used to satisfy the energy demand in case 8 is maximum and larger than that associated with case 10 (thanks to the same capacity of the electric storages combined with a wind turbine with a lower nominal electric output);
- (e)
- the values of PES, ΔCO2, and ΔOC are always positive, whatever the simulation case is; this means that all the proposed configurations allow to always reduce the primary energy consumption, the equivalent CO2 emissions, as well as the operating costs in comparison to the baseline building thanks to the operation of renewable-based electric generation systems;
- (f)
- the values of PES, ΔCO2, and ΔOC associated with configuration C are slightly larger than those obtained in the case of configuration B (whatever the case is) thanks to the addition of the small wind turbine for electricity generation; however, the differences are very small and, therefore, the addition of the small wind turbine is not strictly mandatory;
- (g)
- PES, ΔCO2, and ΔOC are maximum for case 10, achieving a value of 100.0%; this means that in case 10, the entire electric demand is covered by renewable energy sources (solar and wind);
- (h)
- the difference among cases 7, 8, and 9 is negligible from all points of view.
Case 10 is the optimal configuration among the proposed options for building configuration C in terms of primary energy demand, equivalent CO2 emissions, and operation costs, considering that:
- the electric energy purchased from the national electric grid is zero;
- the values of PES, ΔCO2, and ΔOC are equal to 100%, meaning that the corresponding building configuration is energetically self-sufficient (thanks to the electric energy produced by both the wind turbine and the photovoltaic panels coupled with three electrical storages) and can be used for stand-alone applications.
5.4. Comparison between the Baseline Building and the Proposed Alternative Building Configurations A, B and C in Terms of Investment Costs
Figure 13 reports the values of the ROI and the SPB period (calculated based on Equation (15) and Equation (18), respectively) as a function of the case studies (cases 1, 2, and 3 belong to building configuration A, cases 4, 5, and 6 belong to building configuration B, and cases 7, 8, 9, and 10 belong to building configuration C). This figure underlines that:
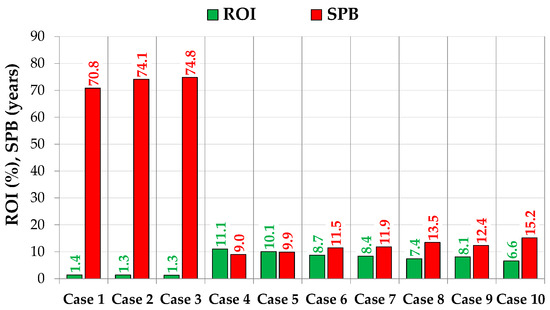
Figure 13.
Values of ROI and SPB upon varying the proposed case studies.
- with reference to all the investigated case studies, the ROI ranges from a minimum of 1.3% (corresponding to cases 2 and 3) up to a maximum of 11.1% (corresponding to case 4);
- with reference to cases 1, 2, and 3 corresponding to building configuration A, the variation of the ROI is almost negligible;
- with reference to cases 4, 5, and 6 corresponding to building configuration B, the ROI is between 10.1% (case 5) and 11.1% (case 4); case 4 is characterized by larger values of the ROI in comparison to cases 4 and 5 thanks to the fact that the corresponding net profit is larger as well as its related extra cost of investment being reduced;
- with reference to cases 7, 8, 9, and 10 corresponding to building configuration C, the ROI is in the range of 6.6% (case 10)/8.4% (case 7); case 10 is characterized by lower values of the ROI with respect to cases 7–9 due to the fact that there are no revenues from the electric energy sold to the central grid;
- configuration B (cases 4, 5, and 6) is characterized by larger values of the ROI with respect to configuration C (cases 7, 8, 9, and 10), which, in turn, allows to obtain better values of the ROI in contrast with configuration A (cases 1, 2 and 3);
- with reference to all the investigated case studies, the SPB period ranges from a minimum of 9.0 years (corresponding to case 4) up to a maximum of 74.8 years (corresponding to case 3);
- with reference to cases 1, 2, and 3 corresponding to building configuration A, the SPB period varies between 70.8 years (case 1) and 74.8 years (case 3); case 1 is characterized by better values of the SPB thanks to the fact that the corresponding control logic allows to obtain a more significant reduction in the operating costs (see Figure 10);
- with reference to cases 4, 5, and 6 corresponding to building configuration B, the SPB period is in the range between 9.0 years (case 4) and 11.5 years (case 6); case 4 is characterized by lower values of the SPB period in comparison to cases 4 and 5 thanks to the fact that its extra cost of investment is reduced;
- with reference to cases 7, 8, 9, and 10 corresponding to building configuration C, the SPB period ranges from 11.9 years (case 7) to 15.2 years (case 10); case 10 is characterized by larger values of the SPB period with respect to cases 7–9 due to the fact that electric energy is not sold to the central grid in this case;
- configuration B (cases 4, 5, and 6) is characterized by lower values of the SPB period with respect to configuration C (cases 7, 8, 9, and 10), which, in turn, allows to obtain better values of the SPB period in contrast with configuration A (cases 1, 2, and 3);
- taking into account that the useful lifetime of all the proposed measures/components is greater than 15.2 years, it can be clearly stated that the buildings corresponding to cases 4, 5, 6, 7, 8, 9, and 10 (configurations B and C) are economically feasible, while the buildings corresponding to cases 1, 2, and 3 (configuration A) are not acceptable from an economic point of view;
- case 4 is characterized by the largest value of the ROI as well as the lowest SPB period, thus representing the best building configuration in terms of investment profitability;
- the lowest value of the ROI and the largest SPB period are associated with case 3, thus corresponding to the worst building configuration from the investment point of view.
The values of ROI and SPB found in this study are compared with those recognized in scientific studies focused on similar renewable-based energy systems. Formica and Pecht [73] calculated the ROI of a 9.12 kWp PV system installed in a residential area of College Park (Maryland, USA), obtaining values of 14.5% and 23.6%, respectively, without and with tax credits; in addition, they found an SPB period lower than 5 years by assuming a constant energy production with tax credits. Tsuchiya et al. [83] found an ROI of −0.4% in the case of an off-grid 48 kWp PV system serving a village (with 176 end-users) in rural Tanzania. Muhammad-Sukki et al. [84] evaluated the ROI for a solar PV system with a capacity ranging between 4 kWp and 30 MWp serving a residential house in Malaysia; they found an ROI of about 5% thanks to a consistent annual output of electricity. Yang et al. [85] recognized an ROI ranging from 8.12% to 36% and an SPB period between 2.77 and 12 years (with and without economic incentives, respectively) for a 6.42 kWp PV system serving a pitched-roof house located in Gainesville (Florida, USA). Therefore, the values of ROI and SPB obtained in this work are quite consistent with the results associated with literature studies focused on comparable renewable-based energy systems.
6. Conclusions
Prefabricated buildings differ substantially from conventional buildings in terms of thermal inertia, glazed surface area, and air tightness. These differences result in enhanced solar gains/loads as well as much more variable thermal/cooling loads and indoor air temperatures over time depending on external climatic conditions. This implies that the analysis of prefabricated buildings is quite different with respect to conventional buildings, and it requires the utilization of a dynamic simulation platform to duly take into consideration the changing climatic conditions as well as the transient operation of building-integrated energy systems.
In this study, an innovative prefabricated movable building to be used as an office for smart/co-working by a maximum of six persons has been designed. Three main building configurations with ten case studies differing in terms of energy-efficient measures related to the building envelope (smart windows operated under various control logics) and the energy systems serving the building (including photovoltaic panels, small wind turbines, and electric storages) have been proposed, modeled, and analyzed via the dynamic simulation software TRNSYS. The performance of the ten case studies has been compared from energy, environmental, and economic points of view with respect to a baseline configuration characterized by conventional building envelope and energy systems. The simulation results underlined that:
- all the proposed alternative configurations allow for savings in primary energy, equivalent CO2 emissions, and operating costs with respect to the baseline building;
- the primary energy savings range from a minimum of 10.3% (case studies 2 and 3) up to a maximum of 100% (case study 10);
- the reduction in terms of equivalent CO2 emissions varies from a minimum of 10.3% (case studies 2 and 3) up to a maximum of 100% (case study 10);
- the operating cost reduction is between 8.5% (case studies 2 and 3) and 100% (case study 10);
- the contribution of small wind turbines is almost negligible in covering the electric building demand when solar radiation is reduced;
- the building configurations including smart windows alone are not economically feasible in terms of the simple pay-back (SPB) period, while the building configurations equipped with photovoltaic panels and/or electric storages and/or wind turbines represent a suitable investment thanks to an SPB lower than 15.2 years;
- a stand-alone building configuration for smart/co-working with energy demands totally covered by means of renewable sources is possible (PES = ΔCO2 = ΔOC = 100%) by combining smart windows, photovoltaic panels, electric storages, and wind turbines; in addition, it has been demonstrated that it is economically feasible thanks to an SPB period equal to 15.2 years and, therefore, lower than its expected lifetime.
In this work, a specific annual electric energy demand varying between 41.2 kWh/m2 year (case study 1) and 46.1 kWh/m2 year (baseline configuration) has been calculated according to the simulation data. The specific annual electric energy demand of the studies selected from the literature (see Table 1) varies from a minimum of 25.77 kWh/m2 year up to a maximum of 133.38 kWh/m2 year; in more detail, the values range from 54.60 kWh/m2 year to 133.38 kWh/m2 year with reference to the literature studies performed under Italian scenarios. Therefore, the values obtained in the work are completely consistent with the results associated with the selected case studies; in particular, the specific annual electric energy demands of the building configurations proposed in this paper are lower than those corresponding to the Italian case studies selected from the literature.
In order to maximize the performance of the proposed alternative building configurations, the installation of PV panels has to be performed in order to avoid eventual shading effects due to the surroundings, while the wind turbine should be installed by taking into account that obstacles to the wind (such as buildings, trees, rock formations, etc.) can decrease wind speeds significantly, and they often create turbulence in their neighborhood.
In the future, the authors would like to develop a virtual model of the designed prefabricated movable building; immersive virtual reality tests will be carried out in the SENS i-Lab of the Department of Architecture and Industrial Design of the University of Campania Luigi Vanvitelli to optimize its human-centered design upon varying the thermo-hygrometric/visual/acoustic scenarios with the aim of assessing work performance and restorativeness via subjective questionnaires. A real, full-scale prototype of the building will be realized and installed on a proper site, and its field performance will be measured/analyzed to assess the energy/environmental/economic benefits of the proposed prototype with respect to traditional working habits.
Author Contributions
Conceptualization, L.M., A.C., M.M. and A.R.; methodology, L.M., A.C., M.M. and A.R.; software, L.M., A.C., A.P., M.M. and A.R.; validation, L.M., A.C., M.M. and A.R.; formal analysis, L.M., A.C., M.M. and A.R.; investigation, L.M., A.C., M.M. and A.R.; resources, L.M., A.C., M.M. and A.R.; data curation, L.M., A.C., A.P., M.M. and A.R.; writing—original draft preparation, L.M., A.C., A.P., M.M. and A.R.; writing—review and editing, L.M., A.C., A.P., M.M. and A.R.; visualization, L.M., A.C., A.P., M.M. and A.R.; supervision, L.M. and A.R.; project administration, L.M.; funding acquisition, L.M. All authors have read and agreed to the published version of the manuscript.
Funding
This research received no external funding.
Institutional Review Board Statement
Not applicable.
Informed Consent Statement
Not applicable.
Data Availability Statement
The materials and data that support the findings of this study are available from the authors.
Acknowledgments
This work was undertaken as part of the program FSE REACT EU—PON “Ricerca e Innovazione” 2014–2020 of the Italian Ministry of University and Research, Action IV.4 ‘‘Dottorati e contratti di ricerca su tematiche dell’innovazione” (A. Ciervo RTD-A contract code: 49-I-32603-2).
Conflicts of Interest
The authors declare no conflict of interest.
Nomenclature
| Latin letters | |
| A | Area (m2) |
| AC | Alternating current |
| AR | Annual revenues |
| BB | Baseline building |
| BIPV/T | Photovoltaic/thermal solar systems |
| C | Cost (EUR) |
| CC | Capital cost (EUR) |
| CDF | Cumulative distribution function |
| CO2 | Equivalent emissions of carbon dioxide |
| COP | Coefficient of performance |
| DC | Direct current |
| DHW | Domestic hot water |
| E | Energy (kWh) |
| ECI | Extra cost of investment |
| EER | Energy efficiency ratio (-) |
| EHP | Electric reversing heat pump (-) |
| EI | Economic incentive |
| ES | Electric storage |
| F1 | Average cost of electricity for the F1 band |
| F2 | Average cost of electricity for the F2 band |
| F3 | Average cost of electricity for the F3 band |
| FS | Finkelstein–Schafer |
| I | Current I |
| LED | Light-emitting diode |
| LFP | Lithium-iron phosphate |
| m | Mass (kg) |
| N | Number |
| NES | Number of electric storages |
| OC | Operation cost (EUR) |
| OFF | Turned off |
| ON | In operation |
| P | Power (kW) |
| PB | Proposed alternative building configurations |
| PES | Primary energy saving (%) |
| PUN | National single price (EUR/kWh) |
| PV | Photovoltaic |
| PZ | Zonal price (EUR/kWh) |
| R | Resistance |
| ROI | Return on investment (%) |
| SCW | Smart/co-working |
| SHGC | Solar heat gain coefficient |
| SPB | Simple pay-back (years) |
| SW | Smart window |
| T | Temperature (°C) |
| U | Thermal transmittance (W/m2 K) |
| UC | Unit cost (EUR/kWh) |
| UCC | Unit capital cost |
| UV | Ultraviolet |
| v | Wind speed (m/s) |
| V | Voltage (V) |
| VWT | Vertical wind turbine |
| WT | Wind turbine |
| Greeks | |
| α | CO2 equivalent emission factor for electricity production (kgCO2/kWhel) |
| τ | Transmission coefficient |
| ∆ | Difference |
| η | Efficiency |
| φ | Incident solar radiation (W/m2) |
| Superscripts/Subscripts | |
| appliances | Electric appliances |
| CO2 | Carbon dioxide |
| el | Electric |
| ES | Electric storage |
| f | Frame |
| g | Glazing |
| i | Indoor |
| import | Imported from the central grid |
| lighting | Lighting systems |
| max | Maximum |
| NS | Electricity network services |
| OA | Office A |
| OB | Office B |
| OC | Office C |
| ON | In operation |
| p | Peak |
| POD | Withdrawal point |
| PP | Power plant |
| RA | Relaxation area |
| th | Thermal gain/load |
| Stand-by | Stand-by operation |
| vis | Visible |
| wind | Wind |
| WT | Wind turbine |
Appendix A
Figure A1a,b reports two renders describing the design of the proposed baseline building.

Figure A1.
Architectural model of the baseline building: (a) view from above, (b) view from the side, north-west oriented.
Figure A1.
Architectural model of the baseline building: (a) view from above, (b) view from the side, north-west oriented.

Figure A2 highlights the four identical EHPs serving office A (EHPOA), office B (EHPOB), office C (EHPOC), and the relaxation area (EHPRA) as installed in the baseline building.

Figure A2.
Schematic of the building-integrated air-conditioning system.
Figure A2.
Schematic of the building-integrated air-conditioning system.

Figure A3 describes the arrangement of the PV panels on the roofs of the building.

Figure A3.
Arrangement of PV panels on the roof in the case of building configuration B (case 4).
Figure A3.
Arrangement of PV panels on the roof in the case of building configuration B (case 4).

Figure A4 of Appendix A describes building configuration C, including the wind turbine.

Figure A4.
Architectural model of building configuration C, including the PV panels, wind turbine, and electric storages.
Figure A4.
Architectural model of building configuration C, including the PV panels, wind turbine, and electric storages.

References
- Long, J.; Reuschke, D. Daily Mobility Patterns of Small Business Owners and Homeworkers in Post-Industrial Cities. Comput. Environ. Urban Syst. 2021, 85, 101564. [Google Scholar] [CrossRef]
- Howell, T. Coworking Spaces: An Overview and Research Agenda. Res. Policy 2022, 51, 104447. [Google Scholar] [CrossRef]
- ONES Smart Office, Building the Future. Available online: https://ones.software/blog/2022/11/29/coworking-statistics-trends/ (accessed on 6 April 2023).
- Wang, R.; Ye, Z.; Lu, M.; Hsu, S.C. Understanding Post-Pandemic Work-from-Home Behaviours and Community Level Energy Reduction via Agent-Based Modelling. Appl. Energy 2022, 322, 119433. [Google Scholar] [CrossRef]
- Global Status Report for Buildings and Construction. Available online: https://globalabc.org/resources/publications/2021-global-status-report-buildings-and-construction (accessed on 6 April 2023).
- Xiang, X.; Ma, M.; Ma, X.; Chen, L.; Cai, W.; Feng, W.; Ma, Z. Historical Decarbonization of Global Commercial Building Operations in the 21st Century. Appl. Energy 2022, 322, 119401. [Google Scholar] [CrossRef]
- European Union in Focus: Energy Efficiency in Buildings. Available online: https://commission.europa.eu/news/focus-energy-efficiency-buildings-2020-02-17_en (accessed on 6 April 2023).
- Ma, M.; Feng, W.; Huo, J.; Xiang, X. Operational Carbon Transition in the Megalopolises’ Commercial Buildings. Build. Environ. 2022, 226, 109705. [Google Scholar] [CrossRef]
- Awada, M.; Becerik-Gerber, B.; Hoque, S.; O’Neill, Z.; Pedrielli, G.; Wen, J.; Wu, T. Ten Questions Concerning Occupant Health in Buildings during Normal Operations and Extreme Events including the COVID-19 Pandemic. Build. Environ. 2021, 188, 107480. [Google Scholar] [CrossRef]
- Oakman, J.; Kinsman, N.; Stuckey, R.; Graham, M.; Weale, V. A Rapid Review of Mental and Physical Health Effects of Working at Home: How Do We Optimise Health? BMC Public Health 2020, 20, 1825. [Google Scholar] [CrossRef] [PubMed]
- Berman, M.G.; Jonides, J.; Kaplan, S. The Cognitive Benefits of Interacting with Nature. Psychol. Sci. 2008, 19, 1207–1212. [Google Scholar] [CrossRef] [PubMed]
- European Union EPBD Recast 2021. Available online: https://ec.europa.eu/energy/sites/default/files/proposal-recast-energy-performance-buildings-directive.pdf (accessed on 6 April 2023).
- Sheik, M.S.; Kakati, P.; Dandotiya, D.; M, U.R.; S, R.C. A Comprehensive Review on Various Cooling Techniques to Decrease an Operating Temperature of Solar Photovoltaic Panels. Energy Nexus 2022, 8, 100161. [Google Scholar] [CrossRef]
- Yang, A.S.; Su, Y.M.; Wen, C.Y.; Juan, Y.H.; Wang, W.S.; Cheng, C.H. Estimation of Wind Power Generation in Dense Urban Area. Appl. Energy 2016, 171, 213–230. [Google Scholar] [CrossRef]
- Ertek, G.; Kailas, L. Analyzing a Decade of Wind Turbine Accident News with Topic Modeling. Sustainability 2021, 13, 12757. [Google Scholar] [CrossRef]
- O’Shaughnessy, E.; Cutler, D.; Ardani, K.; Margolis, R. Solar plus: Optimization of Distributed Solar PV through Battery Storage and Dispatchable Load in Residential Buildings. Appl. Energy 2018, 213, 11–21. [Google Scholar] [CrossRef]
- Casini, M. Active Dynamic Windows for Buildings: A Review. Renew Energy 2018, 119, 923–934. [Google Scholar] [CrossRef]
- Wang, Y.; Wang, L.; Long, E.; Deng, S. An Experimental Study on the Indoor Thermal Environment in Prefabricated Houses in the Subtropics. Energy Build. 2016, 127, 529–539. [Google Scholar] [CrossRef]
- Ye, R.; Wang, J.; Jiang, H.; Xie, N. Numerical Study on Thermal Comfort and Energy-Saving Potential of a Prefabricated Temporary House Integrated with Composite Phase Change Materials. Energy Build. 2022, 268, 112169. [Google Scholar] [CrossRef]
- Košir, M.; Iglič, N.; Kunič, R. Optimisation of Heating, Cooling and Lighting Energy Performance of Modular Buildings in Respect to Location’s Climatic Specifics. Renew Energy 2018, 129, 527–539. [Google Scholar] [CrossRef]
- Greenreport Italian Depopulation. Available online: https://greenreport.it/news/scienze-e-ricerca/in-italia-avanza-la-desertificazione-non-solo-del-suolo-ma-anche-della-popolazione/ (accessed on 6 April 2023).
- ISTAT Demographic Statistics. Available online: https://www.istat.it/ (accessed on 6 April 2023).
- Maffei, L.; Ciervo, A.; Diodato, D.; Rosato, A. Prefabricated Movable Modular Building Solutions Exploiting Renewable Sources: Energy Systems Review. In Proceedings of the Proceedings Book of Extended Abstracts “Beyond All Limits—International Conference on Sustainability in Architecture, Planning, and Design”, Officina Vanvitelli-Real Belvedere di San Leucio, Caserta, Italy, 11–12 May 2022; pp. 301–306. [Google Scholar]
- Ceranic, B.; Beardmore, J.; Cox, A. Rapid Deployment Modular Building Solutions and Climatic Adaptability: Case Based Study of a Novel Approach to “Thermal Capacity on Demand”. Energy Build. 2018, 167, 124–135. [Google Scholar] [CrossRef]
- Michael, A.; Savvides, A.; Vassiliades, C.; Triantafyllidou, E. Design and Creation of an Energy Efficient Prefabricated Housing Unit Based on Specific Taxonomy and Optimization Techniques. Procedia Manuf. 2020, 44, 261–268. [Google Scholar] [CrossRef]
- Vassiliades, C.; Barone, G.; Buonomano, A.; Forzano, C.; Giuzio, G.F.; Palombo, A. Assessment of an Innovative Plug and Play PV/T System Integrated in a Prefabricated House Unit: Active and Passive Behaviour and Life Cycle Cost Analysis. Renew Energy 2022, 186, 845–863. [Google Scholar] [CrossRef]
- Ecocapsule. Available online: https://www.ecocapsule.sk/sites/default/files/ec_ecocapsule_katalog-2022_0.pdf (accessed on 31 May 2023).
- Leoncini, L.; Garzaniti, S.; Bertagni, S. Living Box—Sistema Abitativo Modulare Prefabbricato in Legno Living Box—Prefabricated Modular Wood-House System. KEP Energy 2017, 1–30. Available online: http://www.kep-energy.com/blog/ (accessed on 31 May 2023).
- Biosphera Project. Available online: https://equilibrium.biospheraproject.com/biosphera-equilibrium/concept-design/ (accessed on 31 May 2023).
- Universal Nature Energy Zhero. Available online: https://www.unesrl.com/en/products/ (accessed on 31 May 2023).
- Chen, D.; Wang, G.; Chen, G. Lego Architecture: Research on a Temporary Building Design Method for Post-Disaster Emergency. Front. Archit. Res. 2021, 10, 758–770. [Google Scholar] [CrossRef]
- Wang, C.; Deng, S.; Niu, J.; Long, E. A Numerical Study on Optimizing the Designs of Applying PCMs to a Disaster-Relief Prefabricated Temporary-House (PTH) to Improve Its Summer Daytime Indoor Thermal Environment. Energy 2019, 181, 239–249. [Google Scholar] [CrossRef]
- Papagiannidis, S.; Marikyan, D. Smart Offices: A Productivity and Well-Being Perspective. Int. J. Inf. Manag. 2020, 51, 102027. [Google Scholar] [CrossRef]
- TRNSYS The Transient Energy System Simulation Tool. Available online: http://www.trnsys.com (accessed on 6 April 2023).
- Rashad, M.; Żabnieńska-Góra, A.; Norman, L.; Jouhara, H. Analysis of Energy Demand in a Residential Building Using TRNSYS. Energy 2022, 254, 124357. [Google Scholar] [CrossRef]
- M’Saouri El Bat, A.; Romani, Z.; Bozonnet, E.; Draoui, A. Thermal Impact of Street Canyon Microclimate on Building Energy Needs Using TRNSYS: A Case Study of the City of Tangier in Morocco. Case Stud. Therm. Eng. 2021, 24, 100834. [Google Scholar] [CrossRef]
- Edilmetas Portable Modular Containers and Cabins. Available online: https://www.edilmetas.it/en/portable-modular-containers-and-cabins/ (accessed on 31 May 2023).
- SageGlass Electronically Tintable Glazing -Climaplus Classic. Available online: https://www.sageglass.com/sites/default/files/sageglass_datasheet_climaplus_42.1ec-12-4_classic_en.pdf (accessed on 6 April 2023).
- Satler PVC Profile. Available online: https://www.finestre-satler.it/Prodotti/Finestre/FINESTREINPVC/THERMIC/THERMIC.aspx (accessed on 6 April 2023).
- Stiferite On-Line Heat Transfer Calculation. Available online: http://trasmittanza.stiferite.com/resistenza_termica.html (accessed on 6 April 2023).
- Rockwool Roll Cod. 129. Available online: https://www.rockwool.com/uk/ (accessed on 6 April 2023).
- Isolpack Wall Star. Available online: http://www.isolpack.com/EN/product-details/26/star (accessed on 6 April 2023).
- UNI UNI 10351. Available online: https://store.uni.com/en/uni-10351-2021 (accessed on 6 April 2023).
- Rosato, A.; Sibilio, S.; Ciampi, G.; Entchev, E.; Ribberink, H. Energy, Environmental and Economic Effects of Electric Vehicle Charging on the Performance of a Residential Building-Integrated Micro-Trigeneration System. Energy Procedia 2017, 111, 699–709. [Google Scholar] [CrossRef]
- Trimble SketchUp Pro. Available online: https://www.sketchup.com/products/sketchup-pro (accessed on 6 April 2023).
- Rosato, A.; Ciervo, A.; Ciampi, G.; Scorpio, M.; Guarino, F.; Sibilio, S. Impact of Solar Field Design and Back-up Technology on Dynamic Performance of a Solar Hybrid Heating Network Integrated with a Seasonal Borehole Thermal Energy Storage Serving a Small-Scale Residential District Including Plug-in Electric Vehicles. Renew Energy 2020, 154, 684–703. [Google Scholar] [CrossRef]
- ASHRAE Load Calculation Applications Manual. Available online: https://www.ashrae.org/ (accessed on 6 April 2023).
- Lightnet Liquid Line-A3. Available online: https://www.lightnet-group.com/en/product/liquid-line-a3-i-system-60mm-surface-531/ (accessed on 6 April 2023).
- DIAL DIALux. Available online: https://www.dialux.com/en-GB/ (accessed on 6 April 2023).
- UNI UNI EN 12464-1. Available online: https://store.uni.com/en/uni-en-12464-1-2021 (accessed on 6 April 2023).
- Sarfraz, O.; Bach, C.K. Experimental Methodology and Results for Heat Gains from Various Office Equipment (ASHRAE RP-1742). Sci. Technol. Built. Environ. 2018, 24, 435–447. [Google Scholar] [CrossRef]
- Richardson, I.; Thomson, M. Domestic Electricity Demand Model—Simulation Example. Available online: https://dspace.lboro.ac.uk/dspace-jspui/handle/2134/5786%0A (accessed on 6 April 2023).
- Ruellan, M.; Park, H.; Bennacer, R. Residential Building Energy Demand and Thermal Comfort: Thermal Dynamics of Electrical Appliances and Their Impact. Energy Build. 2016, 130, 46–54. [Google Scholar] [CrossRef]
- Dyson Electric Hand Dryer Airblade. Available online: https://www.dyson.it/commerciale/asciugamani/airblade-9kj (accessed on 6 April 2023).
- EnergyPlus Weather Data. Available online: https://energyplus.net/weather-region/europe_wmo_region_6 (accessed on 6 April 2023).
- Climate Analytics EnergyPlus Weather File (EPW) Format. Available online: https://designbuilder.co.uk/cahelp/Content/EnergyPlusWeatherFileFormat.htm (accessed on 31 May 2023).
- Ebrahimpour, A. New Software for Generation of Typical Meteorological Year. In Proceedings of the World Renewable Energy Congress, Linköping, Sweden, 8–13 May 2011; Volume 57, pp. 2049–2055. [Google Scholar] [CrossRef]
- DAIKIN Bluevolution Catalogue. Available online: https://www.daikin.it/it_it/cataloghi-e-app/cataloghi-climatizzazione.html (accessed on 6 April 2023).
- Isaia, F.; Fiorentini, M.; Serra, V.; Capozzoli, A. Enhancing Energy Efficiency and Comfort in Buildings through Model Predictive Control for Dynamic Façades with Electrochromic Glazing. J. Build. Eng. 2021, 43, 102535. [Google Scholar] [CrossRef]
- Tavares, P.; Bernardo, H.; Gaspar, A.; Martins, A. Control Criteria of Electrochromic Glasses for Energy Savings in Mediterranean Buildings Refurbishment. Solar Energy 2016, 134, 236–250. [Google Scholar] [CrossRef]
- Tavares, P.F.; Gaspar, A.R.; Martins, A.G.; Frontini, F. Evaluation of Electrochromic Windows Impact in the Energy Performance of Buildings in Mediterranean Climates. Energy Policy 2014, 67, 68–81. [Google Scholar] [CrossRef]
- Scorpio, M.; Ciampi, G.; Rosato, A.; Maffei, L.; Masullo, M.; Almeida, M.; Sibilio, S. Electric-Driven Windows for Historical Buildings Retrofit: Energy and Visual Sensitivity Analysis for Different Control Logics. J. Build. Eng. 2020, 31, 101398. [Google Scholar] [CrossRef]
- Ritter, V.; Matschi, C.; Schwarz, D. Assessment of Five Control Strategies of an Adjustable Glazing at Three Different Climate Zones. J. Facade Des. Eng. 2015, 3, 129–141. [Google Scholar] [CrossRef]
- Trienergia PV Modules. Available online: https://www.trienergia.com/en/ (accessed on 6 April 2023).
- TESLA Powerwall Battery. Available online: https://www.tesla.com/powerwall?redirect=no (accessed on 6 April 2023).
- De Soto, W.; Klein, S.A.; Beckman, W.A. Improvement and Validation of a Model for Photovoltaic Array Performance. Solar Energy 2006, 80, 78–88. [Google Scholar] [CrossRef]
- ETNEO DS300 Wind Turbine. Available online: https://etneo.com/wind-turbine-ds300/?lang=en (accessed on 6 April 2023).
- ETNEO DS700 Wind Turbine. Available online: https://etneo.com/wind-turbine-ds700/?lang=en (accessed on 6 April 2023).
- Ceglia, F.; Marrasso, E.; Roselli, C.; Sasso, M. Time-Evolution and Forecasting of Environmental and Energy Performance of Electricity Production System at National and at Bidding Zone Level. Energy Convers. Manag. 2022, 265, 115772. [Google Scholar] [CrossRef]
- Chicco, G.; Mancarella, P. Assessment of the Greenhouse Gas Emissions from Cogeneration and Trigeneration Systems. Part I: Models and Indicators. Energy 2008, 33, 410–417. [Google Scholar] [CrossRef]
- GME Gestore Mercati Energetici. Available online: https://www.mercatoelettrico.org/it/Statistiche/ME/PrezzoMedioFasce.aspx (accessed on 6 April 2023).
- ARERA Italian Regulatory Authority for Energy, Networks and Environment. Available online: https://www.arera.it/it/docs/21/623-21.htm (accessed on 31 May 2023).
- Formica, T.; Pecht, M. Return on Investment Analysis and Simulation of a 9.12 KW (KW) Solar Photovoltaic System. Solar Energy 2017, 144, 629–634. [Google Scholar] [CrossRef]
- INVITALIA Italian Development Agency. Available online: https://www.invitalia.it/eng (accessed on 31 May 2023).
- Paiano, A.; Lagioia, G.; Ingrao, C. A Combined Assessment of the Energy, Economic and Environmental Performance of a Photovoltaic System in the Italian Context. Sci. Total Environ. 2023, 866, 161329. [Google Scholar] [CrossRef]
- Lantonio, N.A.; Krarti, M. Simultaneous Design and Control Optimization of Smart Glazed Windows. Appl. Energy 2022, 328, 120239. [Google Scholar] [CrossRef]
- McKenna, R.; Fehrenbach, D.; Merkel, E. The Role of Seasonal Thermal Energy Storage in Increasing Renewable Heating Shares: A Techno-Economic Analysis for a Typical Residential District. Energy Build. 2019, 187, 38–49. [Google Scholar] [CrossRef]
- Ettimpianti srl TESLA Powerwall 2. Available online: https://www.ettimpiantisrl.com/prodotto/tesla-powerwall-2-ac-135kwh-con-staffa-a-muro/ (accessed on 31 May 2023).
- ETNEO DS300 Wind Turbine Cost. Available online: https://etneo.com/prodotto/eolico-verticale-ibrido-300w/ (accessed on 31 May 2023).
- ETNEO DS700 Wind Turbine Cost. Available online: https://etneo.com/prodotto/eolico-verticale-ibrido-700w/ (accessed on 31 May 2023).
- Invitalia Cultura Crea 2.0. Available online: https://www.invitalia.it/cosa-facciamo/creiamo-nuove-aziende/cultura-crea-2-0 (accessed on 31 May 2023).
- Rosato, A.; Ciervo, A.; Guarino, F.; Ciampi, G.; Scorpio, M.; Sibilio, S. Dynamic Simulation of a Solar Heating and Cooling System Including a Seasonal Storage Serving a Small Italian Residential District. Therm. Sci. 2020, 24, 3555–3568. [Google Scholar] [CrossRef]
- Tsuchiya, Y.; Swai, T.A.; Goto, F. Energy Payback Time Analysis and Return on Investment of Off-Grid Photovoltaic Systems in Rural Areas of Tanzania. Sustain. Energy Technol. Assess. 2020, 42, 100887. [Google Scholar] [CrossRef]
- Muhammad-Sukki, F.; Ramirez-Iniguez, R.; Abu-Bakar, S.H.; McMeekin, S.G.; Stewart, B.G. An Evaluation of the Installation of Solar Photovoltaic in Residential Houses in Malaysia: Past, Present, and Future. Energy Policy 2011, 39, 7975–7987. [Google Scholar] [CrossRef]
- Yang, D.; Latchman, H.; Tingling, D.; Amarsingh, A.A. Design and Return on Investment Analysis of Residential Solar Photovoltaic Systems. IEEE Potentials 2015, 34, 11–17. [Google Scholar] [CrossRef]


Disclaimer/Publisher’s Note: The statements, opinions and data contained in all publications are solely those of the individual author(s) and contributor(s) and not of MDPI and/or the editor(s). MDPI and/or the editor(s) disclaim responsibility for any injury to people or property resulting from any ideas, methods, instructions or products referred to in the content. |
© 2023 by the authors. Licensee MDPI, Basel, Switzerland. This article is an open access article distributed under the terms and conditions of the Creative Commons Attribution (CC BY) license (https://creativecommons.org/licenses/by/4.0/).