Article

Maize Seedling Leave Counting Based on Semi-Supervised Learning and UAV RGB Images

1
College of Information and Technology, Jilin Agricultural University, Changchun 130118, China
2
College of Land Science and Technology, China Agricultural University, Beijing 100193, China
*
Authors to whom correspondence should be addressed.
Sustainability 2023, 15(12), 9583; https://doi.org/10.3390/su15129583
Submission received: 22 May 2023 / Revised: 8 June 2023 / Accepted: 11 June 2023 / Published: 14 June 2023
(This article belongs to the Section Sustainable Agriculture)

Abstract

:
The number of leaves in maize seedlings is an essential indicator of their growth rate and status. However, manual counting of seedlings is inefficient and limits the scope of the investigation. Deep learning has shown potential for quickly identifying seedlings, but it requires larger, labeled datasets. To address these challenges, we proposed a method for counting maize leaves from seedlings in fields using a combination of semi-supervised learning, deep learning, and UAV digital imagery. Our approach leveraged semi-supervised learning and novel methods for detecting and counting maize seedling leaves accurately and efficiently. Specifically, we used a small amount of labeled data to train the SOLOv2 model based on the semi-supervised learning framework Noisy Student. This model can segment complete maize seedlings from UAV digital imagery and generate foreground images of maize seedlings with background removal. We then trained the YOLOv5x model based on Noisy Student with a small amount of labeled data to detect and count maize leaves. We divided our dataset of 1005 images into 904 training images and 101 testing images, and randomly divided the 904 training images into four sets of labeled and unlabeled data with proportions of 4:6, 3:7, 2:8, and 1:9, respectively. The results indicated that the SOLOv2 Resnet101 outperformed the SOLOv2 Resnet50 in terms of segmentation performance. Moreover, when the labeled proportion was 30%, the student model SOLOv2 achieved a similar segmentation performance to the fully supervised model with a mean average precision (mAP) of 93.6%. When the labeled proportion was 40%, the student model YOLOv5x demonstrated comparable leaf counting performance to the fully supervised model. The model achieved an average precision of 89.6% and 57.4% for fully unfolded leaves and newly appearing leaves, respectively, with counting accuracy rates of 69.4% and 72.9%. These results demonstrated that our proposed method based on semi-supervised learning and UAV imagery can advance research on crop leaf counting in fields and reduce the workload of data annotation.

1. Introduction

Maize (Zea mays L.) is one of the most important food crops globally, widely grown and consumed. Improving its yield and quality has been a research hotspot in the field of agriculture [1,2]. The number of leaves on maize plants is a crucial indicator of their growth status during the growing season. Counting the number of leaves in maize seedlings can offer valuable insights into their growth rate, photosynthetic intensity, and nutrient metabolism. This information is essential for evaluating seed viability and predicting later yields. However, current methods for counting maize seedling leaves in field environments rely mainly on manual techniques, which suffer from issues such as subjective judgment, low efficiency, and weak representativeness. Therefore, automated methods for counting maize seedling leaves in the field are needed to address these problems. With the development of information technology, automated computer vision technology is widely applied in plant phenotype research [3]. However, traditional machine learning methods rely heavily on manual feature extraction and hyperparameter tuning, which can result in weak model generalization. Therefore, it is crucial to study efficient and accurate methods for obtaining the number of maize seedling leaves in complex field environments.
Unmanned aerial vehicle (UAV) remote sensing images offer a rapid and efficient means of obtaining large amounts of plant image data, providing new opportunities for monitoring agricultural production [4]. In recent years, researchers have utilized UAVs equipped with sensors to collect and monitor plant phenotype information, such as plant height [5,6,7], canopy structure [8,9,10], leaf area [11,12], etc., to further monitor plant growth and predict yields. Shu et al. [13] utilized a UAV equipped with a hyperspectral imager to obtain hyperspectral images of maize inbred lines in the field. Wang et al. [14] used a UAV equipped with multiple sensors, including RGB cameras, multi-spectral, thermal infrared, hyperspectral, and light detection and ranging (LiDAR), to collect multimodal data on sugar beet canopy characteristics. The application of UAVs equipped with multiple sensors, such as multi-spectral, hyperspectral, thermal infrared, and LiDAR, can improve the efficiency and accuracy of plant phenotype research. However, the high costs and complexity of operating such UAVs may limit their application [4,15,16,17]. On the other hand, digital cameras are cost-effective, easy to operate, and provide high-quality images, making them widely used as sensors in plant phenotype analysis [18]. They are also widely used in plant phenotype analysis research as sensors. Syazwani et al. [19] demonstrated the effectiveness of a UAV equipped with a digital camera in detecting and counting pineapple crowns with a high accuracy of 94.4%. The use of UAVs carrying digital cameras on a low-altitude remote sensing platform is a promising approach to efficiently obtaining field images of maize seedlings, providing essential data for maize leaf counting.
The field of plant phenotyping has been revolutionized by the rapid development of deep learning techniques, which offer powerful tools for processing and extracting rich information from plant phenotype data, including image segmentation [20,21,22] and object detection [23,24,25]. Barreto et al. [26] demonstrated the fully automatic counting of sugar beets, maize, and strawberry plants in the field using fully convolutional networks (FCN). Yu et al. [27] employed a U-Net network with Vgg16 as the backbone to segment maize tassels. Although semantic segmentation models such as FCN and U-Net can achieve pixel-level classification, it is still challenging to distinguish individuals within the same category. The utilization of Mask R-CNN and SOLOv2 models in plant phenotyping studies enables the segmentation of individual instances within specific categories through semantic segmentation, providing support for individual object detection [28,29,30]. Gao et al. [31] enhanced Mask R-CNN to detect and segment maize seedlings and extracted information, including emergence rate and coverage rate, based on the obtained segmentation results. Sun et al. [32] employed RGB-D sensors and the SOLOv2 network to estimate the trunk diameter of grafted apple trees and detect their developmental status. The one-stage model SOLOv2 has a lower parameter and computational complexity compared to Mask R-CNN, making it more efficient in handling images with a large number of object instances.
Leaves are commonly monitored in the crop growth process [33]. Tu et al. [34] improved the You Only Look Once (YOLO)v3 network to detect cauliflower and Arabidopsis leaves more accurately. Lu et al. [35] applied the improved CenterNet network to detect the leaves of eggplants, tomatoes, purslane, and orchids in greenhouses. Li et al. [36] used the improved YOLOv5 to detect sweet potato leaves in the field. Liu et al. proposed a soybean phenotype perception method based on the improved YOLOv5 to detect and count soybean plant leaves and flowers. Compared with other models, the YOLOv5 network model has the advantages of high detection accuracy and fast inference speed [37,38].
The continuous advancements in deep learning have led to high accuracy and interpretability of algorithms. However, the process of training models requires a significant amount of labeled data, which is both time-consuming and expensive. To address this issue, semi-supervised learning methods have emerged in recent years that utilize a small set of labeled data and a large amount of unlabeled data to train network models, leading to improved model performance [39]. By integrating deep learning techniques with semi-supervised learning methods, scholars have been able to study crop phenotypes in an efficient and cost-effective manner. For instance, Najafian et al. [40] combined the semi-supervised learning framework with the YOLOv5 network to detect and count wheat spikes. Khan et al. [41] introduced a semi-supervised generative adversarial network that was optimized to classify weeds in seedling crops. The authors achieved a classification accuracy of 90% for pea and strawberry crops, even when only 20% of the training data was labeled. Nong et al. [42] proposed a weed and crop segmentation method named SemiWeedNet, which utilized semi-supervised learning techniques. The findings demonstrated that good segmentation performance could be obtained by training the model with only 20% of labeled images. Due to the large-scale and complex nature of plant phenotype data, utilizing semi-supervised learning methods can significantly decrease the expenses associated with labeling, increase the efficiency of plant phenotype research, and ensure the promptness of agricultural information.
Due to the complexities of field environments, it is challenging to apply object detection models directly to obtain crop leaf counts. Therefore, in this study, we proposed dividing maize seedling leaf counting into two stages: maize seedling segmentation and maize leaf counting, which was more reliable. We combined semi-supervised learning with deep learning methods to achieve these tasks and to accomplish maize seedling leaf counting with a small amount of labeled data. The main contributions of this study are as follows: (1) We proposed a two-stage maize leaf counting method based on semi-supervised learning and UAV digital images. (2) We utilized the semi-supervised learning method Noisy Student to train the Segmenting Objects by Locations (SOLO) v2 model with a small amount of labeled data, which segmented complete maize seedlings from the field background. (3) We used the Noisy Student method to train the YOLOv5x model with a small amount of labeled data to detect and count maize leaves.

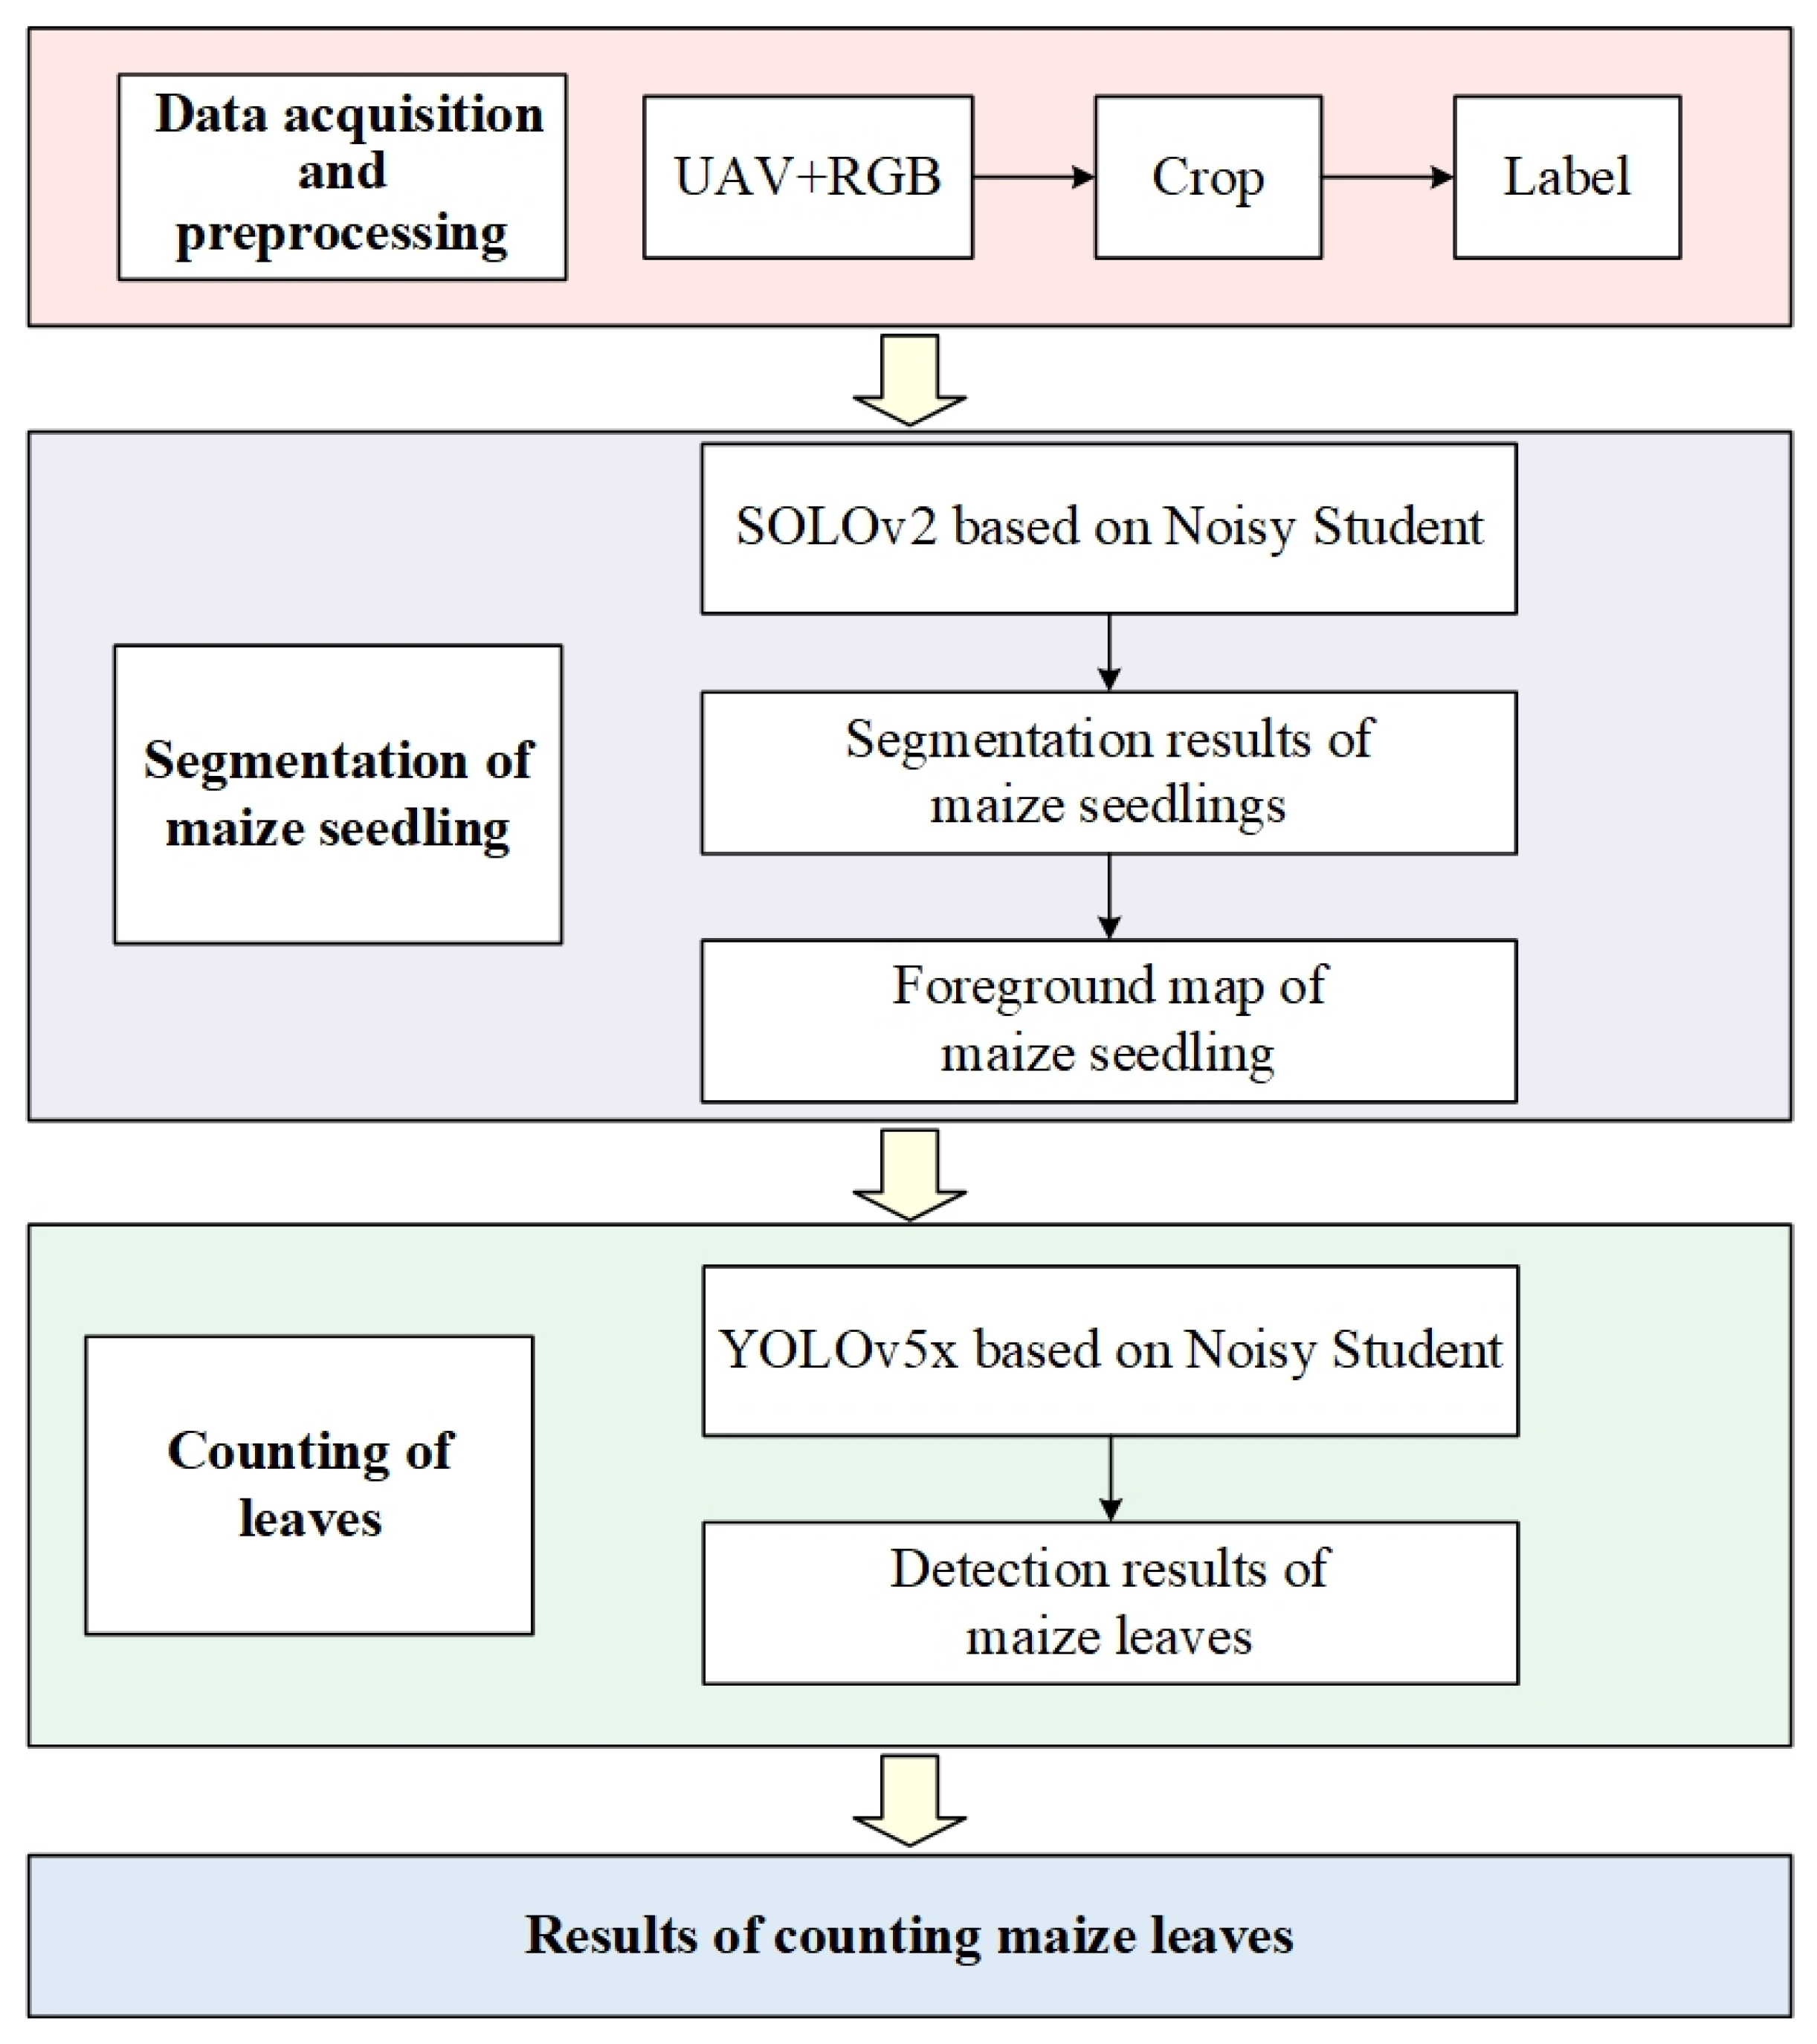
2. Materials and Methods

2.1. Image Acquisition and Preprocessing

The field experiments were conducted in June 2020 and 2021 at the Farmland Irrigation Research Institute of the Chinese Academy of Agricultural Sciences, Xinxiang County, Henan Province, China (35°08′02.82″ N, 113°45′51.60″ E). The collection equipment was a DJI Phantom 4 Pro V2.0 with a 1-inch, 20-megapixel CMOS sensor. The flight altitude was set to 5 m, and the obtained image resolution was 5472 × 3648. 1005 maize seedling images with a resolution of 640 × 640 were cropped from the original images. The labeled dataset was created using Labelme 4.6.0 for annotating the boundary points of complete maize seedlings and generating JSON files. For the segmented maize seedling leaves, Labelimg 1.8.6 was used to annotate them, generating XML files. The dataset consisted of 101 test images and 904 training images. During the experiment, the 904 training images were randomly divided into four sets of labeled and unlabeled datasets with ratios of 4:6, 3:7, 2:8, and 1:9. Prior to training the semi-supervised learning teacher or student models, the images were augmented using various operations such as contrast enhancement, rotation, flipping, scaling, Gaussian noise, and Gaussian blur for the maize seedling segmentation dataset. For the leaf counting dataset, operations such as color transformation, translation, scaling, flipping, and mosaic enhancement were performed. The distributions of the two-stage datasets are shown in Table 1, where the teacher model represents the number of datasets trained with labeled data initially and the student model represents the data augmentation results fused with labeled and unlabeled data.

2.2. Overall Design of Leaf Counting

This study utilized a combination of semi-supervised learning and deep learning methods for maize seedling and leaf detection, as illustrated in Figure 1. The process involved two stages. Firstly, field maize seedling images were captured using a digital camera mounted on a UAV and preprocessed. The SOLOv2 network based on Noisy Student was then used in the first stage to segment maize seedlings. After predicting the maize seedling mask, the foreground image of maize seedlings was obtained through a bitwise operation (&) with the original image. In the second stage, the YOLOv5x model based on Noisy Student was employed to detect leaves and achieve maize seedling leaf counting.

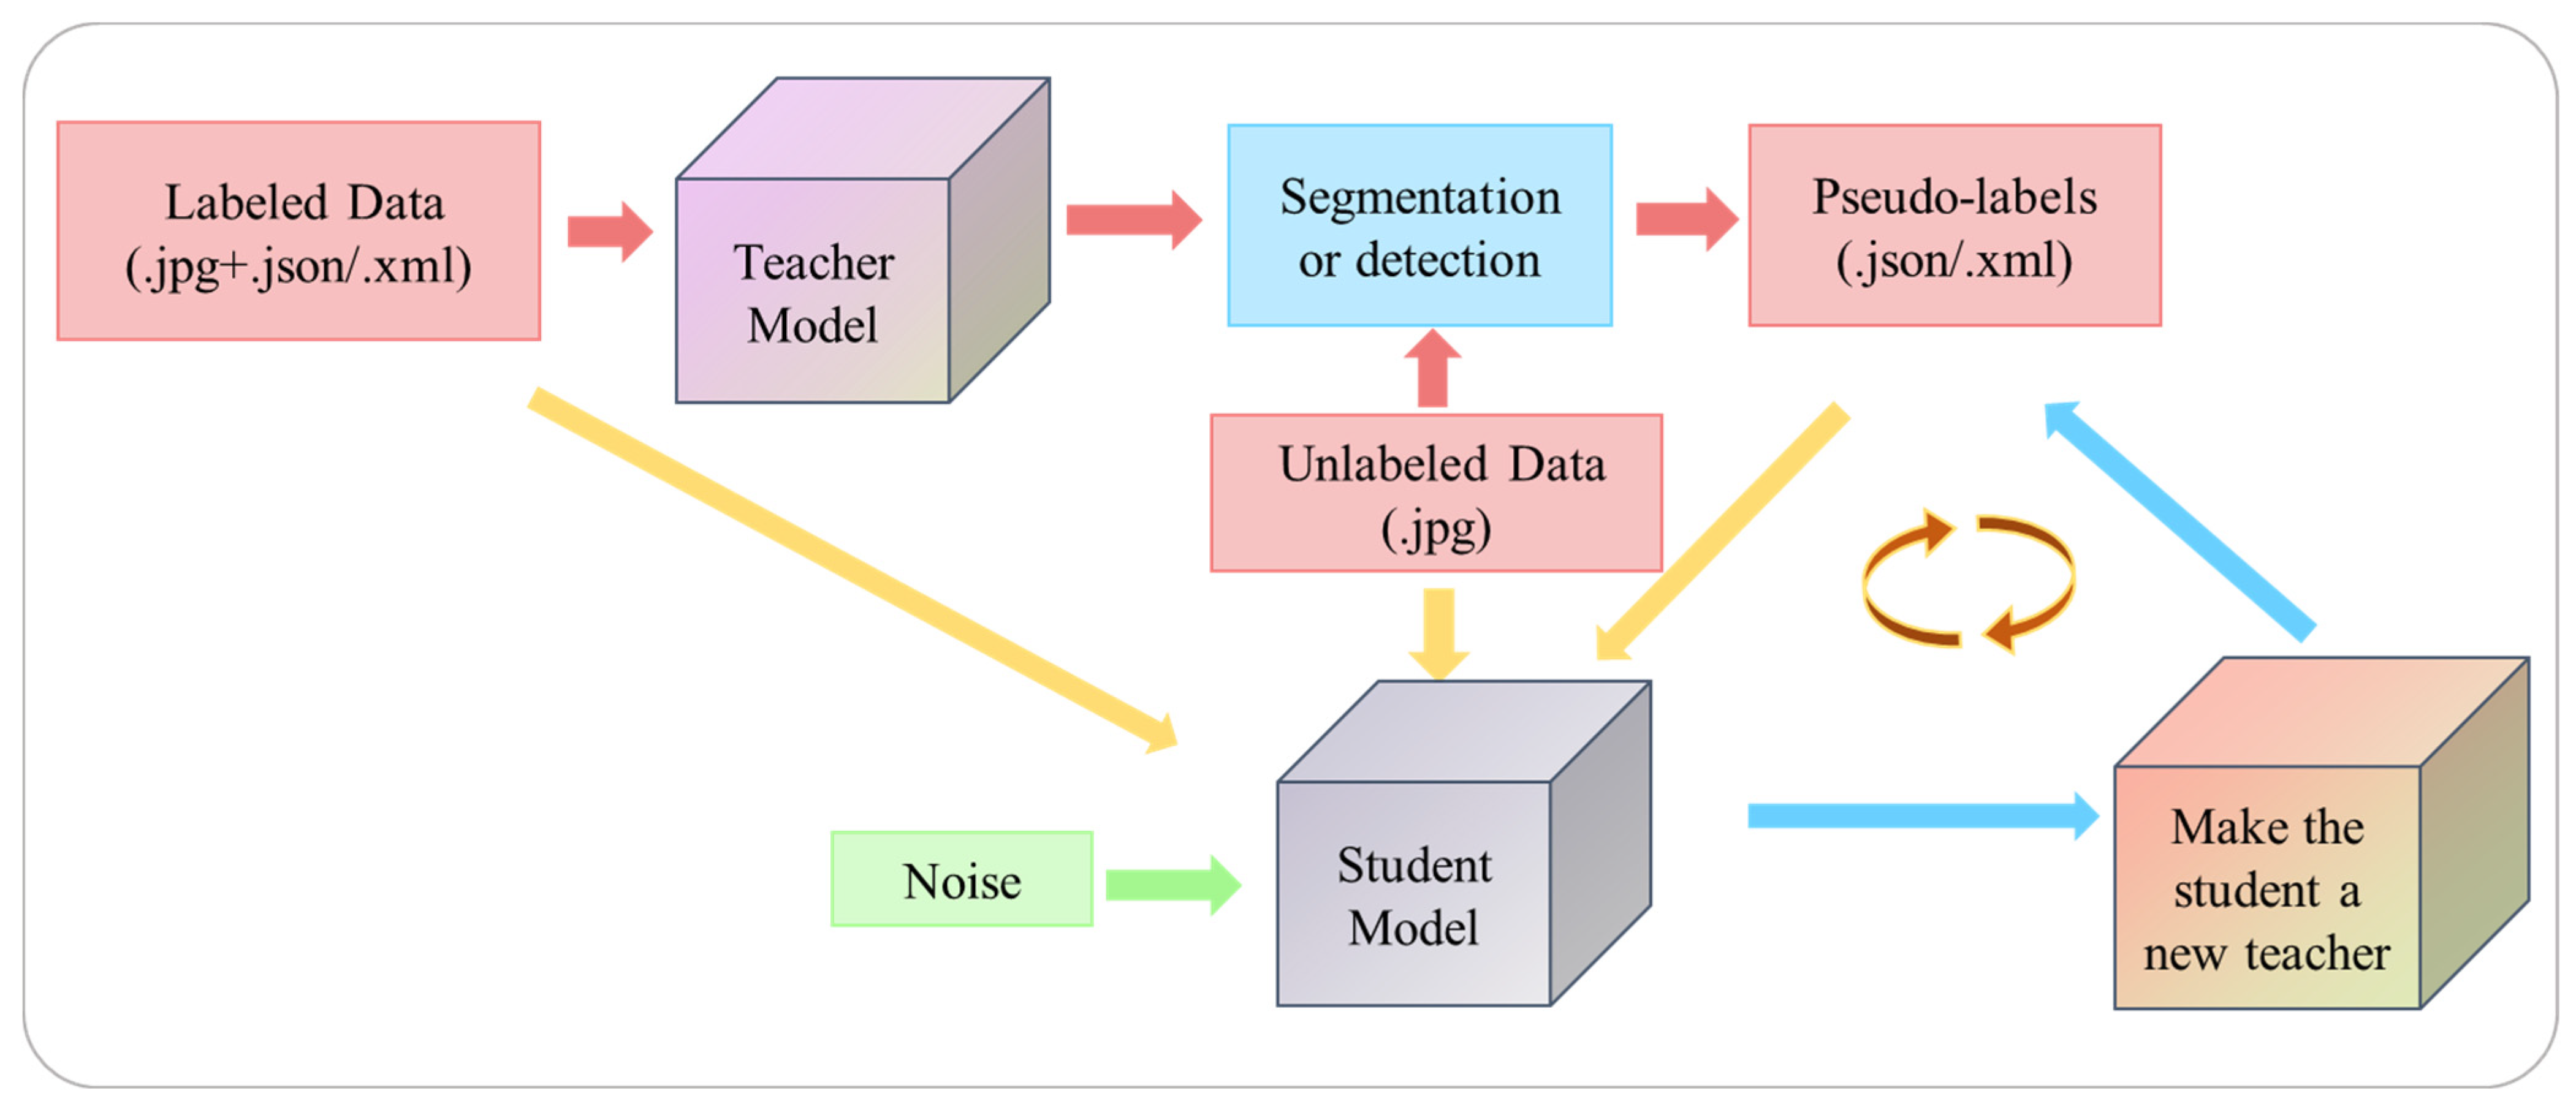
2.3. Semi-Supervised Learning Framework: Noisy Student

In this study, we utilized the Noisy Student semi-supervised learning framework [43] to perform maize seedling segmentation and leaf counting. This approach reduced the dependence of the SOLOv2 and YOLOv5x models on labeled data and enhanced their robustness by leveraging unlabeled data. The overall structure of the Noisy Student framework is depicted in Figure 2, and the training process consists of the following steps:
(1)
Using a small number of labeled images to initialize the teacher models (SOLOv2 and YOLOv5x) training;
(2)
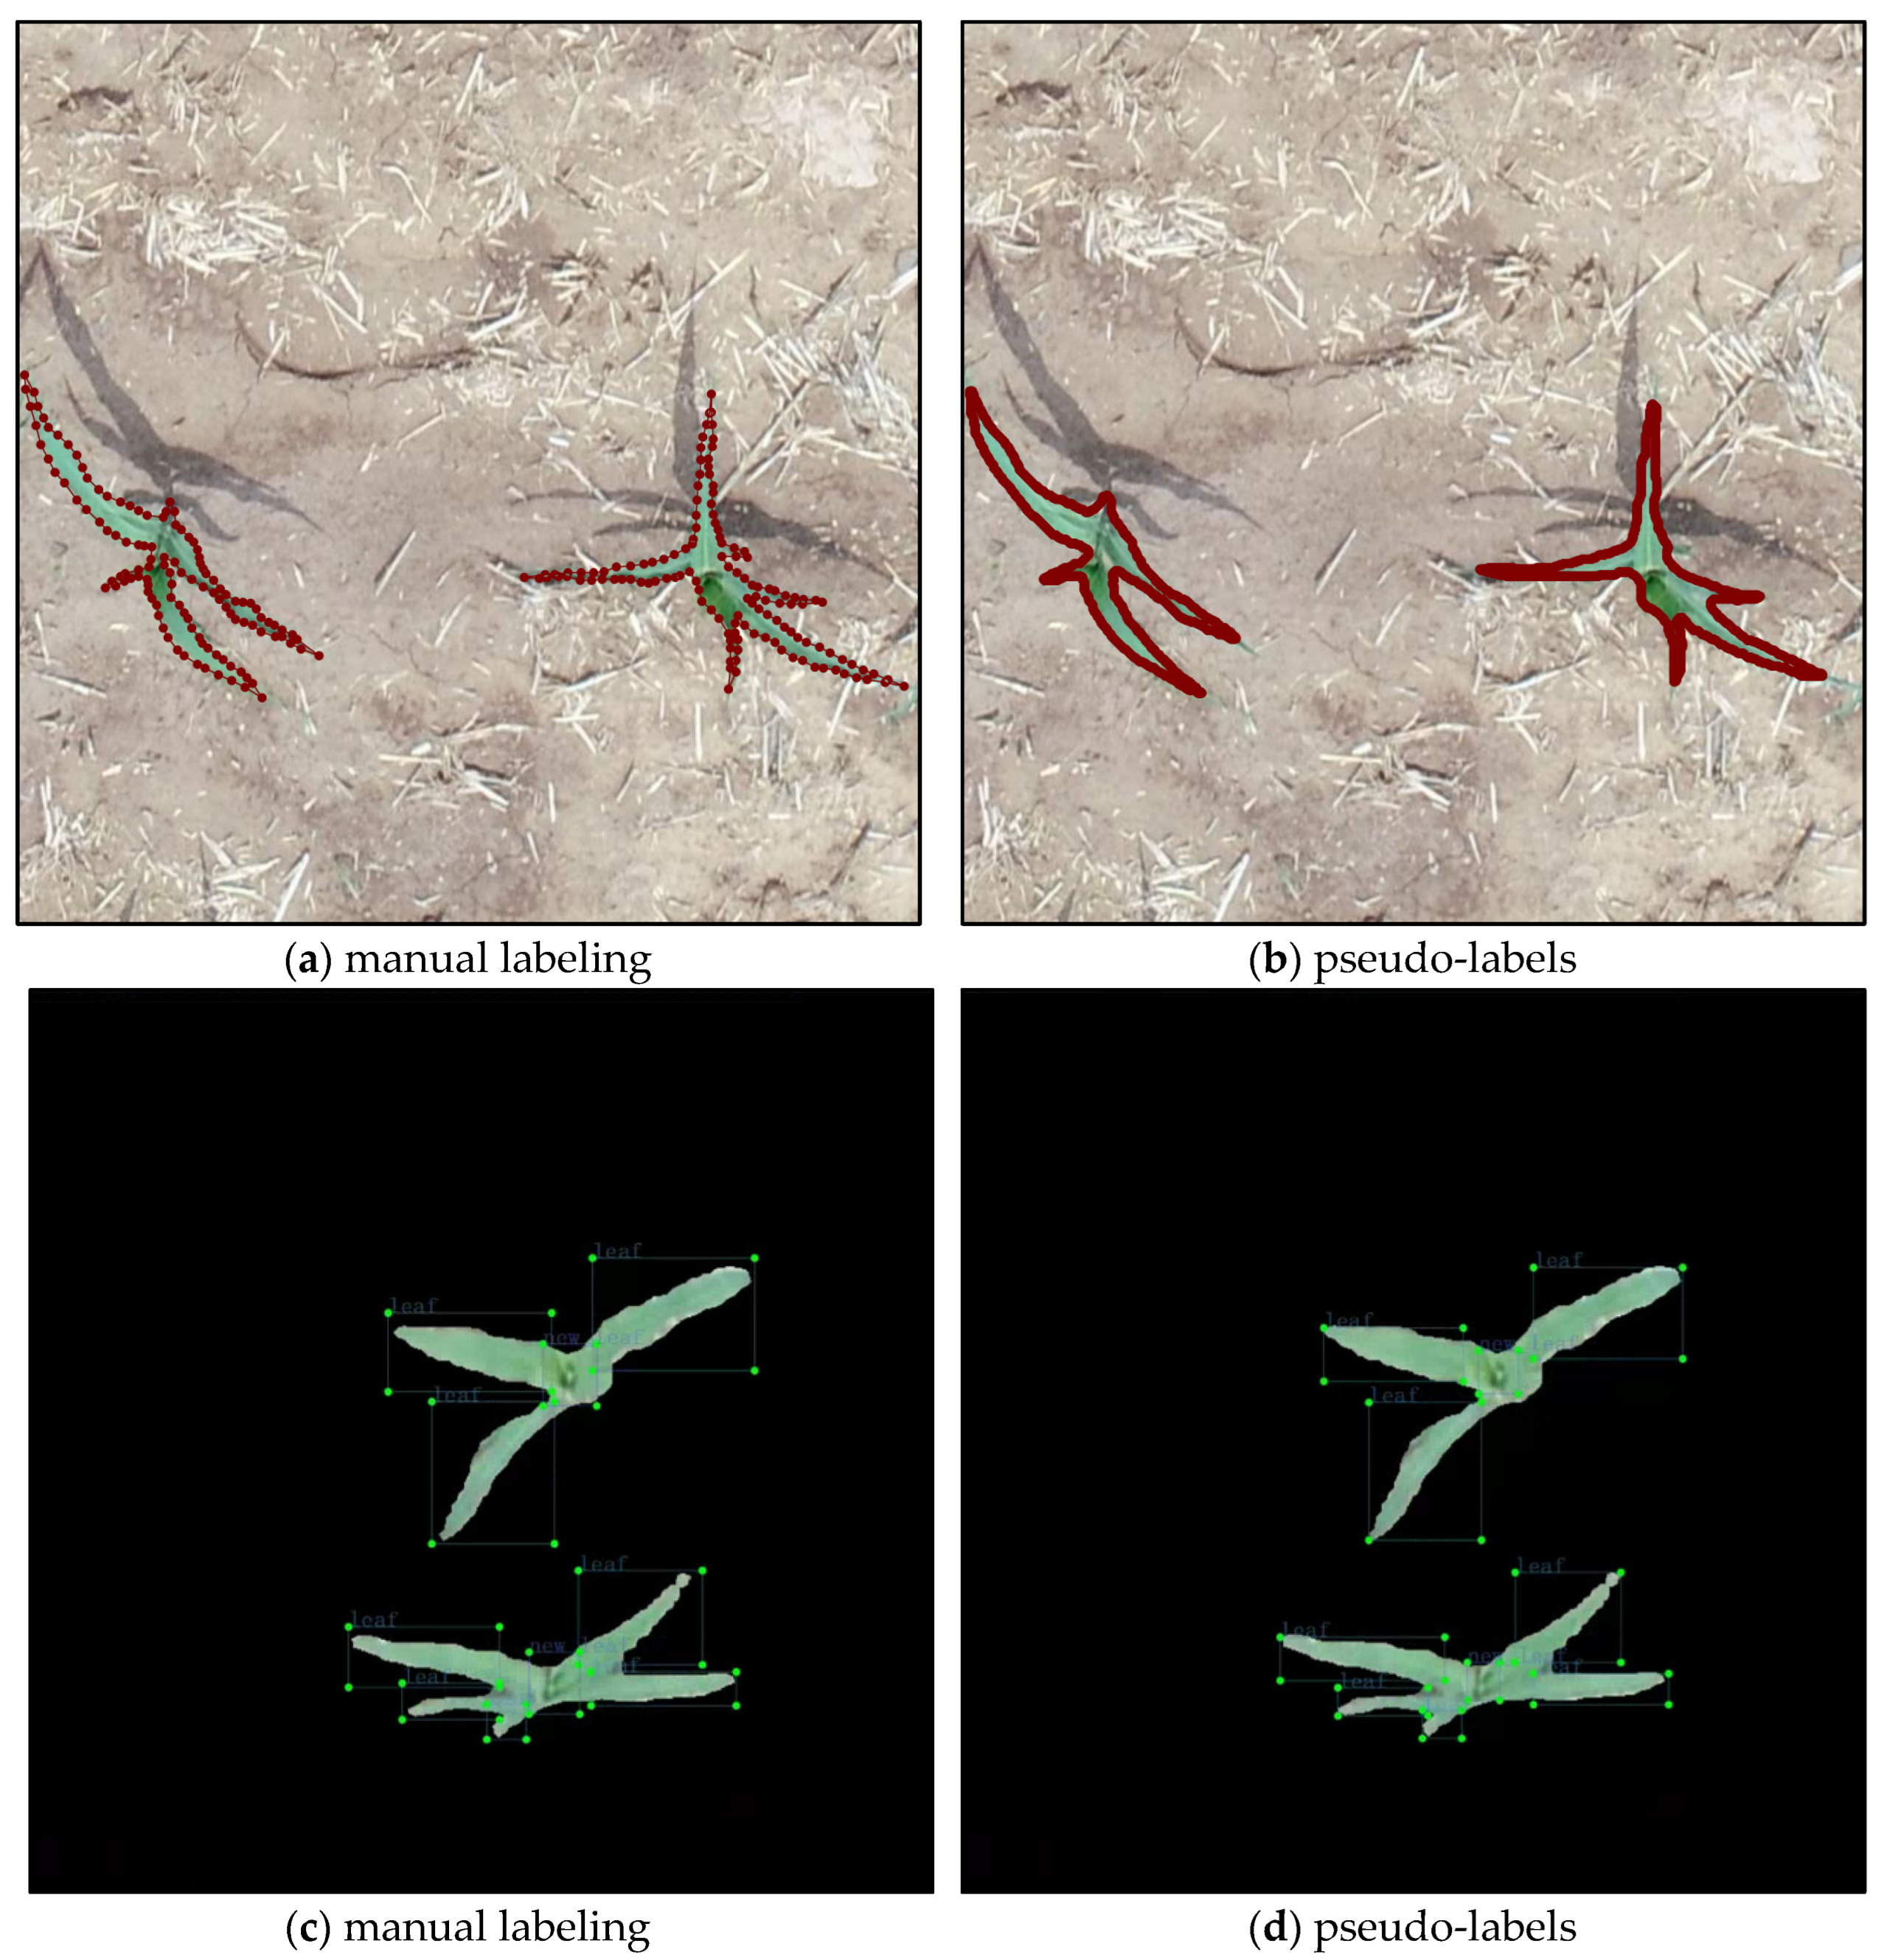
Predicting the unlabeled data using the trained teacher models, filtering out masks and bounding boxes with confidence less than 0.35 from the unlabeled data, and creating pseudo-labels based on the model’s predicted mask or bounding box. The file format for the maize seedling segmentation dataset was .json, and the file format for the leaf detection dataset was .xml;
(3)
Training the student model (SOLOv2 and YOLOv5x) by merging labeled and pseudo-labeled data. The test images were used to obtain predicted values from the student model. To improve the model’s generalization, input noise and model noise (Noise) were added to the training process. Input noise refers to data augmentation, and model noise refers to the stochastic gradient descent optimizer (SGD);
(4)
The student model became the new teacher model, and pseudo-labels are predicted again to train teacher models;
(5)
Repeat steps (2)–(4) for a total of three cycles.
Figure 3 depicts the pseudo-labels produced by the maize segmentation and leaf counting models at a labeled data ratio of 40%. Specifically, Figure 3a,c exhibit the manually annotated images, while Figure 3b,d present the pseudo-labels generated by the models. Notably, the pseudo-labels obtained via image segmentation exhibit smoother contours than the manually labeled ones, whereas the pseudo-labels produced by the leaf counting model display a high level of similarity to the manually labeled annotations.

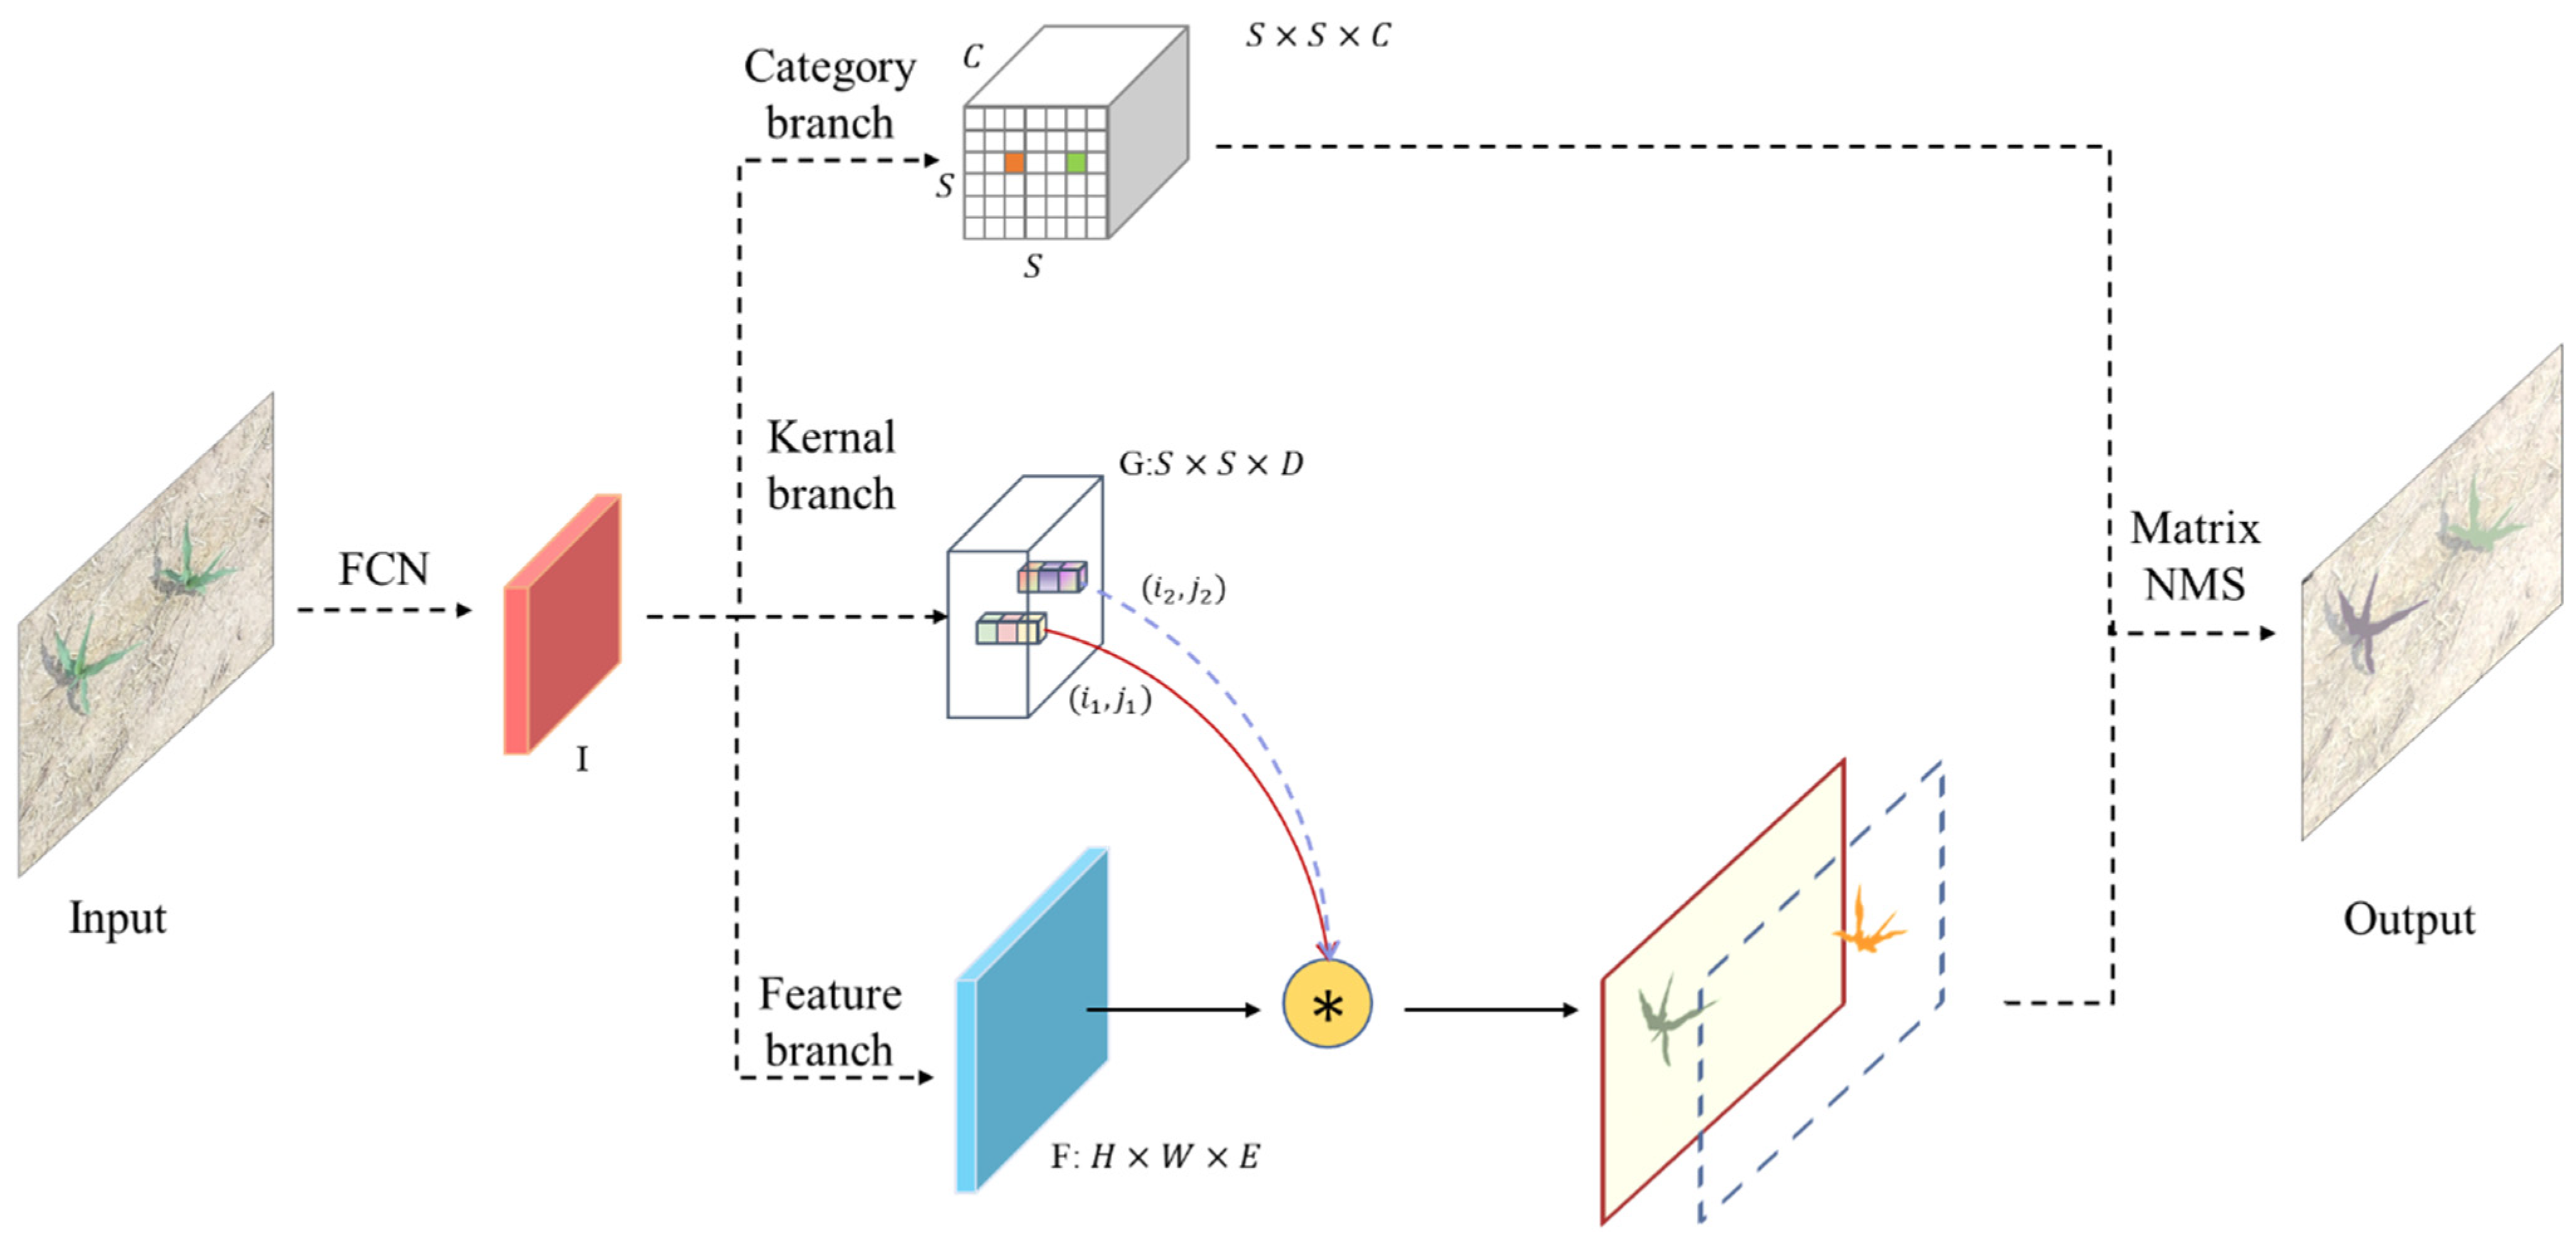
2.4. SOLOv2 of Segment Maize Seedlings

The SOLOv2 network was utilized here for maize seedling segmentation due to its fast training speed and strong generalization ability. In contrast to anchor-based detection methods, SOLOv2 can efficiently segment each instance in an image. The network architecture of SOLOv2, depicted in Figure 4, comprises a fully convolutional network (FCN), a category branch, a kernel branch, and a feature branch. Upon input of a maize seedling image, the FCN extracts the maize seedling features to generate feature maps I. The category branch predicts the semantic category of each grid in feature map I. The kernel branch predicts the weights of the convolution kernel. The dynamic convolution learned by the feature branch and kernel branch is used to perform convolution operations on the feature maps to predict the maize seedling mask. Finally, matrix non-maximum suppression (NMS) is employed to eliminate redundant instances by performing threshold filtering based on a confidence score of 0.5, keeping the most accurate predicted masks, and reducing the network’s inference time.
The total loss function of the SOLOv2 network consists of the semantic category loss L C and the mask prediction loss L M . The formula is as follows:
L S O L O v 2 = L C + λ L M
where L S O L O v 2 is the total loss value of the SOLOv2 network and λ is the hyperparameter.

2.5. YOLOv5x of Count Maize Leaves

The YOLOv5 model is known for its fast training speed, high detection accuracy, and relatively small size, making it an ideal choice for this study’s maize leaf detection model. The YOLOv5x, which has the largest number of parameters, was selected for training. The YOLOv5x network is comprised of four parts: the input layer (Input), the backbone network (Backbone), the neck network (Neck), and the prediction network (Prediction), as depicted in Figure 5. The input layer includes mosaic augmentation and image size processing, while the backbone network is composed of Conv modules, C3 modules, and SPPF modules. The neck network uses a feature pyramid network (FPN) structure to fuse top-level and bottom-level features, which improves the network’s ability to detect objects of different scales. Finally, the prediction network generates three different-sized feature maps and draws candidate boxes, object classifications, and bounding box regression information on these feature maps, with feature map sizes of 80 × 80 × 21, 40 × 40 × 21, and 20 × 20 × 21.

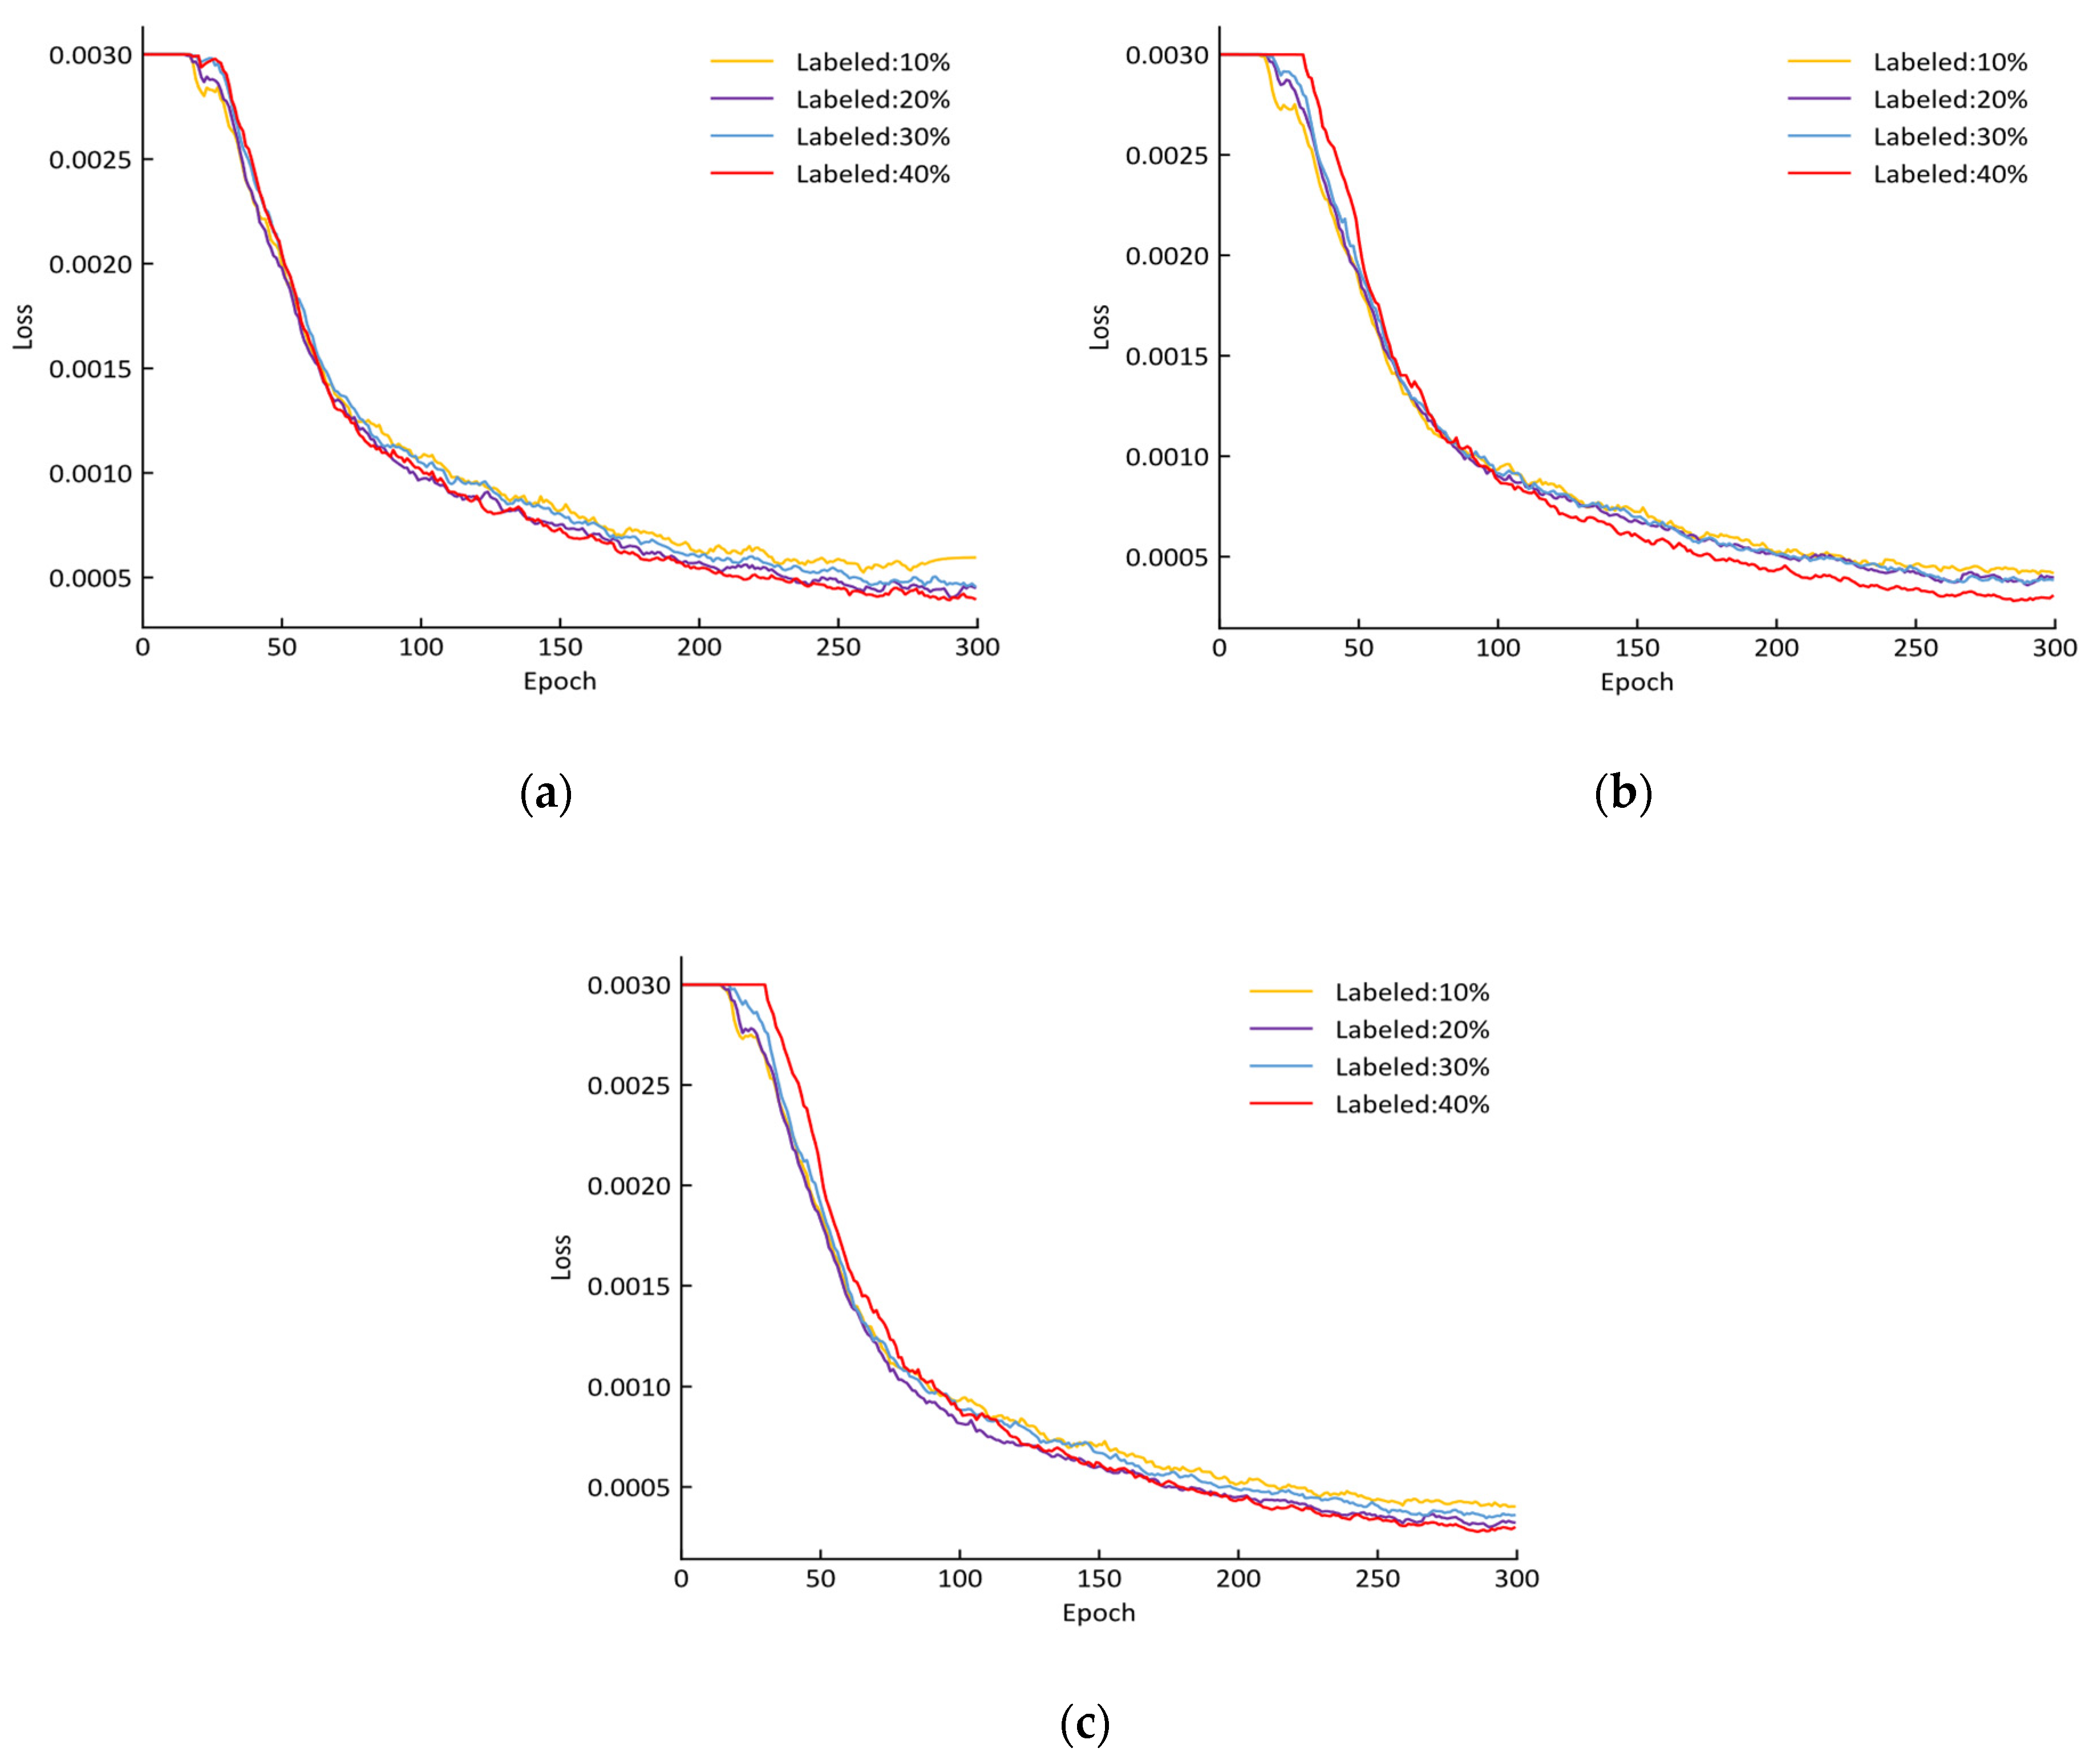
2.6. Parameter Setting for Training

The experimental platform was equipped with an Intel (R) Xeon (R) Gold 6246R CPU with a clock speed of 3.4 GHz, 128 GB of memory, and an NVIDIA Quadro RTX 8000 GPU with 48 GB of video memory. The operating system was Windows 10, and the programming language used was Python 3.7. SOLOv2 was trained using Pytorch 1.8.1, OpenCV 4.6.0, and Detectron 2.0.6, while YOLOv5x was trained using Pytorch 1.7.1 and OpenCV 4.5.5. The training parameters for the SOLOv2 and YOLOv5x models are shown in Table 2.

2.7. Evaluation Metrics

The performance of YOLOv5x was evaluated using precision (P), recall (R), average precision (AP), and mean average precision (mAP), as described by Equations (2)–(5). The AP value was computed as the area under the precision-recall curve, while the mAP was calculated as the average AP value across all categories, with higher values indicating better model performance. The segmentation performance of the SOLOv2 model was assessed by selecting the mean average precision (mAP) at different intersection over union (IoU) thresholds (0.5, 0.75, and 0.5:0.95), as shown in Equations (5) and (6).
P = T P T P + F P
R = T P T P + F N
A P = 0 1 P R d r
m A P = i = 1 N A P i N
I o U = A r e a   o f   O v e r l a p A r e a   o f   U n i o n
where T P is true positive; F P is false positive; F N is false negative; N is the number of categories of maize seedlings and leaves; A P i represents the average precision value of the i classifications of leaves and maize seedings.

3. Results

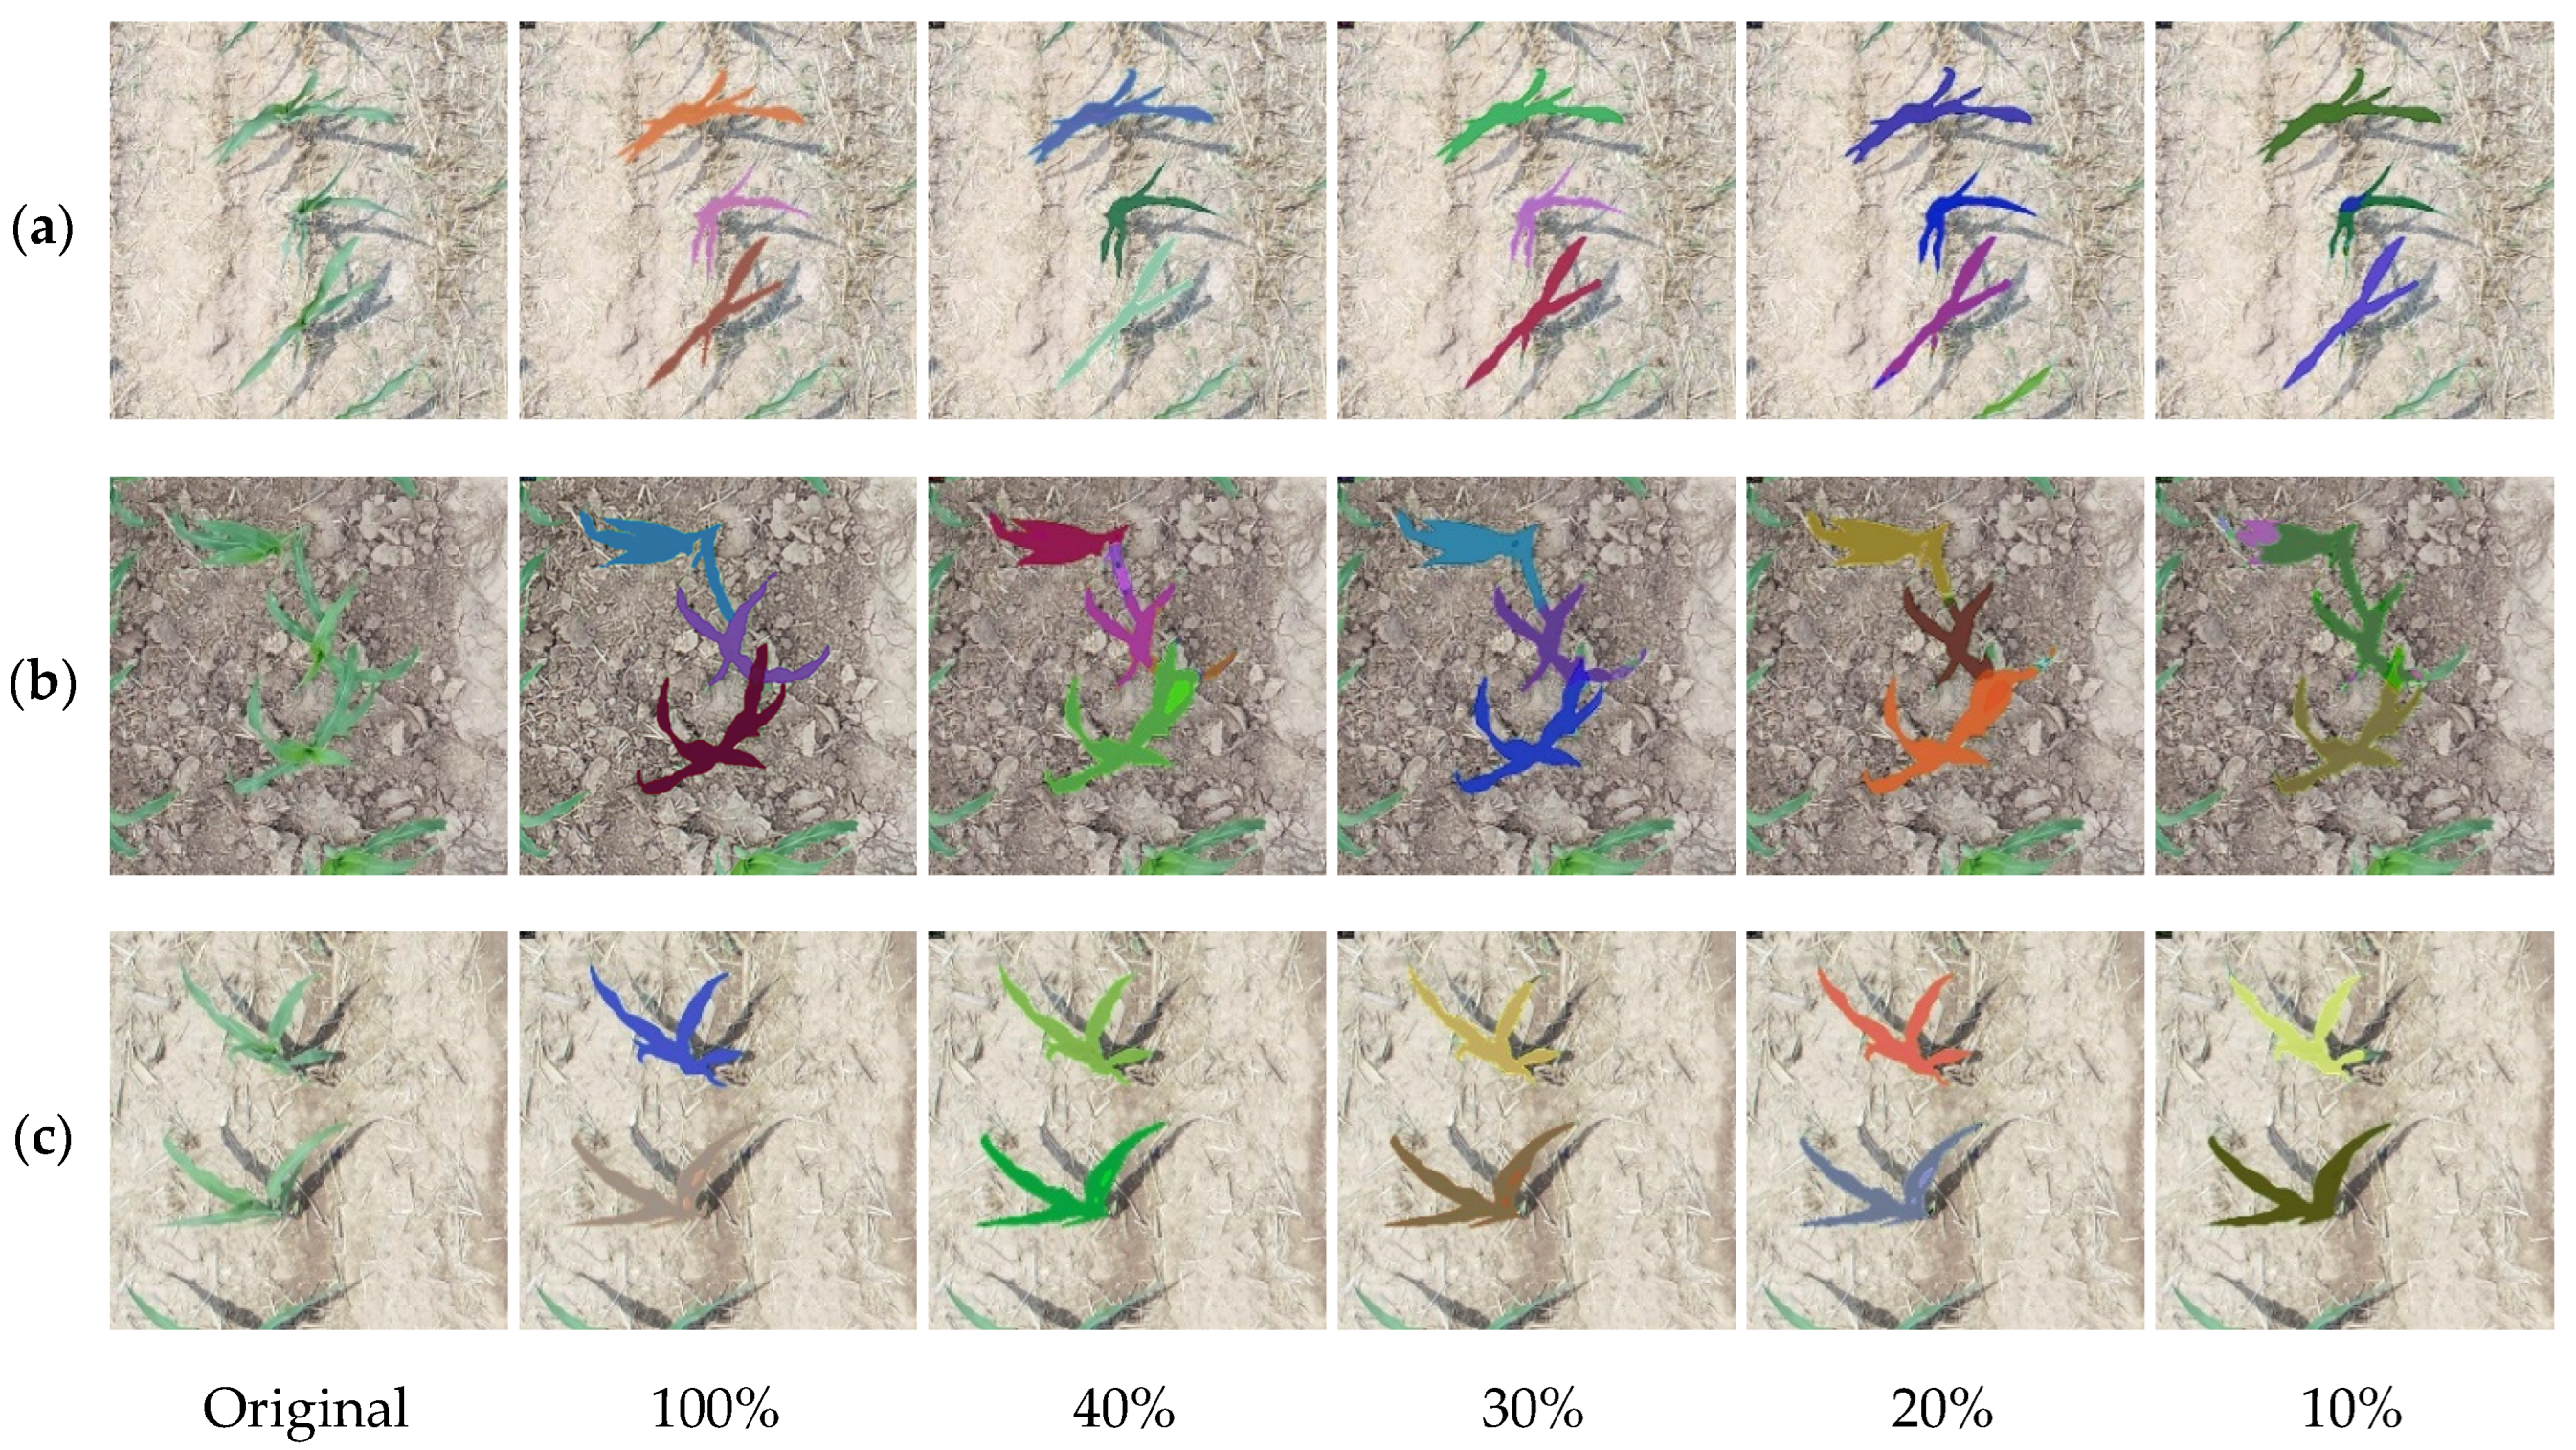
3.1. Maize Seedling Segmentation Results

Table 3 presents a comparison of the segmentation performance of SOLOv2 using different backbone networks on maize seedlings. The results indicate that SOLOv2 Resnet101 outperformed SOLOv2 Resnet50 with a mAP of 94.2% at an IoU threshold of 0.5 while maintaining a single image inference time of 0.15 s. Hence, SOLOv2 Resnet101 was selected as the student model for the semi-supervised learning approach in this study.
The segmentation performance of SOLOv2 Resnet101 for maize seedlings at different labeled data ratios is shown in Table 4. The best segmentation results were achieved with round-1 of the student model when the labeled data ratio was 30%, with an mAP of 93.6%, slightly higher than that of the fully supervised model, and with a slower inference time per image of 0.01 s. The semi-supervised learning model achieved its best performance in the second round of training for all labeled data ratios. However, for labeled data ratios of 20% and 10%, the segmentation performance and mAP values were slightly lower, with values below 90%. Despite this, when the labeled data was only 30% of the fully supervised model, the semi-supervised learning model was able to achieve comparable segmentation performance.
The visual results of maize segmentation using SOLOv2 Resnet101 with different labeled data ratios are presented in Figure 6. The segmentation results for each ratio were obtained by selecting the model with the highest mAP from Table 4 for prediction. Figure 6a,c show independent and non-overlapping maize plants, resulting in good segmentation performance for several student models that are comparable to the fully supervised model. However, in Figure 6b, three maize plants intersect with each other, and only the fully supervised model and the model with a labeled data ratio of 30% achieved good segmentation results. Other models exhibited the phenomenon of over-prediction of pixels. Therefore, the performance of the semi-supervised model with a labeled data ratio of 30% was the best.

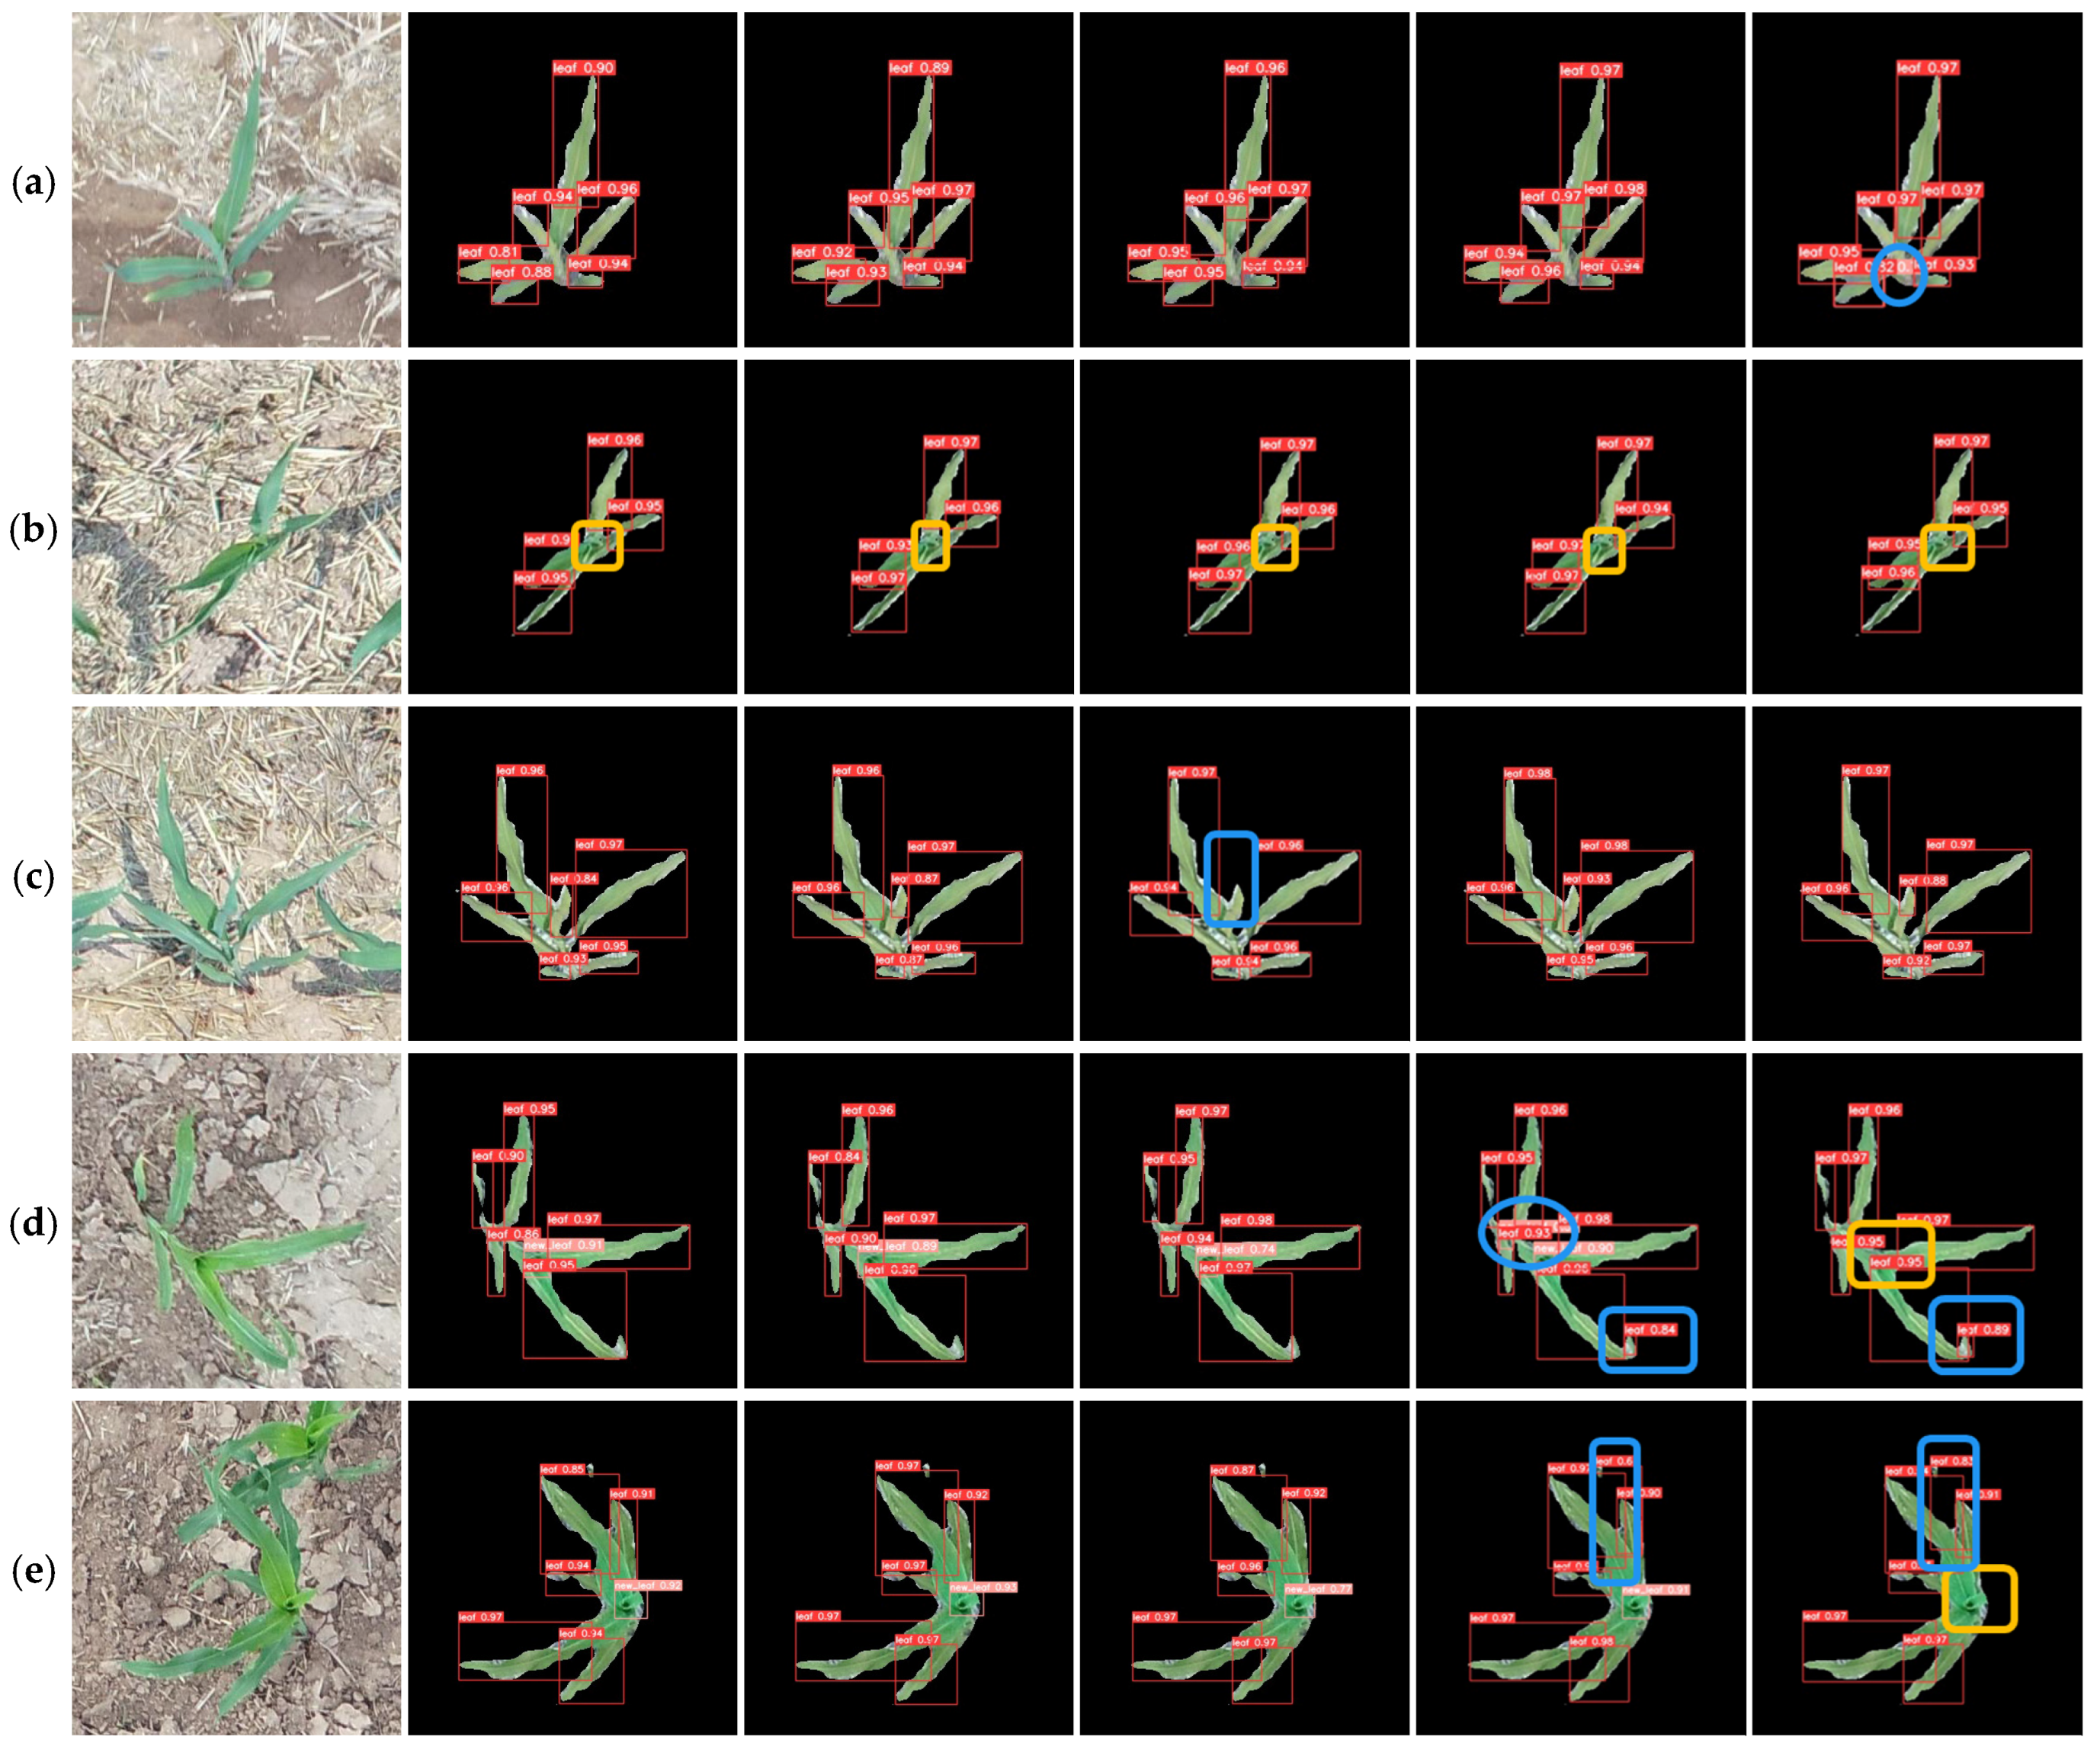
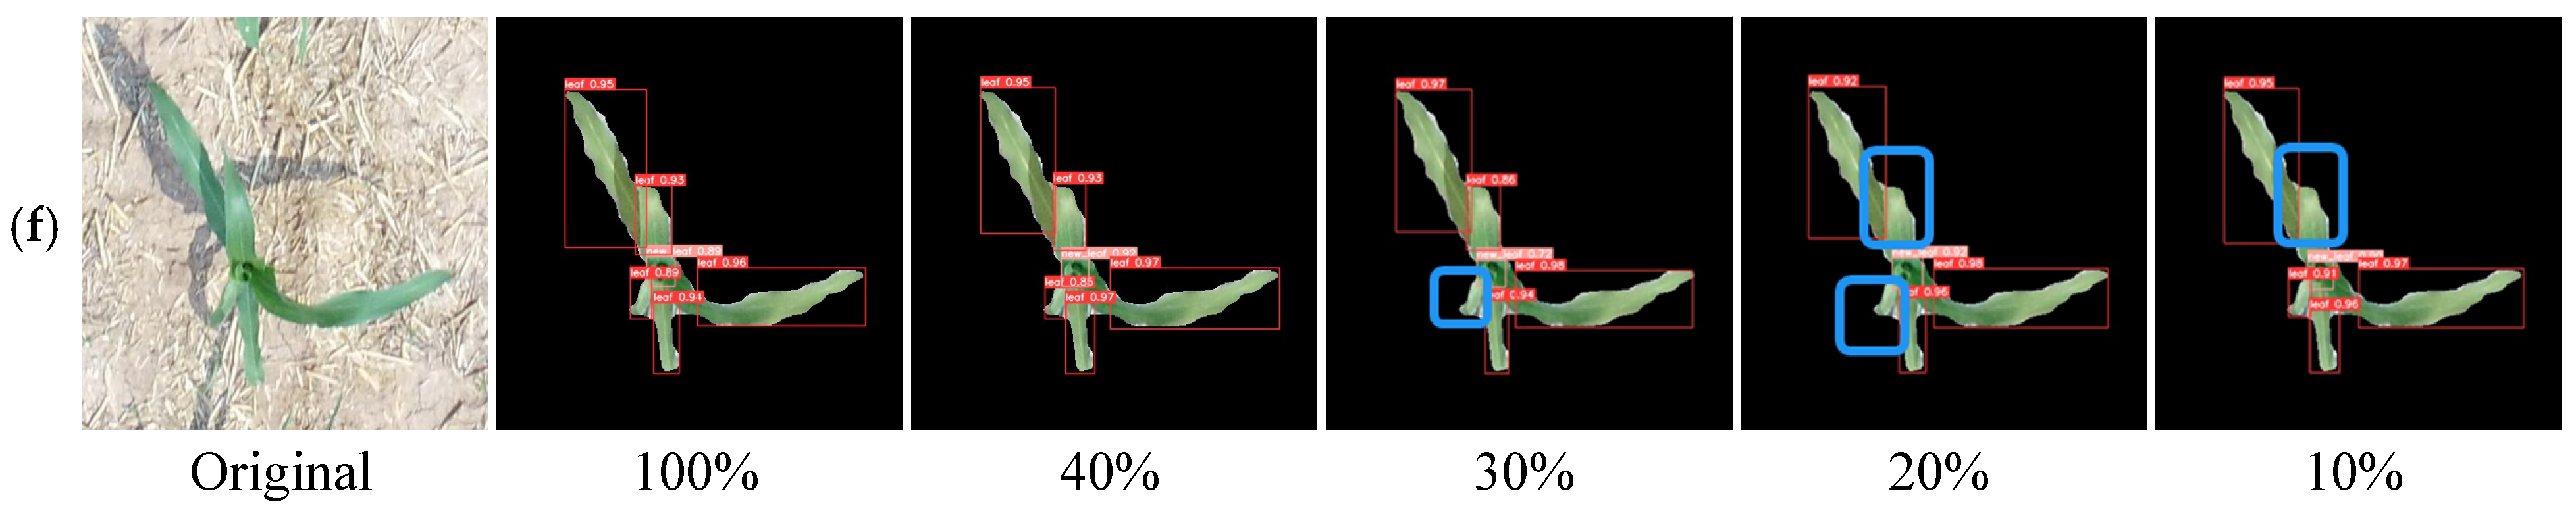
3.2. Leaf Counting Results

The loss curves for YOLOv5x models with different labeled data ratios (10%, 20%, 30%, and 40%) at different numbers of iterations are shown in Figure 7. For all three iterations, the loss values of all models gradually converged with increasing iteration numbers. Among them, when the labeled data ratio was 40%, the minimum value of the model’s convergence was lower than that of the models with other labeled data ratios.
Table 5 shows the leaf detection performance of YOLOv5x models at different labeled data ratios. When the labeled data ratio was 40%, the round-1 student model had the best detection performance. Although the precision was slightly lower than that of the fully supervised model, the recall and mAP were higher than those of the fully supervised model, indicating that the student model predicted the leaf class more accurately than the fully supervised model. The round-2 student models exhibited the best detection performance for labeled data ratios of 30% and 20%, whereas for a labeled data ratio of 10%, the round-3 models demonstrated the highest performance. Insufficient sample size, consisting of only 90 samples, may have contributed to this variation in performance, limiting the model’s ability to learn additional features. Thus, the semi-supervised learning approach employing only 40% of the fully supervised model’s labeled data can achieve leaf detection performance that is comparable to the fully supervised model.
The visualized leaf detection results of models trained with different labeled data ratios are shown in Figure 8. The models were trained with a labeled data ratio of 40%, and the fully supervised model had the best detection performance. All models missed the detection of newly appeared leaves in Figure 8b, and the models trained with the other three labeled data ratios missed the detection of fully unfolded leaves or newly appeared leaves during leaf detection. The model with a labeled data ratio of 10% missed the most leaves during detection.
In order to verify the leaf detection capabilities of the student models trained with different labeled data ratios, 101 test set images were divided into 170 single-plant maize seedling images to count the leaves completely. Table 6 displays the distribution results of the discrepancy between the actual leaf count and the forecasted value by the model. A value of “0” indicates that the leaf count is accurate, while “−2” and “−1” indicate that the predicted number is greater than the actual count, and “1”, “2”, and “3” indicate that the predicted value is less than the actual value. In addition to the fully supervised model, the semi-supervised learning model with a label ratio of 40% exhibited the best counting performance. Specifically, the number of fully developed leaves was precisely predicted for 118 maize seedlings out of 170 images.
Table 7 presents the distribution of differences between the true values and the predicted values for manual counting of newly appearing leaves. Among the semi-supervised models, the student model with a labeled ratio of 40% demonstrated the highest accuracy in detecting newly appearing leaves, achieving a counting accuracy of 72.9%. Overall, the semi-supervised learning approach produced models that outperformed others in counting both newly appearing and fully unfolded leaves, with the student model trained on 40% of labeled data demonstrating the best performance.

4. Discussion

This study explored the use of semi-supervised learning in combination with deep learning to alleviate the time-consuming and labor-intensive task of manual data labeling. Specifically, the study utilized the Noisy Student semi-supervised learning method and trained three rounds of models. To reduce the computational load, the SOLOv2 model with a smaller parameter set was chosen for the maize seedling segmentation stage. Our results demonstrated that the SOLOv2 Resnet101 outperformed the SOLOv2 Resnet50 in segmentation performance (Table 3), likely due to Resnet101’s deeper network structure and its capacity to learn more comprehensive and deeper image features without losing information [44].
The main focus of this paper is to explore and leverage semi-supervised methods to alleviate the burden of data annotation. Although we did utilize the original YOLOv5x and SOLOv2 models, our significant contribution lied in the integration of semi-supervised learning methods with deep learning techniques to ensure the detection and segmentation performance of the model while reducing the annotation workload. This approach not only demonstrated the potential of combining semi-supervised learning with deep learning but also showcased the effectiveness of semi-supervised learning in the application of plant phenotyping. The experimental results showed that the proposed method had certain effectiveness and could accurately segment maize seedlings and count maize leaves quickly (Table 4 and Table 5) while reducing the data annotation workload by 65%.
In addition, the instance segmentation results of maize seedlings showed that using only 30% labeled data produced better segmentation performance than using 40%, which was consistent with the findings of Nong et al. [42]. They also observed that models trained with less labeled data outperformed those trained with more labeled data. The phenomenon could be explained by the fact that an abundance of labeled data can cause the model to rely too heavily on it, leading to suboptimal performance when predicting pseudo-labels for unlabeled data.
The developmental process of maize seedlings is a highly dynamic process characterized by rapid growth rates, with new leaves appearing as frequently as once a day. Inaccurate leaf counting, whether premature or delayed, can have significant consequences for agricultural management decisions [45]. Premature leaf counting may lead to false perceptions of unhealthy plant growth, prompting the unnecessary and potentially harmful use of fertilizers or pesticides, which can impair crop growth [46,47]. Delayed leaf counting, on the other hand, may result in missed opportunities for an optimized agricultural management window, making it impossible to adjust management practices in a timely manner and thereby affecting maize yield and quality. Therefore, the timeliness of leaf counting is crucial. While deep learning methods exhibit high accuracy, they require significant amounts of labeled data for model training, which can be costly in terms of both time and human resources [48,49]. Semi-supervised learning methods can reduce the workload of data labeling, resulting in faster and more efficient data processing and analysis. In this study, we employed the semi-supervised learning method to accurately segment and count maize seedling leaves using a limited amount of labeled data. High-throughput images of maize seedlings in the field can be captured using UAV sensors, and the combination of these images with a semi-supervised learning method can lead to faster and more accurate counting of maize seedling leaves. This approach not only reduced labor and time costs but also ensured the timely acquisition of critical information on maize seedlings for optimal agricultural management decisions.
In future work, we can integrate our methods with crop simulation models to quickly provide information on the number of maize seedling leaves [50,51], enabling more efficient and accurate predictions of the growth speed, yield, and quality of maize seedlings. Traditional data annotation methods typically require significant resources and time, which can result in delays in data processing and analysis [52,53], thereby hindering real-time monitoring of crop growth processes and decision-making. To address this, we can further research and develop automated annotation software that integrates semi-supervised learning methods with deep learning techniques, using only a small amount of labeled data to train models to predict image targets captured by UAVs and generate pseudo labels, thereby reducing labor costs and improving data processing efficiency and speed. Ultimately, this approach would facilitate more effective real-time monitoring of crop growth processes and support informed decision-making in agriculture.

5. Conclusions

A novel method was proposed that combines semi-supervised learning of UAV digital images with maize seedling segmentation and leaf counting. The Noisy Student framework was adopted to train teacher-student models, where the segmentation model was based on SOLOv2 and the leaf counting model was based on YOLOv5x. Our goal was to achieve segmentation and counting performance comparable to fully supervised models with minimal labeled data. The main conclusions are as follows:
(1)
The maize seedling segmentation performance of SOLOv2 Resnet101 was better than that of SOLOv2 Resnet50, achieving a mAP of 94.2% and a single-image inference time of 0.15 s. However, when the labeled data proportion was 30%, the student model SOLOv2 Resnet101 achieved the best segmentation performance with a mAP of 93.6% and a single-image inference time of 0.16 s.
(2)
When the labeled data proportion was 40%, the leaf detection performance of the student model YOLOv5x was comparable to that of the fully supervised model. The precision for detecting fully unfolded leaves and newly appearing leaves was 89.1% and 57.5%, respectively, with recall rates of 87.2% and 56.6% and average precision rates of 89.6% and 57.4%. The counting accuracy for newly appearing leaves and fully unfolded leaves was 72.9% and 69.4%, respectively.
This study made a preliminary exploration of counting maize leaves in the field during the seedling period using semi-supervised learning methods. The experimental results showed that the proposed method had certain effectiveness and could accurately segment maize seedlings and count maize leaves quickly while reducing the data annotation workload by 65%.

Author Contributions

Conceptualization, X.X., L.W. and Y.M.; methodology, X.X., L.W. and Y.M.; software, L.W. and X.L.; validation, L.W. and X.L.; formal analysis, Y.C. and L.Z.; investigation, L.W. and X.L.; resources, Y.M. and H.Y.; writing—original draft preparation, L.W.; writing—review and editing, P.F. and Y.M.; visualization, L.W. and X.L.; supervision, Y.M.; project administration, Y.M. and H.Y.; funding acquisition, X.X. All authors have read and agreed to the published version of the manuscript.

Funding

This research was funded by the Key Technologies Research and Development Program of China (grant number 2021YFD2000103), the Beijing Digital Agriculture Innovation Consortium Project (grant number BAIC10-2022), the National Natural Science Foundation of China (grant number 32271987), the Natural Science Foundation of Jilin Province (grant number YDZJ202201ZYTS544), and the Technology Development Plan Project of Jilin Province (grant number 20200403176SF).

Informed Consent Statement

Not applicable.

Data Availability Statement

Not applicable.

Acknowledgments

The authors would like to acknowledge the anonymous reviewers for their valuable comments and the members of the editorial team for proofreading carefully.

Conflicts of Interest

The authors declare no conflict of interest.

References

  1. Miao, T.; Zhu, C.; Xu, T.; Yang, T.; Li, N.; Zhou, Y.; Deng, H. Automatic stem-leaf segmentation of maize shoots using three-dimensional point cloud. Comput. Electron. Agric. 2021, 187, 106310. [Google Scholar] [CrossRef]
  2. Shu, M.Y.; Dong, Q.Z.; Fei, S.P.; Yang, X.H.; Zhu, J.Y.; Meng, L.; Li, B.G.; Ma, Y.T. Improved estimation of canopy water status in maize using UAV-based digital and hyperspectral images. Comput. Electron. Agric. 2022, 197, 106982. [Google Scholar]
  3. Wang, Y.-H.; Su, W.-H. Convolutional Neural Networks in Computer Vision for Grain Crop Phenotyping: A Review. Agronomy 2022, 12, 2659. [Google Scholar] [CrossRef]
  4. Amarasingam, N.; Ashan Salgadoe, A.S.; Powell, K.; Gonzalez, L.F.; Natarajan, S. A review of UAV platforms, sensors, and applications for monitoring of sugarcane crops. Remote Sens. Appl. Soc. Environ. 2022, 26, 100712. [Google Scholar] [CrossRef]
  5. Ji, Y.; Chen, Z.; Cheng, Q.; Liu, R.; Li, M.; Yan, X.; Li, G.; Wang, D.; Fu, L.; Ma, Y.; et al. Estimation of plant height and yield based on UAV imagery in faba bean (Vicia faba L.). Plant Methods 2022, 18, 26. [Google Scholar] [CrossRef]
  6. Oehme, L.H.; Reineke, A.-J.; Weiß, T.M.; Würschum, T.; He, X.; Müller, J. Remote Sensing of Maize Plant Height at Different Growth Stages Using UAV-Based Digital Surface Models (DSM). Agronomy 2022, 12, 958. [Google Scholar] [CrossRef]
  7. Gao, M.; Yang, F.; Wei, H.; Liu, X. Individual Maize Location and Height Estimation in Field from UAV-Borne LiDAR and RGB Images. Remote Sens. 2022, 14, 2292. [Google Scholar] [CrossRef]
  8. Gan, Y.; Wang, Q.; Iio, A. Tree Crown Detection and Delineation in a Temperate Deciduous Forest from UAV RGB Imagery Using Deep Learning Approaches: Effects of Spatial Resolution and Species Characteristics. Remote Sens. 2023, 15, 778. [Google Scholar] [CrossRef]
  9. Terryn, L.; Calders, K.; Bartholomeus, H.; Bartolo, R.E.; Brede, B.; D’Hont, B.; Disney, M.; Herold, M.; Lau, A.; Shenkin, A.; et al. Quantifying tropical forest structure through terrestrial and UAV laser scanning fusion in Australian rainforests. Remote Sens. Environ. 2022, 271, 112912. [Google Scholar] [CrossRef]
  10. Panagiotidis, D.; Abdollahnejad, A.; Slavík, M. 3D point cloud fusion from UAV and TLS to assess temperate managed forest structures. Int. J. Appl. Earth Obs. Geoinf. 2022, 112, 102917. [Google Scholar] [CrossRef]
  11. Du, L.; Yang, H.; Song, X.; Wei, N.; Yu, C.; Wang, W.; Zhao, Y. Estimating leaf area index of maize using UAV-based digital imagery and machine learning methods. Sci. Rep. 2022, 12, 15937. [Google Scholar] [CrossRef] [PubMed]
  12. Wu, S.; Deng, L.; Guo, L.; Wu, Y. Wheat leaf area index prediction using data fusion based on high-resolution unmanned aerial vehicle imagery. Plant Methods 2022, 18, 68. [Google Scholar] [CrossRef]
  13. Shu, M.; Shen, M.; Zuo, J.; Yin, P.; Wang, M.; Xie, Z.; Tang, J.; Wang, R.; Li, B.; Yang, X.; et al. The Application of UAV-Based Hyperspectral Imaging to Estimate Crop Traits in Maize Inbred Lines. Plant Phenomics 2021, 2021, 9890745. [Google Scholar] [CrossRef] [PubMed]
  14. Wang, Q.; Che, Y.; Shao, K.; Zhu, J.; Wang, R.; Sui, Y.; Guo, Y.; Li, B.; Meng, L.; Ma, Y. Estimation of sugar content in sugar beet root based on UAV multi-sensor data. Comput. Electron. Agric. 2022, 203, 107433. [Google Scholar] [CrossRef]
  15. Wu, Q.; Zhang, Y.; Zhao, Z.; Xie, M.; Hou, D. Estimation of Relative Chlorophyll Content in Spring Wheat Based on Multi-Temporal UAV Remote Sensing. Agronomy 2023, 13, 211. [Google Scholar] [CrossRef]
  16. Fu, H.; Chen, J.; Lu, J.; Yue, Y.; Xu, M.; Jiao, X.; Cui, G.; She, W. A Comparison of Different Remote Sensors for Ramie Leaf Area Index Estimation. Agronomy 2023, 13, 899. [Google Scholar] [CrossRef]
  17. Hu, P.; Zhang, R.; Yang, J.; Chen, L. Development Status and Key Technologies of Plant Protection UAVs in China: A Review. Drones 2022, 6, 354. [Google Scholar] [CrossRef]
  18. Liu, Y.; Feng, H.; Yue, J.; Li, Z.; Yang, G.; Song, X.; Yang, X.; Zhao, Y. Remote-sensing estimation of potato above-ground biomass based on spectral and spatial features extracted from high-definition digital camera images. Comput. Electron. Agric. 2022, 198, 107089. [Google Scholar] [CrossRef]
  19. Syazwani, R.W.N.; Asraf, H.M.; Amin, M.M.S.; Dalila, K.N. Automated image identification, detection and fruit counting of top-view pineapple crown using machine learning. Alex. Eng. J. 2022, 61, 1265–1276. [Google Scholar] [CrossRef]
  20. Liu, S.; Yin, D.; Feng, H.; Li, Z.; Xu, X.; Shi, L.; Jin, X. Estimating maize seedling number with UAV RGB images and advanced image processing methods. Precis. Agric. 2022, 23, 1604–1632. [Google Scholar] [CrossRef]
  21. Kim, Y.H.; Park, K.R. MTS-CNN: Multi-task semantic segmentation-convolutional neural network for detecting crops and weeds. Comput. Electron. Agric. 2022, 199, 107146. [Google Scholar] [CrossRef]
  22. Wang, P.; Zhang, Y.; Jiang, B.; Hou, J. An maize leaf segmentation algorithm based on image repairing technology. Comput. Electron. Agric. 2020, 172, 105349. [Google Scholar] [CrossRef]
  23. Xu, X.; Wang, L.; Shu, M.; Liang, X.; Ghafoor, A.Z.; Liu, Y.; Ma, Y.; Zhu, J. Detection and Counting of Maize Leaves Based on Two-Stage Deep Learning with UAV-Based RGB Image. Remote Sens. 2022, 14, 5388. [Google Scholar] [CrossRef]
  24. Song, C.-Y.; Zhang, F.; Li, J.-S.; Xie, J.-Y.; Yang, C.; Zhou, H.; Zhang, J.-X. Detection of maize tassels for UAV remote sensing image with an improved YOLOX model. J. Integr. Agric. 2022, 22, 1671–1683. [Google Scholar] [CrossRef]
  25. Lac, L.; Da Costa, J.-P.; Donias, M.; Keresztes, B.; Bardet, A. Crop stem detection and tracking for precision hoeing using deep learning. Comput. Electron. Agric. 2022, 192, 106606. [Google Scholar] [CrossRef]
  26. Barreto, A.; Lottes, P.; Yamati, F.R.I.; Baumgarten, S.; Wolf, N.A.; Stachniss, C.; Mahlein, A.-K.; Paulus, S. Automatic UAV-based counting of seedlings in sugar-beet field and extension to maize and strawberry. Comput. Electron. Agric. 2021, 191, 106493. [Google Scholar] [CrossRef]
  27. Yu, X.; Yin, D.; Nie, C.; Ming, B.; Xu, H.; Liu, Y.; Bai, Y.; Shao, M.; Cheng, M.; Liu, Y.; et al. Maize tassel area dynamic monitoring based on near-ground and UAV RGB images by U-Net model. Comput. Electron. Agric. 2022, 203, 107477. [Google Scholar] [CrossRef]
  28. Gan, H.; Ou, M.; Li, C.; Wang, X.; Guo, J.; Mao, A.; Ceballos, M.C.; Parsons, T.D.; Liu, K.; Xue, Y. Automated detection and analysis of piglet suckling behaviour using high-accuracy amodal instance segmentation. Comput. Electron. Agric. 2022, 199, 107162. [Google Scholar] [CrossRef]
  29. Mendoza, A.; Trullo, R.; Wielhorski, Y. Descriptive modeling of textiles using FE simulations and deep learning. Compos. Sci. Technol. 2021, 213, 108897. [Google Scholar] [CrossRef]
  30. Wagner, F.H.; Dalagnol, R.; Tarabalka, Y.; Segantine, T.Y.F.; Thomé, R.; Hirye, M.C.M. U-Net-Id, an Instance Segmentation Model for Building Extraction from Satellite Images—Case Study in the Joanópolis City, Brazil. Remote Sens. 2020, 12, 1544. [Google Scholar] [CrossRef]
  31. Gao, X.; Zan, X.; Yang, S.; Zhang, R.; Chen, S.; Zhang, X.; Liu, Z.; Ma, Y.; Zhao, Y.; Li, S. Maize seedling information extraction from UAV images based on semi-automatic sample generation and Mask R-CNN model. Eur. J. Agron. 2023, 147, 126845. [Google Scholar] [CrossRef]
  32. Sun, X.; Fang, W.; Gao, C.; Fu, L.; Majeed, Y.; Liu, X.; Gao, F.; Yang, R.; Li, R. Remote estimation of grafted apple tree trunk diameter in modern orchard with RGB and point cloud based on SOLOv2. Comput. Electron. Agric. 2022, 199, 107209. [Google Scholar] [CrossRef]
  33. Soetedjo, A.; Hendriarianti, E. Plant Leaf Detection and Counting in a Greenhouse during Day and Nighttime Using a Raspberry Pi NoIR Camera. Sensors 2021, 21, 6659. [Google Scholar] [CrossRef] [PubMed]
  34. Tu, Y.-L.; Lin, W.-Y.; Lin, Y.-C. Automatic Leaf Counting Using Improved YOLOv3. In Proceedings of the International Symposium on Computer, Consumer and Control (IS3C) 2020, Taichung, Taiwan, 13–16 November 2020; pp. 197–200. [Google Scholar] [CrossRef]
  35. Lu, S.; Song, Z.; Chen, W.; Qian, T.; Zhang, Y.; Chen, M.; Li, G. Counting Dense Leaves under Natural Environments via an Improved Deep-Learning-Based Object Detection Algorithm. Agriculture 2021, 11, 1003. [Google Scholar] [CrossRef]
  36. Li, X.; Fan, W.Q.; Wang, Y.; Zhang, L.K.; Liu, Z.X.; Xia, C.L. Detecting Plant Leaves Based on Vision Transformer Enhanced YOLOv5. In Proceedings of the 2022 3rd International Conference on Pattern Recognition and Machine Learning (PRML), Chengdu, China, 22–24 July 2022; pp. 32–37. [Google Scholar]
  37. Zhang, C.; Ding, H.; Shi, Q.; Wang, Y. Grape Cluster Real-Time Detection in Complex Natural Scenes Based on YOLOv5s Deep Learning Network. Agriculture 2022, 12, 1242. [Google Scholar] [CrossRef]
  38. Wang, L.; Zhao, Y.; Xiong, Z.; Wang, S.; Li, Y.; Lan, Y. Fast and precise detection of litchi fruits for yield estimation based on the improved YOLOv5 model. Front. Plant Sci. 2022, 13, 965425. [Google Scholar] [CrossRef]
  39. Xu, L.; Chen, C.P.; Han, R. Graph-based sparse bayesian broad learning system for semi-supervised learning. Inf. Sci. 2022, 597, 193–210. [Google Scholar] [CrossRef]
  40. Najafian, K.; Ghanbari, A.; Stavness, I.; Jin, L.; Shirdel, G.H.; Maleki, F. A Semi-self-supervised Learning Approach for Wheat Head Detection using Extremely Small Number of Labeled Samples. In Proceedings of the IEEE/CVF International Conference on Computer Vision, Montreal, BC, Canada, 11–17 October 2021; pp. 1342–1351. [Google Scholar] [CrossRef]
  41. Khan, S.; Tufail, M.; Khan, M.T.; Khan, Z.A.; Iqbal, J.; Alam, M. A novel semi-supervised framework for UAV based crop/weed classification. PLoS ONE 2021, 16, e0251008. [Google Scholar] [CrossRef]
  42. Nong, C.; Fan, X.; Wang, J. Semi-supervised Learning for Weed and Crop Segmentation Using UAV Imagery. Front. Plant Sci. 2022, 13, 927368. [Google Scholar] [CrossRef]
  43. Xie, Q.Z.; Luong, M.T.; Hovy, E.; Le, Q.V. Self-training with noisy student improves imagenet classification. In Proceedings of the IEEE/CVF Conference on Computer Vision and Pattern Recognition, Seattle, WA, USA, 13–19 June 2020; pp. 10687–10698. [Google Scholar]
  44. Blok, P.M.; Van Evert, F.K.; Tielen, A.P.M.; Van Henten, E.J.; Kootstra, G. The effect of data augmentation and network simplification on the image-based detection of broccoli heads with Mask R-CNN. J. Field Robot. 2021, 38, 85–104. [Google Scholar] [CrossRef]
  45. Pang, Y.; Shi, Y.; Gao, S.; Jiang, F.; Veeranampalayam-Sivakumar, A.-N.; Thompson, L.; Luck, J.; Liu, C. Improved crop row detection with deep neural network for early-season maize stand count in UAV imagery. Comput. Electron. Agric. 2020, 178, 105766. [Google Scholar] [CrossRef]
  46. Pańka, D.; Jeske, M.; Łukanowski, A.; Baturo-Cieśniewska, A.; Prus, P.; Maitah, M.; Maitah, K.; Malec, K.; Rymarz, D.; Muhire, J.D.D.; et al. Can Cold Plasma Be Used for Boosting Plant Growth and Plant Protection in Sustainable Plant Production? Agronomy 2022, 12, 841. [Google Scholar] [CrossRef]
  47. Liang, Z.; van der Werf, W.; Xu, Z.; Cheng, J.; Wang, C.; Cong, W.-F.; Zhang, C.; Zhang, F.; Groot, J.C. Identifying exemplary sustainable cropping systems using a positive deviance approach: Wheat-maize double cropping in the North China Plain. Agric. Syst. 2022, 201, 103471. [Google Scholar] [CrossRef]
  48. Whang, S.E.; Roh, Y.; Song, H.; Lee, J.-G. Data collection and quality challenges in deep learning: A data-centric AI perspective. VLDB J. 2023, 32, 791–813. [Google Scholar] [CrossRef]
  49. Chung, P.-C.; Yang, W.-J.; Wu, T.-H.; Huang, C.-R.; Hsu, Y.-Y. Emerging Research Directions of Deep Learning for Pathology Image Analysis. In Proceedings of the 2022 IEEE Biomedical Circuits and Systems Conference (BioCAS), Taipei, Taiwan, 13–15 October 2022; pp. 100–104. [Google Scholar] [CrossRef]
  50. Gul, F.; Ahmed, I.; Ashfaq, M.; Jan, D.; Fahad, S.; Li, X.; Wang, D.; Fahad, M.; Fayyaz, M.; Shah, S.A. Use of crop growth model to simulate the impact of climate change on yield of various wheat cultivars under different agro-environmental conditions in Khyber Pakhtunkhwa, Pakistan. Arab. J. Geosci. 2020, 13, 112. [Google Scholar] [CrossRef]
  51. Han, C.; Zhang, B.; Chen, H.; Wei, Z.; Liu, Y. Spatially distributed crop model based on remote sensing. Agric. Water Manag. 2019, 218, 165–173. [Google Scholar] [CrossRef]
  52. Xie, D.L.; Yang, R.H.; Qiao, Y.C.; Zhang, J.B. Intelligent Identification of Landslide Based on Deep Semi-Supervised Learning. In Proceedings of the 2022 5th International Conference on Pattern Recognition and Artificial Intelligence (PRAI), Chengdu, China, 19–21 August 2022; pp. 264–269. [Google Scholar]
  53. Wang, J.; Jia, Y.; Wang, D.; Xiao, W.; Wang, Z. Weighted IForest and siamese GRU on small sample anomaly detection in healthcare. Comput. Methods Programs Biomed. 2022, 218, 106706. [Google Scholar] [CrossRef]
Figure 1. Flow chart for counting maize leaves.
Sustainability 15 09583 g001
Figure 2. Framework of Noisy Student.
Sustainability 15 09583 g002
Figure 3. Examples of pseudo-labels. (a,b) are maize seedling segmentations. (c,d) are leaf counts.
Sustainability 15 09583 g003
Figure 4. SOLOv2 network structure. * means dynamic convolution.
Sustainability 15 09583 g004
Figure 5. YOLOv5x network structure. Bottleneck × n* means multiple Bottleneck block.
Sustainability 15 09583 g005
Figure 6. Visualization of SOLOv2 Resnet101 segmentation results under different label ratios. (a,c) Uncross-covering of adjacent seedling leaves; (b) cross-covering of adjacent seedling leaves.
Sustainability 15 09583 g006
Figure 7. Loss curve of three rounds with different labeled proportions. (a) Round-1, (b) Round-2, (c) Round-3.
Sustainability 15 09583 g007
Figure 8. Visualization of YOLOv5x detection results under different label ratios. (a,c) The maize seedlings without newly appeared leaves; (b,df) the maize seedlings with newly appeared leaves.
Sustainability 15 09583 g008aSustainability 15 09583 g008b
Table 1. Distribution of datasets.
Labeled Ratio (%)Number of Labeled DataNumber of Unlabeled DataAfter Data Enhancement
Teacher ModelStudent Model
Segmentation of maize seedlings4036254212673338
302726329523338
201817236343338
10908143153338
Detection of leaves4036254215213810
3027263211433810
201817237613810
10908143783810
Table 2. Parameters of models.
ModelBatch-SizeLearning RateWeight DecayMomentumEpoch
SOLOv2160.020.00010.9100
YOLOv5x160.010.00050.937300
Table 3. Segmentation performance of SOLOv2 in different backbones on the test set.
ModelBackboneMask APTime (s/img)
mAP0.50 (%)mAP0.75 (%)mAP0.5:0.95 (%)
SOLOv2Resnet 5091.681.663.10.15
Resnet 10194.285.165.60.15
Table 4. Performance of SOLOv2 Resnet101 for maize seedling segmentation under different label ratios.
Labeled ProportionRoundmAP0.5(%)mAP0.75(%)mAP0.5:0.95(%)Time(s/img)
100%-94.285.165.60.15
40%Round-191.384.162.60.15
Round-291.976.959.20.15
Round-388.465.853.40.15
30%Round-193.676.060.40.16
Round-292.170.456.70.17
Round-391.065.255.30.16
20%Round-189.665.755.00.16
Round-286.558.549.50.23
Round-386.353.448.20.16
10%Round-188.260.451.90.17
Round-285.948.047.00.16
Round-379.035.940.10.17
Table 5. Performance of YOLOv5x for leaf detection under different label ratios.
Labeled ProportionRoundPrecision (%)Recall (%)AP (%)mAP (%)
Fully
Unfolded leaf
Newly Appearing LeafFully
Unfolded Leaf
Newly Appearing LeafFully
Unfolded Leaf
Newly Appearing Leaf
100%92.068.884.450.089.654.071.8
40%Round-187.857.084.546.788.347.768.0
Round-290.458.086.047.590.148.769.4
Round-389.157.587.256.689.657.473.5
30%Round-188.153.683.548.487.347.867.5
Round-288.156.383.947.587.749.468.5
Round-387.854.484.645.188.644.866.7
20%Round-188.850.983.741.088.243.165.7
Round-288.450.085.443.488.445.266.8
Round-386.850.085.443.487.442.164.7
10%Round-190.362.278.747.385.551.468.8
Round-287.951.182.247.586.745.366.0
Round-387.951.181.446.785.742.564.1
Table 6. The difference distribution in fully unfolded leaf counting.
Labeled ProportionDifferential ValueAccuracy Rate
−2−10123
100%21612428--72.9%
40%123118271-69.4%
30%318116285-68.2%
20%329106282162.4%
10%322102394-60.0%
Table 7. The difference distribution in newly appeared leaf counting.
Labeled ProportionDifferential ValueAccuracy Rate
−2−101
100%-111283175.3%
40%-131243372.9%
30%-81204270.6%
20%1151233172.4%
10%-161193570.0%
Disclaimer/Publisher’s Note: The statements, opinions and data contained in all publications are solely those of the individual author(s) and contributor(s) and not of MDPI and/or the editor(s). MDPI and/or the editor(s) disclaim responsibility for any injury to people or property resulting from any ideas, methods, instructions or products referred to in the content.

