Abstract
This study aimed to produce a network structure in Integrated Urban Farming Program in Bandung City to map the involved policy actors to realize a food-smart city. In this study, a mixed method was used with an exploratory sequential strategy involving policy actors from the government, private sector, academia, community, and mass media. To obtain a network structure in Integrated Urban Farming toward determining the most important actors, the Social Network Analysis (SNA) approach was also employed through the Gephi application. From this context, the structure emphasized four dimensions, namely Degree, Betweenness, Closeness, and Eigenvector Centralities. The results showed that the actor with the most connections (degree of centrality) and best communication control (betweenness centrality) is Parahyangan Catholic University (academic). At the same time, the actor that plays the most important role (eigenvector) is at the lower level of the government’s Sub-District and Urban Village. This study is useful for explaining the importance of the position of actors in the urban farming policy network, which is the key to the success of a program.
1. Introduction
Nowadays, the international community is faced with a global crisis (energy, food, and finance) due to climate change, the COVID-19 pandemic, and the impact of war. In this case the issue of food is interesting to discuss because of the following reasons: (1) The impact of the COVID-19 pandemic has disrupted the food supply chain, increased food inflation, and decreased people’s purchasing power. (2) Food is one of the focuses of the G-20 in terms of global food recovery. (3) SDG Target No. 2 is a world without hunger, good food security and nutrition, and sustainable agriculture [1]. (4) The Global Food Security Index in 2021 Indonesia is still ranked 68 out of 113 countries [2].
The world’s population is estimated to reach 10 billion by 2050, so in order to be able to meet its food needs, the increase in global food production must increase by approximately 70% [3]. This indicates that the international community, including Indonesia, needs to play an active role in anticipating and mitigating the consequences of the food crisis. Food insecurity no longer occurs only in rural areas but also in urban areas. This is due to unbalanced urbanization, which has led to more people living in cities than in villages. As many as 56.7% of Indonesia’s population lived in urban areas in 2020 [4]. In line with that, the World Bank [5] predicts that as many as 220 million Indonesians will live in urban areas by 2045, which is equivalent to 70% of the total population of the country. Urban food security is vulnerable to disturbance along food supply chains because of the relatively long food miles and cities’ reliance on imported food [6].
Urban farming is responsible for playing a role in addressing city food insecurity problems, which are bound to become increasingly important with the secular trend towards the urbanization of poverty and of the population in developing regions [7]. Urban farming is farming activity in or around the city that involves skill, expertise, and innovation in food processing cultivation by the community through the use of yards and empty land to increase nutrition and improve the economy and family welfare [8]. From this context, the majority of people think of agriculture as an activity that occurs almost entirely on rural land. However, today, many agricultural activities are also developing in urban areas [9]. Urban farming also provides a complex strategy for food security and poverty alleviation in cities, as well as contributes to metropolitan green land management [10]. In addressing the food crisis in cities, the farming process is globally recognized by various scholars [11,12] leading to the adoption of urban agricultural practices by many countries as a problem-solving approach.
In Indonesia, urban farming has been practiced for a long time despite becoming popular in 2000 and has been developing in the last 10 years. At its peak during COVID-19, urban farming activities were in high demand due to the imposition of restrictions on community activities, commonly known as a lockdown, which is the Government of Indonesia’s policy to deal with the COVID-19 pandemic in Indonesia. Many cities in Indonesia have implemented urban farming practices, such as Jakarta City [13], Surabaya City [14], Semarang City [15], Makassar City [16], Malang City [17], Palu City [18], and Bandung City [19]. From these cities, Bandung is one of the best in implementing urban farming practices. According to [20], the problems occurring in the development of the practices in Jakarta, from an economic aspect, emphasized the difficulty of avoiding land conversion. This was partially because of the low value of land from the agricultural sector activities, compared to the outputs of other fields. In this case, there was a strong commitment and consistency of policymakers and stakeholders in implementing agricultural development policies, although urban farming practices in other cities have not covered all sub-districts and villages. In contrast to Bandung City, urban farming practices in Bandung City have covered 30 sub-districts and 151 villages; by January 2023, at least 335 farmer groups were formed in Bandung City.
Bandung City implemented an urban farming program in 2014, with the program innovated into an integrated system known as “Buruan SAE”. Buruan in Sundanese means a yard, and SAE in Sundanese means good, so Buruan SAE means a good yard. In addition, SAE itself stands for “Sehat” (healthy), “Alami” (Natural), and “Ekonomis” (economical). IUF (Integrated Urban Farming) is a program that focuses on increasing community awareness to be able to provide some of their own food [21]. In this city, the farming practice is different from that of other cities due to the innovation of emphasizing the combination of agriculture, fisheries, livestock, and medicinal plant cultivation in one yard. IUF is a program from the Bandung City government that involves various stakeholders in an effort to overcome the food crisis that occurred in Bandung City. The IUF Program promoted by the Food Security and Agriculture Office of Bandung City is aimed at overcoming the imbalance of food problems in Bandung City through empowering family resilience via utilizing and optimizing home yards/land around houses or land around residents to plant and cultivate various agricultural products; these areas are not only planted with vegetables but in one area/land, vegetables, fruits, chickens/rabbits, fish, and family medicinal plants can be cultivated to meet the consumption needs of families and the surrounding community.
As a metropolitan and service city, Bandung is the largest consumer in West Java Province and not a producer of agricultural food. This shows that the dependence on food from other regions (imports) is very high; no less than 96% of the food in Bandung City comes from supplies outside Bandung City area in the form of rice, meat, fish, vegetables, and fruit from other cities. A total of 600,000 chickens are also needed daily since Bandung residents often require 120 tons of eggs under normal conditions, with most supplies obtained from Blitar City [22]. Furthermore, the implementation of IUF in Bandung City has contributed to solving problems in the city. These contributions include (1) controlling food inflation, (2) reducing organic waste due to its use as organic fertilizer through composting, magotization, and bio-energy techniques for plants, (3) mitigating 8.86% stunting cases among toddlers in 2020 (in 2021, these cases were reduced by around 1.03% to 7.83% within the city), and (4) contributing to green open space [23]. From this context, policy is appreciated by many parties at the regional, national, and international levels.
On a regional scale, this policy became an innovation that led Bandung City to win first place in the Regional Inflation Control Team Award. The city also won the Regional Development Award as the first winner of the best settlement category at the West Java Province level in 2021, through the Buruan SAE Program. Moreover, the recent accolade acquired by the program was the Prize Milan Pact Award (MPA) in 2022, regarding the food production category at the eighth MUFPP (Milan Urban Food Policy Pact). In this case, the Buruan SAE Program defeated more than 251 innovations from 133 cities in the world. The Bandung City Government also obtained the Best Practice Jabar Sustainable Development Goals award 2022 from the Bappeda of West Java Province, through the Buruan SAE innovation. In addition, the following accolades are observed: (1) First place Bandung Iconic 2022 regional apparatus group, (2) first place Regional Development Award West Java Province Level and third place National Level, (3) Best 1 Adi Bakti Tani Award with Buruan SAE Innovation, (4) Best 1 West Java Province Level for Consumer Price Index City in inflation control through Buruan SAE innovation, and (5) National Level Stunting Reduction Innovation Appreciation from The National Planning Agency [22].
The existence of commitment and good cooperation is also one of the important factors in the successful implementation of IUF in Bandung City. This is due to the prowess of the variables in the formulation of policy network, which is a relationship established through a coalition between government, community, and private actors. A policy network is a relationship formed as a result of a coalition between government, community and private actors [24]. In this context, policy actors are often known as stakeholders, whose roles on policymaking emphasized the government, business, the community, academics and the mass media [25]. To map the policy actors in the policy network within the IUF Program, the SNA (Social Network Analysis) method visualized through the Gephi 0.10.1 application is used. Furthermore, several reports have been conducted on policy network actors, using the SNA method [26]. Various studies are also reportedly performed on the network by using the SNA method, with an analysis carried out through the Gephi application, as evidenced in [27,28]. This proves that no report has been conducted on the policy network emphasizing actors in urban farming. These networks are powerful analytical concepts, although a combination is mandatory with the model of the stakeholder when the analyst is to move beyond description and into the more interesting field of policy explanation [29].
This study of food policy and urban farming has been conducted by many scholars from various study areas. However, so far based on data from Scopus, studies on urban farming policies from the perspective of networks’ and stakeholders’ participation are still very rare. Therefore, to fill the gap in the topic of urban farming, this study was deemed necessary. Furthermore, the topic of studies on policy networks using SNA and visualized by Gephi to see the network structure is something new, so this study can complement the topic of policy network study.
This study is motivated by food insecurity that occurs in the world, including Indonesia. Given that food is a basic human need, IUF practices are able to solve problems that occur in cities not only about food but in terms of health, environment, and economy. Based on the results of several scholars, Bandung City has the best practices in urban farming compared to other cities in Indonesia; one of the factors that led to success is the commitment and cooperation of the Bandung City government and stakeholders, which formed a policy network to develop this IUF Program.
The implementation of IUF is important to be examined more deeply from a network perspective, considering several reasons, the first being the involvement and interests of many actors from the government, private sector, academics, community groups, and mass media. Secondly, the phenomenon occurs in Bandung City and another global city. Thirdly, the study of policy dynamics is more complete and adequate with a policy study from the network approach. Based on this, the author is interested in mapping policy actors using social network analysis on Integrated Urban Farming Programs in Bandung City in order to produce a network structure so that the roles and functions of actors in the network can be well-known.
2. Literature Review
Public policy is a complex pattern, carried out by government agencies and institutions, which prioritize the collective choices depending on each other [30]. This pattern is presently an exclusive process involving state actors, as well as a product of networking, collaboration, and partnerships between governance elements (policy network) [31]. According to [32], the network connecting the state and community actors to converge in a public policy process was needed at the policy formulation stage. This was subsequently known as policy network.
‘Policy Network’ approaches initially consisted of specific analytical forms of state-interest group relation, especially ‘regulation communities’ and ‘issue network’ [33]. This network was mainly the unignorable focus in public policy, which was identical to dependence on other resources. This policy was capable of being adequately implemented when supported by the internal network, indicating that the ability to control competent or relevant fields produced extraordinary achievements according to the available tasks [34]. The success of policy implementation was also strongly influenced by the relationship between the organizations working together and exchanging resources. Therefore, the public policy implementation network emphasized the joint use of resources by stakeholders. This joint application exhibited the efficiency and effectiveness of policy performance [35].
In several categories, policy networks were also described, namely actors, linkages, and boundaries [36]. From this context, policy actors were known as the stakeholders that were interdependent, interactive, and capable of sharing resources [37]. Based on Rhodes, the characteristics of the network were categorized as follows: (1) the interdependence among actors/organizations involved, (2) the ongoing interactions among actors/organizations exchanging resources and negotiating with various objectives, (3) the communication governed by rules and trust, and (4) a significant degree of autonomy from state intervention [38]. In these networks, actors were commonly individuals, organizations, and specific groups/parties [39].
The development of a policy network to map these actors was conducted with the tSNA method, SNA, which was a theoretical and methodological approach used to analyze various social systems through data analysis. This was often implemented to determine local–global structures and network dynamics, to exhibiting the patterns of human interaction [40]. As an approach, SNA also prioritized the patterns by which the relationship between stakeholders formed a framework or structure independently studied and analyzed [41]. This method was commonly implemented for a systemic approach, which visualized invisible network flows by identifying the types of interactions, correlations and roles among users [42]. Beside this, SNA methods also identified key stakeholders. In this case, several structural characteristics were considered in the explanatory analysis of the social and policy network, with the notion of centrality being the most prominent aspect. This was because public policy was part of political science, where the main question was traditionally the following: “Who has power?”. Centrality was also considered a fairly good indicator of power in network, with the formalizations of the notion commonly emphasizing node degrees, shortest paths, network flows, or eigenvectors of graph-related matrices [43].
Since the indicator was considered an important characteristic of policy, its measurements were used to determine actors capable of playing the most important role in the network. These measurements consisted of Degree, Betweenness, Closeness and Eigenvector Centralities [44,45]. The measurements were also analyzed and visualized by using the Gephi 0.10.1 application, which was a standalone open-source software used for visual and network analysis [46]. Gephi can import, visualize, spatialize, filter, manipulate, and export all types of networks. The visualization module uses a special 3D render engine to render graphs in real-time [47]. Gephi is a social network analysis computer program; this application is able to detect actors with interaction relationships [48]. Gephi provides a wide variety of rich and enhanced features to represent data mining and text features using the huge “Alchemy AP Plugin”. The main advantage of using Gephi for network analysis is its ability to work with large-size data [49]. Gephi can read data from simple text files (txt), spreadsheets (CSV), and databases [50].
Researchers use secondary data from a collection of literature in the form of scientific journals, books, and other items from the Scopus database that discuss urban farming, social network and policy network. This study utilizes big data methods for data collection or acknowledged as text data mining [51]. Bibliometric analysis is a popular method for exploring and analyzing large amounts of scientific data [52]. Data were retrieved from the Scopus database on 29 May 2023. The search strategy was carried out with the following query: title-abs-key (title-abs-key (urban and farming) and title-abs-key (social and network) and title-abs-key (policy and network)). The results showed that in the period 2004–2023 there were 30 document results consisting of 22 articles, 3 conference papers, 3 reviews, and 2 books that had been published and indexed by Scopus. Keyword analysis is visualized using the VOS viewer application with co-occurrence type analysis and the unit of analysis “all keywords” with a minimum number of keyword occurrences of ‘2’ out of 380 keywords, 46 of which meet the threshold. The keyword analysis is visualized in Figure 1.
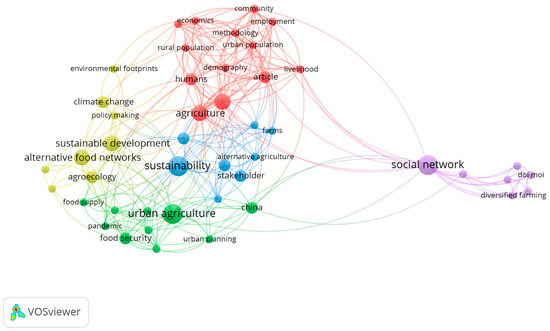
Figure 1.
Network visualization.
In Figure 1, it can be seen that this analysis shows that the network visualization is divided into 5 clusters with 46 keyword nodes. Cluster 1 (red) consists of 13 keywords marked with “agriculture” which is the keyword that has the largest in this cluster. Cluster 2 (green) consists of 10 keywords marked with “urban agriculture”, which is the keyword that is the largest in this cluster. Cluster 3 (blue) consists of eight keywords marked with “sustainability”, which is the keyword that is the largest in this cluster. Cluster 4 (yellow) consists of eight keywords marked with “alternative food network” which is the keyword that is the largest in this cluster. Cluster 5 (purple) consists of seven keywords marked with “social network” which is the keyword that is the largest in this cluster. Based on the bibliometric analysis, research on urban farming associated with policy networks and social networks is still very rarely researched. Therefore, to fill the gap in urban farming research topics, this research is deemed necessary.
Integrated Urban Farming (IUF) is the program from the Bandung City government promoted by the Food Security and Agriculture Office of Bandung City. IUF is an urban farming system that combines components of agriculture, livestock, fisheries, medicinal plants, fruits, and utilization of waste and its products in an integrated whole. This program is intended to empower urban communities to be able to provide their own healthy and natural family food through the use of yards and unproductive land in urban farming activities [22]. IUF policy was regulated by Law No. 18 of 2012 on Food, Government Regulation No. 17 of 2015 concerning Food Security and Nutrition, Government Regulation No. 86 of 2019 on Food Security, and Presidential Regulation No. 22 of 2009 on Policy to Accelerate Diversification of Food Consumption. Based on Local Resources, the Minister of Agriculture Regulation No. 43/permentan/OT.140/10/2009 regarding the Movement to Accelerate the Diversification of Food Consumption Based on Local Resources. It was also regulated by the Decree of the Minister of Agriculture No. 08/KPTS/RC.110/J/01/2-17 on Technical Guidelines for Optimizing the Use of Yard Land through Sustainable Food House Areas. Bandung City Regional Regulation No. 13/2009 regards Improving Urban Agriculture Business, which was then implemented through Bandung Mayor’s Circular Letter No. 520/SE.086-Dispangtan.
3. Methods
This study used a mixed methods approach; mixed method is a research method between quantitative methods and qualitative methods to be used together in a research activity, so that more comprehensive, valid, reliable and objective data are obtained [53,54]. Data from the qualitative and quantitative components can be integrated at the analysis stage of a mixed methods study [55]. A mixed methods approach offers a logical ground, methodological flexibility, and an in-depth understanding of smaller cases [56]. A mixed-methods design offers a number of benefits to approaching complex research issues as it integrates philosophical frameworks of both post-positivism and interpretivism [57]. Mixing two methods might be superior to a single method as it is likely to provide rich insights into the research phenomena that cannot be fully understood by using only qualitative or quantitative methods [58].
The majority of SNA methods were also quantitative, and aimed to visualize social networks and summarize their basic properties [59]. However, the analytical perspective rarely produced a strong explanatory power, as well as only described the power structure and characteristics of the network. This emphasized the need for qualitative data to validate, strengthen, or deepen the understanding of prioritizing the outputs to the problem. Based on the progression of policy network analysis, several scholars highly considered the analysis of the policy theories with statistical models. This was conducted through a mixed methods approach, to test the hypotheses from the policy process theory; the interdependent interactions among actors and the driving forces for network formation should be analyzed and identified, respectively. These analyses were able to determine the most active and important actors, as well as describe the association patterens in policy networks [60].
3.1. Research Design and Strategy
This research used mixed methods with an exploratory sequential strategy, which involved the collection of qualitative data in the first stage. This was accompanied by the collection and analysis of quantitative data in the second stage, regarding the outputs of the initial phase. From these stages, the strategy aimed at using quantitative data and outputs to help interpret the qualitative outcome [53]. The combination of qualitative and quantitative data in this study is in Figure 2 below.
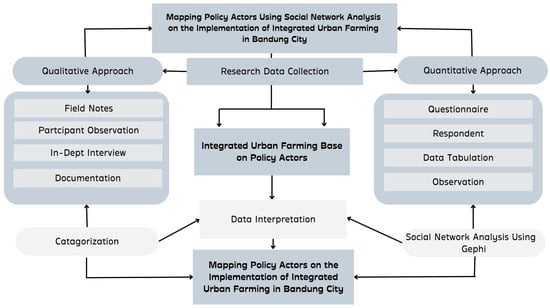
Figure 2.
Flowchart of the methodology.
To identify relevant actors in this survey, we used a combination of decision, position, and reputation approaches [61]. We first identified the actors involved in the IUF Program in Bandung City using the decision approach. This was conducted by examining which actors participated in the implementation of IUF in Bandung City. Although most of the actors involved are government and community, actors from academics, businesses, and mass media who are influential in policymaking are also involved. Therefore, using the positional approach, we added actors who are in strategically important positions such as the government; we also interviewed the main actor, the Food Security and Agriculture Office of Bandung City, to look at other relevant actors using the reputation approach, to be included in the list of respondents. Then, we categorized the identified actors into a list of respondents. The respondents consisted of 38 respondents, where the sample was calculated using the probability cluster sampling method [62]. Cluster sampling or one-stage cluster sampling is a method that uses clusters of respondents to represent the broader population of the targeted sample [63]. The main objective of cluster sampling is the representation of all respondent groups in a particular study [64]. Here is the basic clustering sampling formula that we used:
n = (N/C) × n_c
n = (384/30) × 3
n = 38.4
N: Population size (farmer groups and policy actors)
C: Number of clusters in the population (30 sub-districts)
n_c: Sample size taken from each cluster
n: Total sample size required
We also validated the questionnaire results by reconfirming it with agricultural extension workers at the Food Security and Agriculture Office. Based on the Minister of State Civil Apparatus Empowerment Regulation No. 35/2020, agricultural extension workers have duties and functions as coaches, assistants, technology transfer agents for farmer groups, motivators, mediators, and government facilitators for farmers to improve their agricultural businesses. This means that these agricultural extension workers know the collaboration and interaction that occurs in each farmer group under their duties and funcitions. There are 13 agricultural extension workers at the Food Security and Agriculture Office of Bandung City, where each extension workers holds a minimum of one sub-district and a maximum of three sub-districts.
3.2. Data Collection
In understanding policy network in the IUF Program, qualitative data were needed to determine the phenomena categorizing policy actors. Subsequent analysis was also carried out using quantitative data through SNA to map policy actors. Data were collected using interviews and questionnaires. Qualitative, open-ended, in-depth and structured interviews followed the interview guidelines [65]. Qualitative interviews were conducted with eight informants consisting of government, business, academic, community, and mass media actors (seven informant face-to-face interviews and one informant Zoom interview) during January and February 2023. Each informant was asked the same questions related to actors, functions and structures in the policy network. These interviews provided important contextual understanding and insight into the formal and informal interactions between policy actors during the implementation of The IUF Program in Bandung City.
In this study, the questionnaire was designed to see interaction patterns between policy actors based on the results of previous interviews (See Figure 1). We conducted a survey of the actors involved in the Integrated Urban Farming Program. We conducted the survey using an online tool from Google Forms which was then distributed to 38 respondents. The questionnaire used was a composite questionnaire that combined optional and open-ended responses to further confirm their relationship with other actors involved in the implementation of IUF, such as the relationship between the FGA (Farmer Group Association) of Buruan SAE (community), government, academics, businesses, and mass media. The questionnaire consisted of 12 questions, where we asked respondents to answer questions with which actors they interacted, and with whom they collaborated, to share information in the implementation of the IUF Program. The online survey was sent to 38 potential respondents in February and March 2023. We selected respondents from various actors involved in the implementation of the IUF Program in Bandung City. We stated the purpose of the study and obtained their consent to become respondents (Table 1).

Table 1.
List respondents.
3.3. Data Analysis
In this study, data analysis was carried out by sequentially combining qualitative and quantitative analyses. This indicated that similar steps were used for both analyses. From the interpretation or analysis, the qualitative and quantitative data were reduced and categorized for statistical calculations. These data were then interpreted using triangulation, regarding the resources obtained in the field. Furthermore, data reduction was carried out by grouping and categorizing information according to the study objectives [66]. In this study, qualitative data analysis used descriptive qualitative methods, with the experimental process including the following: (1) Data analysis before field exploration, where secondary information was used to determine the focus of study. (2) Data analysis in the field, where an interactive model was used with informants such as information reduction, presentation, and verification. Meanwhile, quantitative analysis was conducted to determine the most influential actors in theimplementation of Integrated Urban Farming through centrality measurement in SNA [67,68]. In this case, according to Mincer thera are four measurements of centrality were observed, namely, Degree, Betweenness, Closeness and Eigenvector [44].
- Degree Centrality
Degree Centrality was used to valuate the popularity level of actors in social networks. This centrality was useful for determining actors with an important role in collaborative communication, which was obtained through the number of exhibited links. In asymmetric network patterns, centrality was also indegree and outdegree (links leading to and emanating from actors), with symmetrical steps having only one degree value. The degree of centrality was atvalues of 0 and 1, indicating that actors were unconnected and connected to other stakeholders, respectively.
- B.
- Betweenness Centrality
Betweenness centrality was used to show actors as an intermediary between several actors in social network. This served to determine key actors in network, with stakeholders representing intermediaries evaluating the membership of others.
- C.
- Closeness Centrality
Closeness centrality was employed to describe how close an act the bond of actors has with others in social networks. This measure was important due to being considered for determining essential network actors. It was also measured by the number of steps or paths are contacted by actors or other stakeholders in the network.
- D.
- Eigenvector Centrality
Eigenvector centrality was implemented to show the most important actors in a network, regarding the connections possessed by various stakeholders.
4. Results
Based on the analyzed interviews and questionnaires, the most important outputs were emphasized. This perspective was adopted to easily map policy actors and provide an understanding of the contribution patterns of policy networks to the success of the IUF Program in Bandung City.
In these networks, actors were considered individuals, organizations, and groups/parties. According to the in-depth interviews, policy actors formed from the network of farming programs included the penta helix, which involved the government, private, academic, community (NGO), and mass media actors. This was consistent with the following interview outputs:
“For actors, we developed the concept of the penta helix, starting from the government, private sector, academics, community, and mass media, all of whom are involved because this program involves all the people of Bandung City. This is because our main target is to achieve food security”. G1.
“Parahyangan Catholic University, as an academic, is included in the food smart city team in overcoming food security in collaboration with the Bandung city government through Food Security and Agriculture Office. There are international NGOs such as MUFPP, IURC and Rikolto”. A1.
“Rikolto is an international network organization based in Belgium. It is an NGO that is concerned about food problems with the increasing world population. Rikolto actively works with farmer groups to implement sustainable agricultural practices. One of them is the practice of IUF in Bandung City. Rikolto conducts policy networking with Food Security and Agriculture Office as well as Parahyangan Catholic University in developing IUF Program through funding support to Parahyangan Catholic University to conduct a study”. C1.
According to the results, the number of actors collaborating with the government was the strength of the program. In this case, the parties emphasizing the government in the implementation of IUF included the Department of Food Security and Agriculture (main implementor), Environment, Housing and Settlement Areas, Land and Landscaping, Education, Trade, Culture, and Tourism, the Department of Industry, Cooperatives, Small and Medium Enterprises, and Water Resources of West Java Province, sub-districts and urban villages. Regarding the private actors, the parties involved in the implementation of urban farming for banking institutions were BI (Bank Indonesia), BRI (Bank Rakyat Indonesia), and BJB (Bank Jawa Barat). For the state-owned enterprises, PLN (State Electricity Company Limited), Bio Farma and Pindad Limited Company were prioritized, where some of the company land was used for urban farming activities by the natives. Some associations were also found to be networking with supermarkets such as Hypermart and restaurants including Wong Solo Group. From the results Academic actors in the implementation of Integrated Urban Farming were UNPAR (Parahyangan Catholic University), ITB (Bandung Institute of Technology), UNPAD (Padjadjaran University), and UIN (Bandung State Islamic University). The community actors considered the most networking groups also included Neighborhood (RT), Hamlet (RW), Development of family welfare (PKK), Youth Organization (Karang Taruna), Rikolto, MUFPP, IUARCI, and Buruan SAE Community. Meanwhile, all mass media in Bandung City supported the IUF Programs in Bandung City, with positive information conveyed from actors toward the agricultural system.
The existence of interdependence and resource sharing was also an important capital in networking, with the achievement of urban farming implementation goals inseparable from the policy network. From this context, network theory assumed that the relationships of actors were interdependent [69]. In this case, the formation of a policy network was capable of facilitating the achievement of the program. This was in line with the following interview outputs:
“It is important because we cannot run the program by relying only on ourselves but also need cooperation from other parties so that this program can run well and its goals can be achieved”. G2.
“Networking is the strength, it is very important because it becomes an essence of the program. If we want to strengthen and expand the program, the basis is collaboration”. A1.
“Of course, it is important to do policy networking in this program, because it is necessary for the development of a collaboration program. Bank of Indonesia or other banks and other businesses can provide assistance in the form of seeds, fertilizers, and planting media. In the future, the more people who help, the better, and maybe the group will also increase”. B1.
Based on the results, each policy actor had its role and function in a network, such as the government serving as the main implementor and policy maker. The private parties also provided both material and non-material support through CSR, with the academics providing the new concepts and theories developed from analytical outputs. For the community actors, their roles in the implementation of urban farming prioritized the continuous development of the policy network toward the achievement of program objectives. Meanwhile, the mass media stakeholders functioned in delivering information from the government to the community and vice versa. This was supported by the following interview outputs:
“The role of each actor is well when the government is more of policy maker, executor, assistance and development. This is observed when other actors such as the community are the main actors, with the media being the ones to disseminate information and education society. The academics also develop technology and resources, with the private sector providing support through its CSR”. G1.
“Bank Indonesia representatives of West Java, as a banking institution domiciled in Bandung, will certainly support the program from the government. Incidentally, Urban Farming Program is one of the goals of controlling inflation in the city of Bandung so we support this program to achieve. Bank Indonesia provides support in the form of onion and chili plant seeds including 1500 organic tower garden (OTG) planting media to Buruan SAE groups distributed to 30 sub-districts of Bandung City through the Food Security and Agriculture Office in Bandung City”. B1.
“Pikiran Rakyat (PR) FM is part of the mass media whose job is to disseminate information specific to the public, now we make a talk show program, namely Sapa Tani specifically for Buruan SAE where the Head of the Food Security and Agriculture Office is the co-host. Therefore we invite parties who play an important role in this Buruan SAE such as the community and other elements, hence, we as mass media can disseminate information well, with many listeners inspired by the program”. M1.
According to Rhodes, one of the characteristics of the network was the continuous interaction between the members exchanging resources and negotiating with various objectives [38]. From this context, the SNA method was used to determine the interaction patterns between these policy actors. Centrality measurement was also used to determine the structural patterns of network and actors playing the most important roles in network showing the degree of individual focus. In this case, four centrality measurements were observed, namely Degree, Betweenness, Closeness, and Eigenvector [44]. Based on this interaction analysis of actors, SNA processed by Gephi 0.10 software was implemented. This indicates that the processed questionnaire data were imported into the Gephi software with the import setting, “Relation-String”, where 475 nodes/actors were observed with 1179 edges/network. In measuring centrality, the main actors, Bandung City Food Security and Agriculture Office, were eliminated, to avoid its dominance in the existing network. This was accompanied by the measurement of the second actors dominating the network. The following subsequently explains the centrality measurement in SNA.
4.1. Degree Centrality
Degree Centrality was responsible for characterizing actors having the highest level of popularity with indegree and outdegree values [70]. This dimension was determined by the number of edges associated with nodes (Table 2). Based on the results Catholic Parahyangan University (Academics) was the actor with the most connections (60)with Parahyangan Catholic University being one of the Bandung institutions involved in the IUF Program. This indicated that the faculty of social and political science at Parahyangan Catholic University was specifically included in the Food Smart City team working directly with the Government and international NGOs, such as Rikolto, MUFPP, and IURC, in overcoming food problems in Bandung City. The institution also invited 30 Buruan SAE groups representing 30 sub-districts, the Food Security and Agriculture Office, as well as Association of Indonesian Hotels and Restaurants and the Association of Cafes and Restaurants West Java, to attend the FGD (Forum Group Discussion) entitled “Discussion of Business Development Projections for Buruan SAE Products in Bandung City”. This demonstrated that the academic bridge between the government and business actors, for the development of the 335 farmer groups spread across the city. These results were supported by the interview sessions with Parahyangan Catholic University, where the following outputs were provided.
Table 2.
Laboratory Data of Degree Centrality.
“We ourselves have conducted FGDs with discussions on the projection of business development of sae game products in Bandung City, where we invited 30 groups of Buruan SAE, Food Security, and Agriculture Office, Hotel-Restaurant Association of Indonesia and the West Java restaurant cafe association. From the results of the FGD, we hope that Buruan SAE products can later be developed and become high selling points”. A1.
According to the interviews and questionnaires, Parahyangan Catholic University (60) was connected to many actors, including Food Security and Agriculture Office (main actor) government, business, and community. Besides the connection of the institution to the mass media, its connectedness to a network of actors from various categories was also observed in IUF Program in Bandung City. This was accompanied by the degree centrality values of Bank Indonesia, Cicendo sub-district FGA, and Buah Batu sub-district FGA at 54, 40, and 36, respectively. From these results, five communities, three government, one academic, and one business actors had the highest degree of centrality values. This demonstrated that the community actors dominated the degree centrality network in Integrated Urban Farming Program in Bandung City.
Each policy actors had its role and function in the network, with the government, being the main implementor and policymaker. This was accompanied by the private parties providing both material and non-material support through CSR (corporate social responsibility), with the academics producing newly developed concepts and theories, as well as facilitating other program development actors via FGDs. For the community, the important roles possessed in the implementation of urban farming emphasized the continuous development of policy networks and the achievement of program objectives. Meanwhile, the mass media played a role in delivering information from the government to the community and vice versa. These descriptions were supported by the following interview outputs,
“The role of each actor is well when the government is more of policy maker, executor, assistance, and development. This is observed when other actors such as the community are the main actors, with the media being the ones to disseminate information and education to society. The academics also develop technology and resources, with the private sector providing support through its CSR”. G1.
The following are the outputs of network visualization and degree centrality calculation with the “Label Adjust” algorithm layout, with the most dominant actors determined in the estimation of degree centrality (Figure 3).
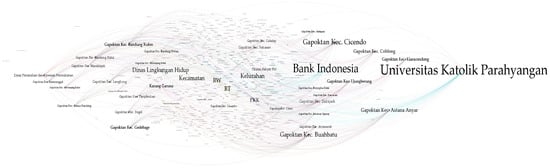
Figure 3.
The Degree Centrality Network Structure.
4.2. Betweenness Centrality
According to Freeman [70] a set of measures was developed based on betweenness Which was a very important measurement when considering flows in a network. In this case, a large betweenness value indicated that actors were directly or indirectly connected to other actors. Furthermore, betweenness emphasized the extent to which a node connected different parts of the network [71]. It also identifies actors serving as information brokers. From this context, the centrality process characterized actors with the best level of rational communication ability, enabling the control of information. Based on the laboratory data, only six actors were observed with the highest value (Table 3) and supported by the betweenness centrality network structure (Figure 4). In this case, has actors having the most direct routes (direct mediation) between two nodes was Parahyangan Catholic University (academics), with the highest level of betweenness centrality (0.001441). This was accompanied by the Bank Indonesia (Business; 0.00121), Pikiran Rakyat FM (Mass media; 0.000694), Environmental Service (Government; 0.000682), Rikolto (NGOs; 0.000167), and Department of Housing and Residential Areas, as well as Land and Landscaping (Government; 0.000112).
Table 3.
Laboratory Data of Betweenness Centrality.
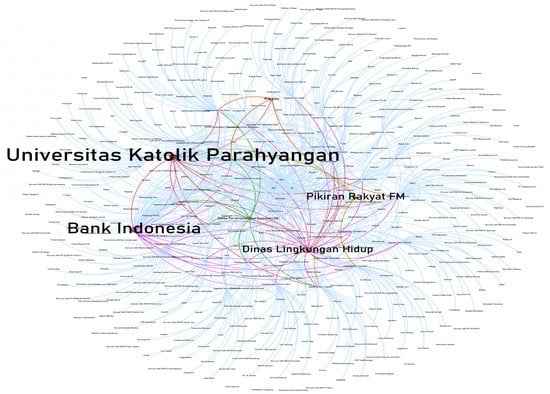
Figure 4.
The Betweenness Centrality Network Structure.
Based on Table 3, Parahyangan Catholic University was an academic actor with direct mediation between two nodes having the best rational communication. This was to enable Parahyangan Catholic University to control information to the main implementor of the program, the Food Security and Agriculture Office, and other actors in IUF Program in Bandung City. From this context, the policy network carried out by Food Security and Agriculture Office was quite strong, due to the importance of Parahyangan Catholic University in the implementation of the IUF Program. This was validated by the measurement of betweenness centrality and degree centrality, where Parahyangan Catholic University had the highest values that other actors. The coordination of the institution with other actors was also continuous in program development efforts, which was supported by the following interview outputs,
“Coordination is not intensively carried out, but we coordinate with meetings or FGDs whatever the activity we always coordinate”. A1.
“Coordination can be formal or non-formal, if formal such as regular meetings such as meetings or discussion of evaluations, discussion of what future development is like. Or non-formal coordination by discussing what future development strategies can be via chat or telephone outside of non-formal communication. With the mayor or regional secretary, with Local Government Organization within the scope of the City of Bandung, if outside the government, well with educational institutions, one of which is Parahyangan Catholic University, if the private sector we are more supporting development in the form of activity assistance”. G1.
From the measurement of betweenness centrality, policy actors serving as information intermediaries in the IUF Program contained various backgrounds, including the academia, private sector, mass media, NGOs, and government. This enabled the effective performance of the communication flow and was supported by the following interview outputs,
“coordination has not been done massively, but so far it is effective, meaning that we can mobilize people or communities, whatever activities we do are always coordinated”. A1.
“I think so far it has been effective, looking at the progress of the existing program, for example, so far the action plan has been implemented thanks to the routine coordination carried out by each actor”. C1.
“The coordination that has been carried out so far has been effective, because in terms of mass media, the burden is more on disseminating useful information, with the dissemination of information from the mass media, the public will know and understand more”. M1.
In the IUF network in Bandung City, the position of these actors will support the speed of the transformation process of information and knowledge for the purpose of program development. In this study, Parahyangan Catholic University, Bank Indonesia, and Pikiran Rakyat FM have a position that mediates the two most significant actors in the IUF Program. So many actors will depend on Parahyangan Catholic University, Bank Indonesia, and Pikiran Rakyat FM in the context of interactions with other actors to obtain the necessary resources related to IUF. The following are the outputs of network visualization and betweenness centrality calculation with the “Fruchterman Reingold” algorithm layout, with the most dominant estimation of betweenness centrality.
4.3. Closeness Centrality
The node (actors) centrality review was based on proximity or distance with closeness indicating the length between two specific actors [71]. This demonstrated that Closeness Centrality was the average distance from a node to all other actors in the network [72]. It also characterized actors as having the shortest rational relationship or fastest path in disseminating information to other nodes. Furthermore, closeness centrality described the patterns by which actors quickly interacted with others in the network. Based on the laboratory data(Table 4) supported by the closeness centrality network structure (Figure 5), the actors with the shortest path was the Cicendo sub-district FGA, which contained 18 Buruan SAE farmer groups. It was also the most popular and dominant group among other sub-districts in Bandung. From this context, Food Security and Agriculture Office (main implementor) was located in Cicendo Sub-district, emphasizing its affordability due to its existence in one area.
Table 4.
Laboratory Data of Closeness Centrality.
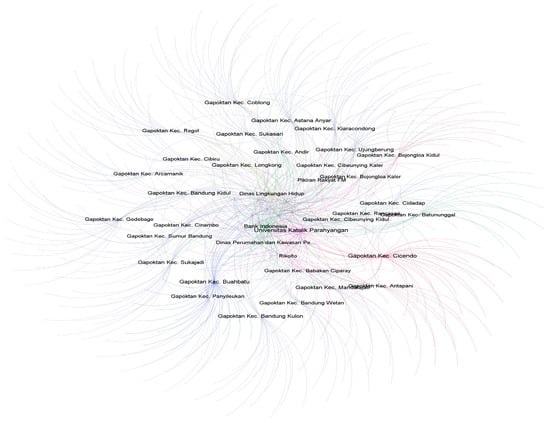
Figure 5.
The Closeness Centrality Network Structure.
According to the processed observations and questionnaire data, the Cicendo sub-district FGA was connected to several policy actors, including the government, such as Food Security and Agriculture Office (main implementor), Environment Service, Communication and Information Service, Culture and Tourism, Health Office, as well as Sub-districts and Villages. The association was also connected to various institutions in Bandung City, such as Parahyangan Catholic and Padjadjaran Universities, as well as the Institute of Technology Bandung. More connections were subsequently found with private parties, including Angkasa Pura and Paint Companies, as well as Bank Indonesia. Furthermore, Cicendo Sub-district FGA was connected to the Community, namely Rikolto, Neighborhood, Hamlet, Development of family welfare, youth organization, and other external Buruan SAE farmer groups. The collaborating mass media also included PR FM, Kompas TV, and Trubus. Based on these results, the Cicendo sub-district FGA had a larger network size compared to FGA in other sub-districts. This enables its prowess as actors capable of reaching and disseminating knowledge and information to other nodes involved in the IUF Program in Bandung City.
Based on Table 4, 9 of the 10 actors with the highest closeness centrality value, emphasized the community, namely the FGA in each sub-district, with the remaining node prioritizing business. This demonstrated that the community actors dominated the closeness centrality network in IUF Program in Bandung City. In this case, the thirty FGA in each sub-district were the main actors in the centrality dimension. This indicated that the association was able to work according to its function, to facilitate the flow of communication/coordination and share the resources between each farmer group in the sub-district. From these observations, the agricultural groups in Integrated Urban Farming Program interacted and exchanged various resources with other associations, regarding plant seeds, fertilizers, and agricultural products. This was due to a sense of mutual understanding and harmony between fellow farmer groups, encouraging stronger ties than other actors.
In the formulation of the Buruan SAE group, the determination of prospective farmers and locations was carried out. From this context, every citizen in Bandung City is prospectively provided with socialization and training regarding Integrated Urban Farming. This was to develop behavioral attitude skills, willingness, enthusiasm, and knowledge, as well as the initiative to establish a Buruan SAE group directly submitted to Urban Village. Moreover, the village was submitted to Food Security and Agriculture Office for the formation of a group consisting of at least 10 people. After the formulation of the Buruan SAE group, field extension officers then provided guidance and assistance from the initial process to evaluation and monitoring. Figure 5 shows network visualization and calculation of closeness centrality with the “Fruchterman Reingold” algorithm layout, to determine the most dominant actors.
4.4. Eigenvector Centrality
Eigenvector Centrality was used to determine the most important actors in a network based on the connections and collaborations possessed [44]. Similar to the degree of centrality, the eigenvector measured the importance of actors in the existing network. Meanwhile, the difference showed that eigenvector centrality was capable of determining the connectivity of other nodes. This illustrated the connection patterns of actors to other nodes, with the measurement exhibiting the importance or value of a stakeholder in the social network. Based on the laboratory data (Table 5) and the eigenvector centrality network structure (Figure 6), Sub-District (Government; 1.0) was actors having a good connection value and levels with other actors in the IUF Program in Bandung City. This was accompanied by Urban Village (Government) and Neighborhood (Community) at 1.0 and 0.996773, respectively. In this case, Sub-districts and Urban Villages were the most important actors in the policy network of integrated farming in Bandung City.
Table 5.
Laboratory Data of Eigenvector Centrality.
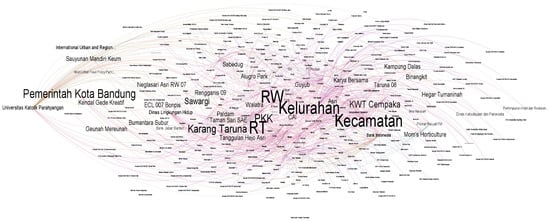
Figure 6.
The Eigenvector Centrality Network Structure.
From the results, the implementation of IUF was greatly influenced by the role of actors from the lowest level of government, namely Sub-districts, and Villages. This was accompanied by RT(Neighborhood) and RW (Hamlet), which were part of the community, indicating the adequate development of the program. At socialization, training, and farmer group formation stages carried out by Food Security and Agriculture Office, adequate participation was also obtained from the Sub-district and Urban Village. This result was validated by the following interview outputs,
“Information delivery is carried out by socialization, counseling, and training to the community in the sub-district or urban village”. G1.
According to the results, the active role of sub-districts and urban villages in the success of the IUF Program was very influential, with the experimental observations indicating that both parties actively coordinated with Food Security and Agriculture Office. This was determined to socialize farming practices to their citizens, toward producing more farmer groups than other sub-districts and urban villages. Cicendo and Coblong sub-districts were also the sub-districts having the highest groups, totaling 18. Meanwhile, the sub-division with the most farmer groups was Sadang Serang (10), which was within Coblong.
Table 5 demonstrated that the government and community actors were only contained in eigenvector centrality. From this context, the implementation of community-based urban farming was self according to centrality measurement. This proved that Neighborhood, Hamlet, Development of family welfare, and Youth Organization were village community organizations tasked with assisting the local government. The organizations were also considered partners in empowering village communities, as stated in the General Provisions emphasizing the explanation of Law Number 6 of 2014 concerning Villages and Article 6 paragraph (1) of the Minister of Home Affairs Regulation Number 18 of 2018 regarding Village Community Institutions.
From the results, Neighborhood, Hamlet, Development of family welfare, and Youth Organization in Bandung City were actors (community) having an important role at the community level. This motivated the city residents to participate in IUF activities until January 2023, when 335 farmer groups were observed in 30 sub-districts and 151 urban villages. The contribution of these community institutions also prioritized the success of the program, leading to continuous development. This was specifically good for learning from other community institutions in Indonesia, concerning the support for government programs. Figure 6 shows network visualization and calculation of eigenvector centrality with the “Lebel Adjust” algorithm layout, to determine the most dominant actors.
5. Discussion
Based on the results, mapping policy actors in Integrated Urban Farming Program in Bandung City provided a clearer picture of the policy network on the roles and functions of other nodes, with whom they interact and share resources. This led to the following question, “Which actors controlled the flow of communication, had the fastest path in disseminating information, and was the most important based on their network?”.The study of policy networks was also carried out in solving the complex problems that were unsolvable by government action [73,74]. This indicates that The IUF Program in Bandung City was able to develop and achieve its goals because the Food Security and Agriculture Office (main implementor) formed an extensive policy network with various stakeholders. These stakeholders consisted of the government, business, academics, community, and mass media. According to the degree and betweenness centrality measurements, Parahyangan Catholic University (academics) was the most central network actor relatively stable between the level of importance and information sharing. This implied that most actors having important roles in communication collaboration also disseminated information in policy center. In the measurement of closeness centrality, Cicendo sub-district FGA was actor with the highest value and fastest path in disseminating information to other nodes. This proved that the community actors dominated the closeness centrality. Meanwhile, the most important actors of eigenvector centrality were at the lowest government level, namely Sub-districts and Urban Villages (government). In this case, the connections owned by both actors reached other nodes, especially the regional farmer groups.
From these results, the knowledge about the positions of degree, betweenness, closeness, and eigenvector centralities in each actor was contacted by other actors in the implementation of the IUF Program in Bandung City. This explained that policy actors had more resource networks to support the realization of food security through IUF. These resources were considered information, technology, expertise, funds, promotion of agricultural products, market opportunities, and government policy. In this case, the connection of more farmer groups to many actors, such as government, private (banks, restaurants, and supermarkets), academics, international NGOs, mass media, and other farmer groups, led to easier patterns to obtain the resources easily, quickly, and effectively needed. These advantages supported the program, especially the farmer groups, in developing their agricultural products to have higher selling power. The diversity of actors having respective functions and roles in The IUF Program also showed that more diverse node types supporting program sustainability caused the easy achievement of objectives. Therefore, Bandung City Government and the Food Security and Agriculture Office, need to consider and develop a policy network as a strategy, for the continuous development of the program. Multi-stakeholder processes were also recognized as a necessity for the improvement of public policy seeking to promote systemic innovation, regarding complex and multidimensional challenges, such as household food security, rural development, and environmental change [75]. In this case, Bandung was the best practice in implementing IUF, with analysis considered useful for the city adopting the program as a solution to the food crisis.
6. Conclusions
Based on the results, Integrated Urban Farming is a policy innovation from the Bandung City Government to overcome food problems. This program had contributed to many issues in the city, such as reducing food inflation, mitigating stunting cases in children, decreasing organic waste, and increasing green open space in Bandung City. The program also obtained different awards at local, national, and international levels, with success especially inseparable from its role and policy actors. After mapping these actors, the Penta helix model (government, private, community, academia, and mass media) is applied in the implementation of the program policy network. According to the centrality measurements on SNA, each actor performed his duties according to the relevant role and function. This demonstrated thatParahyangan Catholic University (academics) importantly helped Food Security and Agriculture Office popular actors having the most network (degree centrality) and communication flow control (betweenness centrality). From this context, actors had a more rational level of communication ability than other actors. The Cicendo sub-district FGA and other sub-district farmer groups were also community actors having the fastest path in disseminating information to other actors (closeness centrality). This is in line with the duties and functions of the FGA as an information intermediary for other regional associations. Moreover, the most important actors (eigenvector centrality) in The IUF policy network are at the lowest government level, namely Sub-district and Urban Villages (government). In this case, the connections owned by both actors reached other nodes, especially regional associations. This indicated that Neighborhood, Hamlet, Development of family welfare, and Youth Organization (community) had high eigenvector values after Sub-districts and Villages. From this context, actors in eigenvector centrality had important roles in mobilizing the community toward contributing to farming program. By recognizing the position of actors, their roles, and functions through the network structure, the government will find it easier to set strategies for future program development efforts.
The involvement and concern of strong policy actors were also needed for active participation in this program, prioritizing the achievement of Bandung as a secured food smart city. The Bandung City Government also needs to expand its policy network, especially with private actors. Although private actors have played a role in accordance with their functions, they have not been maximally involved. Therefore, in the future, the Bandung City Government through the Food Security and Agriculture Office can collaborate with more private actors in Bandung City to implement IUF practices such as in hotels, malls, restaurants, supermarkets, and private companies in other fields. In this study, support also needs to be given to the Buruan SAE farmer group by facilitating agricultural products that are directly distributed to restaurants and supermarkets in Bandung City. This study can contribute to the development of urban agriculture research topics from a policy network perspective. In this study, the results obtained were very important for the local government due to serving as lessons for other Indonesian cities implementing IUF as a solution to food problems. Based on the importance of food issues in urban areas, the question emphasizing the patterns of effectively and efficiently implementing the IUF Program was analyzed and resolved. However, the limitations of the study indicated the sole prioritization of Bandung City, which had the best practices of another city in Indonesia. In this context, future research should assess the patterns by which central-level policy actors intervened on food issues.
Author Contributions
Y.Y.W.: conceptualization, data curation, formal analysis, funding, acquisition, investigation, methodology, project administration, validation, and writing—original draft; N.K.: conceptualization, formal analysis, methodology, resources, supervision, and writing—review and editing; M.D.E.M.: conceptualization, formal analysis, methodology, resources, supervision, writing—original draft, and writing—review and editing; and S.N.: conceptualization, methodology, supervision, validation, and writing—review and editing. All authors have read and agreed to the published version of the manuscript.
Funding
The APC was funded by Padjadjaran University.
Institutional Review Board Statement
Not applicable.
Informed Consent Statement
Not applicable.
Data Availability Statement
Not applicable.
Acknowledgments
Padjadjaran University, Ministry Education, Culture, Research, and Technology (LLDIKTI Area II).
Conflicts of Interest
The authors declare no conflict of interest.
References
- United Nations Department of Economic and Social Affairs. The Sustainable Development Goals Report 2019. United Nations Publ. Issued Dep. Econ. Soc. Aff. 2019, 64. Available online: https://unstats.un.org/sdgs/report/2022/The-Sustainable-Development-Goals-Report-2022.pdf (accessed on 10 August 2022).
- Economist Impacts. Global Food Security Index. 2022. Available online: https://impact.economist.com/sustainability/project/food-security-index/ (accessed on 10 August 2022).
- Food and Agriculture Organization. Food and Agriculture Organization of The United Nations. Food Loss and Waste Database 2021. 2022. Available online: https://www.fao.org/platform-food-loss-waste/flw-data/en/ (accessed on 15 August 2022).
- Badan Pusat Statistik. BPS. Statistik Indonesia 2020; Badan Pusat Statistik Indonesia: Central Jakarta, Indonesia, 2019. Available online: https://www.bps.go.id/ (accessed on 15 August 2022).
- The World Bank. The World Bank: Population, Total-Indonesia. Available online: https://data.worldbank.org/indicator/SP.POP.TOTL?locations=ID (accessed on 15 August 2022).
- Song, S.; Goh, J.C.L.; Tan, H.T.W. Is food security an illusion for cities? A system dynamics approach to assess disturbance in the urban food supply chain during pandemics. Agric. Syst. 2021, 189, 103045. [Google Scholar] [CrossRef]
- Zezza, A.; Tasciotti, L. Urban agriculture, poverty, and food security: Empirical evidence from a sample of developing countries. Food Policy 2010, 35, 265–273. [Google Scholar] [CrossRef]
- Wahdah, L.; Maryono, M. Urban Farming Management System in Semarang City. E3S Web Conf. 2018, 73, 03023. [Google Scholar] [CrossRef]
- Coulibaly, B.; Li, S. Impact of agricultural land loss on rural livelihoods in peri-urban areas: Empirical evidence from sebougou, mali. Land 2020, 9, 470. [Google Scholar] [CrossRef]
- Sastro, Y. Pertanian perkotaan: Peluang, tantangan dan strategi pengembangan. Bul. Pertan. Perkota. 2013, 3, 29–36. [Google Scholar]
- Chandra, A.J.; Diehl, J.A. Urban agriculture, food security, and development policies in Jakarta: A case study of farming communities at Kalideres—Cengkareng district, West Jakarta. Land Use Policy 2019, 89, 104211. [Google Scholar] [CrossRef]
- Bisaga, I.; Parikh, P.; Loggia, C. Challenges and opportunities for sustainable urban farming in South African low-income settlements: A case study in Durban. Sustainability 2019, 11, 5660. [Google Scholar] [CrossRef]
- Cahya, D.L. Analysis of Urban Agriculture Sustainability in Metropolitan Jakarta (Case Study: Urban Agriculture in Duri Kosambi). Procedia Soc. Behav. Sci. 2016, 227, 95–100. [Google Scholar] [CrossRef]
- Santoso, E.B.; Ratna Widya, R. Gerakan Pertanian Perkotaan Dalam Mendukung Kemandirian Masyarakat Di Kota Surabaya. Semin. Nas. Cities 2014, 16, 11. Available online: https://www.researchgate.net/profile/Eko_Santoso5/publication/327656716_Gerakan_Pertanian_Perkotaan_Dalam_Mendukung_Kemandirian_Masyarakat_Di_Kota_Surabaya/links/5b9c3c6fa6fdccd3cb57a0ff/Gerakan-Pertanian-Perkotaan-Dalam-Mendukung-Kemandirian-Masyarakat-D (accessed on 5 September 2022).
- Handayani, W.; Nugroho, P.; Hapsari, D.O. Kajian potensi pengembangan pertanian perkotaan di kota semarang. Riptek 2018, 12, 55–68. Available online: https://riptek.semarangkota.go.id/index.php/riptek/article/view/10/10 (accessed on 5 September 2022).
- Abdullah; Dirawan, G.D.; Pertiwl, N. Sustainability of ecology and economics of urban farming development: Case study in Makassar city, South Sulawesi Province, Indonesia. Ecol. Environ. Conserv. 2017, 23, 106–111. [Google Scholar]
- Alfian, R.; Darmawan, H.; Nailufar, B. Pertanian Perkotaan Organik di Kecamatan Cemoro Kandang, Kota Malang, Jawa Timur. J. Akses Pengabdi. Indones 2018, 3, 90. [Google Scholar] [CrossRef]
- Hamzens, W.P.S.; Moestopo, M.W. Pengembangan Potensi Pertanian Perkotaan Di Kawasan Sungai Palu. J. Pengemb. Kota 2018, 6, 75. [Google Scholar] [CrossRef]
- Rizkhy, P.P.; Widianingsih, I.; Pancasilawan, R. Adaptasi program ketahananan pangan terhadap pandemi COVID-19 di kota bandung pendahuluan SAR-CoV-2 dengan cepat penting kehidupan lainnya, salah satunya adalah ketersediaan pangan. Ketahanan pangan menjadi salah satu perhatian tata kelola, mengingat p. JANE J. Adm. Negara 2022, 13, 195–201. [Google Scholar]
- Sampeliling, S.; Sitorus, S.R.P.; Nurisyah, S.; Pramudya, B. Kebijakan Pengembangan Pertanian Kota Berkelanjutan: Studi Kasus di DKI Jakarta. Anal. Kebijak. Pertan. 2016, 10, 257. [Google Scholar] [CrossRef]
- Abdullah, O.S.; Cahyandito, M.F.; Safitri, K.I. Buruan Sae in the city of Bandung: Realizing ideas from urban society. IOP Conf. Ser. Earth Environ. Sci. 2021, 918, 012051. [Google Scholar] [CrossRef]
- Dinas Ketahanan Pangan dan Pertanian. Dinas Ketahanan Pangan dan Pertanian Kota Bandung. Available online: https://buruansae.bandung.go.id/index.php/urban-farming/ (accessed on 10 August 2022).
- Open Data Jabar Prov; Kasus Stunting. 2022. Available online: https://opendata.jabarprov.go.id/id/dataset (accessed on 10 August 2022).
- Howlett, M.; Rayner, J. DO Ideas Matter? Policy Network Configurations and Resistance to Policy Change in the Canadian Forest Sector. Can. Public Adm. 1995, 38, 382–410. [Google Scholar] [CrossRef]
- Carayannis, E.G.; Campbell, D.F.J. Triple helix, Quadruple helix and Quintuple helix and how do Knowledge, Innovation and the Environment relate to Each other? A proposed framework for a trans-disciplinary analysis of sustainable development and social ecology. Int. J. Soc. Ecol. Sustain. Dev. 2010, 1, 41–69. [Google Scholar] [CrossRef]
- Aerni, P.; Rae, A.; Lehmann, B. Nostalgia versus Pragmatism? How attitudes and interests shape the term sustainable agriculture in Switzerland and New Zealand. Food Policy 2009, 34, 227–235. [Google Scholar] [CrossRef]
- Oswald Beiler, M. Organizational sustainability in transportation planning: Evaluation of multi-jurisdictional agency collaboration. J. Transp. Geogr. 2016, 52, 29–37. [Google Scholar] [CrossRef]
- Levkoe, C.Z.; Schiff, R.; Arnold, K.; Wilkinson, A.; Kerk, K. Mapping Food Policy Groups. Can. Food Stud./La Rev. Can. Études sur l’alimentation 2021, 8, 48–79. [Google Scholar] [CrossRef]
- Blom-Hansen, J. A “new institutional” perspective on policy networks. Public Adm. 1997, 75, 669–693. [Google Scholar] [CrossRef]
- Dunn, W.N. Public Pollicy Analysis An Integrated Approach, 6th ed.; Routledge: New York, NY, USA, 2018. [Google Scholar]
- Budyantoro, R.A.R. Analisis Jejaring Kebijakan dalam Pengelolaan Sistem Irigasi Colo Sebagai Bagian dari Sistem Sumber Daya Air Wilayah Sungai Bengawan Solo (Studi Kasus di Kabupaten Sukoharjo). J. Polit. Gov. Stud. 2013, 0, 80–95. [Google Scholar]
- Suwitri, S. Jejaring Kebijakan Dalam Perumusan Kebijakan Publik-Suatu Kajian Tentang Perumausan Kebijakan Penangggulangan Banjir dan Rob Pemerintah Kota Semarang. J. Deleg. J. Ilmu Adm. 2008, 42, 2934–2947. [Google Scholar]
- Thatcher, M. The development of policy network analyses: From modest origins to overarching frameworks. J. Theor. Polit. 1998, 10, 389–416. [Google Scholar] [CrossRef]
- Sudirman, R. Jaringan Kebijakan Publik dalam Implementasi Program Pusat Kesejahteraan Sosial Anak Integratif Sikamaseang di Kabupaten Gowa. Public Adm. J. 2022, 8, 207–222. [Google Scholar] [CrossRef]
- Rukmana, N. Analisis Governance Network Dalam Jaringan Implementasi Kebijakan Ketahanan Pangan di Kabupaten Bone. Doctoral Dissertation, Universitas Hasanuddin, Makassar, Indonesia, 2020; pp. 1–179. [Google Scholar]
- Kenis, P.; Schneider, V. Policy Networks and Policy Analysis: Scrutinizing a New Analytical Toolbox. In Policy Networks: Empirical Evidence and Theoretical Considerations; Campus Verlag: New York, NY, USA, 1991; pp. 25–26. [Google Scholar]
- Kickert, E.H.; Klijn, J.F.M.K. Managing ComplexNetworks: Strategies for the Public Sector; Sage Publications: London, UK, 1997. [Google Scholar]
- Rhodes, R.A.W. Policy Networks: A British Perspective. J. Theor. Polit. 1990, 2, 293–317. [Google Scholar] [CrossRef]
- Waarden, F. Van Dimensions and types of policy networks. Eur. J. Polit. Res. 1992, 21, 29–52. [Google Scholar] [CrossRef]
- Wang, G.X. Policy network mapping of the universal health care reform in Taiwan: An application of social network analysis. J. Asian Public Policy 2013, 6, 313–334. [Google Scholar] [CrossRef]
- Fischer, M. Social Network Analysis and Qualitative Comparative Analysis: Their Mutual Benefit for the Explanation of Policy Network Structures. Methodol. Innov. Online 2011, 6, 27–51. [Google Scholar] [CrossRef]
- Scott, J. Social Network Analysis: A Handbook, 2nd ed.; Sage Publications: London, UK, 2000. [Google Scholar]
- Brandes, U.; Kenis, P.; Wagner, D. Communicating centrality in policy network drawings. IEEE Trans. Vis. Comput. Graph. 2003, 9, 241–253. [Google Scholar] [CrossRef]
- Mincer, M.; Niewiadomska-Szynkiewicz, E. Application of social network analysis to the investigation of interpersonal connections. J. Telecommun. Inf. Technol. 2012, 2012, 83–91. [Google Scholar]
- Freeman, L.C. A Set of Measures of Centrality Based on Betweenness. Sociometry 1977, 40, 35. [Google Scholar] [CrossRef]
- Bastian, M.; Heymann, S.; Jacomy, M. Gephi: An Open Source Software for Exploring and Manipulating Networks Visualization and Exploration of Large Graphs. Proc. Int. AAAI Conf. Web Soc. Media 2009, 3, 361–362. [Google Scholar] [CrossRef]
- Popp, J.; Balogh, P.; Oláh, J.; Kot, S.; Rákos, M.H.; Lengyel, P. Social network analysis of scientific articles published by food policy. Sustainability 2018, 10, 577. [Google Scholar] [CrossRef]
- Ndeinoma, A.; Wiersum, K.F.; Arts, B. The Governance of Indigenous Natural Products in Namibia: A Policy Network Analysis. Environ. Manag. 2018, 62, 29–44. [Google Scholar] [CrossRef]
- Majeed, S.; Uzair, M.; Qamar, U.; Farooq, A. Social Network Analysis Visualization Tools: A Comparative Review. In Proceedings of the 2020 IEEE 23rd International Multitopic Conference (INMIC), Bahawalpur, Pakistan, 5–7 November 2020. [Google Scholar] [CrossRef]
- Chisanga, D.; Keerthikumar, S.; Mathivanan, S.; Chilamkurti, N. Network tools for the analysis of proteomic data. Methods Mol. Biol. 2017, 1549, 177–197. [Google Scholar] [CrossRef]
- Putera, P.B.; Suryanto, S.; Ningrum, S.; Widianingsih, I.; Rianto, Y. Three Decades of Discourse on Science, Technology and Innovation in National Innovation System: A Bibliometric Analysis (1990–2020). Cogent Soc. Sci. 2022, 8, 2109854. [Google Scholar] [CrossRef]
- Donthu, N.; Kumar, S.; Mukherjee, D.; Pandey, N.; Lim, W.M. How to conduct a bibliometric analysis: An overview and guidelines. J. Bus. Res. 2021, 133, 285–296. [Google Scholar] [CrossRef]
- Cresswell. Research Design: Qualitative, Quantitative, Mixed Methods; SAGE Publications Inc.: California, CA, USA, 2014; Volume 4. [Google Scholar]
- Patricia, L. Research Design, Quantitative, Qualitative, Mixed Methods, Arts-Based and Community-Based Participatrory Research Approaches; Guilford Publications: New York, NY, USA, 2017; Available online: https://www.ptonline.com/articles/how-to-get-better-mfi-results (accessed on 16 January 2023).
- O’Cathain, A.; Murphy, E.; Nicholl, J. Three techniques for integrating data in mixed methods studies. BMJ 2010, 341, 1147–1150. [Google Scholar] [CrossRef] [PubMed]
- Maxwell, J.A. Expanding the History and Range of Mixed Methods Research. J. Mix. Methods Res. 2016, 10, 12–27. [Google Scholar] [CrossRef]
- Fetters, M.D. “Haven’t We Always Been Doing Mixed Methods Research?”: Lessons Learned From the Development of the Horseless Carriage. J. Mix. Methods Res. 2016, 10, 3–11. [Google Scholar] [CrossRef]
- Dawadi, S.; Shrestha, S.; Giri, R.A. Mixed-Methods Research: A Discussion on its Types, Challenges, and Criticisms. J. Pract. Stud. Educ. 2021, 2, 25–36. [Google Scholar] [CrossRef]
- Creutzburg, L.; Lieberherr, E. To log or not to log? Actor preferences and networks in Swiss forest policy. For. Policy Econ. 2021, 125, 102395. [Google Scholar] [CrossRef]
- Ramcilovic-Suominen, S.; Lovric, M.; Mustalahti, I. Mapping policy actor networks and their interests in the FLEGT Voluntary Partnership Agreement in Lao PDR. World Dev. 2019, 118, 128–148. [Google Scholar] [CrossRef]
- Knoke, D. Policy Networks; The SAGE Handbook of Social Network Analysis; SAGE: Newbury Park, CA, USA, 2011; Volume 144. Available online: http://www.ncbi.nlm.nih.gov/pubmed/10899641 (accessed on 23 January 2023).
- Carlin, J.B.J.H. Design of cross-sectional surveys using cluster sampling: An overview with Australian case studies. Aust. N. Z. J. Public Health 1999, 23, 546–551. [Google Scholar] [CrossRef]
- Hoshaw-Woodard, S.; World Health Organization. Description and Comparison of the Methods of Cluster Sampling and Lot Quality Assurance Sampling to Assess Immunization Coverage. 2001. Available online: www.who.int/vaccines-documents/ (accessed on 23 January 2023).
- Adolfsson, A.; Ackerman, M.; Brownstein, N.C. To cluster, or not to cluster: An analysis of clusterability methods. Pattern Recognit. 2019, 88, 13–26. [Google Scholar] [CrossRef]
- Sutopo, H. Metode Penelitian Kualitatif: Teori dan Aplikasi Dalam Penelitian; Bumi Aksara: Jakarta, Indonesia, 2006. [Google Scholar]
- Miles, M.B.; Huberman, A.M. Qualitative Data Analysis, 2nd ed.; SAGE: Newbury Park, CA, USA, 1994; Volume 1304. [Google Scholar]
- Rowley, T.J. Moving Beyond Dyadic Ties: A Study of Structural Influences in Stakeholder Networks. Univ. Pittsburgh 1998, 22, 887–910. [Google Scholar]
- Brass, D.J.; Burkhardt, M.E. Potential Power and Power Use: An Investigation of Structure and Behavior. Acad. Manag. J. 1993, 36, 441–470. [Google Scholar] [CrossRef]
- Huda, U.; Ahdiyana, M. Jenjaring Kebijakan dalam Pelaksanaan Pengembangan Pasar Tradisional di Kabupaten Bantul. J. Adinegara 2016, 5, 1689–1699. [Google Scholar]
- Freeman, L.C. The Development of Social Network Analysis. United States of America, 2004. Available online: https://repositories.lib.utexas.edu/handle/2152/14886 (accessed on 13 March 2023).
- Vera, E.R.; Schupp, T. Network analysis in comparative social sciences. Comp. Educ. 2006, 42, 405–429. [Google Scholar] [CrossRef]
- Otte, E.; Rousseau, R. Social network analysis: A powerful strategy, also for the information sciences. J. Inf. Sci. 2002, 28, 441–453. [Google Scholar] [CrossRef]
- Howlett, M. Do Networks Matter? Linking Policy Network Structure to Policy Outcomes. Can. J. Polit. Sci. Burn. 2002, 35, 235–267. [Google Scholar] [CrossRef]
- Coleman, W.D. Internationalized Policy Environments and Policy Network Analysis. Polit. Stud. 1999, 47, 691–709. [Google Scholar] [CrossRef]
- Saint Ville, A.S.; Hickey, G.M.; Phillip, L.E. How do stakeholder interactions influence national food security policy in the Caribbean? The case of Saint Lucia. Food Policy 2017, 68, 53–64. [Google Scholar] [CrossRef]


Disclaimer/Publisher’s Note: The statements, opinions and data contained in all publications are solely those of the individual author(s) and contributor(s) and not of MDPI and/or the editor(s). MDPI and/or the editor(s) disclaim responsibility for any injury to people or property resulting from any ideas, methods, instructions or products referred to in the content. |
© 2023 by the authors. Licensee MDPI, Basel, Switzerland. This article is an open access article distributed under the terms and conditions of the Creative Commons Attribution (CC BY) license (https://creativecommons.org/licenses/by/4.0/).