Abstract
Urban commuting characteristics have important implications for both the spatial planning and governance of cities. However, the traditional methods of surveying the characteristics of commuting are very time- and labour-intensive, with the results susceptible to subjective influences. In this work, taking the central city of Nanning as the research object, the commuting space of the population was constructed on the grid-block-subdistrict scale, and the distribution characteristics of the commuting space were systematically analysed. In addition, the influencing factors of the commuting volume were explored by combining multi-source and spatiotemporal data with a geodetector. From our analysis, it was demonstrated that the population density in the central city of Nanning showed a spatial distribution pattern of “decaying distance from the city centre”, with a weak agglomeration effect of large-scale commuters at the grid scale and a larger east-west than north-south commuter scale. At the block scale, large-scale commuters were more concentrated, and the commuting distances were shorter in areas with large commuter populations. At the subdistrict scale, the internal commuting population was also more than the cross-subdistrict commuting population, with more cross-subdistrict commuting flows and an uneven distribution of the flow sizes, with most commuters concentrating on two or three subdistricts for commuting. Various important factors that affect the size of the commuting population should be controlled, including the permanent population, residential distribution, medical facilities, recreational facilities, food services and workplace distribution; the interactions between the permanent population, the residential distribution and the house price factors have the strongest impact values. Our work provides valuable insights for the understanding of commuting patterns in cities and can be used as a scientific basis for urban spatial decision-making.
1. Introduction
In recent decades, China has experienced the fastest and largest urbanisation process in the history of the world. The socio-economic development has continued, and the urban population has rapidly grown, with the urbanisation rate of the resident population exceeding 65%. Nonetheless, the rapid development of cities and population growth has brought about a series of “urban diseases”, such as traffic and population congestion and resource shortages. Scientific and rational territorial spatial planning is an effective means to solve “urban diseases”, while an accurate understanding of the urban operating conditions is a prerequisite for rational planning. Commuting is considered one of the key indicators of urban habitat quality; it refers to the process of travelling to and from one’s place of residence to one’s place of work [1]. The commuting space reflects the spatial extent of commuting connections and is also an important part of the urban space. Commuting is becoming increasingly dynamic and complex in cities, and urban problems, such as traffic congestion and the separation of jobs and residences, are becoming increasingly prominent [2]. The commuting behaviour of urban residents has always been an important concern for urban spatial planning and land resource allocation. By identifying and analysing the spatial characteristics of commuting in the central city, urban planning and management departments can improve the urban transport network and public transport configuration in a targeted manner to enhance commuting efficiency. They can also reduce commuting distances by optimising the spatial layout of jobs and residences. For these reasons, urban commuting has long been of interest and importance to urban researchers [3,4,5].
Traditional commuting behaviour studies include sample travel questionnaires, population censuses and the collection of traffic information. However, they are connected with several problems, such as high costs, long lead times, poor real-time performance, small samples and unrepresentative data. Sample travel surveys mostly use a sampling rate of 3%–4% to investigate the commuting behaviour of urban residents [6]. Due to the large population base of cities, the data obtained are very large and difficult to handle [4]. The population census is usually conducted once every 10 years and cannot dynamically reflect the current population distribution. As a result, the development of an intelligent transportation technology could provide convenient means of collecting traffic information, including via fixed facilities on the road, such as coils, video and infrared detectors, as well as dynamic collection, such as AVL (Automatic Vehicle Location), AFC (Automatic Fare Collection System) for public transport and ETC (Electronic Non-Stop Charging System) [7,8]. However, as the coverage of data acquired through intelligent transportation is limited by the deployment of equipment monitoring networks and the diverse travel patterns of citizens, this type of approach may not fully reflect the spatial characteristics and real scale of commuting in cities.
The development and popularity of mobile IoT (Internet of Things) and big data have generated massive amounts of mobile trajectory data, bringing new ideas for monitoring the state of urban operations [9]. Location Big Data has been increasingly applied to the study of urban residents’ activities, including the use of bus card swipe data to identify the residence, employment and commuting trips of bus card holders [10], the use of Twitter data [11,12], Weibo check-in data [13] and Baidu index [14] to analyse the employment, residence and commuting characteristics of cities to obtain their spatial structure characteristics. However, the location-based big data, such as bus card swipe data, Weibo travel and Baidu index, have random sampling and an incomplete trajectory; only the moment-to-moment data from check-ins when users actively record them are generated. Therefore, information on the population’s commuting behaviour in the study area cannot be objectively reflected.
Currently, mobile communication terminals are popular. Mobile phone data have the comparative advantages of large data volume, wide-coverage, real-time, good objectivity, high positioning accuracy and trajectory continuity, so they are being favoured by many studies in the literature, offering a new data source for studying the characteristics of residents’ activities [15]. Numerous works have been conducted on population distribution [16,17], commuting characteristics [18], spatial association [19], urban centres areas [20] and the identification of urban functional units [21] using mobile phone data. Zagatti et al. used mobile phone detailed records (CDR) to estimate the origin and destination of urban commuting patterns [22]. Moreover, Sakamanee et al. proposed a method for inferring commuter trip route selection based on mobile phone data [23]. Ahas et al. utilised mobile phone data to analyse commuter trip characteristics in terms of the number of trips, commuter trip distance, commuter trip time consumption and commuter trip speed [24]. In another interesting work, Jiang used mobile phone data to examine human spatial mobility patterns using Singapore as an example [25]. Lu et al. employed a Kriging model to quantitatively assess the spatial autocorrelation of the population density based on mobile phone communication record data to construct an algorithm for identifying the traffic travel characteristics of mobile phone users [26]. Pintér et al. used mobile network data to estimate home and work locations [27] and to analyse commuting in the Budapest metropolitan area [28]. Šveda used mobile phone data to study the spatial variation of distance decay effect on movements in urban space [29]. Zhao et al. used mobile phone data to study the characteristics of population mobility between cities in the Beijing-Tianjin-Hebei region of China [30]. Mobile phone data have also been used by other works to identify commuting spaces and further study the spatial structure and land use patterns of cities [31]. Ma analysed the structure of the residential-recreational network in Shenyang based on mobile phones, points of interest (POI) and user survey data [15]. Xiao used mobile phone data to study the degree of multicentricity within the city of Shanghai [32]. Yan used mobile phone data to study a method of identifying urban employment centres using Shanghai as an example [33]. Sebastián also used mobile phone data to study urban land use patterns using Santiago, Chile, as an example [34].
From the above-mentioned analyses, it can be inferred that big data based on location services are increasingly employed in the study of residents’ travel and commuting behaviour [35], whereas mobile phone data have become the mainstream form of studying the commuting space in terms of commuting travel patterns [36], commuting spatial distribution characteristics [37] and commuting links [38]. However, the existing works in the literature have the following shortcomings: (1) the characteristics of urban commuting are usually studied from a single spatial scale which cannot comprehensively reflect the spatial characteristics of commuting; (2) the influencing factors of commuting volume have been scarcely explored and further improvement is needed for supporting urban spatial decision-making. This paper aims to use advanced spatiotemporal information technology to reveal the spatial characteristics of commuting in the central city and the factors influencing commuting volume. In this work, taking Nanning City as an example, the spatial characteristics of commuting in the central city from multiple scales based on mobile phone data were thoroughly analysed. Multi-source data, such as the resident population, POI, OSM, house prices and land use, were also combined to explore the main factors influencing the scale of commuting in the central urban area of Nanning. In the second part of this work, an introduction to the study area and data are presented, whereas, in the third part, the methodology of the study is introduced. The fourth part provides the results of the study, and the fifth presents the discussion, followed by the conclusions.
2. Study Area and Data
2.1. Study Area
Nanning is the capital of the Guangxi Zhuang Autonomous Region, which is located in the south of Guangxi, in the subtropical region of southern China. Nanning is the economic, educational and cultural centre of Guangxi, the core city of the Beibu Gulf Economic Zone, and an important gateway city for the organic connection of the “One Belt, One Road.” The central urban area within the outer ring highway of Nanning City was selected here as the study area, including Xixiangtang District, Qingxiu District, Jiangnan District, Xingning District, Liangqing District, and Yongning District, with a study area of about 902 km2, as shown in Figure 1.
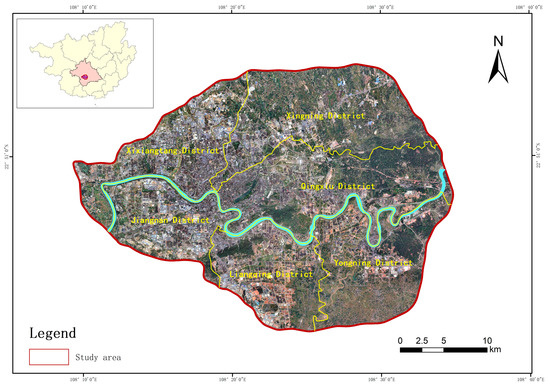
Figure 1.
The study area within Nanning City.
2.2. Data
Mobile phone data were obtained from China Mobile Communications Group Guangxi Ltd., and communication data were generated by China Mobile subscribers in Nanning on weekdays in March 2017. Each mobile phone data point contained an anonymous subscriber number, timestamp, communication base station location number, event type (e.g., receiving a call, receiving an SMS and location update), longitude and latitude information. The original mobile phone data obtained for the study area consisted of 6.8 billion entries, including 9645 mobile communication base stations. Tyson polygons were also used to represent the service area of communication base stations, which were densely distributed in the urban centre and sparsely distributed in other areas. The location distribution and coverage of base stations are depicted in Figure 2.
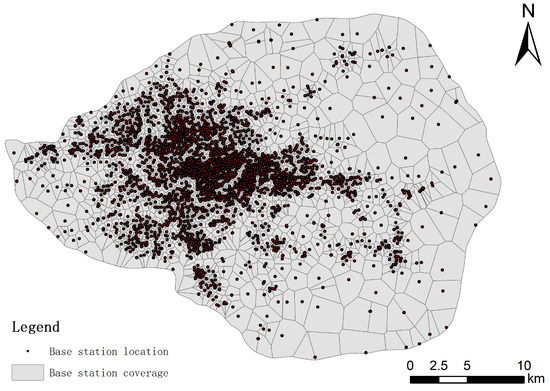
Figure 2.
Spatial distribution of mobile communication base stations.
The POI data were crawled through the web from Gaode Map’s Points of Interest. The selected POI data categories include bus stops, entertainment, medical, company and residential. The road network vector data were sourced from the Open Street Map platform. Land use data were obtained from Landsat8 remote sensing images provided by the USGS website. The house price data were obtained from the “HomeLink” website—after data cleaning and coordinate conversion, a total of 2767 housing samples were obtained, which contained information such as district name, district address, house sale price, building type and coordinate location. The data sources and data types used in this paper are shown in Table 1.

Table 1.
Sources and types of data.
3. Methods
3.1. Overall Design
Firstly, the acquired mobile phone data were cleaned to remove duplicate, redundant data and erroneous data. Secondly, the cleaned mobile phone data were used to identify the resident population and analyse the distribution characteristics of the resident population in the study area; the commuter population was extracted from the mobile phone data by the occupancy algorithm and the distribution characteristics of the commuter space were analysed from the grid scale, block scale and subdistrict scale. Thirdly, the POI data, OSM data, house price data and satellite remote-sensing data were processed and analysed to construct the urban facilities factor, road network factor, house price factor and land use type factor. Finally, the above factors are combined with the commuting distance factor and the resident population distribution factor to analyse the factors influencing the volume of commuting in the central city based on geodetector. The technical process is shown in Figure 3.
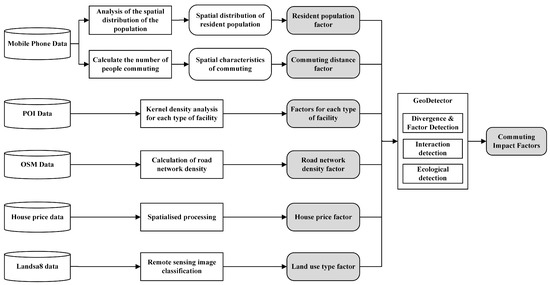
Figure 3.
Overall technical flow.
3.2. Clean Mobile Phone Data
To remove duplicate, redundant data and erroneous data, duplicate rows of data where the location time, user number and location number are all the same were removed. Data from mobile phone base stations with missing fields or abnormal fields in the query table were removed. Data for non-corresponding base stations were removed where base station user activity exceeded the coverage area of the regional base station, resulting in some mobile phone data not corresponding to them. For field abnormal data removal, when the mobile phone data of the failure type were in the communication event type, and the location located does not necessarily reflect the real location of the user, this needs to be removed.
3.3. Acquiring Spatial Characteristics of Commuting
In this work, the temporal and spatial locations of mobile phone data were used to identify the place of work and residence of the population [25,33]. The rules for extracting the place of work and residence are: if more than 60% of the working days in a month occurred in the same fixed area between 1:00 and 5:00, the area was considered to be the place of residence of the mobile phone user. If more than 60% of the working days in a month occurred in the same fixed area between 09:00 and 17:00, the area was considered to be the mobile phone user’s place of work. A total of 1,035,000 commuters were extracted from the study area based on the workplace identification rule.
Constructing the employment-dwelling origin-destination (OD) method [39,40]: centroids were extracted from the grid-scale, block-scale, and subdistrict-scale study cells, and the centroids of each pair of employment-dwelling places were cyclically matched. The matched points are connected to form the OD contact line of mobile phone users. The same OD (place of residence/place of employment) where the same user behaviour occurs was considered the same employment commuting path, as displayed in Figure 4.
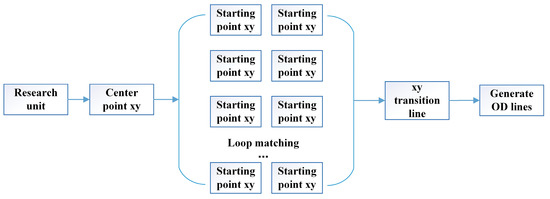
Figure 4.
Identifying commuter links.
3.4. Calculating the Resident Population
The number of permanent residents is regarded as one of the factors influencing the number of commuters. In this work, mobile phone data were analysed to classify the average number of people in the 1:00 study unit on weekdays as the number of permanent residents. More specifically, the block was used as the study unit, and the population distribution was calculated by analysing the spatial relationship between the mobile communication base stations and the block. The Tyson polygon [41] generated from a mobile communication base station was the service area of that base station; the number of subscriber signals recorded by the base station was the number of subscribers in the service area. Two topological relationships between the block and the mobile base station service area (Tyson polygon) were observed, i.e., intersecting or contained. If contained, then the entire population of the mobile base station is located within the block.
If a block forms an intersection with a Tyson polygon, the total number of people in the intersecting section can be calculated using the ratio-area decomposition method. The ratio-area decomposition method involves calculating the proportion of the area of the intersecting part to the Tyson polygon and using the resulting proportion to allocate the total number of people in the Tyson polygon to obtain the number of people in the intersecting part, which was calculated as shown in Equation (1):
where SI denotes the area of the part of the Tyson polygon that intersects the block, ST refers to the area of that Tyson polygon, Pj represents the number of people contained within the Tyson polygon, and Pb states the number of people in the part of the block that intersects the service area of the mobile base station.
The total population contained within the block was calculated according to formula (2).
In Equation (2), POP is the number of permanent residents in the block, Pa stands for the number of permanent residents in the Tyson polygon contained with the block, Pb represents the number of permanent residents in the Tyson polygon intersecting the block, m denotes the number of Tyson polygons contained in the block, and n states the number of Tyson polygons intersecting the block.
3.5. Exploring the Factors Influencing Commuting Volume Based on Geodetectors
Geodetectors are tools for detecting and exploiting spatial heterogeneity. In this work, geodetectors were used to explore the density distribution of each driving factor in relation to the degree of influence on commuting [42]. The variables of the geodetector include the independent variable X and the dependent variable Y. The independent variable is a type quantity, and the dependent variable can be a data type variable. The factors selected for influence in this work were the road network density factor, the bus stop factor, the recreational facilities factor, the medical facilities factor, the workplace distribution factor, the residential distribution factor, the food service factor, the house price factor, the commuting distance factor, the land use type factor and the resident population factor, presented in Table 2.
Table 2.
Types of dependent variables.
The road network density factor was calculated by dividing the OSM road length by the study unit area. The bus stop factor, recreational facilities factor, medical facilities factor, workplace distribution factor, residential distribution factor and food service factor were obtained by kernel density analysis using POI [43]. The commuting distance factor refers to the OD distance calculated using mobile phone data. The land use type factor stands for the land use data of Nanning City after including the types of arable land, garden land, forest land, grassland, urban land, transportation land, public service facility land, water and other land using Landsat8 remote sensing image data, combined with supervised classification [44] and manual correction methods. The house price factor denotes the average house price within a unit obtained by using the chain house price data.
When using the geodetector for analysis, the independent variables need to be type variables, while if the independent variables are numeric data, they need to be further discretized. Except for the land use type factor, which is a type quantity, all other independent variable factors were numerical and required further data discretization. Exploring the influencing factors of commuting volume based on divergence and factor detection, and interaction detection.
Divergence and factor detection indicate the detection of the spatial divergence of the commuting quantity Y and the extent to which each factor X explains the spatial divergence of Y. The degree of explanation was measured by the q-value, which was calculated as shown in Equation (3).
where L in Equation (3) is the stratification of the independent or dependent variable, i.e., classification and partitioning, and represent the number of cells in stratum h and the whole region, respectively and and denote the variance of the dependent variable in stratum h and the whole region, respectively. Furthermore, SSW and SST state the sum of the variance within the stratum and the total variance of the whole region, respectively, which were calculated as shown in Equations (4) and (5). The q values were in the range of (0,1). A larger q value indicates the explanatory power of the independent variable on the spatial variance of the dependent variable. A higher q value indicates the ability of the independent variable to explain the spatial variance of the dependent variable.
Interaction detection is the analysis of the extent to which the joint action between two independent variables affects the dependent variable Y. In other words, it assesses whether the factors X1 and X2, when acting together, increase or decrease the explanatory power of the dependent variable Y or whether the effects of these factors on Y are independent of each other. In determining the type of interaction, the value of the effect of the two single factors on the dependent variable Y was first calculated as q(X1) and q(X2), then the value of the effect of the single factors X1 and X2 when superimposed on the dependent variable Y was calculated as q(X1 ∩ X2). Finally, the results of the comparison of q(X1), q(X2) and q(X1 ∩ X2) were assessed to be non-linearly diminished, two-factor enhanced, single-factor non-linearly diminished, independent and non-linearly enhanced five interaction types. The basis for evaluating the types and interaction types is listed in Table 3.
Table 3.
Types of interactions.
4. Results
4.1. Spatial Distribution of Resident Population
The study area was divided into 425 block units based on urban roads, and the population of the study area was identified using mobile phone data from weekdays for one month. Additionally, the spatial distribution characteristics of the resident population in the study area were analysed using the average population density at 1 pm, as can be ascertained in Figure 5.
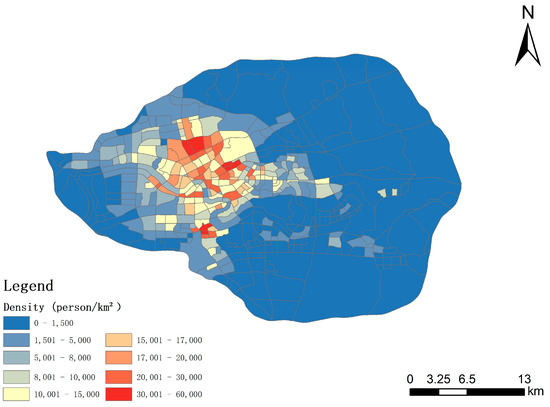
Figure 5.
Map of the spatial distribution of the resident population.
The results showed that the spatial distribution of population density exhibited a “decaying distance from the city centre”, with a high-density population in the city centre circle and a gradual decrease in population density in the outer circle. The high population density range was between 30,000 and 44,400 people/km², mainly in the “Jianzheng Road–Yuanhu North Road–Dongge Road–Gecun Road” block, “Dongge Road–Gecun Road–Changhu Road–Qingxiang Expressway”, “Xingguang Avenue–Wuyi Road–Tancun Road”, “Minzu Avenue–Xinmin Road–Xiuling Road–Youai North Road–Xiuxiang Avenue”, with urban villages and large residential areas nearby, as well as a highly concentrated population. The highest density of the population was mainly located in the central area of the city and gradually decreased as the distance increased, mainly due to the limited radiation of the city centre’s services, which rendered it less attractive to the peripheral population.
4.2. Multi-Scale Commuting Space Characteristics
4.2.1. Grid-Scale Commuter Spatial Characteristics
The mobile communication base station locations were mapped to a 500 m × 500 m grid to derive the grid number to which each mobile communication base station belongs. Besides, the number of base stations was sorted and aggregated by the grid number to derive the total number of base stations within each grid. The spatial characteristics of commuting at the grid scale are illustrated in Figure 6.
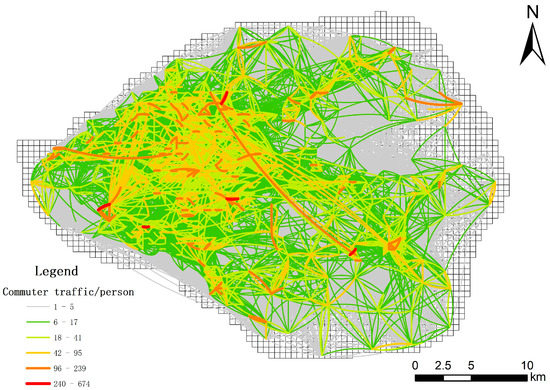
Figure 6.
Grid-scale commuter space characteristics map.
The scale of commuting at the grid scale was unevenly distributed, with small-scale commuters accounting for a large proportion of the total commuting while large-scale commuting accounted for a small proportion of the total commuting. The aggregation of large-scale commuters was low. The east-west commuting volume was larger than the north-south commuting volume, and the overall commuting flow was spatially distributed in a network-like pattern of “dense centre and sparse periphery”. Foxconn Technology Industrial Park, the vicinity of the First Affiliated Hospital of Guangxi Medical University, Xiguan Road Xintiandi of Peace and Guangxi Gaofeng Forestry are the main attractions for the commuter population, with industrial parks, large hospitals and high concentrations of employed people in these areas. The main reason for the large number of short commuter flows in the city centre is the relatively high number of mixed residential-employment functional units in the city centre.
4.2.2. Block-Scale Commuter Spatial Characteristics
The spatial characteristics of commuting at the block scale are displayed in Figure 7. The block-scale commuting space was dense in the centre of the city, sparse at the periphery of the city, dense in the north of the Yong River and sparse to the south of the Yong River, with an overall “polycentric network space” structure and a strong concentration of large-scale commuters. In the areas of “Nong Yuan Road–Ming Xiu West Road–University East Road–Luban Road”, “Ming Xiu East Road–You Ai North Road–Xiuxiang North Mingxiu Road–North Youai Road–North Xiuxiang Road–North Beihu Road”, and “Vanzhu Avenue–Nanwu Road–Wangzhou Road–Changmu Road”, large scale commuting centres were formed. In “East Mingxiu Road–South Mile of Mingxiu Road–Wangzhou Road” and “Yuanhu North Road–Jianzheng Road–Chengxiang Fast–Changgang Road–Democracy Road, there are large urban villages, residential areas and large businesses in the vicinity of the “Changgang Road–Democracy Road” neighbourhood, with a maximum commuter population of 444–729. The area around “Xiuyang Avenue–Xiuling Road–Mingxiu West Road–Youai North Road” has many commuting routes and is close to the high-density population area, with a mix of commercial and residential activities and convenient transportation. The area also has a mix of commercial and residential activities and is well-served by transportation links to meet the commuting needs of residents.
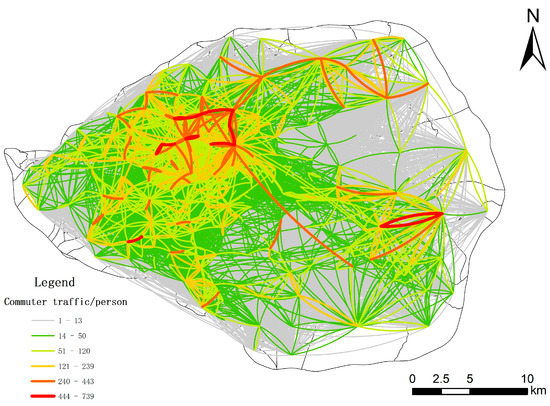
Figure 7.
Map of commuter spatial characteristics at the block scale.
The average commuting distance distribution in the central city of Nanning was obtained through the analysis of the commuting OD (Figure 8). Approximately 96% of the population commuted less than 13 km, with more than 800,000 people commuting within 8 km (a total of 1,035,000 identified commuters) and more than 80% of the population commuting within 8 km. Neighbourhoods with an average commuting distance of shorter than 8 km were mainly located in the city centre, with a larger proportion of short-distance commuting in the city centre than in the surrounding areas. Neighbourhoods with commuting distances greater than 10 km were mainly located on the periphery of the city centre. Areas with large commuting populations exhibited shorter commuting distances and, conversely, longer commuting distances.
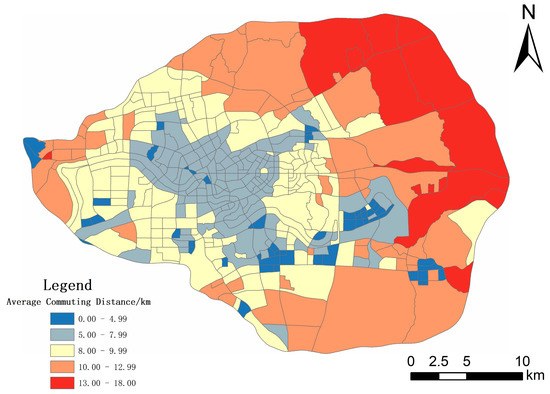
Figure 8.
Map of the average commuting distances.
4.2.3. Subdistrict-Scale Commuter Spatial Characteristics
The study area contained 34 subdistrict units. The subdistrict-scale commuting spaces are shown in Figure 9. The top 10 in terms of commuting size include Chaoyang Subdistrict–Minsheng Subdistrict, Jiangnan Subdistrict–Shajing Subdistrict, Xianhu Economic Development Zone–Pumiao Town, Beihu Subdistrict–Chaoyang Subdistrict, Nanhu Subdistrict–Jintou Subdistrict, Fujian Garden Subdistrict–Zhongshan Subdistrict, Zhongshan Subdistrict–Jintou Subdistrict, Anji Subdistrict–Xinxu Subdistrict, Fujian Garden Subdistrict–Jintou Subdistrict and Xixiangtang Subdistrict–Xinxu Subdistrict, mainly in the urban centre.
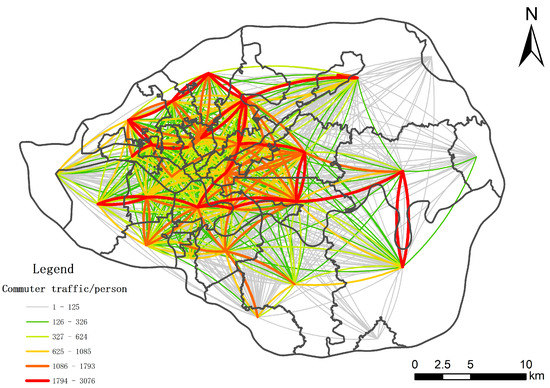
Figure 9.
Map of subdistrict-scale commuter space distribution.
The results of the analysis of the intensity of subdistrict commuting links are depicted in Figure 10. Overall, the internal commuting volume of the subdistricts was greater than the outflow scale and inflow scale, with Chaoyang Subdistrict, Pumiao Town, Fujian Garden Subdistrict and Xixiangtang Subdistrict having the largest internal commuting volume and a higher number of cross-subdistrict commuters. The subdistricts with greater cross-subdistrict commuting inflow intensity than outflow are Xinjiang Town, Xianhu Economic Development Zone, Anning Subdistrict, Wutang Town, Chaoyang Subdistrict, Jiangnan Subdistrict, Fujian Garden Subdistrict, Nahong Subdistrict, Dashain Subdistrict, Shangrao Subdistrict, Beihu Subdistrict, Anji Subdistrict, Xinyang Subdistrict and Hengyang Subdistrict.
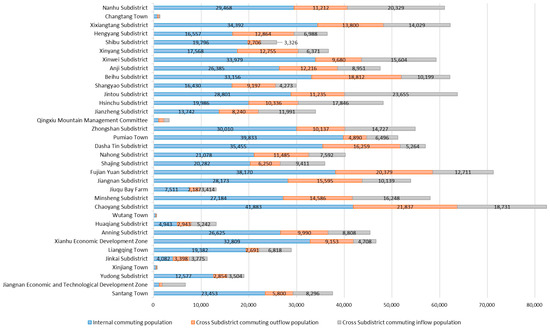
Figure 10.
Strength of subdistricts commuting links.
The flow and size of the cross-subdistrict commuter population were analysed here, and the results are shown in Figure 11. Subdistricts with high commuter flows include Xinzhu Subdistrict, Beihu Subdistrict, Dashatian Subdistrict, Xianhu Economic Development Zone, Pumiao Town, Santang Town, Zhongshan Subdistrict, Anji Subdistrict, Jintou Subdistrict, Hengyang Subdistrict, Nanhu Subdistrict and Anning Subdistrict. There are many cross-subdistrict commuter flows, but the scale of the flows was unevenly distributed, with most of the commuter population flowing to two or three subdistricts.
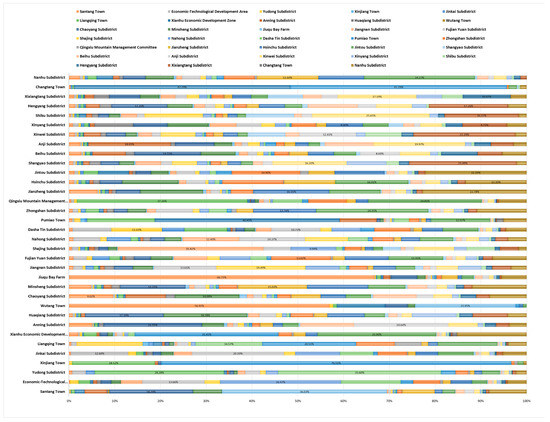
Figure 11.
The flow and size of the cross-subdistrict commuter population.
According to the multi-scale analysis of the spatial characteristics of commuting in the central city of Nanning, the results show that: (1) The overall commuting flow is “ High density in the city centre, low density in the periphery and the overall polycentric network” spatial distribution. (2) The commuting distance is shorter in areas with a large number of commuters and longer in areas with a small number of commuters. (3) The internal commuting volume of the subdistricts is greater than the outflow and inflow scale, indicating that the city has a reasonable spatial distribution of jobs and residences.
4.3. Factors Affecting Commuting in the Central City of Nanning
4.3.1. Divergence and Factor Detection
The dependent and independent variables and factors (Y, X) were entered into the geodetector model to explore the impact of the independent variable, single factor X, on the spatial distribution of commuting. The results of the one-factor probes are listed in Table 4.
Table 4.
Results of divergence and factor detection.
The p-values were all <0.05, indicating that the impact of each type of factor on the amount of commuting was significant. The order of magnitude of individual factors affecting commuting volume: X11 (resident population factor) > X7 (residential distribution factor) > X4 (medical facilities factor) > X3 (recreational facilities factor) > X5 (food service factor) > X6 (workplace distribution factor) > X10 (commuting distance factor) > X2 (bus stop factor) > X1 (road network density factor) > X9 (land use type factor) > X8 (house price factor), indicating that resident population, residential distribution, medical facilities, recreational facilities, food service and workplace distribution are important to control the factors affecting the volume of commuting. Residential distribution and work distribution are the endpoints of commuting volume, with higher commuting populations in their immediate areas. Higher values of the influence factor were also found in the distribution factors of medical facilities, recreational facilities, food services and places of work, with medical facilities and recreational facilities having a higher commuting population where they were densely distributed and the distribution of jobs and food services having an influence on the aggregation of commuting volumes.
4.3.2. Interaction Detection
The spatial distribution of commuting is not only influenced by the different independent variables univariately but is also related to the interaction between these independent variables univariately, whose interaction q-value distribution size is listed in Table 5.
Table 5.
Impact values of interactions.
The values in Table 5 are the values of the interaction between the horizontal axis variable factors and the vertical axis variable factors. The impact of each type of independent variable factor interaction was greater than the impact of a single factor. In the interaction analysis, X7 (residential distribution factor) ∩ X11 (resident population factor) and X7 (residential distribution factor) ∩ X8 (house price factor) had the strongest interaction, with a q-value of 0.87; X1 (road network density factor) ∩ X11 (resident population factor), X5 (food service factor) ∩ X11 (resident population factor), X8 (house price factor) ∩ X11 (resident population factor) interactions were the next most important, with a q-value of 0.86; X6 (workplace distribution factor) ∩ X7 (residential distribution factor), X4 (medical facilities factor) ∩ X7 (residential distribution factor), X2 (bus stop factor) ∩ X11 (resident population factor) and X3 (recreational facilities factor) ∩ X11 (resident population factor) all had a q-value of 0.85; X1 (road network density factor) ∩ X7 (residential distribution factor), X3 (recreational facilities factor) ∩ X7 (residential distribution factor), X5 (food service factor) ∩ X7 (residential distribution factor), X10 (commuting distance factor) ∩ X7 (residential distribution factor), all of which had q-values of 0.84; X9 (land use type factor) ∩ X7 (residential distribution factor), X2 (bus stop factor) ∩ X7 (residential distribution factor), all of which exhibited q-values of 0.82 and the rest of the interaction effect values between the factors were <0.82.
As can be seen from Table 5, the resident population factor and the residential distribution factor are the dominant drivers in the interaction and interact with any factor to produce high q values, where the house price factor alone has a negligible impact on commuting volume. On the contrary, the interaction of the resident population factor, the residential distribution factor and the house price factor reach the strongest impact values. This suggests that the influence of the house price factor on commuting is only apparent in areas with dense residential populations.
The results of the type of interaction between the independent variables factors X1–X11 are presented in Figure 12.
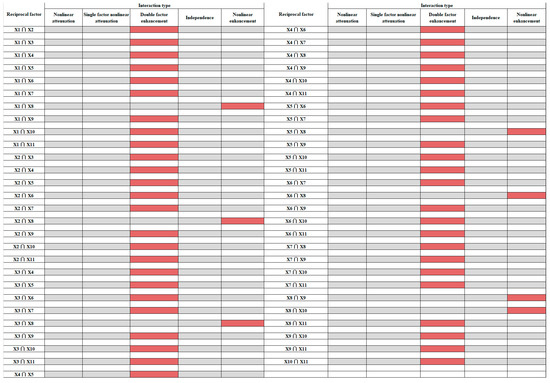
Figure 12.
Results of interactions. The type of interaction is shown in red.
There were two interaction types, namely two-factor enhanced and nonlinear enhanced, in the interaction test results. Both interaction types indicated that all interaction factors had an enhanced impact on the degree of commuting compared to a single factor.
The non-linearly augmented interaction factors were: X1 (road network density factor) ∩ X8 (house price factor) with a q-value of 0.47; X2 (bus stop factor) ∩ X8 (house price factor) with a q-value of 0.53; X3 (job distribution factor) ∩ X8 (house price factor) with a q-value of 0.71; X5 (food service facilities factor) ∩ X8 (house price factor) with a q-value of 0.68; X6 (job distribution factor) ∩ X8 (house price factor) had a q-value of 0.54; X8 (house price factor) ∩ X9 (land use type factor) had a q-value of 0.37; X8 (house price factor) ∩ X10 (commuting distance factor) had a q-value of 0.52; the type of results of intersection between the remaining factors is two-factor augmented, except for X8 (house price factor) ∩ X4 (medical facilities factor), X8 (Except for X8 (house price factor) ∩ X4 (medical facilities factor) and X8 (house price factor) ∩ X7 (housing distribution factor), which were bifactor-enhanced, the interaction of X (the rest of the factors) ∩ X8 (house price factor) was non-linearly enhanced. As can be seen, the impact of the interaction of the house price factor on the other types of factors was stronger than the influence of the interaction with the medical facilities and the residential distribution factors.
In the two-factor augmentation type, the interaction between the factors had a greater effect on commuting volume than either of the single factors had on commuting volume. Among the key interaction factors with a relatively high degree of influence on commuting volume are q(X7 (residential distribution factor) ∩ X8 (house price factor)) = q(X7 (residential distribution factor) ∩ X11 (resident population factor)) = 0.87, q(X1 (road network density factor) ∩ X11 (resident population factor)) = q(X5 (food service factor) ∩ X11 (resident population factor)) = q(X8 (house price factor) ∩ X11 (resident population factor)) = 0.86, q(X6 (workplace distribution factor) ∩ X7 (residential distribution factor)) = q(X4 (medical facilities factor) ∩ X7 (residential distribution factor)) = 0.85> q(X7 (residential distribution factor) ∩ X10 (commuting distance factor)) = 0.84> q(X4 (medical facilities factor) ∩ X8 (house price factor)) = q(X7 (residential distribution factor) ∩ X9 (land use type factor)) = 0.82, indicating that their interaction exhibited a greater effect on commuting volume.
Analysis using the geodetector model yielded the following results: (1) The density of resident population, residential distribution, medical facilities and recreational facilities has a greater impact on commuting volume, while the distribution of bus stops, road network density and the level of house prices unilaterally affect commuting volume to a lesser extent. (2) Areas with a resident population of high density and residential distribution can enhance the influence of other factors on commuting volume.
5. Discussion
5.1. Spatial Characteristics of Commuting in Nanning
The east-west commute in the central city of Nanning was larger than the north-south commute. The reasons are, on the one hand, the development of Nanning has expanded the city space to the east, with rapid industrial development and more jobs in the eastern part of the city but with higher housing prices and more people living in the western part of the city and working in the eastern part of the city. On the other hand, Nanning has more east-west urban roads than north-south ones and in March 2017, the only metro line in Nanning was the east-west line 1, making the east-west access to the city more convenient than north-south access.
The commuting space in the central city of Nanning exhibited an overall “multi-centre network” spatial structure, with a strong concentration of large-scale commuting population. The Nanning Urban Master Plan (2011–2020) proposed that Nanning will create a spatial layout of “one axis, two belts and multiple centres.” Today, the urban pattern of Nanning’s multi-centres has already taken shape, and the commuting characteristics reflect the gathering of the population in the multi-centres.
The vast majority of the subdistrict’s internal commuting population was larger than the cross-district commuting population, indicating that Nanning has a good work-living balance. Nanning focused on matching supply and demand with work-life balance in housing development, along with coupling industrial space with residential space. The majority of citizens do not need to endure long commuting distances. This is also illustrated by the fact that 80% of commuting distances are less than 8 km, using commuting OD statistics. The small number of areas with a large proportion of cross-subdistrict commuters, such as those in the Jiangnan Economic and Technological Development Zone, isdue to the fact that the zone is dominated by industrial parks, where support facilities are not yet complete, and most employees of enterprises return to live in the city.
5.2. Factors Influencing the Volume of Commuting
The resident population and residential distribution are considered the biggest factors affecting the volume of the commute, with the largest number of commuting populations located in subdistricts, such as Chaoyang, Fujian Park, Jintou, Beihu and Xixiangtang. These areas have a dense resident population and a high number of residential communities. The distribution of medical facilities, recreational facilities, food services and workplaces are also important influencing factors for the volume of commuting. The average commuting distance was shorter in areas with good amenities and more jobs, e.g., the average commuting distance was less than 10 km for all neighbourhoods within the fast ring road. Areas with high commuter inflow are those with more developed commercial services providing more jobs. For example, the influx of commuters in the Jintou subdistrict and Nanhu subdistrict exceeded 20,000 and was twice as large as the regional commuter outflow.
The resident population factor and the residential distribution factor also had a greater driving effect on the other factors. The house price factor only affects the commuting volume of the area when the resident population and residential district are densely populated. For some newly developed areas, such as the Wuxiang New District and Nanning Economic and Technological Development Zone, the house price factor in this area has no effect on the commuting volume as the resident population is small.
5.3. Features and Shortcomings of This Study
Mobile phone data have objective and realistic characteristics, and the results of the analysis of urban commuting space using these data are in line with human perception. Compared with traditional survey methods, the method proposed in this work can greatly save on manpower and capital costs. Compared with existing related studies [23,24,32], the innovations of this study are reflected in (1) An analysis of the commuting spatial characteristics in the central city from the grid-block-subdistrict scale based on mobile phone data; it facilitates a more comprehensive perception of urban commuting from the local to the global level. (2) Proposes a geodetector-based model for detecting factors influencing commuting volume, useful for informing decisions on the planning and management of the city. Our work provided useful insights for understanding the commuting pattern of the city, which can provide a scientific basis for land resource allocation, infrastructure planning and traffic road network optimisation. For example, providing public transport services to areas with high commuting volumes can improve commuting efficiency. Areas with future increases in the permanent population and residential areas should be well planned for employment and commercial service facilities. The methodology proposed in this study can inform research on urban transport issues and sustainable development. However, a shortcoming of this work is that when studying the spatial distribution of commuting, the commuters identified are those who commute to work at regular times; there are difficulties identifying those who are employed at irregular times and locations, which may lead to some deviations between the analysis results and the actual situation. In addition, the location information of mobile phone users is derived from the spatial location of communication base stations, and its accuracy is difficult to identify for commuting times and commuting paths. In the next study, we will combine GNSS trajectories, sample surveys and social statistics to further improve the accuracy of urban commuting spatial feature recognition and identify the commuting patterns and commuting times of citizens in order to meet the demand for fine-grained decision-making in urban space.
6. Conclusions
The spatial characteristics of commuting are an important decision-making basis for urban spatial planning, land use and traffic optimisation. In response to the shortcomings of traditional survey methods, such as high human and financial costs and a structure easily influenced by subjective factors, in this work, it was proposed to identify the urban resident population based on mobile phone data, identify the population in the Occupational and residential through the workplace algorithm, construct a commuting space, analyse the spatial characteristics of commuting from multiple scales and combine multi-source internet data with geodetector to explore the influencing factors of commuting volume. The main findings include the following:
- At the grid scale, the overall size of Nanning’s commuting space was unevenly distributed, with the east-west commuting volume being larger than the north-south commuting volume. The overall commuting flows were distributed in a network-like pattern of “dense in the city centre and sparse in the periphery of the city.” The scale of commuting was generally consistent with the direction of the road network in the study area. At the block scale, a strong concentration of large-scale commuters was observed, and the size of the commuter population decreased as the commuting distance increased. This outcome suggests that city centre blocks have a strong radiating effect, attracting high concentrations of commuters. However, as the distance increased, the radiating effect of the city centre decreased, and the size of the commuter population also decreased. At the subdistrict scale, the intra-subdistrict commuter population was larger than the cross-subdistrict commuter population, with more cross-subdistrict commuter flows and an uneven distribution of flow sizes, with most of the commuter population being concentrated in two or three subdistricts for commuting. Areas with a large proportion of cross-regional commuters, such as the Jiangnan Economic and Technological Development Zone, should accelerate the improvement of living facilities.
- The resident population, distribution of residences, medical facilities, recreational facilities, food services and the distribution of workplaces are important controls on the amount of urban commuting. The density of the population, residential neighbourhoods, workplaces and the convenience of amenities attract large-scale commuting. The strongest impact values can be achieved by the interaction of the resident population, the distribution of dwellings and other factors. It is recommended that Nanning should use the future distribution of the resident population and residential areas as the main factor in predicting commuting volumes in its urban planning work. It is also necessary to optimise the allocation of population and residential resources, balance housing and living services and reduce the differences in the functions of jobs and residences within the city.
- The use of mobile phone data can better identify the spatial characteristics of urban commuting, and by constructing a job and residence OD, the analysis from different spatial scales can reflect the characteristics of commuting more comprehensively. The grid scale is good for observing the intensity of commuting, and the neighbourhood scale is good for discovering the city’s occupational and residential centres, while the subdistrict scale is good for reflecting the cross-subdistrict commuting situation at a macro level. Comprehensive identification of commuting characteristics can provide a better basis for decision-making in the planning of urban transport facilities. A model for detecting the influence of commuting volume, constructed by combining mobile phone data with multi-source internet data and geodetector, can identify the magnitude of the influence of different factors on commuting volume, which can provide deeper support for further urban land allocation and facility layout design.
Author Contributions
Conceptualization, G.L.; methodology, J.W.; resources, Y.H.; data curation, M.L.; writing—original draft preparation, J.W.; writing—review and editing, G.L.; visualization, Y.W. All authors have read and agreed to the published version of the manuscript.
Funding
This research was funded by the University-Industry Collaborative Education Program (Grant number: 220603776263313) and the Natural Resources Digital Industry Academy Construction Project.
Institutional Review Board Statement
Not applicable.
Informed Consent Statement
Not applicable.
Data Availability Statement
Not applicable.
Conflicts of Interest
The authors declare no conflict of interest.
References
- Giménez-Nadal, J.I.; Molina, J.A.; Velilla, J. Trends in commuting time of European workers: A cross-country analysis. Transp. Policy 2022, 116, 327–342. [Google Scholar] [CrossRef]
- Hu, L.; Sun, T.; Wang, L. Evolving urban spatial structure and commuting patterns: A case study of Beijing, China. Transp. Res. Part D Transp. Environ. 2018, 59, 11–22. [Google Scholar] [CrossRef]
- McKenzie, G.; Romm, D. Measuring urban regional similarity through mobility signatures. Comput. Environ. Urban Syst. 2021, 89, 101684. [Google Scholar] [CrossRef]
- Cao, J.; Li, Q.; Tu, W.; Gao, Q.; Cao, R.; Zhong, C. Resolving urban mobility networks from individual travel graphs using massive-scale mobile phone tracking data. Cities 2021, 110, 103077. [Google Scholar] [CrossRef]
- Yang, X.; Fang, Z.; Xu, Y.; Yin, L.; Li, J.; Zhao, Z. Revealing temporal stay patterns in human mobility using large-scale mobile phone location data. Trans. GIS 2021, 25, 1927–1948. [Google Scholar] [CrossRef]
- Jing, Y.; Shu, J.; Wang, R.; Zhang, X. Tempo-spatial variability of urban leisure functional zones: An analysis based on geo-big data. Growth Change 2021, 52, 1852–1865. [Google Scholar] [CrossRef]
- Qoradi, M.D.; Al-Harbi, M.S.; Aina, Y.A. Using GIS-based intelligent transportation systems in the enhancement of university campus commuting in a smart city context. Arab. J. Geosci. 2021, 14, 1–13. [Google Scholar] [CrossRef]
- Cheng, A.; Pang, M.-S.; Pavlou, P.A. Mitigating traffic congestion: The role of intelligent transportation systems. Inform. Syst. Res. Forthcom. 2019, 31, 653–1036. [Google Scholar] [CrossRef]
- Huang, H.; Yao, X.A.; Krisp, J.M.; Jiang, B. Analytics of location-based big data for smart cities: Opportunities, challenges, and future directions. Comput. Environ. Urban Syst. 2021, 90, 101712. [Google Scholar] [CrossRef]
- Long, Y.; Zhang, Y.; Cui, C. Identifying Commuting Pattern of Beijing Using Bus Smart Card Data. Acta Geogr. Sin. 2012, 67, 1339–1352. [Google Scholar]
- Mirzaee, S.; Wang, Q. Urban mobility and resilience: Exploring Boston’s urban mobility network through twitter data. Appl. Netw. Sci. 2020, 5, 75. [Google Scholar] [CrossRef]
- Petutschnig, A.; Albrecht, J.; Resch, B.; Ramasubramanian, L.; Wright, A. Commuter Mobility Patterns in Social Media: Correlating Twitter and LODES Data. ISPRS Int. J. Geo-Inf. 2022, 11, 15. [Google Scholar] [CrossRef]
- Zhang, X.; Sun, Y.; Zheng, A.; Wang, Y. A New Approach to Refining Land Use Types: Predicting Point-of-Interest Categories Using Weibo Check-in Data. ISPRS Int. J. Geo-Inf. 2020, 9, 124. [Google Scholar] [CrossRef]
- Huang, X.; Zhang, L.; Ding, Y. The Baidu Index: Uses in predicting tourism flows—A case study of the Forbidden City. Tour. Manag. 2017, 58, 301–306. [Google Scholar] [CrossRef]
- Ma, L.; Xiu, C. Analyzing the Structure of Residence—Leisure Network in Shenyang City. Land 2022, 11, 2111. [Google Scholar] [CrossRef]
- Chen, J.; Pei, T.; Shaw, S.-L.; Lu, F.; Li, M.; Cheng, S.; Liu, X.; Zhang, H. Fine-grained prediction of urban population using mobile phone location data. Int. J. Geogr. Inf. Sci. 2018, 32, 1770–1786. [Google Scholar] [CrossRef]
- Liu, Z.; Ma, T.; Du, Y.; Pei, T.; Yi, J.; Peng, H. Mapping hourly dynamics of urban population using trajectories reconstructed from mobile phone records. Trans. GIS 2018, 22, 494–513. [Google Scholar] [CrossRef]
- Bokányi, E.; Juhász, S.; Karsai, M.; Lengyel, B. Universal patterns of long-distance commuting and social assortativity in cities. Sci. Rep. 2021, 11, 20829. [Google Scholar] [CrossRef]
- Wang, X.M. Detecting latent urban mobility structure using mobile phone data. Mod. Phys. Lett. B 2020, 34, 2050342. [Google Scholar] [CrossRef]
- Yan, L.; Wang, D.; Zhang, S.; Ratti, C. Understanding urban centers in Shanghai with big data: Local and non-local function perspectives. Cities 2021, 113, 103156. [Google Scholar] [CrossRef]
- Tu, W.; Cao, J.; Yue, Y.; Shaw, S.-L.; Zhou, M.; Wang, Z.; Chang, X.; Xu, Y.; Li, Q. Coupling mobile phone and social media data: A new approach to understanding urban functions and diurnal patterns. Int. J. Geogr. Inf. Sci. 2017, 31, 2331–2358. [Google Scholar] [CrossRef]
- Zagatti, G.A.; Gonzalez, M.; Avner, P.; Lozano-Gracia, N.; Brooks, C.J.; Albert, M.; Gray, J.; Antos, S.E.; Burci, P.; zu Erbach-Schoenberg, E.; et al. A trip to work: Estimation of origin and destination of commuting patterns in the main metropolitan regions of Haiti using CDR. Dev. Eng. 2018, 3, 133–165. [Google Scholar] [CrossRef]
- Sakamanee, P.; Phithakkitnukoon, S.; Smoreda, Z.; Ratti, C. Methods for Inferring Route Choice of Commuting Trip from Mobile Phone Network Data. ISPRS Int. J. Geo-Inf. 2020, 9, 306. [Google Scholar] [CrossRef]
- Ahas, R.; Silm, S.; Järv, O.; Saluveer, E.; Tiru, M. Using Mobile Positioning Data to Model Loctions Meaningful to Users of Mobile Phones. J. Urban Technol. 2010, 17, 3–27. [Google Scholar] [CrossRef]
- Jiang, S.; Ferreira, J.; Gonzalez, M.C. Activity-Based Human Mobility Patterns Inferred from Mobile Phone Data: A Case Study of Singapore. IEEE Trans. Big Data 2017, 3, 208–219. [Google Scholar] [CrossRef]
- Lu, D.; Li, Y.; Guo, F. Evaluating Spatial and Temporal Characteristics of Population Density Using Cellular Data. IEEE Trans. Intell. Transp. Syst. 2022, 23, 5717–5726. [Google Scholar] [CrossRef]
- Pintér, G.; Felde, I. Evaluating the Effect of the Financial Status to the Mobility Customs. ISPRS Int. J. Geo-Inf. 2021, 10, 328. [Google Scholar] [CrossRef]
- Liu, X.; Huang, J.; Lai, J.; Zhang, J.; Senousi, A.M.; Zhao, P. Analysis of urban agglomeration structure through spatial network and mobile phone data. Trans. GIS 2021, 25, 1949–1969. [Google Scholar] [CrossRef]
- Šveda, M.; Sládeková Madajovám, M. Estimating distance decay of intra-urban trips using mobile phone data: The case of Bratislava, Slovakia. J. Transp. Geogr. 2023, 107, 103552. [Google Scholar] [CrossRef]
- Zhao, P.; Hu, H.; Zeng, L.; Chen, J.; Ye, X. Revisiting the gravity laws of inter-city mobility in megacity regions. Sci. China Earth Sci. 2023, 66, 271–281. [Google Scholar] [CrossRef]
- Pintér, G.; Felde, I. Commuting Analysis of the Budapest Metropolitan Area Using Mobile Network Data. ISPRS Int. J. Geo-Inf. 2022, 11, 466. [Google Scholar] [CrossRef]
- Xiao, Y.; Wang, Y.; Miao, S.; Niu, X. Assessing polycentric urban development in Shanghai, China, with detailed passive mobile phone data. Environ. Plan. B Urban Anal. City Sci. 2021, 48, 2656–2674. [Google Scholar] [CrossRef]
- Yan, L.; Wang, Y.; Wang, D.; Zhang, S.; Xiao, Y. A new approach for identifying urban employment centers using mobile phone data: A case study of Shanghai. Int. J. Geogr. Inf. Sci. 2023, 37, 1180–1207. [Google Scholar] [CrossRef]
- Ríos, S.A.; Muñoz, R. Land Use detection with cell phone data using topic models: Case Santiago, Chile. Comput. Environ. Urban Syst. 2017, 61, 39–48. [Google Scholar] [CrossRef]
- Guo, B.; Pei, T.; Song, C.; Shu, H.; Wu, M.; Guo, S.; Jiang, J.; Du, P. Trend surface analysis of geographic flows. Int. J. Geogr. Inf. Sci. 2023, 37, 118–137. [Google Scholar] [CrossRef]
- Peng, Z.; Bai, G.; Wu, H.; Liu, L.; Yu, Y. Travel mode recognition of urban residents using mobile phone data and MapAPI. Environ. Plan. B Urban Anal. City Sci. 2021, 48, 2574–2589. [Google Scholar] [CrossRef]
- Zhang, B.; Zhong, C.; Gao, Q.; Shabrina, Z.; Tu, W. Delineating urban functional zones using mobile phone data: A case study of cross-boundary integration in Shenzhen-Dongguan-Huizhou area. Comput. Environ. Urban Syst. 2022, 98, 101872. [Google Scholar] [CrossRef]
- Wang, Z.; He, S.Y.; Leung, Y. Applying mobile phone data to travel behaviour research: A literature review. Travel Behav. Soc. 2018, 11, 141–155. [Google Scholar] [CrossRef]
- Bachir, D.; Khodabandelou, G.; Gauthier, V.; El Yacoubi, M.; Puchinger, J. Inferring dynamic origin-destination flows by transport mode using mobile phone data. Transp. Res. Part C Emerg. Technol. 2019, 101, 254–275. [Google Scholar] [CrossRef]
- Hincks, S.; Kingston, R.; Webb, B.; Wong, C. A new geodemographic classification of commuting flows for England and Wales. Int. J. Geogr. Inf. Sci. 2018, 32, 663–684. [Google Scholar] [CrossRef]
- Bi, X. Tyson Polygon Construction Based on Spatio-temporal Data Network. Int. J. Wirel. Inf. Netw. 2020, 27, 289–298. [Google Scholar] [CrossRef]
- Wang, H.; Qin, F.; Xu, C.; Li, B.; Guo, L.; Wang, Z. Evaluating the suitability of urban development land with a Geodetector. Ecol. Indic. 2021, 123, 107339. [Google Scholar] [CrossRef]
- Luo, G.; Ye, J.; Wang, J.; Wei, Y. Urban Functional Zone Classification Based on POI Data and Machine Learning. Sustainability 2023, 15, 4631. [Google Scholar] [CrossRef]
- Joshi, P.P.; Wynne, R.H.; Thomas, V.A. Cloud detection algorithm using SVM with SWIR2 and tasseled cap applied to Landsat 8. Int. J. Appl. Earth Obs. Geoinf. 2019, 82, 101898. [Google Scholar] [CrossRef]


Disclaimer/Publisher’s Note: The statements, opinions and data contained in all publications are solely those of the individual author(s) and contributor(s) and not of MDPI and/or the editor(s). MDPI and/or the editor(s) disclaim responsibility for any injury to people or property resulting from any ideas, methods, instructions or products referred to in the content. |
© 2023 by the authors. Licensee MDPI, Basel, Switzerland. This article is an open access article distributed under the terms and conditions of the Creative Commons Attribution (CC BY) license (https://creativecommons.org/licenses/by/4.0/).