Article

An Analysis of Runoff Variation in a Small Basin in the Loess Plateau: Identifying the Variation Causes and Implications for Sustainable Water Management

1
State Key Laboratory of Simulation and Regulation of Water Cycles in River Basins, China Institute of Water Resources and Hydropower Research, Beijing 100038, China
2
Key Laboratory of Subsurface Hydrology and Ecological Effects in Arid Regions of the Ministry of Education, School of Water and Environment, Chang’an University, Xi’an 710064, China
*
Author to whom correspondence should be addressed.
Sustainability 2023, 15(12), 9651; https://doi.org/10.3390/su15129651
Submission received: 28 April 2023 / Revised: 12 June 2023 / Accepted: 14 June 2023 / Published: 16 June 2023
(This article belongs to the Section Sustainable Water Management)

Abstract

:
Analyzing the characteristics and causes of runoff variation in a typical small basin is beneficial for ecological restoration in the Loess Plateau. This study employed a series of statistical methodologies to examine the characteristics of meteorological changes and underlying surface evolution in the Qishui River Basin (QRB). To differentiate the impacts of climate change and human activities on runoff variation, we applied the Choudhury–Yang formula and the Double Mass Curve (DMC) method. Subsequently, by incorporating future watershed protection strategies and various SSP scenarios, we utilized the Soil and Water Assessment Tool to simulate future runoff while employing the DMC to identify underlying causes of runoff variation. The results suggested that human activity has a slightly greater impact than climate change on reducing runoff during the historical period, with only a 1% difference. However, this will change in the future as human impact becomes increasingly significant. Human activities such as afforestation have dual effects, encompassing positive effects such as improving water quality and mitigating soil erosion, as well as negative consequences such as diminishing local water availability and exacerbating drought. Effective policies should be implemented, involving the use of appropriate tree species and planting methods, finding an appropriate value of forest area, monitoring and evaluation, etc., in order to ensure that the policies are aligned with the broader social, economic, and environmental goals of the QRB. These findings provide valuable guidance for policy-makers in developing management strategies for future environmental changes.

1. Introduction

The ecological environment in China’s Loess region is very fragile [1,2,3]. The scarcity of water resources, fragmented topography, deteriorated vegetation, loose soil structure, and aggravated soil erosion have exacerbated the conflict between water resources, ecological environment, and economic progress. This has severely hindered regional socio-economic advancement [4,5,6,7]. Under the increasingly intensified impact of human activities and global climate change, the hydrological conditions, water resource shortages, and ecological–environmental problems of the Loess tableland—the predominant form of the loess landform—have garnered significant attention [8,9]. Due to severe soil erosion and extensive gully development, tens of thousands of small basins have formed on the Loess Plateau [10]. These basins serve as relatively independent geomorphic, production, and administrative units where villages are located. The small watersheds significantly impact the local natural landscape and social development. Therefore, scientifically and efficiently utilizing the water resources in these small watersheds on the Loess Plateau holds great positive significance for restoring the local ecological environment [11]. Currently, there is ongoing experimental demonstration and extension work focusing on the comprehensive management of small basins in the Loess Plateau. In 1979, the Chinese government recognized the 3-North Shelter Forest Program as an important national economic construction project to enhance the ecological environment [12]. This program aims to establish large-scale artificial forestry ecosystems in the three northern regions of China, including the northwest, north, and northeast. As part of this project, the control of soil and water loss in small watersheds on the Loess Plateau is a key component. Consequently, examining the historical and future changes in runoff under different ecological conditions, at the level of small basins, holds significant practical value for the study of water resources, soil and water conservation, as well as ecological environment restoration in this region. Existing studies typically focus on the entire region or large-scale watersheds of the Loess Plateau [13,14,15,16,17]. However, small watersheds constitute the most fundamental hydrological unit of the Loess Plateau. Therefore, investigating the causes of runoff variation in a small basin is more conducive to unveiling the mechanism of runoff change in the Loess Plateau. Numerous studies have demonstrated that the variability in runoff is a result of the confluence of climate change and anthropogenic activities [18,19,20,21,22]. For instance, rising temperatures due to climate change can impact regional hydrological processes by increasing potential evapotranspiration and altering precipitation intensity and frequency [17,23,24]. Furthermore, human activities have increasingly significant impacts on runoff due to the development of society. These impacts can be categorized as direct (e.g., water use and reservoir construction) or indirect (e.g., changes in land use patterns) [22]. In recent years, human activities on the Loess Plateau mainly affect runoff indirectly [25,26,27]. The underlying surface, particularly the vegetation coverage, has undergone changes due to human activities in the Loess Plateau. Vegetation plays a crucial role in regulating evaporation, infiltration, and interception. Alterations in vegetation cover can significantly influence the amount and timing of runoff [17,28,29,30]. These changes have resulted in alterations in basin runoff.
In recent decades, the Loess Plateau region has experienced a series of changes in hydrometeorological elements [31,32]. Since the 1980s, some rivers’ runoff has decreased sharply [33]. Many tributaries and end water systems have dried up. Under the condition that the annual rainfall remains relatively stable, the groundwater level in the Loess Plateau and hilly areas has dropped significantly many times [34]. Even in wet years with ample precipitation, large-scale hydrological droughts are still common and cause severe ecological shocks. At present, most studies focus on large-scale watershed studies, and there are few studies on runoff attribution analysis in small watersheds [13,14,15,16,17]. Studying the mechanisms underlying the evolution of water cycle elements in the Loess small basin under the influence of climate change and human activities and revealing the patterns of evolution in the regional underlying surface and runoff is of practical significance for the rational utilization, planning, and management of regional water resources [35,36].
The quantitatively identifying runoff attribution methods mainly include the Choudhury–Yang formula, the hydrological model simulation method, the elastic coefficient method based on the Budyko assumption, and the Double Mass Curve (DMC) method [37,38,39,40,41,42,43,44]. In recent years, in addition to the DMC method, the Choudhury–Yang formula based on the basin hydrothermal coupling balance has been widely used in many Chinese basins due to its relatively simple expression and proven high accuracy [45,46]. Many studies have been carried out on the runoff change and attribution analysis in the Loess area [47,48,49,50,51,52]. However, there still needs to be more quantitatively clarifying the impact of climate and underlying surface change on the runoff variation of small basins. After considering future land use changes, how will runoff be affected under different climate modes? This question has significant reference value for policy-making regarding small watersheds in loess areas undergoing ecological restoration.
The Qishui River Basin (QRB), located in the Loess Plateau, is a typical small watershed in the loess region that experiences severe soil erosion. The precipitation, temperature and vegetation coverage in this area are at an average level, accounting for 94.74%, 105% and 93.56% of the respective average values of the Loess Plateau. Therefore, this area is a suitable representative of the characteristics of small watersheds in the loess region. Taking the QRB as the research area, we aim (1) to analyze the evolution characteristics of meteorological elements and underlying surfaces in the QRB; (2) to conduct the attribution analysis of runoff in the QRB under changing environment in the historical period; (3) to analyze the causes of runoff change under different shared socioeconomic pathway (SSP) scenarios in the future period; and (4) to present sustainable development strategies based on the QRB runoff and underlying surface conditions in the future.

2. Materials and Methods
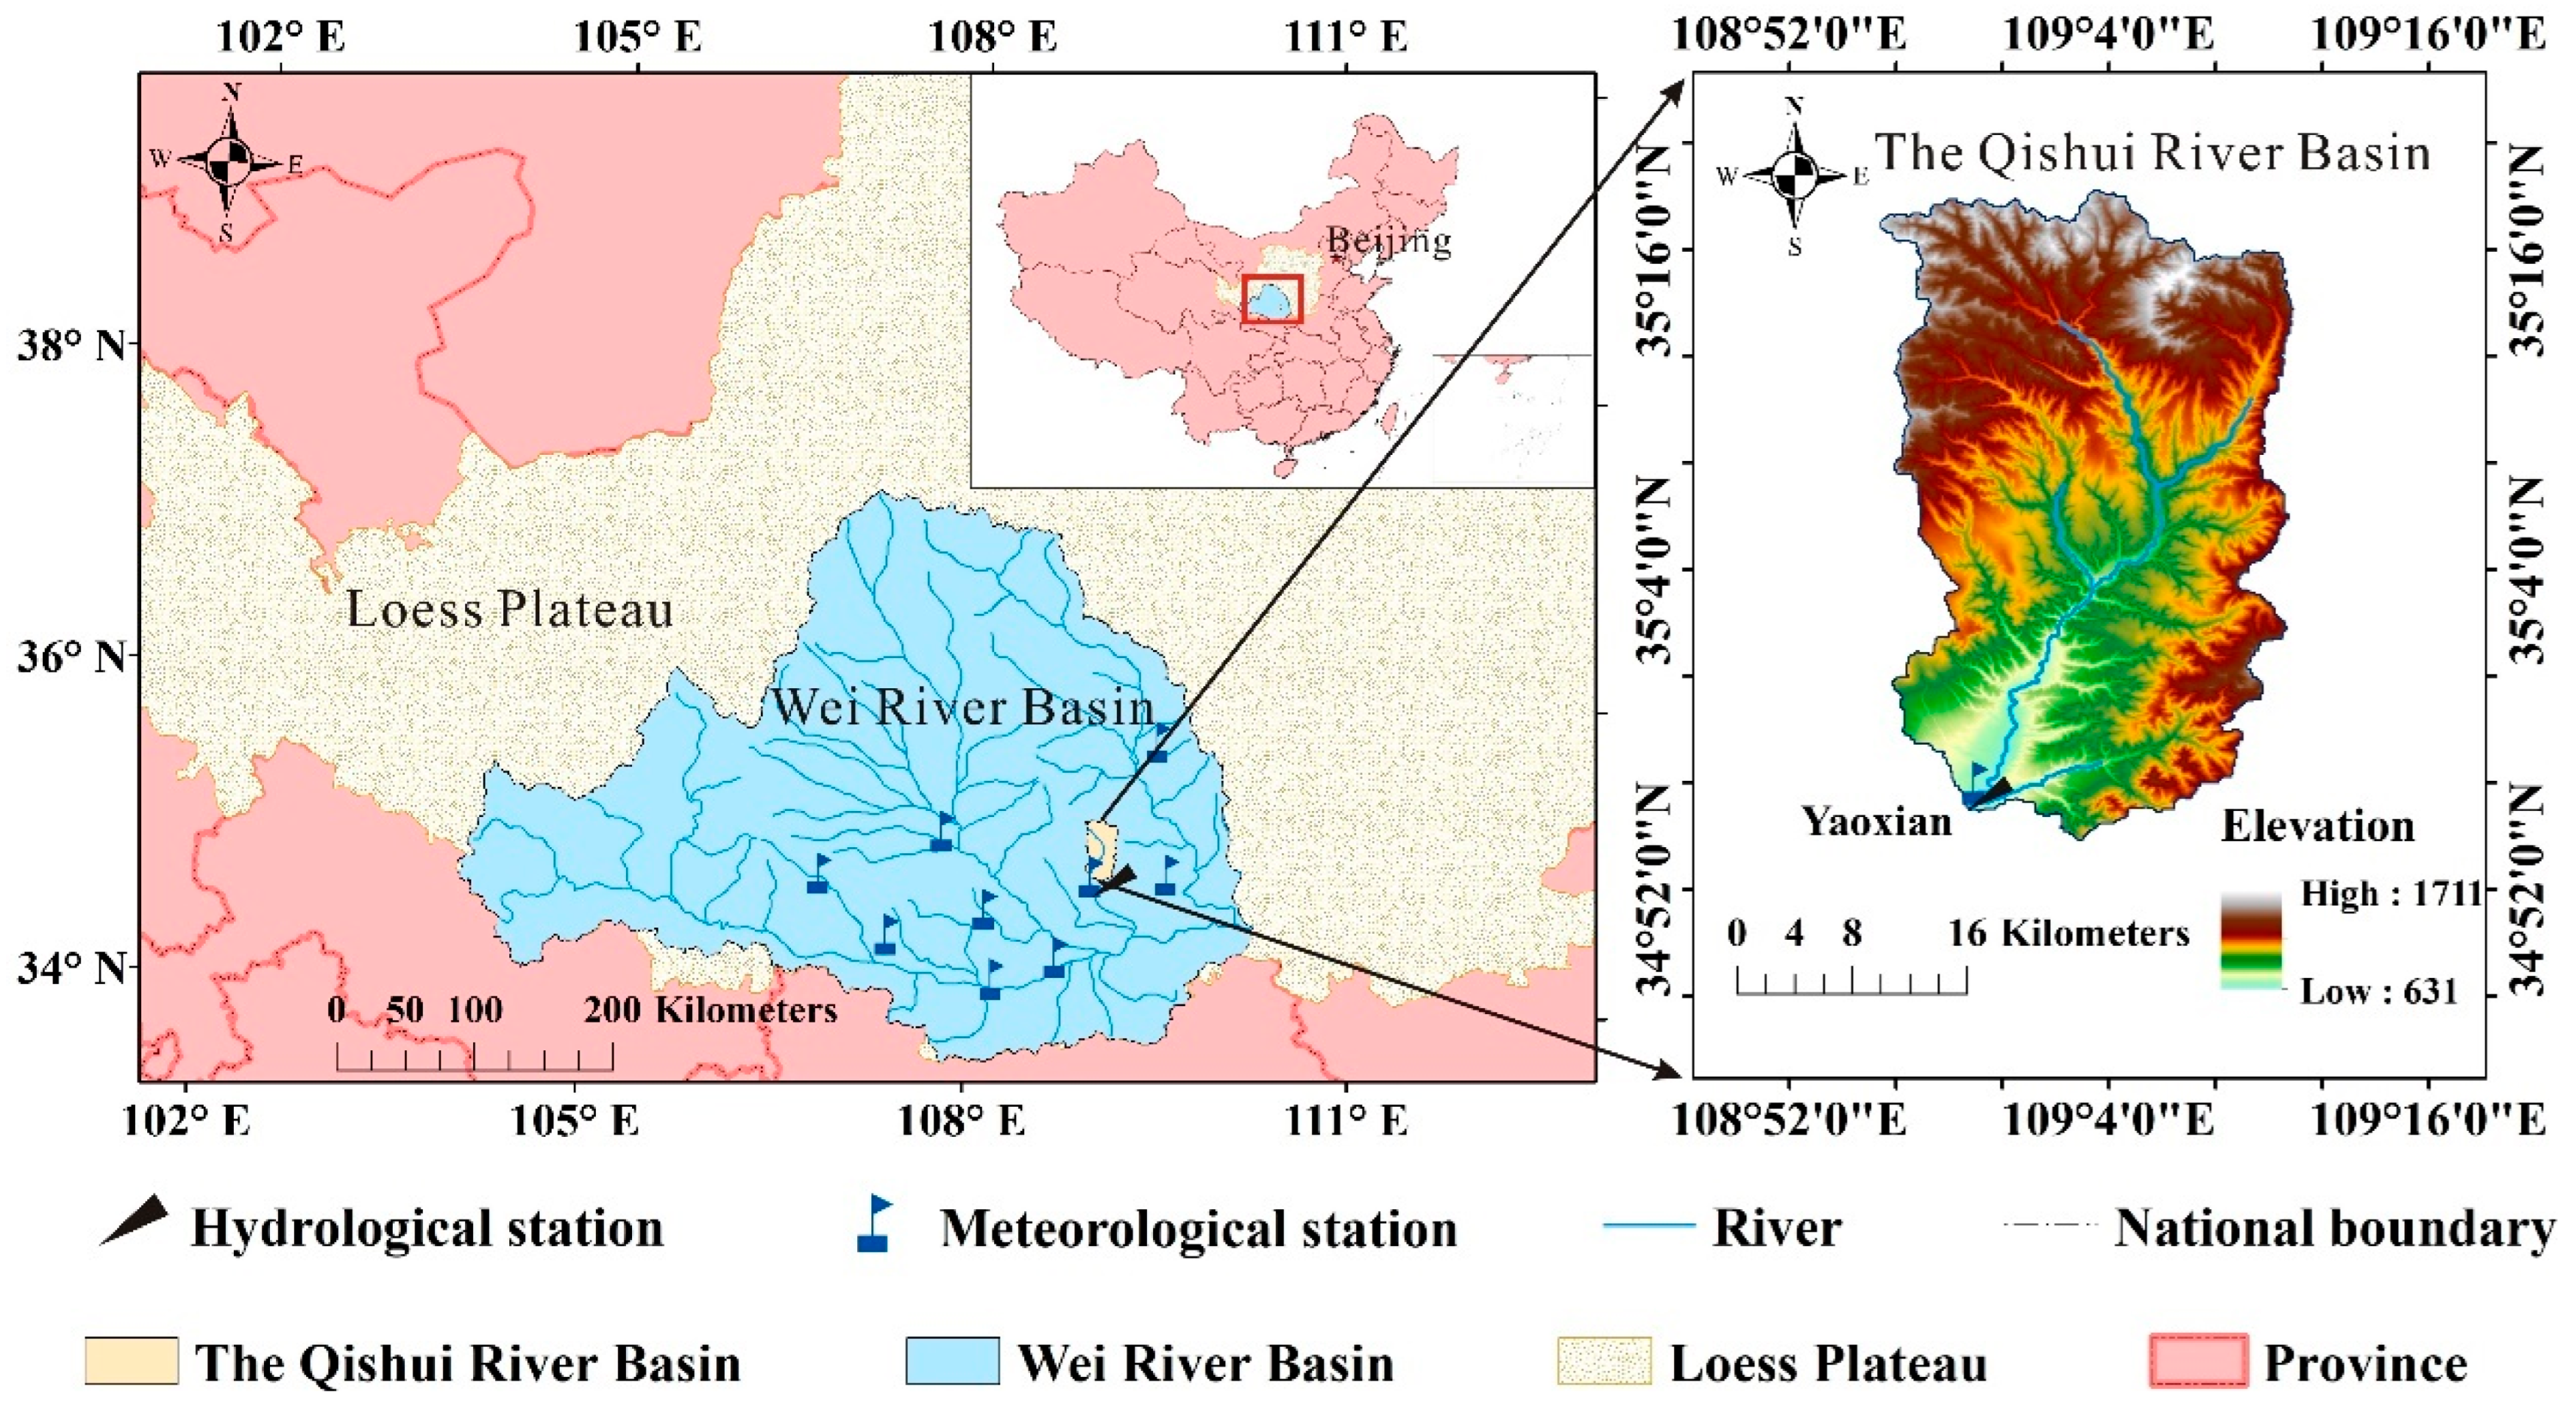
2.1. Study Area

The QRB, a typical small watershed in the Loess Plateau, was selected to conduct the attribution analysis of its runoff change (Figure 1). The basin covers a total area of 773.5 sq. km and is known for its significant variation in sediment transport, as well as harsh soil and water loss. Soil erosion in the region is severe, and the natural environment is unstable. Additionally, the region is characterized by a continental monsoon climate with uneven spatial and temporal distribution of rainfall. Rainfall and heat occur in the same season, increasing the risk of drought. The area also faces prominent challenges related to the complex interplay between water resources, ecological environment, and economic development, leading to frequent hydrological and meteorological drought events. Selecting the QRB as the research watershed is thus consequential, as it can signify the characteristics of diminutive watersheds in the Loess Plateau region.

2.2. Available Data

2.2.1. Meteorological Data and Digital Elevation Model (DEM) Data

In this study, Yaoxian meteorological station was selected (Figure 1); its protracted series of meteorological data spanning from 1969 to 2018 were acquired from the China Meteorological Data Service Center (https://data.cma.cn/, accessed on 15 December 2022). We mainly used precipitation, temperature (maximum, minimum, and average), average wind speed, sunshine duration, and average relative humidity data at daily scale. The 90 m resolution Digital Elevation Model (DEM) data are derived from the Geospatial Data Cloud (http://www.gscloud.cn/, accessed on 15 December 2022).

2.2.2. Normalized Difference Vegetation Index (NDVI) Data

Chinese annual Normalized Difference Vegetation Index (NDVI) spatial distribution dataset was obtained from the Resource and Environment Science and Data Center [53]. The data have a spatial resolution of 1 km × 1 km and a temporal resolution of one year. This dataset effectively portrays the distribution and change in vegetation cover in different regions of China on both spatial and temporal scales, making it one of the widely used datasets for describing the dynamic changes in vegetation growth [54,55,56].

2.2.3. Observed Runoff Data

Yaoxian station is a hydrological station at the outlet of the QRB; its annual runoff data from 1961 to 2018 were obtained from the Yellow River Basin Hydrological Yearbook of China [57].

2.2.4. Coupled Model Intercomparison Project Phase 6 (CMIP6) Data

This research utilized daily temperature and precipitation data from seven models of the Coupled Model Intercomparison Project Phase 6 (CMIP6), with basic information presented in Table 1. The data are derived from https://esgf-node.llnl.gov/search/cmip6/ (accessed on 15 December 2022). We utilized the Bayesian Model Averaging (BMA) method [58] to integrate the seven models, and after conducting 30 rounds of cross-validation, we determined that BMA-based data fusion was more accurate and reasonable than the original data. We also employed the BMA method to downsample the initial data to a spatial resolution of 25 km. Furthermore, we applied the Non-stationary Bias Correction technique to rectify errors in the fused model [59]. This study used the combined scenarios (SSPs-RCPs) data for different shared socioeconomic pathways (SSPs) and representative concentration pathways (RCPs) [60]. Specifically, four combined scenarios were used in this study: SSP1-RCP2.6 (SSP1-2.6), SSP2-RCP4.5 (SSP2-4.5), SSP3-RCP7.0 (SSP3-7.0), SSP5-RCP8.5 (SSP5-8.5). According to the Intergovernmental Panel on Climate Change (IPCC) hypothesis, the four different carbon concentration emission scenarios represent, in turn, the forced scenario of a gradual increase in carbon emission levels and a more considerable temperature increase: SSP1-2.6 (+2.6 W/m2 imbalance; representing a low forcing sustainability pathway), SSP2-4.5 (+4.5 W/m2; medium forcing middle-of-the-road pathway), SSP3-7.0 (+7.0 W/m2; medium- to high-end forcing pathway), and SSP5-8.5 (+8.5 W/m2; high-end forcing pathway) [61,62,63].

2.2.5. Land Use Data and Harmonized World Soil Database (HWSD)

Land use data were derived from the Resource and Environment Science and Data Center (https://data.cma.cn/, accessed on 15 December 2022), with a spatial resolution of 30 m [64]. We selected two periods of land use data in 2000 and 2020. Harmonized World Soil Database (HWSD) was obtained from the Food and Agriculture Organization of the United Nations (https://www.fao.org/, accessed on 15 December 2022), which is a 30 arc-second raster database with over 15,000 different soil mapping units [65].

2.3. Methodology

Figure 2 depicts the framework adopted in this study to examine the hydrological evolution characteristics and causes of the runoff change. Firstly, we systematically analyzed the evolution laws of precipitation, temperature, and vegetation on the Loess Plateau from both temporal and spatial perspectives using statistical methods based on the observed meteorological and NDVI data. We conducted a comprehensive analysis of the trend, periodicity, change point, and their correlations using the related methods based on the observed data from 1969 to 2018. Secondly, we divided the annual runoff time series into baseline and variation periods based on the observed runoff evolution characteristics. Then, the widely used hydrological sensitivity methods based on the Choudhury–Yang formula and DMC were used to quantitatively distinguish the contribution of climate variability and human activities to the runoff change in the QRB. Finally, we simulated the future annual runoff time series in the QRB under four scenarios (SSP1-2.6, SSP2-4.5, SSP3-7.0, and SSP5-8.5) using the Soil and Water Assessment Tool (SWAT). Then, we considered the future runoff sequences as change periods, and considered the 1985–2018 as the baseline period. Subsequently, the causes of runoff change in the future were analyzed by the DMC method.

2.3.1. Trend and Change Point Analysis

The Mann–Kendall method [21,66,67], Sen’s slope estimation method [68], and linear regression [69] were adopted to analyze the variation trend of regional precipitation, temperature, and vegetation. Furthermore, the Pettitt test [70,71], sliding t-test [72], and the Mann–Kendall method were applied to identify the abrupt change point of the runoff series.

2.3.2. Runoff Variation and Attribution Analysis Methods

To identify the change point of annual runoff, we employed the Pettitt, sliding t-test, and the Mann–Kendall method. In general, the change point can be identified using any of these three methods. However, to determine the most accurate time for the change point, we chose to use all three methods and find the intersection of their results as the true change point. Additionally, based on the Penman–Monteith model [73], the annual potential evapotranspiration of the QRB was calculated from 1969 to 2018. To quantify the effects of climate and underlying surface change on watershed runoff, we used the Choudhury–Yang formula to calculate the elastic coefficient, with the DMC method used to verify the calculated results. Based on these calculations, we quantitatively distinguished the specific contribution rates of climate factors and underlying surface changes to the reduction in natural runoff in the basin during 1969–2018.
When the climate and vegetation cover of a basin are known, the hydrological and climatic characteristics of the long series are subject to the principle of water and energy balance [40]. Based on this theory, the basin’s hydrothermal coupling equilibrium equation appeared, later named by experts and scholars as the Choudhury–Yang formula [74]. The equation is expressed as follows:
E = P E 0 P n + E 0 n 1 / n ,
where P is the multi-year average precipitation; E0 is the multi-year average potential evapotranspiration; E is the multi-year average actual evapotranspiration; n is a parameter reflecting the underlying surface characteristics of the basin, such as terrain, soil, and vegetation [38].
Climatic factors were classified as precipitation and potential evapotranspiration. The elasticity of runoff with respect to climate and underlying surface was defined as the degree of variation in watershed runoff resulting from changes in unit climatic factors and the underlying surface. That is, if the value of the elasticity coefficient is represented by m, then a 1% increment in the x factor (comprising precipitation, potential evapotranspiration and underlying surface parameter n) corresponds to an m% increase in runoff. According to the climate and underlying surface elastic coefficient, the runoff changes caused by precipitation, potential evapotranspiration, and underlying surface parameter n can be estimated, respectively. In Formula (1), P, E0, and n are independent. Combined with the water balance relationship in the basin (precipitation equals the sum of evaporation and runoff), the change in annual runoff R can be expressed in the following total differential equation:
d R = R P d P + R E 0 d E 0 + R n d n .
The precipitation elastic coefficient ε P , the potential evapotranspiration elastic coefficient ε E 0 , and the underlying surface elastic coefficient ε n are, respectively, expressed in Formulas (3)–(5):
ε P = d R / R d P / P ,
ε E 0 = d R / R d E 0 / E 0 ,
ε n = d R / R d n / n ,
= E 0 P .
To calculate ε P , ε E 0 , and ε n by combining Equations (1)–(5) and substituting them into Equation (6), the following formula can be obtained:
ε P = 1 + n 1 / n + 1 n + 1 1 + n 1 + n 1 / n ,
ε E 0 = 1 1 + n 1 1 + n 1 / n ,
ε n = ln 1 + n + n ln 1 + n n 1 + n 1 + n 1 / n + 1 .
The study period was divided into two sub-periods according to the change point. The multi-year average runoff depth of Period 1 was denoted as R1 (in mm), while the multi-year average runoff depth of Period 2 was denoted as R2 (in mm). The difference can express the change from Period 1 to Period 2 in the average multi-year runoff depth of the two periods:
R = R 2 R 1 .
The attribution of runoff change can be expressed as
R = R c + R l ,
where R c is the runoff variation caused by climate change, mm; R l is the amount of runoff change caused by the underlying surface change, mm. R c is divided into runoff changes R P caused by precipitation and potential evapotranspiration changes R E 0 , mm, as shown in Equation (12).
R c = R P + R E 0 .
R P , R E 0 , and R l are calculated by Equations (13)–(15):
R P = ε P R P P ,
R E 0 = ε E 0 R E 0 E 0 ,
R l = ε n R n n .
The DMC method, initially used to check hydrological or meteorological data coherence, has become widely applied in assessing runoff response to climate variability and human activities due to its simplicity [69]. Briefly, X represent the reference variable and Y represent the test variable, with the observation period spanning N years. The observed values are denoted as Xi and Yi, where i ranges from 1 to N. The X and Y variables are cumulatively computed to derive a novel year-by-year cumulative sequence [21]:
X i = i = 1 N X i ,
Y i = i = 1 N Y i .
The relationship between the two variables is established by regression analysis in the Cartesian coordinate system. A change in the slope of the DMC indicates a breakpoint of the original gradient of the curve. Using this method and change-point analysis, runoff data were separated into the baseline period and the variation period. It was widely used to estimate the impact of human activities [21,75,76,77,78]. In this study, by substituting the rainfall accumulation data in the post-mutation period into the equation of the rainfall-runoff double accumulation curve prior to the mutation, we obtained a set of runoff data that differed from the original post-mutation runoff data. We attribute this difference to runoff changes resulting from human activities.

2.3.3. Simulation and Attribution Analysis Methods for Future Runoff under Different SSP Scenarios

We used Soil and Water Assessment Tool (SWAT) to simulate future runoff under different SSP scenarios, including SSP1-2.6, SSP2-4.5, SSP3-7.0, and SSP5-8.5. The SWAT model was calibrated using monthly runoff data, with the calibration period from 2001 to 2009 and the validation period from 2010 to 2018. The calibration resulted in the Nash–Sutcliffe efficiency coefficients of 0.78 and 0.64 for the calibration and validation periods, respectively, demonstrating satisfactory model performance. Additionally, the Kling–Gupta efficiency coefficients achieved values of 0.74 and 0.63 for the calibration and validation periods, respectively, confirming the model’s accuracy and reliability. The 3-North Shelter Forest Program Overall Plan aims to increase forest coverage on the Loess Plateau to at least 25.6% and up to 39.63% by 2050. Given that the forest coverage rate of the QRB was 23.15% in 2020, it is possible to reach the upper threshold. When the land use data were input into SWAT, the set land area in the QRB accounted for 39.63% of the total land use area. We combined meteorological data under different SSP scenarios to obtain future runoff series values from 2019 to 2050. On this basis, we employed the DMC method to analyze the causes of runoff change under the four scenarios. Here, the method of finding abrupt change points is the same as in Section 2.3.2.

3. Results

3.1. Variation Law of Hydrological Regime and Underlying Surface

3.1.1. Temperature Trend

The Mann–Kendall method was used to analyze the trend and detect change points in the annual mean temperature series of the QRB. The temperature slope was found to be 0.0336, which is greater than 0 and indicates an upward trend. Furthermore, the value of |Z| was found to be 5.0426, greater than 1.96, a more than 95% confidence level. Therefore, the temperature rises significantly. Overall, the temperature in the QRB shows a significantly increasing trend from 1969 to 2018 at the significant level of 5%. Moreover, an abrupt change in temperature occurred in 1995 at the significant level of 5%. Figure 3 displays the distribution of annual mean temperature from 1969 to 2018 in the basin. The annual mean temperature in the basin ranges from 12.67 °C to 12.84 °C. Notably, the northeastern region of the basin exhibits relatively higher annual mean temperatures.
Figure 4 presents the spatial distribution results of linear trends of the lowest, average, and highest temperatures in the QRB. From 1969 to 2018, the temperature consistently increases throughout the region, ranging from 0.18 to 0.36 °C/10a, with the lowest temperature exhibiting the fastest increase. The mean temperature exhibits the lowest warming rate, growing by 0.18–0.24 °C, followed by the maximum temperature which has a growth rate of 0.21–0.24 °C. The minimum temperature experiences the most significant warming trend, with a growth rate of 0.24–0.36 °C.

3.1.2. Precipitation Trend

Figure 5 illustrates the distribution of the annual mean precipitation in the basin from 1969 to 2018. The annual mean precipitation in the basin ranges from 536.76 mm to 545.20 mm. It is worth noting that the northern region of the basin experiences relatively higher annual mean precipitation. Figure 6 suggests the results of the spatial distribution of linear precipitation trends on annual and seasonal scales in the QRB. The precipitation shows a decreasing trend on the whole, with a decreasing rate of −0.8 mm/10a to −0.6 mm/10a (Figure 6a). During spring, precipitation decreases in the whole region, especially in the southwest of the QRB (Figure 6b). The spatial distribution of the summer precipitation trend is the opposite of that of the spring. However, the overall trend is decreasing, and the rate of decrease is more significant in the northeast region (Figure 6c). Compared with the annual, spring, and summer values, fall precipitation demonstrates a lower rate of decrease (Figure 6d). The overall precipitation trend in winter is increasing (Figure 6e).
Table 2 presents the annual and seasonal precipitation trends as well as their significance ( significance level is 5%), calculated using the Mann–Kendall method (M-K), Sen’s slope estimation method (Sen’s), and linear regression method (LR). Spring, summer, and autumn precipitations show decreasing trends, whereas winter precipitation shows an increasing trend. However, none of the trends are significant. These findings are consistent with those presented in Figure 6.

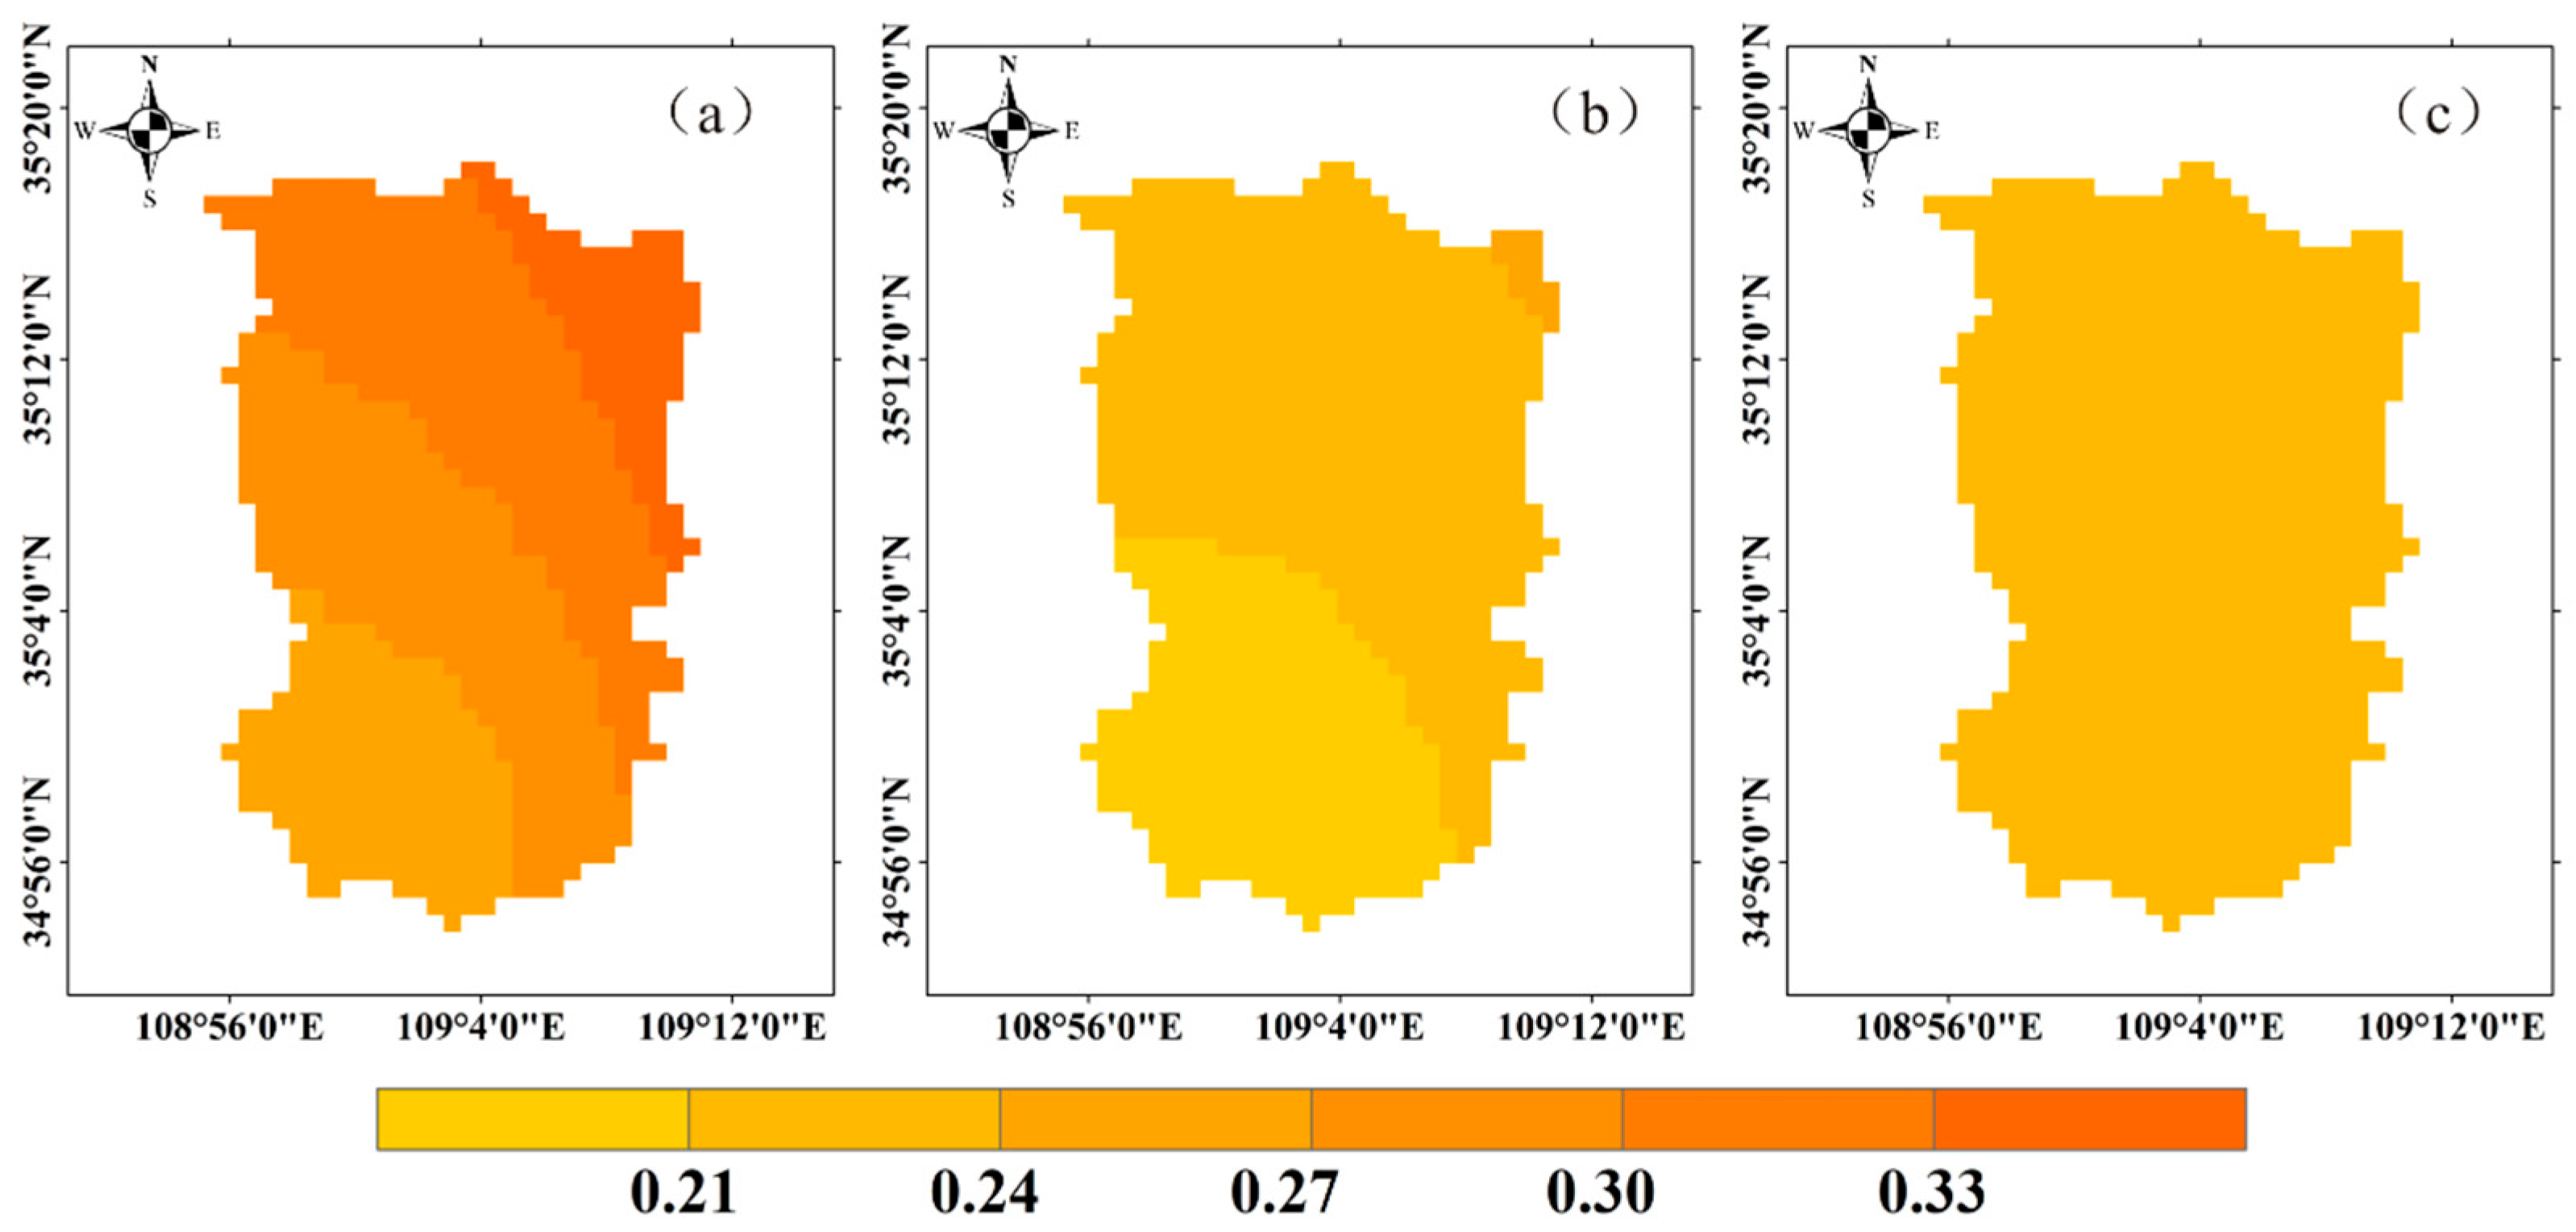
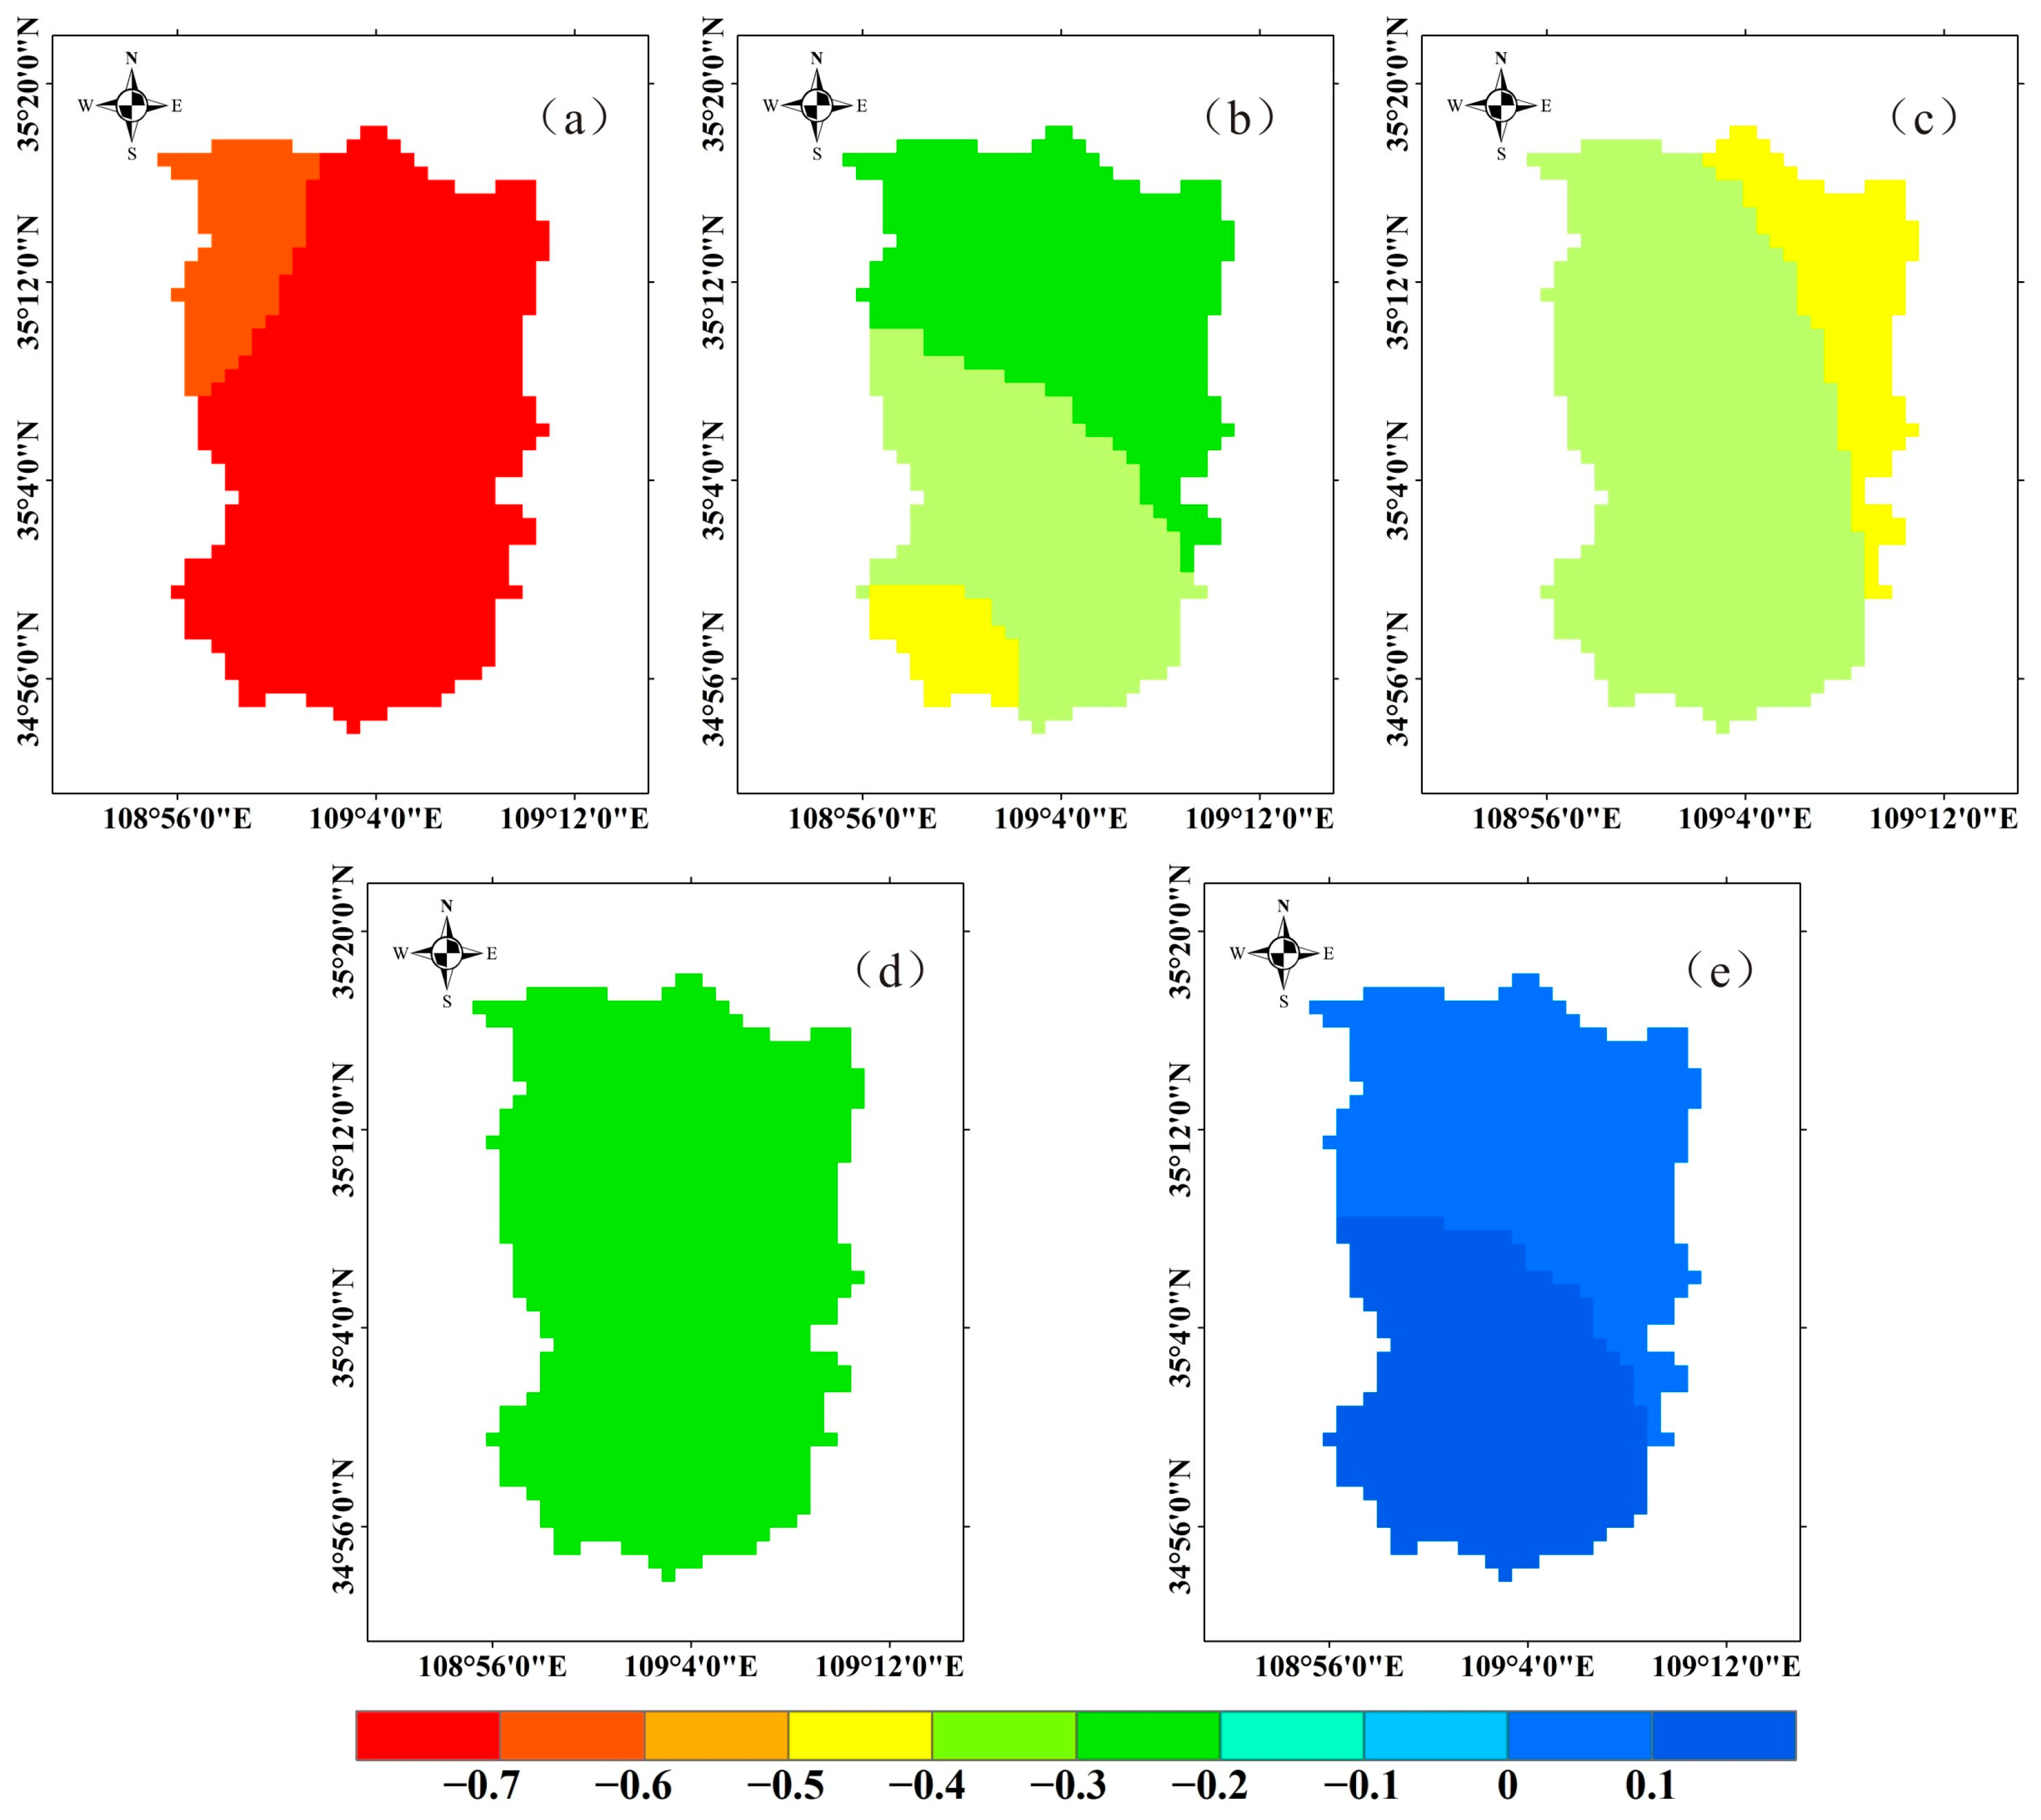
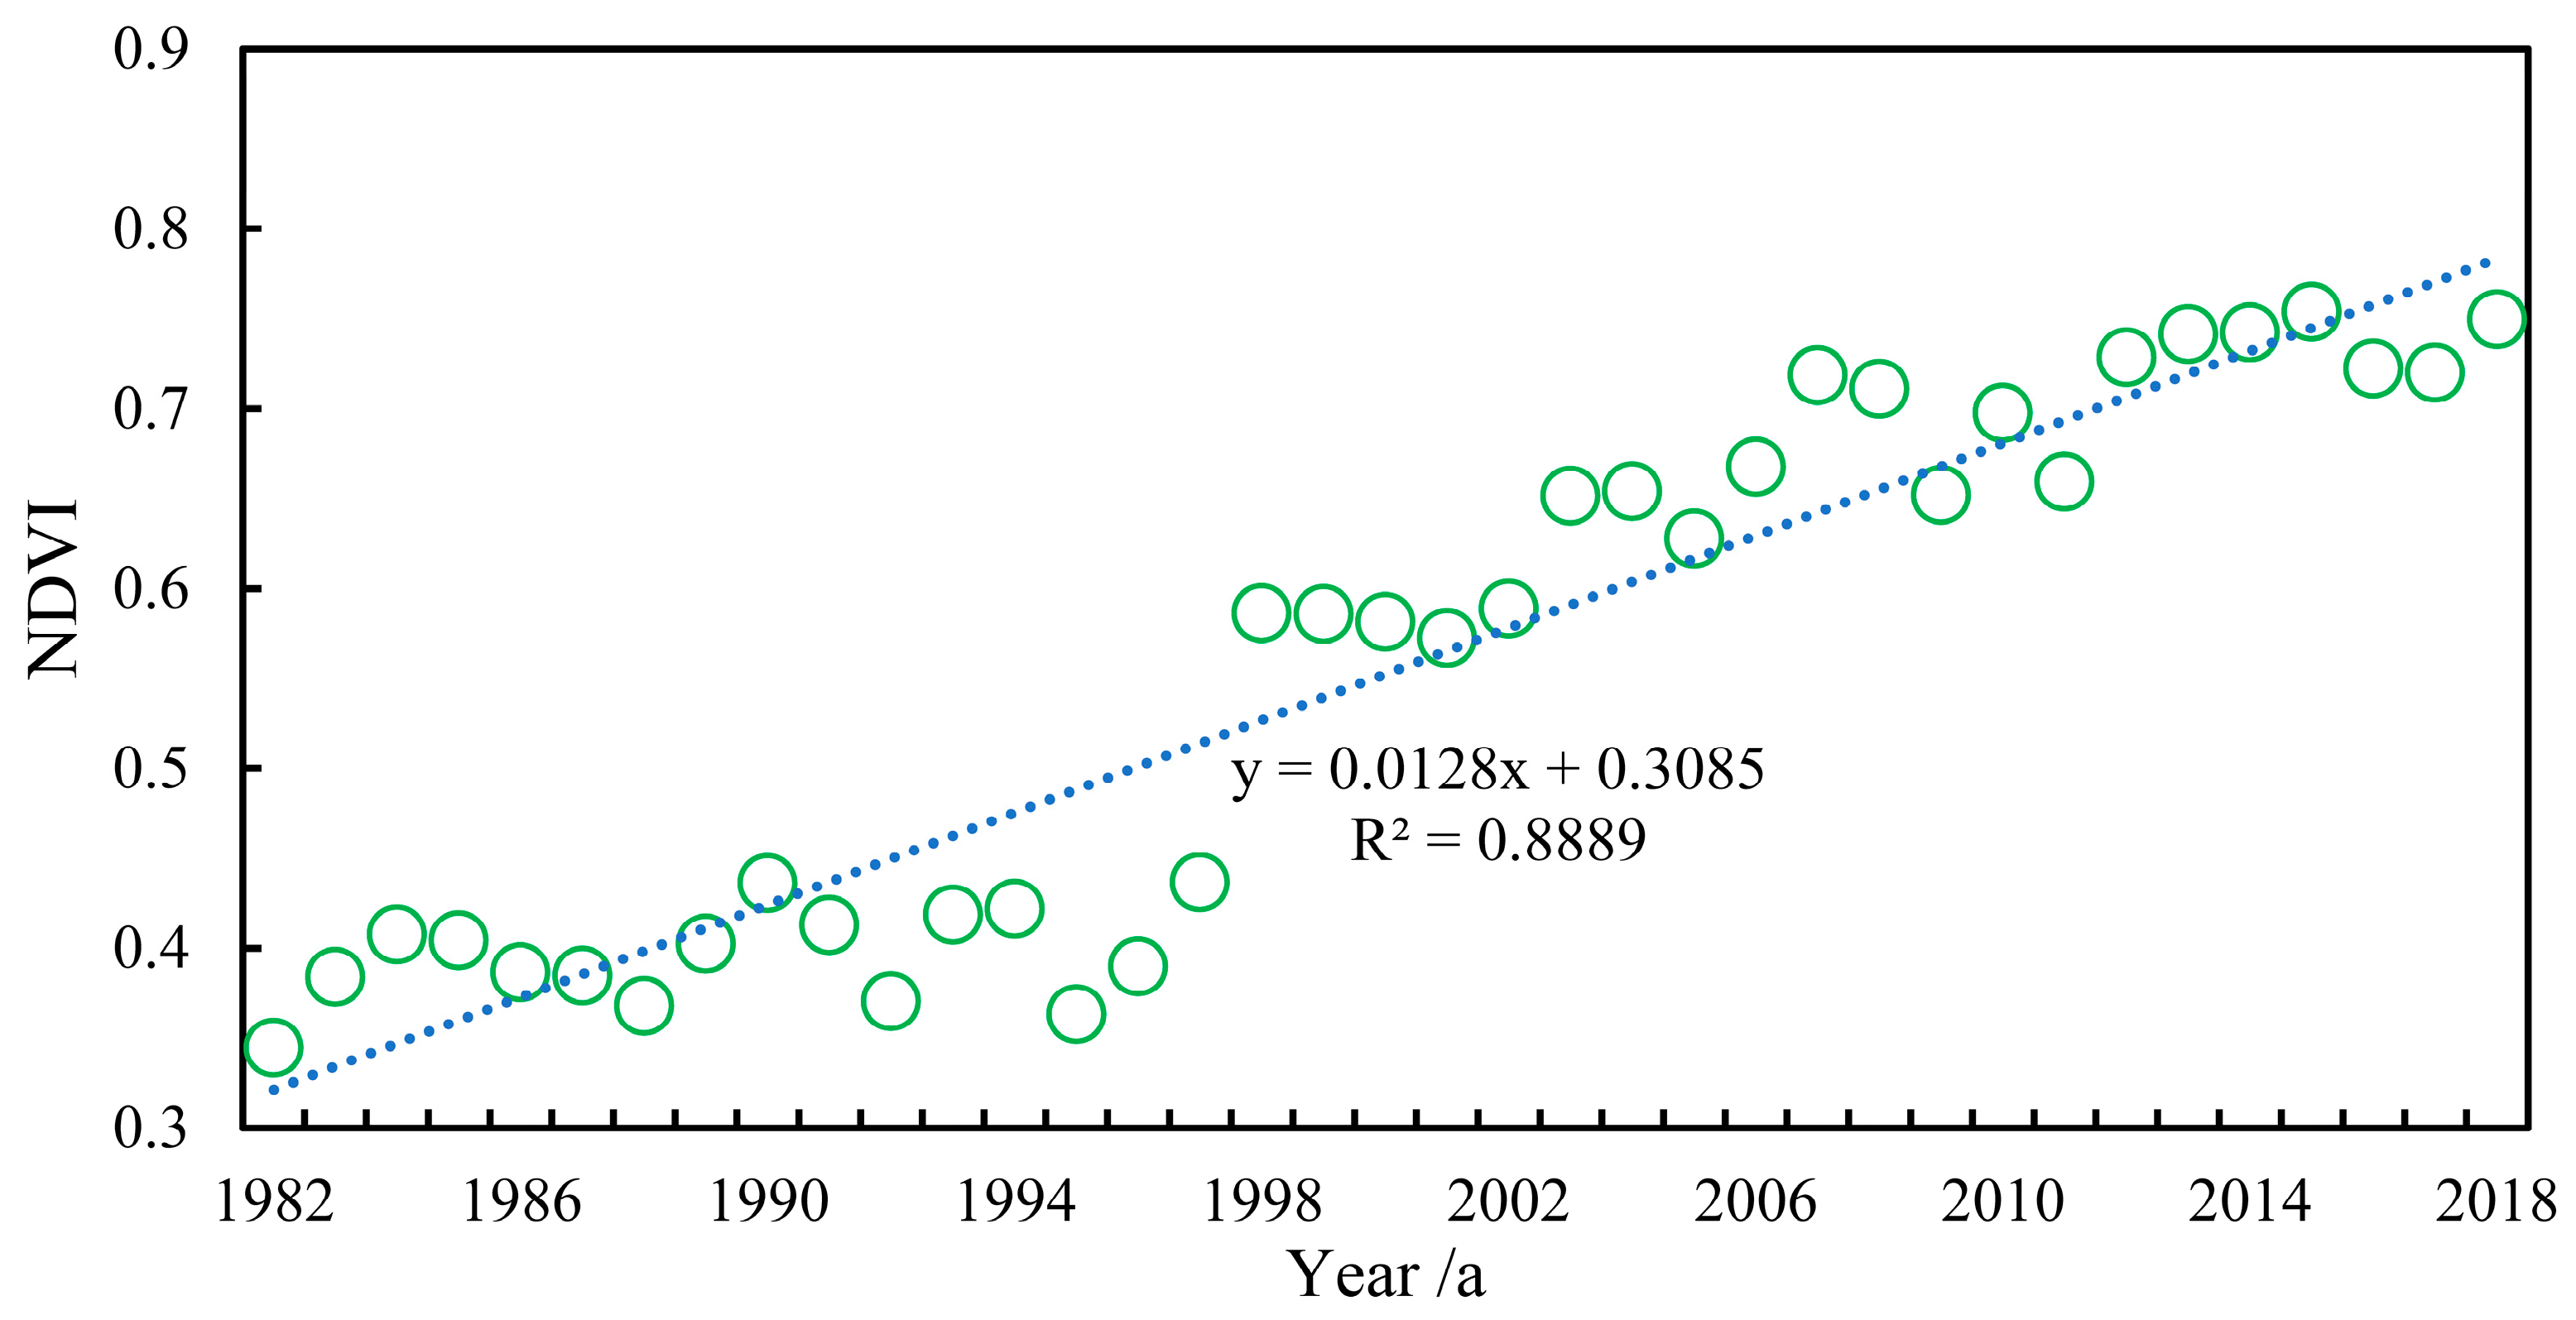
3.1.3. Variation Law of Underlying Surface

Figure 7 illustrates the variation trend of NDVI in the QRB from 1982 to 2018. The variation range of NDVI was 0.34–0.75. Notably, NDVI exhibited a significant upward trend, with a rising rate of 0.128/10a, indicating that the vegetation in the QRB was continuously improving. The vegetation coverage in the QRB has been consistently increasing since the implementation of afforestation policy in 1999.
Figure 8 depicts the average distribution, slope, and slope significance of NDVI in the QRB. Vegetation growth in the north was better than that in the south (NDVI in the north was higher than that in the south), and the maximum value of NDVI reached 0.88, while the south distribution of NDVI in the center was between 0.45 and 0.65 (Figure 8a). Figure 8b displays the change in the annual NDVI of the basin. Based on statistics, the proportion of grids with a slope greater than 0 was 97.6%, indicating that NDVI has significantly improved overall, and the vegetation coverage rate of the basin has continuously increased. In addition, we identified the grids with the NDVI trend value that passed the 5% significance test (Figure 8c). NDVI in the entire region shows a highly significant rising trend, with only a tiny part of NDVI in the southwest region exhibiting a slightly significant declining trend. The overall vegetation in the QRB has been effectively improved, and the regional soil erosion control effect is significant.

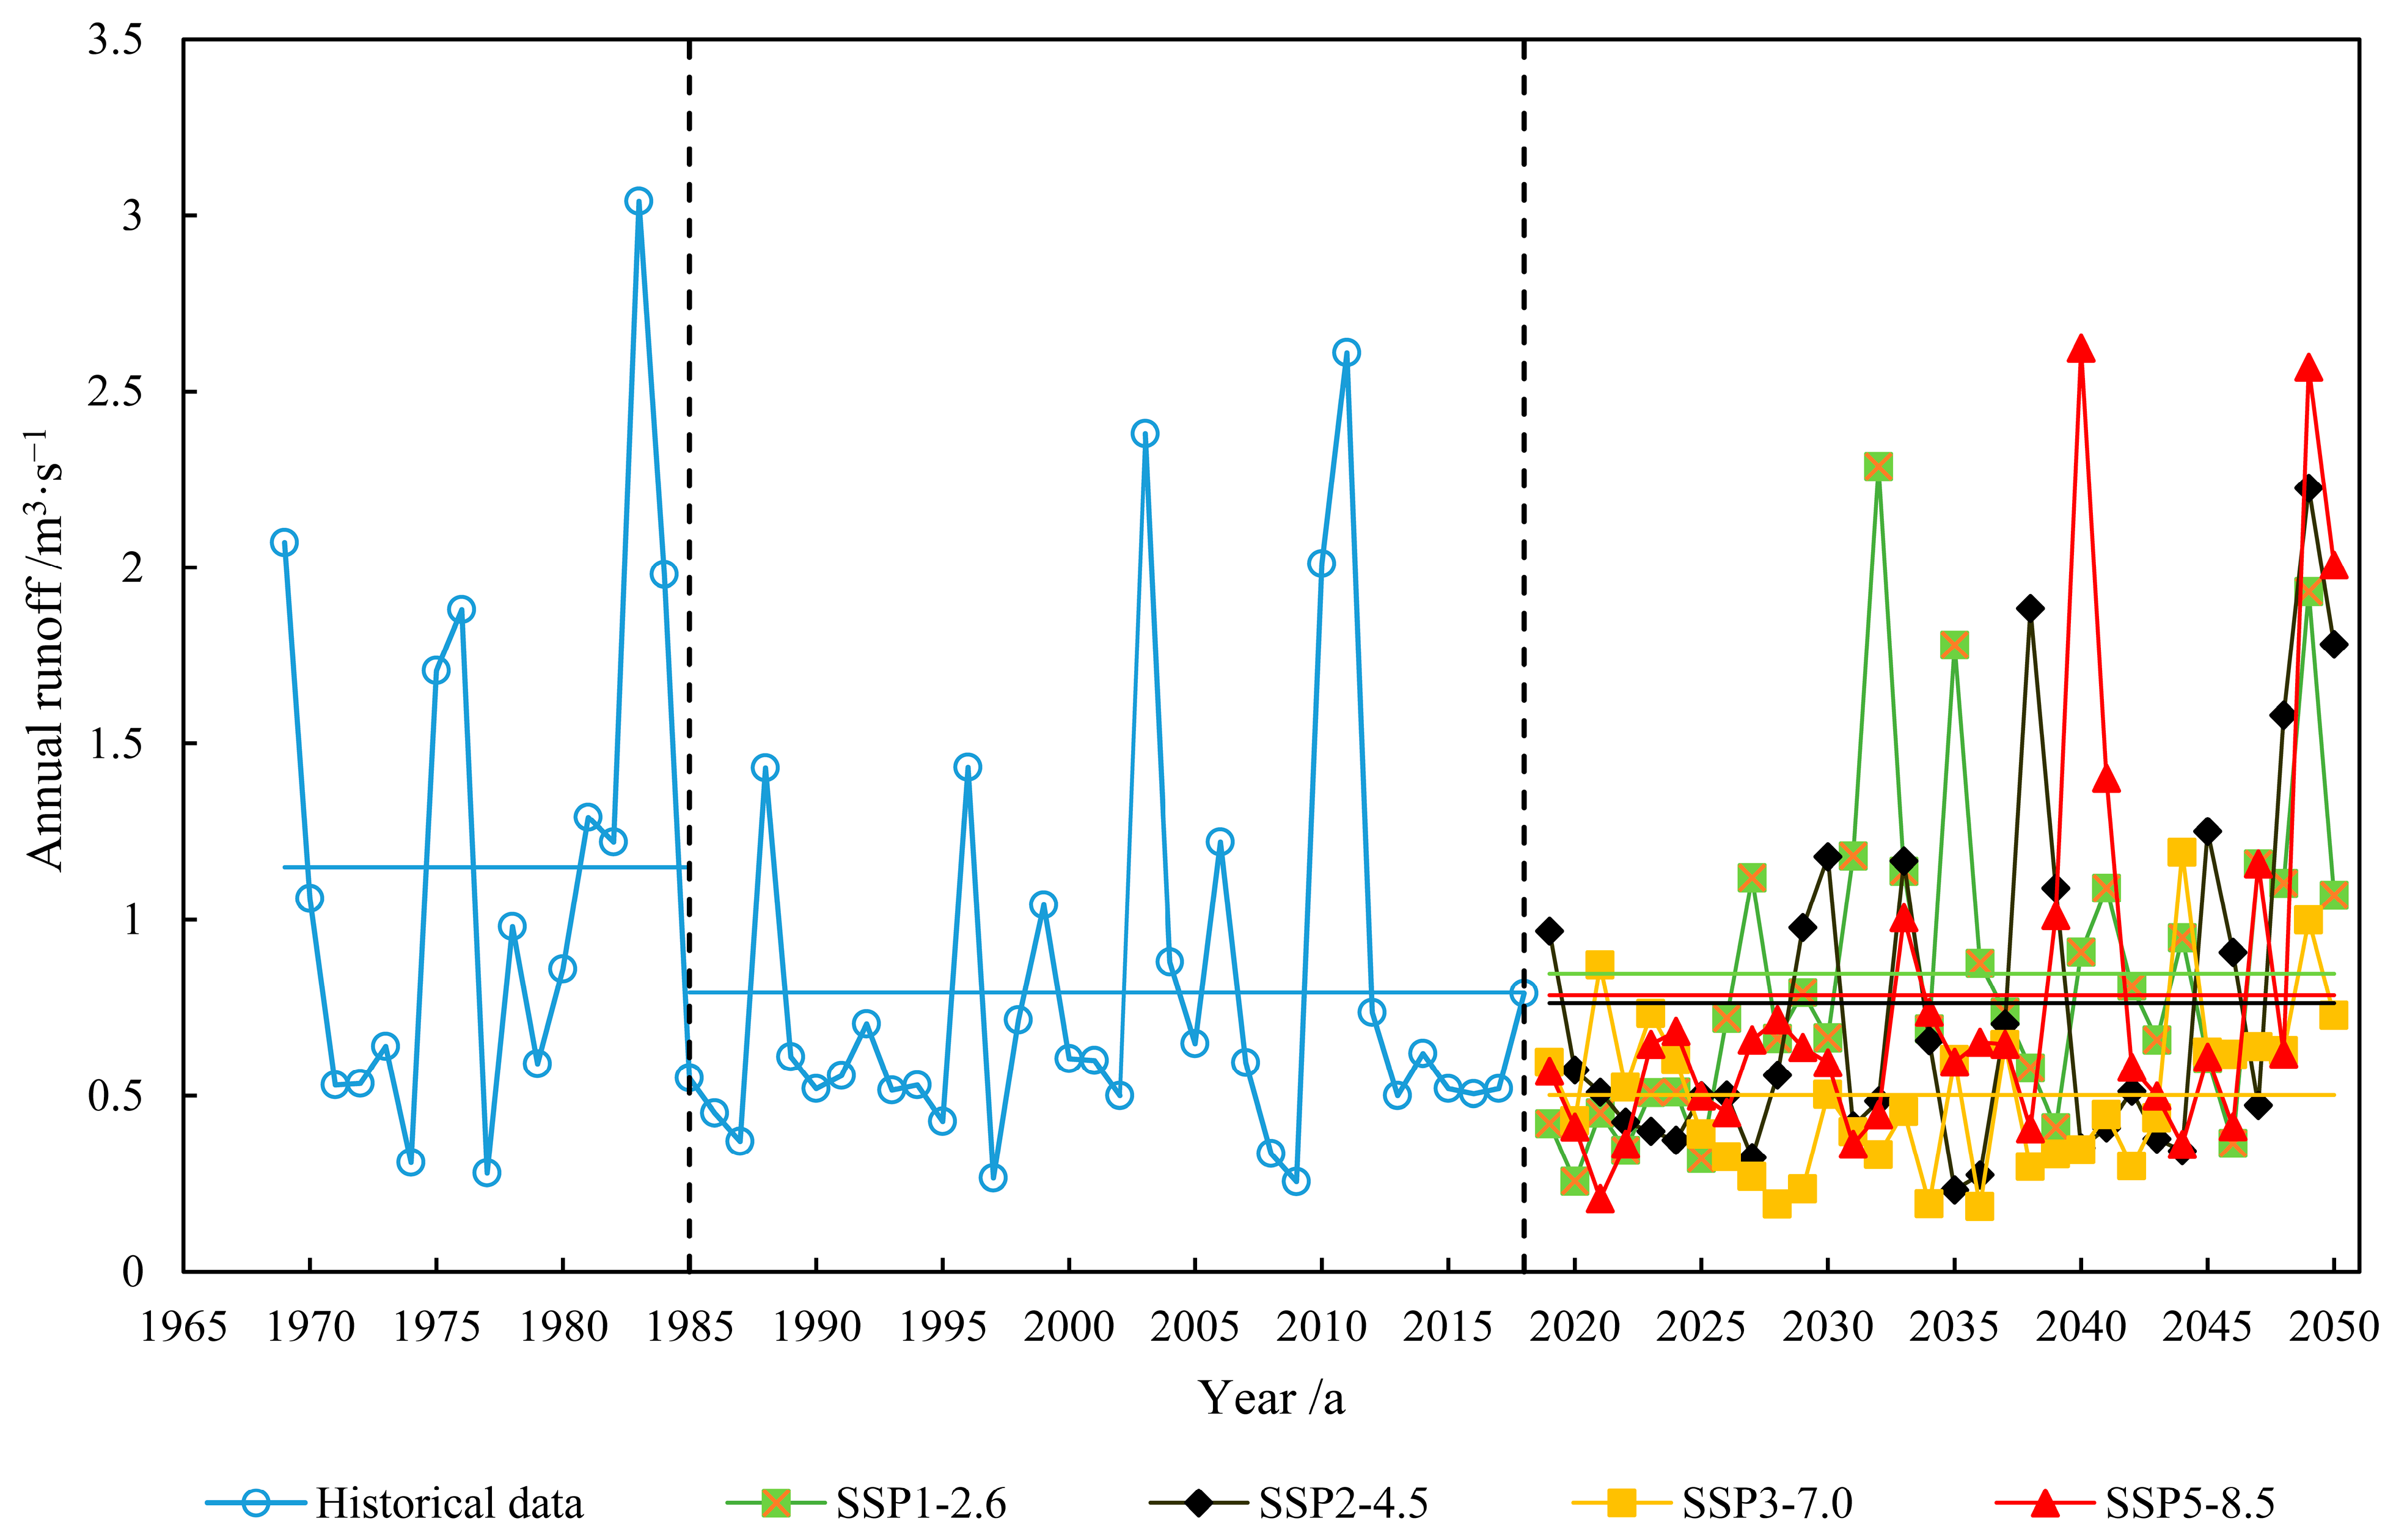
3.2. Characteristics of Historical and Future Runoff Variation in the QRB

Figure 9 shows historical annual runoff series and the future annual runoff under four SSP scenarios. It can be seen that the highest runoff was observed in the SSP1-2.6 scenario, while the lowest runoff was observed in the SSP3-7.0 scenario. Compared with the runoff during 1985–2019, the future runoff increased under the SSP1-2.6 scenario and decreased under the other three scenarios. In Section 3.4, we look for the cause of the runoff change in the future four scenarios. Among the runoff data used here, the annual runoff data from 1985 to 2018 are the historical measured data, and the annual runoff data from 2019 to 2050 are the runoff data simulated by SWAT under four scenarios.

3.3. Relative Impact of Climate Change and Human Activity on Historical Runoff Change in the QRB

The Pettitt test, sliding t-test, and the Mann–Kendall method were employed to identify the abrupt change point of runoff data collected from 1969 to 2018 at Yaoxian Station. Given the significant level of 5%, the abrupt change point of annual runoff appeared in 1985. Therefore, 1969–1984 is designated as Period 1 (P1) and 1985–2018 as Period 2 (P2). The next step involved calculations using Formulas (1)–(15). Table 3 shows that the ε E 0 , ε n , and ε P of Period 1 are −2.32, −2.12, and 3.32, respectively, indicating that when the potential evapotranspiration, underlying surface parameter n and precipitation decrease by 1%, the annual runoff decreases by −2.32%, −2.12%, and 3.32%, respectively. The ε E 0 , ε n , and ε P of Period 2 are −2.63, −2.39, and 3.63, respectively, indicating that when the potential evapotranspiration E0, underlying surface parameter n and precipitation P decrease by 1%, the annual runoff decreases by −2.63%, −2.39% and 3.63%, respectively. Notably, from Period 1 to Period 2, when the potential evapotranspiration, underlying surface parameter n, and precipitation change by 1%, the variation range of runoff increases.
According to Table 3 and Table 4, it can be concluded that a decrease of 1% in annual precipitation, annual potential evapotranspiration, and underlying surface parameter n of the QRB leads to a reduction in annual runoff by 3.48%, −2.48%, and −2.26%, respectively. Furthermore, the contribution rate of precipitation reduction to runoff reduction is 86.46%. In contrast, the contribution rate of potential evapotranspiration reduction to the reduction of runoff is −37.16%. The contribution rate of the increase in underlying surface parameter n to the reduction of runoff is 50.70%.
To verify the accuracy of the Choudhury–Yang formula, we adopted the DMC method to distinguish the contribution of climate change and human activities to the reduction of runoff in the QRB. The precipitation and runoff depth were accumulated, respectively. The double accumulation curve of cumulative runoff and precipitation depth is shown in Figure 10. The linear relationship between the two variables is significant.
In order to determine the calculated runoff depth after an abrupt change, the cumulative rainfall during 1985–2018 was substituted into the regression equation of the base period. The influences and contribution rates of climate change and human activities on runoff in the QRB were subsequently obtained, respectively, as shown in Table 5. By differentiating the effects of climate change and human activities on runoff, it can be observed that the runoff depth decreased by 7.28 mm due to climate change, and the contribution rate was 48.54%. The decrease in runoff caused by human activities was 7.72 mm, and the contribution rate was 51.46%. The calculated results agree with those of the Choudhury–Yang formula, which calculated that the contribution rate of climate change and human activities was 49.30% and 50.70%, respectively. The results of the Choudhury–Yang formula are reliable and genuinely reflect the causes of runoff changes in the QRB.

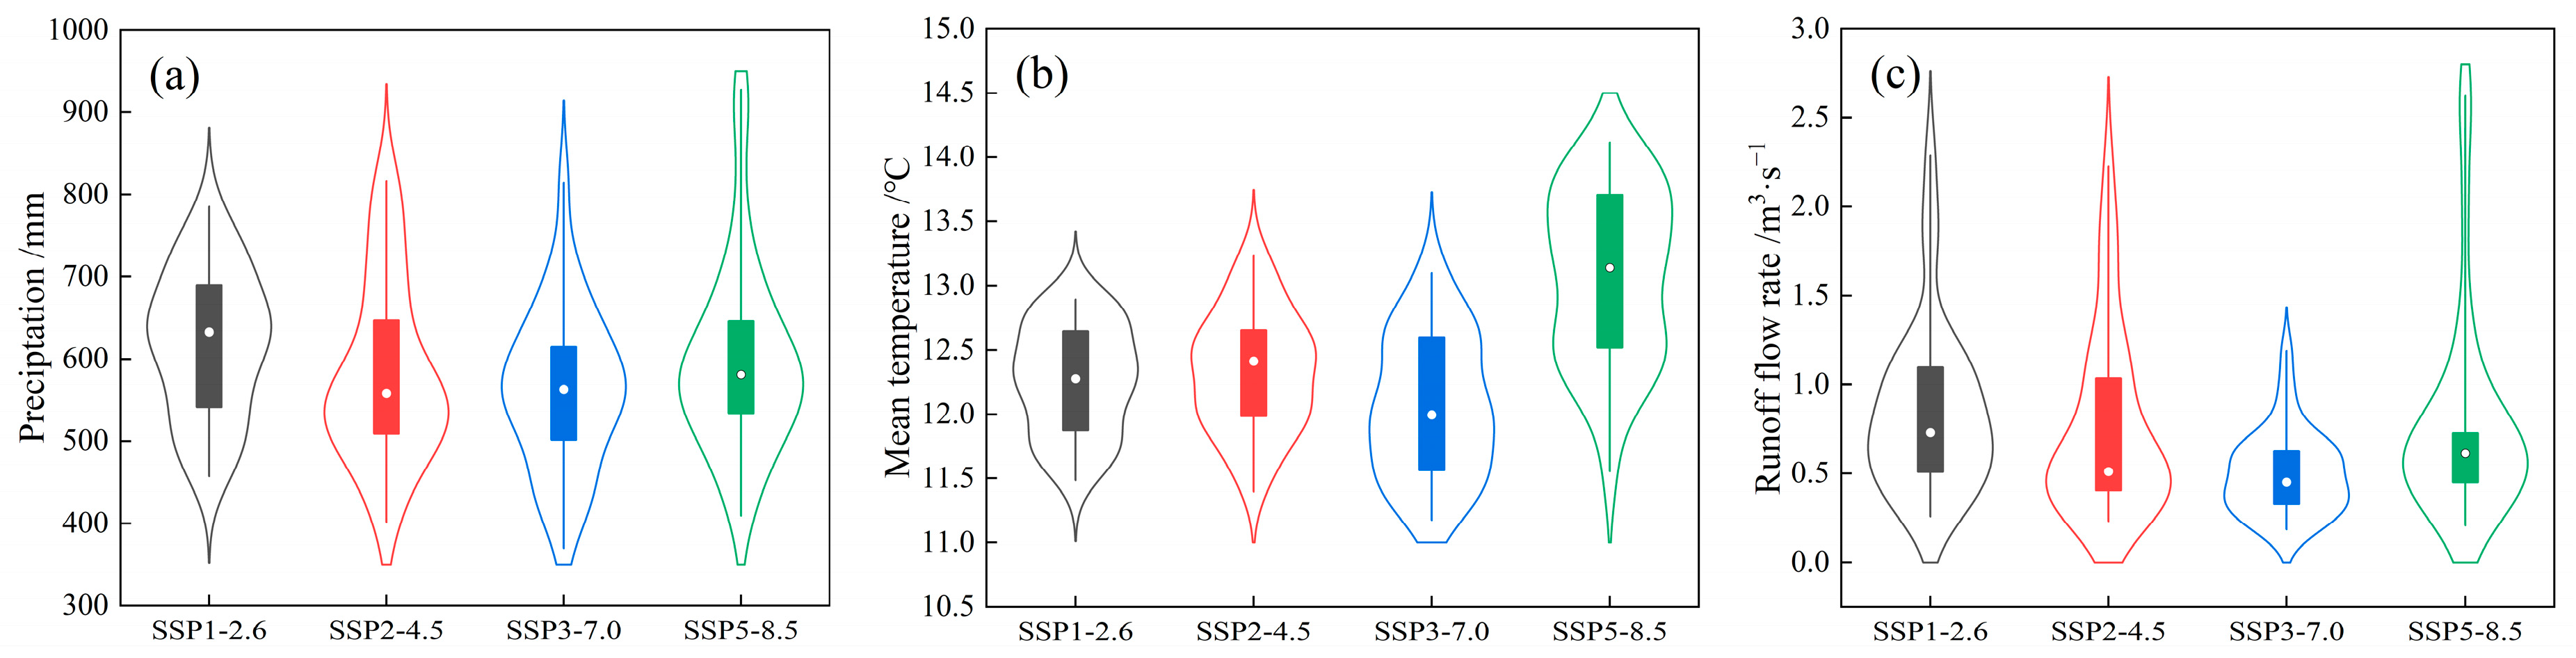
3.4. Relative Impact of Climate Change and Human Activity on Future Runoff Change in the QRB

Figure 11c displays the future runoff simulated by SWAT under different SSP scenarios from 2019 to 2050. It is observed that the future runoff is higher in the SSP1-2.6 scenario and lower in the SSP3-7.0 scenario, while the other two scenarios are intermediate. To identify the abrupt change points of runoff under various scenarios from 1985 to 2050, we integrated the future runoff with the measured runoff, and the results are summarized in Table 6. The abrupt points of runoff differ for different scenarios. Hence, we set 1985 to abrupt change year as the base period of runoff, abrupt change year to 2050 as the period of runoff change. Subsequently, we used the DMC method to estimate the contribution of climate change and human activities to runoff change. The contribution of climate change and human activities to runoff change under the four scenarios is presented in Table 6.
Table 6 indicates the variation trend of runoff under four scenarios in the future: runoff increases under SSP1-2.6, while it decreases under the other three scenarios. As shown in Table 6 and Figure 11a, the precipitation during the runoff change period under scenario SSP1-2.6 was the largest among the four scenarios. Precipitation in all four scenarios was higher than that in the base periods, but only the SSP1-2.6 scenario had an increase in runoff. The increasing runoff may be caused by the largest increase in precipitation under the SSP2.6 scenario. Figure 11b illustrates that the average temperature under SSP5-8.5 is higher than that under the other three scenarios.
Under SSP3-7.0, the largest variation in runoff is observed, even though the mean temperature is not significantly high. In the SSP5-8.5 scenario, the temperature during the runoff change period increases compared with the base period. In contrast, the temperature in the other three scenarios is lower than that in the base period. In the SSP1-2.6 scenario, the contribution rates of climate change and human activities to the future runoff increase are 72% and 28.01%, respectively. Under the SSP2-4.5 scenario, the contribution rates of climate change and human activities to future runoff reduction are −110.32% and 210.32%, respectively. Similarly, under the SSP3-7.0 and SSP5-8.5 scenarios, the contribution rates of climate change and human activities to future runoff reduction are −30.20% and 130.20%, respectively, and −92.54% and 192.54%, respectively. It can be found that the contribution rate of human activities to future runoff change is less than that of climate change in the SSP1-2.6 scenario. However, in the other three scenarios, the contribution rate of human activities to future runoff change is far greater than that of climate change. Therefore, although climate change in the QRB is likely to intensify in the future, human activities can still intervene and affect climate change on runoff.

4. Discussion

4.1. Challenges to Ensuring Water Security in the Watershed

The SSP2-4.5 scenario is projected to be the most likely scenario for human society to face in the future according to Hausfather’s study [79]. Compared to other scenarios, human activities are expected to contribute the most to the future reduction in the Qishui River runoff under SSP2-4.5. Based on our research results, both in the past and in the future, human activities are the main factors affecting the Qishui River runoff reduction (Table 5 and Table 6). For the QRB, afforestation is the most important human activity, which can help to stabilize soils and reduce erosion. This can lead to improved water quality, increased biodiversity, and increased carbon sequestration, which can have a positive impact on the environment and society. Additionally, increased vegetation reduces soil erosion, thus reducing the sediment content of runoff and further discouraging river bed silting.
However, an important reason for runoff attenuation is the increase in vegetation coverage, which can have some negative effects. The QRB is a region characterized by high soil and water loss, and a decrease in river runoff may result in a range of problems. The reduced river velocity caused by decreased flow can cause sediment from upstream to accumulate, leading to increased silting of the riverbed. During the dry season, the regulation function of the riverbank groundwater is gradually lost, which in turn affects the runoff of the river, making the runoff attenuated and even cutting off the flow in severe cases. Additionally, the reduction in river runoff directly affects river ecology in arid and water-deficient areas. During both the wet and dry seasons, the reduced flow in the river can make it difficult for some organisms to reach the hydraulic conditions required for growth and reproduction. Moreover, the decrease in runoff can lead to decreased water availability, which can affect agriculture, industry, and households that rely on water for various purposes. This can cause decreased food production, higher food prices, and increased competition for water resources [80]. Runoff reduction poses challenges to water security in the QRB.
Based on the above analysis, it is evident that a larger forest area does not necessarily always result in better outcomes for human society. If the afforestation policy is not properly planned and implemented, it can even lead to the loss of biodiversity, soil degradation, and reduced productivity.

4.2. Countermeasures to Ensure Water Resources Sustainability

China’s afforestation policy in the Loess Plateau has been effective in reducing soil erosion, and it will continue in the QRB in the future to prevent future problems such as sediment accumulation in the Qishui River caused by reduced runoff. However, when implementing afforestation policies, it is essential to carefully consider the potential benefits and risks and develop strategies to minimize the negative impacts while maximizing the positive ones. While implementing afforestation such as the 3-North Shelter Forest Program, China’s government has proposed many effective measures to strengthen water resources sustainability. For instance, tree species that are well adapted to the local conditions have been carefully selected, which can effectively stabilize the soil and prevent erosion [81]. Species such as Chinese pine, black locust, and elm have been found to be effective in reducing soil erosion and improving soil quality in the Loess Plateau [82]. China has also implemented ecological engineering measures in the Loess Plateau such as contour plowing and checking of dams to reduce soil erosion and improve water retention in the soil. These measures help to slow down runoff of the Qishui River and allow more water to infiltrate into the soil, thereby reducing the risk of sediment accumulation in river downstream [83]. Moreover, local government encouraged public participation in afforestation programs, including the involvement of local farmers and communities in tree planting and land management activities [84]. This approach helps to ensure that afforestation policies are aligned with local needs and priorities, and that they are sustainable in the long term.
In addition to measures that have already been implemented, three other promising options can be implemented. Firstly, an appropriate value of forest area needs to be determined. A common conclusion from previous studies is that deforestation increases annual runoff, while afforestation decreases it [85,86,87,88]. When the QRB has the right amount of forest, the degree of soil and water loss in the basin is small, and the river runoff is also suitable for social and economic development [89]. For the Chinese government, a way to balance the relationship between afforestation area and river flow has become an important issue for policy makers to consider. Additionally, it is necessary to monitor and evaluate the relationship between a reasonable threshold and existing vegetation coverage. If the coverage exceeds this threshold, it should be reduced; if there is a significant gap with this threshold, it should be raised. Hence, the Chinese government can establish monitoring and evaluation systems to assess the effectiveness of afforestation policies and identify areas for improvement. For example, remote sensing technologies are used to monitor the progress of reforestation and soil erosion reduction, and hydrological modeling is used to evaluate the impact of afforestation on water resources [90,91]. Moreover, runoff attenuation caused by human activities has significantly affected river ecological environment [92]. Therefore, in the development and utilization of lacquer river water resources, local government should ensure that enough ecological water is reserved in the river to maintain the good cycle of the Qishui River ecosystem [92].

4.3. Uncertainties and Limitations

Our study revealed that the precipitation decreased and the temperature increased in the QRB during 1969–2018, and the climate of the basin became warmer and drier in the past 50 years, which is consistent with the study of [80,93,94]. The change in runoff in the historical period is mainly caused by human activities, which is consistent with the study of [95].
Although our study is consistent with previous research, there are still some uncertainties and limitations that need to be acknowledged. Firstly, while previous studies have validated the good performance of the Choudhury–Yang formula [47,96], there are still uncertainties and limitations in its accuracy. One possible reason for this is the simplification of physical processes. When using the Choudhury–Yang formula, like many other scholars, we believe that P, E0 and n are three independent variables, but in fact they are not [97]. The change in precipitation causes the change in evapotranspiration, and also has a certain impact on regional vegetation growth. Therefore, there are some errors in the process of calculating the contribution rate of each factor. A second potential explanation is that the underlying surface parameter n in this formula only considers simple factors such as terrain, soil, and vegetation, which cannot fully reflect all the impacts of human activities [49]. In addition, large spatial resolution of meteorological data, land use data and soil data also causes certain errors in the process of SWAT model construction. Thirdly, in the process of correcting CMIP6 data, we selected an average of seven models. Averaging multiple models produced results that fit the actual values better than data from individual models. In the future, we could consider using a larger number of climate models to improve the accuracy of data correction even further.

5. Conclusions

Loess Plateau has the most severe soil and water loss worldwide. The hydrological evolution driven by climate change and human activities is a crucial scientific problem in this area. Based on the analysis of the meteorological elements and the underlying surface in the QRB, a small watershed in the Loess Plateau, we study the causes of the historical and future runoff variation under the changing environment. Our results reveal that human activities contribute more to runoff change than climate change, both in the historical period (1969–2018) and in the future (2019–2050). Specifically in the historical period, the contribution rates of climate change and human activities to runoff change were 51.46% and 48.54%, respectively, which were almost equal, with a difference of only about 1%. In the future, with the development of social economy, this situation will change, since the influence of human activities is far greater than that of climate change. In the future period, the contribution rate of climate change and human activities is projected to be −110.32% and 210.32%, respectively. Furthermore, our findings suggest that the decreasing trend in runoff is mainly attributed to the implementation of the afforestation policy in the QRB.
The implementation of afforestation policies is a critical step towards mitigating soil and water loss in the QRB. However, it can also result in a reduction in surface runoff, which can have adverse effects. Therefore, attention should be paid to the sustainable use of water resources in the future. It is essential to optimize the local industrial structure to prevent over-consumption of energy. Based on the findings of this research, we propose three measures to ensure the sustainability of water resources in the QRB: (1) Balance the relationship between afforestation area and river flow, and find a suitable forest area for sustainable development of the QRB; (2) establish monitoring and evaluation systems to assess the effectiveness of afforestation policies and identify areas for improvement; (3) ensure that sufficient ecological water is reserved in the river to maintain the good cycle of the Qishui River ecosystem. In general, ensuring afforestation policies and water security simultaneously is proving to be a challenging task in the Loess Plateau region due to the increase in forested area coupled with a decrease in available water. Going forward, it is crucial to conduct comprehensive studies that explore all aspects of the relationship between water and afforestation. This will enable the development of integrated and explicit plans for the sustainable use of resources while ensuring water security in the QRB.

Author Contributions

Conceptualization, W.L. and G.H.; methodology, W.L. and G.H.; software, W.L. and H.W.; validation, G.H. and Z.L.; formal analysis, W.L.; investigation, Y.Z.; resources, Z.L.; data curation, W.L. and F.H.; writing—original draft preparation, W.L.; writing—review and editing, G.H., Y.Z., Z.L., F.H. and H.W.; visualization, W.L.; supervision, Y.Z.; project administration, Y.Z.; funding acquisition, Y.Z. All authors have read and agreed to the published version of the manuscript.

Funding

This work was supported by the National Key Research and Development Program of China ((No.2021YFC3200204) and the Funds of National Natural Science Foundation of China (Grant No.52025093, 52109042).

Institutional Review Board Statement

Not applicable.

Informed Consent Statement

Not applicable.

Data Availability Statement

Data is unavailable due to privacy or ethical restrictions.

Conflicts of Interest

The authors declare no conflict of interest.

References

  1. Zhou, J.; Fu, B.; Gao, G.; Lü, Y.; Liu, Y.; Lü, N.; Wang, S. Effects of precipitation and restoration vegetation on soil erosion in a semi-arid environment in the Loess Plateau, China. Catena 2016, 137, 1–11. [Google Scholar] [CrossRef]
  2. Li, B.; Li, P.; Zhang, W.; Ji, J.; Liu, G.; Xu, M. Deep soil moisture limits the sustainable vegetation restoration in arid and semi-arid Loess Plateau. Geoderma 2021, 399, 115122. [Google Scholar] [CrossRef]
  3. Zhu, Y.; Jia, X.; Shao, M. Loess Thickness Variations across the Loess Plateau of China. Surv. Geophys. 2018, 39, 715–727. [Google Scholar] [CrossRef]
  4. Portenga, E.; Bierman, P. Understanding Earth’s eroding surface with 10Be. GSA Today 2011, 21, 4–10. [Google Scholar] [CrossRef] [Green Version]
  5. Xia, L.; Bi, R.; Song, X.; Hu, W.; Lyu, C.; Xi, X.; Li, H. Soil moisture response to land use and topography across a semi-arid watershed: Implications for vegetation restoration on the Chinese Loess Plateau. J. Mt. Sci. 2022, 19, 103–120. [Google Scholar] [CrossRef]
  6. Li, J.; Li, Z.; Guo, M.; Li, P.; Cheng, S.; Yuan, B. Effects of vegetation restoration on soil physical properties of abandoned farmland on the Loess Plateau, China. Environ. Earth Sci. 2018, 77, 205. [Google Scholar] [CrossRef]
  7. Shi, H.; Shao, M. Soil and water loss from the Loess Plateau in China. J. Arid. Environ. 2000, 45, 9–20. [Google Scholar] [CrossRef] [Green Version]
  8. Jiang, C.; Xiong, L.; Wang, D.; Liu, P.; Guo, S.; Xu, C.-Y. Separating the impacts of climate change and human activities on runoff using the Budyko-type equations with time-varying parameters. J. Hydrol. 2015, 522, 326–338. [Google Scholar] [CrossRef]
  9. Gao, G.; Fu, B.; Wang, S.; Liang, W.; Jiang, X. Determining the hydrological responses to climate variability and land use/cover change in the Loess Plateau with the Budyko framework. Sci. Total Environ. 2016, 557–558, 331–342. [Google Scholar] [CrossRef]
  10. Chao, Z.; Liu, G.; Xue, S.; Sun, C. Soil organic carbon and total nitrogen storage as affected by land use in a small watershed of the Loess Plateau, China. Eur. J. Soil Biol. 2013, 54, 16–24. [Google Scholar]
  11. Zhao, G.; Gao, P.; Tian, P.; Sun, W.; Hu, J.; Mu, X. Assessing sediment connectivity and soil erosion by water in a representative catchment on the Loess Plateau, China. Catena 2020, 185, 104284. [Google Scholar] [CrossRef]
  12. 3-North Shelter Forest Program. Available online: http://www.forestry.gov.cn/main/586/20211008/172030780867223.html (accessed on 10 April 2023).
  13. Shi, P.; Li, P.; Li, Z.; Sun, J.; Wang, D.; Min, Z. Effects of grass vegetation coverage and position on runoff and sediment yields on the slope of Loess Plateau, China. Agric. Water Manag. 2022, 259, 107231. [Google Scholar] [CrossRef]
  14. Zhao, L.; Meng, P.; Zhang, J.; Zhang, J.; Li, J.; Wang, X. The contribution of human activities to runoff and sediment changes in the Mang River basin of the Loess Plateau, China. Land Degrad. Dev. 2023, 34, 28–41. [Google Scholar] [CrossRef]
  15. Zheng, H.; Miao, C.; Zhang, G.; Li, X.; Wang, S.; Wu, J.; Gou, J. Is the runoff coefficient increasing or decreasing after ecological restoration on China’s Loess Plateau? Int. Soil Water Conserv. Res. 2021, 9, 333–343. [Google Scholar] [CrossRef]
  16. Yu, Y.; Zhu, R.; Ma, D.; Liu, D.; Liu, Y.; Gao, Z.; Yin, M.; Bandala, E.R.; Rodrigo-Comino, J. Multiple surface runoff and soil loss responses by sandstone morphologies to land-use and precipitation regimes changes in the Loess Plateau, China. Catena 2022, 217, 106477. [Google Scholar] [CrossRef]
  17. Wang, Z.; Xu, M.; Liu, X.; Singh, D.K.; Fu, X. Quantifying the impact of climate change and anthropogenic activities on runoff and sediment load reduction in a typical Loess Plateau watershed. J. Hydrol. Reg. Stud. 2022, 39, 100992. [Google Scholar] [CrossRef]
  18. Liu, Y.; Hu, X.; Wu, F.; Chen, B.; Liu, Y.; Yang, S.; Weng, Z. Quantitative analysis of climate change impact on Zhangye City’s economy based on the perspective of surface runoff. Ecol. Indic. 2019, 105, 645–654. [Google Scholar] [CrossRef]
  19. Wang, X.; He, K.; Dong, Z. Effects of climate change and human activities on runoff in the Beichuan River Basin in the northeastern Tibetan Plateau, China. Catena 2019, 176, 81–93. [Google Scholar] [CrossRef]
  20. Zhang, H.; Meng, C.; Wang, Y.; Wang, Y.; Li, M. Comprehensive evaluation of the effects of climate change and land use and land cover change variables on runoff and sediment discharge. Sci. Total Environ. 2020, 702, 134401. [Google Scholar] [CrossRef]
  21. Xue, D.; Zhou, J.; Zhao, X.; Liu, C.; Wei, W.; Yang, X.; Li, Q.; Zhao, Y. Impacts of climate change and human activities on runoff change in a typical arid watershed, NW China. Ecol. Indic. 2021, 121, 107013. [Google Scholar] [CrossRef]
  22. Wang, D.; Yu, X.; Jia, G.; Wang, H. Sensitivity analysis of runoff to climate variability and land-use changes in the Haihe Basin mountainous area of north China. Agric. Ecosyst. Environ. 2019, 269, 193–203. [Google Scholar] [CrossRef]
  23. Eigentler, L.; Sherratt, J.A. Effects of precipitation intermittency on vegetation patterns in semi-arid landscapes. Phys. D 2020, 405, 132396. [Google Scholar] [CrossRef] [Green Version]
  24. Liu, Q.; McVicar, T.R. Assessing climate change induced modification of Penman potential evaporation and runoff sensitivity in a large water-limited basin. J. Hydrol. 2012, 464, 352–362. [Google Scholar] [CrossRef]
  25. Wu, Y.; Zhang, H.; Lan, T.; Wei, X.; Shao, S.; Zhang, J.; Ding, H. Attribution of runoff variation to climate and human-driven changes in the transition zone between the Qinling Mountains and the Loess Plateau under vegetation greening. Hydrol. Res. 2022, 53, 733–753. [Google Scholar] [CrossRef]
  26. Gao, X.; Yan, C.; Wang, Y.; Zhao, X.; Zhao, Y.; Sun, M.; Peng, S. Attribution analysis of climatic and multiple anthropogenic causes of runoff change in the Loess Plateau—A case-study of the Jing River Basin. Land Degrad. Dev. 2020, 31, 1622–1640. [Google Scholar] [CrossRef]
  27. Zhang, Y.; Cheng, D.; Lei, Y.; Song, J.; Xia, J. Spatiotemporal distribution of polycyclic aromatic hydrocarbons in sediments of a typical river located in the Loess Plateau, China: Influence of human activities and land-use changes. J. Hazard. Mater. 2022, 424, 127744. [Google Scholar] [CrossRef]
  28. Jiao, Y.; Lei, H.; Yang, D.; Huang, M.; Liu, D.; Yuan, X. Impact of vegetation dynamics on hydrological processes in a semi-arid basin by using a land surface-hydrology coupled model. J. Hydrol. 2017, 551, 116–131. [Google Scholar] [CrossRef]
  29. Merz, R.; Blöschl, G.; Parajka, J. Spatio-temporal variability of event runoff coefficients. J. Hydrol. 2006, 331, 591–604. [Google Scholar] [CrossRef]
  30. Zhang, Q.; Li, H.; Zhang, L.; Yue, P.; Shi, J. Responses of the land-surface process and its parameters over the natural vegetation underlying surface of the middle of Gansu in loess plateau to precipitation fluctuation. Acta Phys. Sin. 2013, 62, 19201. [Google Scholar] [CrossRef]
  31. Wang, S.; Chen, Z.; Ji, T.; Di, Q.; Li, L.; Wang, X.; Wei, M.; Shi, Q.; Li, Y.; Gong, B.; et al. Genome-wide identification and characterization of the R2R3MYB transcription factor superfamily in eggplant (Solanum melongena L.). Agri Gene 2016, 2, 38–52. [Google Scholar] [CrossRef]
  32. Shi, P.; Zhang, Y.; Ren, Z.; Yu, Y.; Li, P.; Gong, J. Land-use changes and check dams reducing runoff and sediment yield on the Loess Plateau of China. Sci. Total Environ. 2019, 664, 984–994. [Google Scholar] [CrossRef]
  33. Xu, G.; Cheng, Y.; Zhao, C.; Mao, J.; Li, Z.; Jia, L.; Zhang, Y.; Wang, B. Effects of driving factors at multi-spatial scales on seasonal runoff and sediment changes. Catena 2023, 222, 106867. [Google Scholar] [CrossRef]
  34. Li, Y.; Mao, D.; Feng, A.; Schillerberg, T. Will human-induced vegetation regreening continually decrease runoff in the loess plateau of China? Forests 2019, 10, 906. [Google Scholar] [CrossRef] [Green Version]
  35. Zhao, G.; Mu, X.; Jiao, J.; Gao, P.; Sun, W.; Li, E.; Wei, Y.; Huang, J. Assessing response of sediment load variation to climate change and human activities with six different approaches. Sci. Total Environ. 2018, 639, 773–784. [Google Scholar] [CrossRef]
  36. Lyu, J.; Mo, S.; Luo, P.; Zhou, M.; Shen, B.; Nover, D. A quantitative assessment of hydrological responses to climate change and human activities at spatiotemporal within a typical catchment on the Loess Plateau, China. Quat. Int. 2019, 527, 1–11. [Google Scholar] [CrossRef]
  37. Choudhury, B. Evaluation of an empirical equation for annual evaporation using field observations and results from a biophysical model. J. Hydrol. 1999, 216, 99–110. [Google Scholar] [CrossRef]
  38. Yang, D.; Shao, W.; Yeh, P.J.F.; Yang, H.; Kanae, S.; Oki, T. Impact of vegetation coverage on regional water balance in the nonhumid regions of China. Water Resour. Res. 2009, 45, 450–455. [Google Scholar] [CrossRef] [Green Version]
  39. Zhang, L.; Walker, G.R.; Dawes, W. Predicting the Effect of Vegetation Changes on Catchment Average Water Balance; Technical Report. 1999. Available online: https://www.ewater.org.au/archive/crcch/archive/pubs/pdfs/technical199912.pdf (accessed on 24 December 2022).
  40. Yang, H.; Yang, D.; Lei, Z.; Sun, F. New analytical derivation of the mean annual water-energy balance equation. Water Resour. Res. 2008, 44, 893–897. [Google Scholar] [CrossRef]
  41. Fu, B. On the calculation of the evaporation from land surface. Chin. J. Atmos. Sci. 1981, 5, 23–31. (In Chinese) [Google Scholar] [CrossRef]
  42. Wang, F.; Duan, K.; Fu, S.; Gou, F.; Liang, W.; Yan, J.; Zhang, W. Partitioning climate and human contributions to changes in mean annual streamflow based on the Budyko complementary relationship in the Loess Plateau, China. Sci. Total Environ. 2019, 665, 579–590. [Google Scholar] [CrossRef]
  43. Aryal, Y.; Zhu, J. Effect of watershed disturbance on seasonal hydrological drought: An improved double mass curve (IDMC) technique. J. Hydrol. 2020, 585, 124746. [Google Scholar] [CrossRef]
  44. Budyko, M.I. Climate and Life; Academic Press: New York, NY, USA; London, UK, 1974. [Google Scholar]
  45. Li, H.; Shi, C.; Sun, P.; Zhang, Y.; Collins, A.L. Attribution of runoff changes in the main tributaries of the middle Yellow River, China, based on the Budyko model with a time-varying parameter. Catena 2021, 206, 105557. [Google Scholar] [CrossRef]
  46. Gao, P.; Mu, X.-M.; Wang, F.; Li, R. Changes in streamflow and sediment discharge and the response to human activities in the middle reaches of the Yellow River. Hydrol. Earth Syst. Sci. 2011, 15, 1–10. [Google Scholar] [CrossRef] [Green Version]
  47. Wang, F.; Xia, J.; Zou, L.; Zhan, C.; Liang, W. Estimation of time-varying parameter in Budyko framework using long short-term memory network over the Loess Plateau, China. J. Hydrol. 2022, 607, 127571. [Google Scholar] [CrossRef]
  48. Ning, T.; Li, Z.; Liu, W. Separating the impacts of climate change and land surface alteration on runoff reduction in the Jing River catchment of China. Catena 2016, 147, 80–86. [Google Scholar] [CrossRef]
  49. Yang, L.; Zhao, G.; Tian, P.; Mu, X.; Tian, X.; Feng, J.; Bai, Y. Runoff changes in the major river basins of China and their responses to potential driving forces. J. Hydrol. 2022, 607, 127536. [Google Scholar] [CrossRef]
  50. Ni, Y.; Yu, Z.; Lv, X.; Ma, L.; Zhang, Q.; Wang, J. Response of runoff to vegetation change in typical basin of the Loess Plateau. Ecol. Eng. 2022, 182, 106704. [Google Scholar] [CrossRef]
  51. Yu, K.; Zhang, X.; Xu, B.; Li, P.; Zhang, X.; Li, Z.; Zhao, Y. Evaluating the impact of ecological construction measures on water balance in the Loess Plateau region of China within the Budyko framework. J. Hydrol. 2021, 601, 126596. [Google Scholar] [CrossRef]
  52. Zheng, J.; He, Y.; Jiang, X.; Nie, T.; Lei, Y. Attribution analysis of runoff variation in Kuye River Basin based on three Budyko methods. Land 2021, 10, 1061. [Google Scholar] [CrossRef]
  53. Xu, X. Spatial distribution of annual Normalized Difference Vegetation Index (NDVI) in China. In Resource and Environmental Science and Data Registration and Publication System; Chinese Academy of Sciences: Beijing, China, 2018. [Google Scholar]
  54. Jiang, L.; Liu, Y.; Wu, S.; Yang, C. Analyzing ecological environment change and associated driving factors in China based on NDVI time series data. Ecol. Indic. 2021, 129, 107933. [Google Scholar] [CrossRef]
  55. Zhao, H.; Gu, B.; Lindley, S.; Zhu, T.; Fan, J. Regulation factors driving vegetation changes in China during the past 20 years. J. Geogr. Sci. 2023, 33, 508–528. [Google Scholar] [CrossRef]
  56. Wang, M.; Fu, J.; Wu, Z.; Pang, Z. Spatiotemporal Variation of NDVI in the Vegetation Growing Season in the Source Region of the Yellow River, China. ISPRS Int. J. Geoinf. 2020, 9, 282. [Google Scholar] [CrossRef] [Green Version]
  57. The Yellow River Basin Hydrological Yearbook of China; Yellow River Water Conservancy Committee: Zhengzhou, China, 2021.
  58. Hoeting, J.A.; Madigan, D.; Raftery, A.E.; Volinsky, C.T. Bayesian Model Averaging: A Tutorial. Stat. Sci. 1999, 14, 382–401. [Google Scholar]
  59. Miao, C.; Su, L.; Sun, Q.; Duan, Q. A nonstationary bias-correction technique to remove bias in GCM simulations. J. Geophys. Res. Atmos. 2016, 121, 5718–5735. [Google Scholar] [CrossRef]
  60. Eyring, V.; Bony, S.; Meehl, G.A.; Senior, C.A.; Stevens, B.; Stouffer, R.J.; Taylor, K.E. Overview of the Coupled Model Intercomparison Project Phase 6 (CMIP6) experimental design and organization. Geosci. Model Dev. 2016, 9, 1937–1958. [Google Scholar] [CrossRef] [Green Version]
  61. Cook, B.I.; Mankin, J.S.; Marvel, K.; Williams, A.P.; Smerdon, J.E.; Anchukaitis, K.J. Twenty-First Century Drought Projections in the CMIP6 Forcing Scenarios. Earths Future 2020, 8, e2019EF001461. [Google Scholar] [CrossRef] [Green Version]
  62. Weng, Y.; Cai, W.; Wang, C. The application and future directions of the Shared Socioeconomic Pathways (SSPs). Adv. Clim. Chang. Res. 2020, 16, 215. [Google Scholar]
  63. Chen, W.; Wang, H.; Huang, W.; Li, N.; Shi, J. Shared social-economic pathways (SSPs) modeling: Application of global multi-region energy system model. Energy Procedia 2017, 142, 2467–2472. [Google Scholar] [CrossRef]
  64. Xu, X.; Liu, J.; Zhang, S.; Li, R.; Yan, C.; Wu, S. Remote sensing data set of multi-period land use monitoring in China (CNLUCC). In Resource and Environmental Science Data Registration and Publication System; Resource and Environment Science and Data Center: Beijing, China, 2018. [Google Scholar]
  65. Fischer, G.; Nachtergaele, F.; Prieler, S.; van Velthuizen, H.T.; Verelst, L.; Wiberg, D. Global Agro-Ecological Zones Assessment for Agriculture (GAEZ 2008); IIASA: Laxenburg, Austria; FAO: Rome, Italy, 2008. [Google Scholar]
  66. Mann, H.B. Nonparametric Tests against Trend. Econometrica 1945, 13, 245–259. [Google Scholar] [CrossRef]
  67. Kendall, M.G. Rank Correlation Methods; Griffin: Oxford, UK, 1948. [Google Scholar]
  68. Panda, A.; Sahu, N. Trend analysis of seasonal rainfall and temperature pattern in Kalahandi, Bolangir and Koraput districts of Odisha, India. Atmos. Sci. Lett. 2019, 20, e932. [Google Scholar] [CrossRef] [Green Version]
  69. Ye, X.; Xu, C.-Y.; Zhang, Z. Comprehensive analysis on the evolution characteristics and causes of river runoff and sediment load in a mountainous basin of China’s subtropical plateau. J. Hydrol. 2020, 591, 125597. [Google Scholar] [CrossRef]
  70. Rougé, C.; Ge, Y.; Cai, X. Detecting gradual and abrupt changes in hydrological records. Adv. Water Resour. 2013, 53, 33–44. [Google Scholar] [CrossRef] [Green Version]
  71. Mallakpour, I.; Villarini, G. A simulation study to examine the sensitivity of the Pettitt test to detect abrupt changes in mean. Hydrol. Sci. J. 2016, 61, 245–254. [Google Scholar] [CrossRef] [Green Version]
  72. Du, R.; Shang, F.; Ma, N. Automatic mutation feature identification from well logging curves based on sliding t test algorithm. Cluster. Comput. 2019, 22, 14193–14200. [Google Scholar] [CrossRef]
  73. Stannard, D.I. Comparison of Penman-Monteith, Shuttleworth-Wallace, and Modified Priestley-Taylor Evapotranspiration Models for wildland vegetation in semiarid rangeland. Water Resour. Res. 1993, 29, 1379–1392. [Google Scholar] [CrossRef]
  74. Roderick, M.L.; Farquhar, G.D. A simple framework for relating variations in runoff to variations in climatic conditions and catchment properties. Water Resour. Res. 2011, 47, 1–11. [Google Scholar] [CrossRef] [Green Version]
  75. Pirnia, A.; Golshan, M.; Darabi, H.; Adamowski, J.; Rozbeh, S. Using the Mann–Kendall test and double mass curve method to explore stream flow changes in response to climate and human activities. J. Water Clim. Chang. 2018, 10, 725–742. [Google Scholar] [CrossRef]
  76. Yang, X.; Sun, W.; Mu, X.; Gao, P.; Zhao, G. Run-off affected by climate and anthropogenic changes in a large semi-arid river basin. Hydrol. Process. 2020, 34, 1906–1919. [Google Scholar] [CrossRef]
  77. Jin, S.; Zheng, Z.; Ning, L. Separating variance in the runoff in Beijing’s river system under climate change and human activities. Phys. Chem. Earth Parts A/B/C 2021, 123, 103044. [Google Scholar] [CrossRef]
  78. Yang, H.; Choi, H.T.; Lim, H. Effects of Forest Thinning on the Long-Term Runoff Changes of Coniferous Forest Plantation. Water 2019, 11, 2301. [Google Scholar] [CrossRef] [Green Version]
  79. Hausfather, Z. Explainer: How ‘Shared Socioeconomic Pathways’ Explore Future Climate Change. Available online: https://www.carbonbrief.org/explainer-how-shared-socioeconomic-pathways-explore-future-climate-change/ (accessed on 29 March 2023).
  80. Guo, M.; Zhang, Q.; Qian, H.; Xu, P.; Chen, Y. Analysis on the drought temporal-spatial distribution characteristics of Shaanxi Province based on SPEI. J. Water Resour. Water Eng. 2019, 30, 127–132+138. (In Chinese) [Google Scholar]
  81. Wang, J.; Fu, B.; Wang, L.; Lu, N.; Li, J. Water use characteristics of the common tree species in different plantation types in the Loess Plateau of China. Agric. For. Meteorol. 2020, 288–289, 108020. [Google Scholar] [CrossRef]
  82. Jia, X.; Shao, M.; Zhu, Y.; Luo, Y. Soil moisture decline due to afforestation across the Loess Plateau, China. J. Hydrol. 2017, 546, 113–122. [Google Scholar] [CrossRef]
  83. Wen, X.; Zhen, L. Soil erosion control practices in the Chinese Loess Plateau: A systematic review. Environ. Dev. 2020, 34, 100493. [Google Scholar] [CrossRef]
  84. Yurui, L.; Yi, L.; Pengcan, F.; Hualou, L. Impacts of land consolidation on rural human–environment system in typical watershed of the Loess Plateau and implications for rural development policy. Land Use Policy 2019, 86, 339–350. [Google Scholar] [CrossRef]
  85. Nagarajan, N.; Poongothai, S.; Arutchelvan, V. Impact of land use/land cover changes on surface runoff from a rural watershed, Tamilnadu, India. Int. J. Water 2013, 7, 122–141. [Google Scholar] [CrossRef]
  86. Robles, M.D.; Marshall, R.M.; O’Donnell, F.; Smith, E.B.; Haney, J.A.; Gori, D.F. Effects of Climate Variability and Accelerated Forest Thinning on Watershed-Scale Runoff in Southwestern USA Ponderosa Pine Forests. PLoS ONE 2014, 9, e111092. [Google Scholar] [CrossRef] [Green Version]
  87. Carvalho-Santos, C.; Nunes, J.P.; Monteiro, A.T.; Hein, L.; Honrado, J.P. Assessing the effects of land cover and future climate conditions on the provision of hydrological services in a medium-sized watershed of Portugal. Hydrol. Process. 2016, 30, 720–738. [Google Scholar] [CrossRef]
  88. Zhang, M.; Liu, N.; Harper, R.; Li, Q.; Liu, K.; Wei, X.; Ning, D.; Hou, Y.; Liu, S. A global review on hydrological responses to forest change across multiple spatial scales: Importance of scale, climate, forest type and hydrological regime. J. Hydrol. 2017, 546, 44–59. [Google Scholar] [CrossRef] [Green Version]
  89. Zhang, X.; Song, J.; Wang, Y.; Sun, H.; Li, Q. Threshold effects of vegetation coverage on runoff and soil loss in the Loess Plateau of China: A meta-analysis. Geoderma 2022, 412, 115720. [Google Scholar] [CrossRef]
  90. Yang, K.; Lu, C. Evaluation of land-use change effects on runoff and soil erosion of a hilly basin—The Yanhe River in the Chinese Loess Plateau. Land Degrad. Dev. 2018, 29, 1211–1221. [Google Scholar] [CrossRef]
  91. Xiu, L.; Yao, X.; Chen, M.; Yan, C. Effect of Ecological Construction Engineering on Vegetation Restoration: A Case Study of the Loess Plateau. Remote Sens. 2021, 13, 1407. [Google Scholar] [CrossRef]
  92. Yu, J.; Yu, S.; Zhang, H.; Wang, Z.; Zhou, C.; Chen, X. Determination of ecological flow thresholds for rainfall-recharging rivers based on multiple hydrological methods. Front. Environ. Sci. 2023, 11, 255. [Google Scholar] [CrossRef]
  93. Sun, Y.; Liu, X.; Ren, Z.; Li, S. Spatiotemporal variations of multi-scale drought and its influencing factors across the Loess Plateau from 1960 to 2016. Geogr. Res. 2019, 38, 1820–1832. (In Chinese) [Google Scholar]
  94. Liu, Y.; Li, W.; Liu, Z.; Yu, Y.; You, F.; Yang, Z. Spatial and Temporal Evolution Characteristics of the Drought in Weibei Loess Tableland Area Based on SPEI. Res. Soil Water Conserv. 2021, 28, 109–117. (In Chinese) [Google Scholar]
  95. Wu, X.; Li, J.; Shen, X. Quantitative analysis for the response of streamflow variation to driving factors in seven major basins across China. Ecol. Indic. 2023, 148, 110081. [Google Scholar] [CrossRef]
  96. Guo, W.; Hong, F.; Ma, Y.; Huang, L.; Yang, H.; Hu, J.; Zhou, H.; Wang, H. Comprehensive evaluation of the ecohydrological response of watersheds under changing environments. Ecol. Inform. 2023, 74, 101985. [Google Scholar] [CrossRef]
  97. He, G.; Zhao, Y.; Wang, J.; Gao, X.; He, F.; Li, H.; Zhai, J.; Wang, Q.; Zhu, Y. Attribution analysis based on Budyko hypothesis for land evapotranspiration change in the Loess Plateau, China. J. Arid Land 2019, 11, 939–953. [Google Scholar] [CrossRef] [Green Version]
Figure 1. Location and topography of the study area.
Sustainability 15 09651 g001
Figure 2. The framework of this study.
Sustainability 15 09651 g002
Figure 3. Annual mean temperature distribution from 1969 to 2018.
Sustainability 15 09651 g003
Figure 4. Linear trend of annual temperature in the QRB from 1969 to 2018: (a) The lowest temperature; (b) The average temperature; (c) The highest temperature.
Sustainability 15 09651 g004
Figure 5. Annual mean precipitation distribution from 1969 to 2018.
Sustainability 15 09651 g005
Figure 6. Spatial distribution of annual and seasonal precipitation trends from 1969 to 2018: (a) Spatial distribution of annual precipitation trend; (b) Spatial distribution of spring precipitation trend; (c) Spatial distribution of summer precipitation trend; (d) Spatial distribution of fall precipitation trend; (e) Spatial distribution of winter precipitation trend.
Sustainability 15 09651 g006
Figure 7. The change trend of NDVI. We employ the unitary linear regression model for fitting the scattered data points.
Sustainability 15 09651 g007
Figure 8. Average distribution map, slope map, and slope significance map of NDVI: (a) Average distribution of NDVI; (b) slope of NDVI; (c) slope significance map of NDVI. Here, we employed the Mann–Kendall and Sen’s slope methods to examine both the trend and statistical significance of NDVI. Sen’s slope b > 0, indicates an upward trend, while Sen’s slope b < 0 indicates a downward trend. The Z value is obtained via Mann–Kendall method. The critical values of |Z| for significance levels of 1%, 5%, and 10% are, respectively, 2.58, 1.96, and 1.645. If |Z| ≥ 2.58, the trend is very significant; if 1.96 ≤ |Z| ≤ 2.58, the trend is significant; if 1.645 ≤ |Z| < 1.96, the trend is slightly significant; and if |Z| ≤ 1.645, the trend is not significant. (Abbreviations: VSD, Very significant decline; SD, Significant decline; SSD, Slightly significant decline; NSD, Not significant decline; NSR, Not significant rise; SSR, Slightly significant rise; SR, Significant rise; VSR, Very significant rise).
Sustainability 15 09651 g008
Figure 9. Annual runoff during historical and future period. The two vertical dashed lines denote two temporal nodes, namely 1985 and 2018. The two blue horizontal solid lines represent the mean values of historical measured runoff during the periods of 1969–1984 and 1985–2018, respectively. Meanwhile, the green, black, yellow and red horizontal solid lines correspond to the average future runoff under different SSP scenarios from 2019 to 2050 (namely SSP1-2.6, SSP2-4.5, SSP3-7.0 and SSP5-8.5).
Sustainability 15 09651 g009
Figure 10. Runoff–precipitation double accumulation curve from 1969 to 2018. We used the unitary linear regression model to fit the scattered data points of Period 1 (1969–1984) and Period 2 (1985–2018).
Sustainability 15 09651 g010
Figure 11. Precipitation, mean temperature, and runoff in different SSP scenarios from 2019 to 2050: (a) Precipitation in different SSP scenarios from 2019 to 2050; (b) Mean temperature in different SSP scenarios from 2019 to 2050; (c) Runoff in different SSP scenarios from 2019 to 2050.
Sustainability 15 09651 g011
Table 1. Seven modes from CMIP6 used in this study.
Model NameCountryOrganizationSpatial Resolution
Lat. × Long.
BCC-CSM2-MRChinaBCC1.125° × 1.1°
CNRM-CM6-1FranceCNRM1.4° × 1.4°
CanESM5CanadaCCCMA2.8125° × 2.8°
INM-CM4-8RussiaINM2° × 1.5°
MRI-ESM2-0JapanMRI1.125° × 1.1°
IPSL-CM6A-LRFranceIPSL2.5° × 1.3°
UKESM1-0-LLUKUKESM1.875° × 1.25°
Table 2. Precipitation trends calculated by three methods (M-K, Sen’s, Linear regression).
Time ScaleSlope
(M-K)
Z
(M-K)
b
(Sen’s)
b/mm/a
(LR)
SignificanceTrend
Annual−0.72−0.57−0.72−0.91×
Spring−0.46−1.17−0.46−0.37×
Summer−0.32−0.36−0.34−0.31×
Fall−0.28−0.50−0.29−0.34×
Winer0.110.840.110.10×
“×” means not significant (significance level is 5%); “↑” represents an upward trend while “↓” indicates a downward trend.
Table 3. Calculation results including the precipitation elastic coefficient ε P , the potential evapotranspiration elastic coefficient ε E 0 , and the underlying surface elastic coefficient ε n of different periods.
nP (mm)E0 (mm)R (mm) ε P ε E 0 ε n
1969–20182.85542.70914.5237.523.48−2.48 *−2.26 *
P1 12.71575.58947.9246.843.32−2.32 *−2.12 *
P2 22.97520.45891.9331.213.63−2.63 *−2.39 *
Δ 30.26−55.12−55.99−15.63///
1 P1 represents the base period of runoff change during historical period (1969–1984). 2 P2 represents the change period of runoff change during historical period (1985–2018). 3 “Δ” denotes the variation of n (underlying surface parameter), P (precipitation), E0 (potential evapotranspiration) and R (runoff) between period P1 (1969–1984) and period P2 (1985–2018), indicating the magnitude of changes in these factors. * The symbol “−” represents a decrease in annual potential evapotranspiration and underlying surface parameter n of QRB leads to an increase in annual runoff.
Table 4. Contribution rates of climate change and human activity to runoff change.
Climate ChangeHuman ActivityTotal
ΔRP (mm) R E 0 (mm) ΔRl (mm)Total
Variation of runoff−13.28 *5.71−7.79 *−15.36 **
Contribution rate86.46%−37.16%50.70%100%
Rate49.30%50.70%100%
* The symbol “−” means that changes in precipitation and underlying surface parameter n reduce runoff. ** The symbol “−” means that the runoff decreases from the base period P1 (1969–1984) to the change period P2 (1985–2018).
Table 5. Impacts of climate change and human activities on runoff changes in the QRB.
TimeAverage Annual Precipitation (mm)Runoff Depth and Its Variation (mm)Climate ChangeHuman Activity
Obs1 3 Obs2 4Calculated Value 5Total Change Contribution (mm)RateContribution (mm)Rate
P1 1561.434631.2138.93−15−7.2848.54%−7.7251.46%
P2 2526.6
1 P1 represents the base period of runoff change during historical period (1969–1984). 2 P2 represents the change period of runoff change during historical period (1985–2018). 3 Obs1 represents the mean value of observed runoff during P1. 4 Obs2 represents the mean value of observed runoff during P2. 5 “Calculated value” represents the mean value of runoff during P2 calculated by Formula (16).
Table 6. Impacts of climate change and human activities on future runoff changes in QRB under four SSP scenarios.
ScenarioTimeMutation PointPrecipitation
(mm)
Mean Temperature
(°C)
Runoff Depth and Its Variation (mm)Climate ChangeHuman Activity
Obs1 3Obs2 4Calculated Value 5Total Change Contribution
(mm)
RateContribution
(mm)
Rate
SSP1-2.6P2-126 12026535.7012.6628.8740.0236.9011.158.0372.00%3.1228.01%
P3-126 2641.6612.48
SSP2-4.5P2-2452020522.3912.8932.3129.2535.68−3.063.38−110.32%−6.44210.32%
P3-245570.6912.42
SSP3-7.0P2-3702024532.4812.7430.3918.8333.88−11.563.49−30.20%−15.05130.20%
P3-370551.7812.17
SSP5-8.5P2-5852018523.6512.8433.0429.6336.19−3.413.15−92.54%−6.56192.54%
P3-585582.8113.13
1 P2-xxx (xxx = 126/245/370/585) represents the base period of runoff change in the future. The base periods for the four scenarios are 1985–2025, 1985–2019, 1985–2023 and 1985–2017, respectively. 2 P3-xxx represents the change period of runoff change in the future. The corresponding change periods for the four scenarios are 2026–2050, 2020–2050, 2024–2050 and 2018–2050, respectively. 3 Obs1 represents the mean value of observed runoff during P2-xxx. 4 Obs2 represents the mean value of observed runoff during P3-xxx. 5 “Calculated value” represents the mean value of runoff during P3-xxx calculated by the formula of the rainfall-runoff double accumulation curve prior to the mutation.
Disclaimer/Publisher’s Note: The statements, opinions and data contained in all publications are solely those of the individual author(s) and contributor(s) and not of MDPI and/or the editor(s). MDPI and/or the editor(s) disclaim responsibility for any injury to people or property resulting from any ideas, methods, instructions or products referred to in the content.

