Abstract
As a result of the expected increase in food demand, improving the sustainability of the food industry has become a priority worldwide. The recovery of industrial waste heat is widely regarded as a key strategy to reduce the energy consumption and greenhouse gas emissions of food manufacturing processes. Estimating the available recoverable waste heat can contribute to driving actions that promote the effective exploitation of such an untapped energy source. This study aimed to evaluate the waste heat potential of large and energy-intensive Italian dairy companies. To this end, a methodology that combined key transfer figures adapted to the Italian industrial context and data on fossil fuels consumption from energy audits was adopted to assess the technical waste heat potential. A comparison with the overall waste heat recovered from the projects proposed by large and energy-intensive dairy companies was carried out to estimate the residual waste heat available. Finally, the economic waste heat potential was assessed by varying the heat transfer operating conditions between the waste heat sources and sinks, and assuming that waste heat recovery was operated through heat exchanger technology. The technical waste heat potential of large and energy-intensive dairy industries was valued at roughly 75.6 GWht/year. Simulation results also showed that more than 90% of the studied companies exhibited payback periods below three years for all waste heat recovery projects, except for those involving gas-to-gas or gas-to-liquid heat transfers.
1. Introduction
In a global scenario of a growing population and food demand, the food sector is facing the challenge of taking action to improve its sustainability over the whole lifecycle, which involves agriculture, food processing, distribution and consumption. In terms of food processing, options for its decarbonization include automation and process optimization, thermal management and waste heat recovery, and the use of renewable energy sources.
Among these options, waste heat recovery has been proven to be particularly effective to reduce energy losses in different manufacturing processes, such as baking, sterilization, drying, heating, hot water supply, etc. Improving energy efficiency via waste heat recovery can help reduce production costs, increase productivity and thus improve the resilience and security of the supply.
Understanding the availability of residual waste heat from food manufacturing processes and the corresponding temperature level is crucial to plan strategies driving its full exploitation. However, such information is often not available, since there is no systematic assessment of the types and characteristics of waste heat sources, or such data are not easily accessible.
To overcome this problem, research groups have conceived bottom-up methods to estimate the waste heat potential of industrial facilities at different scales (local, regional, national, etc.). The early studies, such as those by McKenna and Norman [1] and BCS Incorporated (BCS) for the U.S. Department of Energy [2], proposed sophisticated methods that use the site’s emissions data to evaluate the heat load, and convert it into waste heat via a Carnot factor that expresses the maximum amount of recoverable work from the waste heat.
Among the bottom-up methodologies, those based on key transfer figures have gained increasing attention, since they allow transferring the results from detailed bottom-up studies to other contexts. These methods allow evaluating the theoretical or technical waste heat potential by applying key transfer figures to readily available input data, such as the energy consumption or gas emissions of industrial facilities. In this regard, Land et al. [3] developed an approach to evaluate the technical waste heat potential based on waste heat per fuel consumption figures, which were derived by Statistics Sweden with reference to 23 sub-sectors of the manufacturing industry. Bruckner et al. [4] estimated the theoretical waste heat potential, using waste heat per fuel consumption figures based on mandatory emissions report data from German production companies. The theoretical waste heat potential was also investigated by Person et al. [5], who suggested a method that was applicable in all EU27 countries and based on CO2 emissions data and key transfer figures combining CO2 emission factors and recovery efficiencies. Papapetrou et al. [6] developed a method to map the technical waste heat potential in different industrial sectors of the European member states, starting from waste-to-heat ratios derived from the UK industry in the period 2000–2003, and adjusting them to the real conditions of each member state.
Several studies applied bottom-up methods to evaluate the heat recovery potential in different industrial sectors and economic backgrounds. Using the approach proposed by BCS [2], the sEEnergies project [7] carried out a comprehensive assessment of the available excess heat from heavy industry (glass, cement, iron and steel, aluminum, pulp and paper, chemical and refinery industries) in Europe, and evaluated its suitability for use in district heating systems. The same methodology was adopted by Lu et al. [8] to quantify the technical maximum waste heat potential in the cement, iron and steel, and glass sectors.
Hong et al. [9] compared the results from a detailed bottom-up analysis of waste heat potential in Taiwan with those obtained via the application of methods proposed by Land [3] and Bruckner [4]. The study confirmed the feasibility of methods based on key transfer figures, provided that industrial structures and process technologies are similar.
Using the methodology proposed by Papapetrou et al. [6], Muhumuza and Eames [10] estimated the recoverable technical waste heat potentials in 2019 for different UK industrial subsectors by temperature range.
Very few studies focused on the assessment of the industrial waste heat potential in Italian industrial sectors. A prior study carried out by Gestore dei Servizi Energetici (GSE) [11] evaluated the technical waste heat potential of different industrial sectors in Italy, using the energy consumption of industrial sites and the heat recovery fractions estimated by the Joint Research Center based on the study carried out by McKenna et al. [1].
Denarie et al. [12] quantified the existing waste heat recovery from industrial processes, and waste to energy plants at regional and national levels as part of a study aimed at evaluating the waste heat and renewable energy sources suitable for their integration in district heating systems in Italy.
In both studies, site-specific CO2 emissions data, contained in the EU Emissions Trading System database [13], were used to evaluate the primary energy consumption via emission factors characterized for different industrial sectors. However, such a database considered only facilities for heat and electricity production with a minimum nominal capacity of 20 MW and an annual production higher than 20 GWh. Thus, the estimation of waste heat potential did not account for the contribution provided by enterprises with energy production lower than this threshold. Moreover, none of these studies investigated the economic waste heat potential.
Compared to these studies, this work focused on the assessment of the technical and economic waste heat potential of large and energy-intensive enterprises, using a bottom-up approach combining data from energy audits and key transfer figures adjusted to the Italian context, and updated to the most recent year with available energy audit data. The case study for the application of such an approach was represented by a data sample including all dairy enterprises required to be subject to an energy audit according to the Italian Legislative Decree no. 102 of 4 July 2014 [14].
In a previous study carried out by the same authors [15], a methodology based on the statistical analysis of energy audit data from industrial companies was proposed to investigate the waste heat production in the Italian textile sector. The same methodology was applied in this study to large and energy-intensive dairy companies, in order to gain insight into the yearly production, yearly consumption of fossil fuels and the types of waste heat recovery projects proposed. The data on fossil fuel consumption were used as a basis for estimating the technical waste heat potential of dairy companies, via the bottom-up methodology envisaged by Papapetrou et al. [6]. Then, the technical waste heat potential was compared to that resulting from the waste heat recovery projects proposed in the context of energy audits, in order to estimate the amount of residual waste heat available. Finally, the economic viability of the estimated waste heat potential was investigated, assuming waste heat recovery via heat exchangers and a three-year threshold for the simple payback period of the recovery projects.
This study was part of a larger research project carried out in the three-year period 2019–2021, within the framework of the research plan named “Ricerca di Sistema Elettrico” (“Electric System Research”) funded by the Ministry of Economic Development. The project aimed to develop a software tool that is able to support industrial companies in the identification of low-temperature waste heat recovery opportunities and the selection of the most promising options, based on energy, economic and environmental performance criteria.
2. Definition of the Case Study for Industrial Waste Heat Assessment
The scope of this study included large (as defined in [16]) and energy-intensive Italian dairy companies. The latter are intended as those, registered in the official lists of the Cassa Servizi Energetici ed Ambientali (CSEA), with large energy consumptions (electricity consumption higher than 1 GWh/year) and applying for tax relief on part of the purchased energy. Large and energy-intensive companies are required to carry out a comprehensive energy audit at least every four years, starting from 2015, pursuant to Article 8 of the Italian Legislative Decree no. 102/2014 [14], through which the Directive 2012/27/EU on Energy Efficiency [17] was implemented. The target companies are asked to submit the mandatory energy audit and to complete a voluntary semi-structured questionnaire via the web portal implemented by the Italian National Agency for New Technologies, Energy and Sustainable Economic Development (ENEA).
In this research, the analysis focused on energy audits and the relative questionnaires from the Italian dairy enterprises, whose production and energy consumption data referred to the year 2018. These documents allowed us to collect, for each production site, data concerning the yearly production and the yearly consumption of energy vectors directly used in the production processes or provided to the auxiliary systems or consumed for other purposes (i.e., space heating, sanitary hot water, etc.). Furthermore, for each energy efficiency measure proposed or already implemented by the enterprises, data regarding the expected or effective yearly energy savings and investment costs were also acquired.
Using the benchmark methodology proposed by the authors in a previously published study [15], the data collected were analyzed via statistical methods to characterize the distribution of each dataset in terms of relative frequency, mean, median, standard deviation, minimum, maximum and percentiles (lower and upper quartiles).
At the end of 2019, 79 energy audits and questionnaires were submitted by the Italian dairy companies required to comply with the obligations imposed by Legislative Decree no. 102/2014 [14]. Over 70% of questionnaires belonged to production sites included in the subsector “10.51.20—Production of milk derivatives”, while the remainder belonged to production sites in the subsector “10.51.10—Hygienic treatment of milk”. According to the Italian classification of economic activities (ATECO) [18], the first sub-sector comprises companies involved in the production of milk derivatives, such as milk-based beverages, cream made with fresh, pasteurized, sterilized, homogenized liquid milk, powdered or concentrated milk, butter, yogurt, cheese, curd, whey, lactose and lactic ferments. Conversely, the second sub-sector gathers companies mainly focused on producing fresh, pasteurized, sterilized, homogenized or ultra-high temperature (UHT) milk.
Table 1 characterizes, for each sub-sector, the statistical distribution functions of the yearly production, varying the unit of measurement adopted by the industrial sites (t/year, kg/year, L/year, or pieces/year). Moreover, Figure 1 shows the boxplots of the yearly production in reference to the whole dairy sector. Both sub-sectors were characterized by a high variability in yearly production capacity expressed in t/year and kg/year, whose distributions also included a few outliers. Specifically, the yearly production in t/year, representing the most common unit of measure among the enterprises (60% of the whole sample), varied from 450 t/year to approximately 400,000 t/year. Those expressed in kg/year (30% of the overall sample) exhibited a virtually comparable statistical dispersion. It was also noticed that sub-sector 10.51.20 exhibited lower mean values in t/year and kg/year than sub-sector 10.51.10, while the opposite occurred for the yearly production expressed in L/year.

Table 1.
Statistical distribution functions of the annual production of dairy production sites belonging to subsectors “10.51.10—Hygienic treatment of milk” and “10.51.20—Production of milk derivatives”, varying the units of measurement.
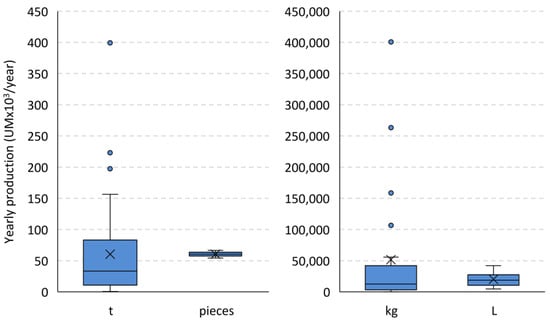
Figure 1.
Boxplots of the yearly production of the whole sample of dairy production sites, according to the unit of measurement adopted (t/year, kg/year, L/year or pieces/year).
Large and energy-intensive dairy enterprises use a different energy mix, including four main energy vectors: natural gas, fuel oil, LPG and diesel. In this regard, Table 2 and the boxplots in Figure 2 outline the statistical distributions of the yearly consumption of energy vectors related to the whole sample. To compare the role of different energy vectors in the energy mix of the dairy enterprises, all statistical parameters were converted into MWh via the lower heating values (LHVs). Natural gas was used by almost all of the dairy enterprises in the sample (69 out of 79). With a yearly mean consumption of approximately 17,618 MWh, natural gas also represented the most important primary energy source to produce steam and hot water for several purposes (e.g., dairy product manufacturing, equipment cleaning, space heating, electricity generation, etc.). Only a few sites (7 out of 69) used fuel oil instead of natural gas as their main energy vector, with roughly 9955 MWh/year in yearly mean consumption. This drastically reduced for LPG (577.5 MWh/year) and diesel (328.5 MWh/year), being mainly regarded as complementary energy vectors to natural gas.
Table 2.
Total yearly consumptions of energy vectors of the entire sample of dairy production sites.
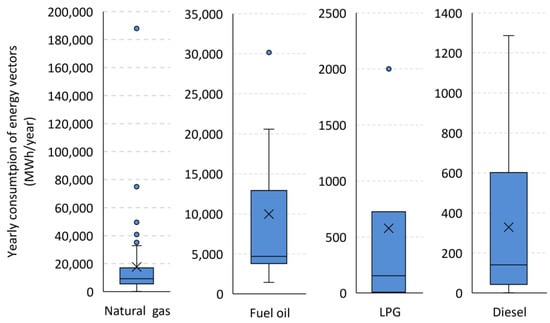
Figure 2.
Boxplots of yearly consumption of natural gas, fuel oil, LPG and diesel.
Considering the overall energy consumption, natural gas contributed with a share of 94%; on the other side, the second most important energy vector was fuel oil with a contribution of around 6%, while LPG and diesel accounted together for less than 1%.
Against this background, only natural gas and fuel oil consumptions were considered for estimating the technical waste heat potential of large and energy-intensive dairy enterprises.
Within the 79 energy audits submitted by the enterprises, 365 potential energy-saving measures were identified. Among these, 30 projects concerned the recovery and valorization of waste heat, which can be grouped into two main categories. The first includes 21 projects concerning the waste heat recovery from auxiliary systems, such as compressed air systems (10), cogeneration power plants (6) and chiller condensing systems (5). The second category comprises 9 projects involving the waste heat recovery from production processes, namely the waste heat recovery from the cooling process of whey (3) and milk in aging tanks (1), the waste heat recovery from sterilization (1) and process steam (1) condensates, the waste heat recovery from the evaporation and concentration of “scotta” (1), and from degassers of UHT milk (2).
Table 3 characterizes the statistical distribution functions of thermal waste heat recovered, expressed in terms of final energy savings by type of project proposed by the dairy enterprises, while Figure 3 shows the corresponding boxplots. It is noteworthy that the waste heat recovery projects on cogeneration plants and chillers allowed for the highest mean thermal energy recovered (1041–2105 MWht/year), followed at a great distance by those on compression systems (335 MWht/year). Compared to the waste heat recovered from auxiliary systems, that from production processes exhibited a more marked variability, mainly due to the variety of waste heat sources involved. In particular, 50% of waste heat recovery projects on production processes allowed savings of less than 430 MWht/year, while the average thermal energy recovered was around 758 MWht/year.
Table 3.
Statistical distribution functions of thermal waste heat recovered by type of project proposed by the dairy enterprises.
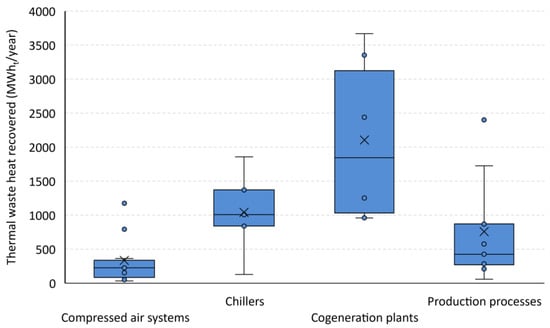
Figure 3.
Boxplots of yearly thermal energy recovered by type of waste heat recovery project.
Figure 4 defines the number of projects by type of waste heat recovery technology and location of waste heat source. Heat exchangers, with or without hot storage tanks, represented the main heat recovery technology envisaged. Indeed, with reference to the waste heat recovery from auxiliary systems, heat exchangers were used in 17 out of 21 projects; the remainder provided for the use of canalizations or chimneys to collect and send the cooling air from the air compressor system to the manufacturing processes or the installation of an absorption chiller to recover low-temperature waste heat from the cogeneration plant. Regarding the waste heat recovery from production processes, heat exchangers were virtually the only technology adopted, except for the condensate recovery from sterilizers, operated via a collection system.
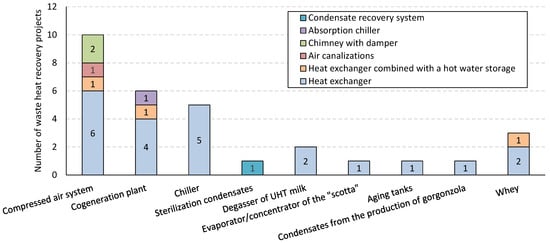
Figure 4.
Number of waste heat recovery projects by type of waste heat recovery technology and location of waste heat source.
3. Methodology for Estimating the Technical and Economic Waste Heat Potential
The methodology adopted in this study was originally developed by Papapetrou et al. [6] to determine the technical industrial waste heat (TWH) recovery potential in all the countries of the European Union. The starting point was a study of the UK industry [19], which estimated the technically available waste heat of different industrial sectors via data from 425 industrial sites for the period 2000–2003. The study assumed that the waste heat available was fully recoverable on-site, provided that its temperature was higher than the heat demand temperature band. Under such an assumption, the total amount of surplus heat that could be reused on-site was calculated with a ±20% uncertainty. Finally, key transfer figures, providing the waste heat potential per unit of heat consumption, were evaluated for different industrial sectors in the UK [6].
The key transfer figures can be adjusted to consider the different energy efficiencies of European member states by multiplying them by a factor that indicates the relative energy intensity (EI) of the country compared to the UK. In this study, the key transfer figure for the food and beverage sector in Italy was evaluated as follows:
Then was updated from 2003 to 2018 using the ratio between the energy intensity in 2018 and the corresponding value in 2003:
The energy intensity was calculated as the final energy consumption for the food, beverage and tobacco sector divided by the corresponding gross value added. These figures were extracted from two Eurostat databases, namely the Complete energy balances [20] and National Accounts Aggregates by Industry [21]. Table 4 summarizes the energy intensity figures and key transfer figures for the UK and Italy for the years 2003 and 2018.
Table 4.
Energy intensity figures and key transfer figures for the UK and Italy.
Finally, the technical waste heat potential of the whole sample of dairy production sites was calculated as follows:
where , and represent the natural gas consumption, the fuel oil consumption and the technical waste heat potential of the i-th production site on an annual basis, respectively, and is the total number of sites in the sample.
The economic feasibility of the waste heat recovery was evaluated assuming as an indicator of the investment risk the simple payback period, which corresponds to the number of years needed to recover the initial investment. This was calculated considering a worst-case scenario based on the following conservative assumptions:
- The waste heat recovery is operated by a countercurrent heat exchanger with a value of heat transfer units (NTU) of 2; this is a common design criterion since the marginal increase of heat exchanger effectiveness (εHX) reduces for higher NTU values.
- The ratio between the fluid heat capacities (C = Cmin/Cmax) is equal to 1, which leads to a minimum εHX of 65% for NTU = 2.
- The dairy company can produce heat from natural gas with an ideal boiler efficiency of 100%.
Thus, the heat exchanger surface area required at the i-th production site was evaluated depending on the overall heat transfer coefficient () and the mean logarithmic temperature difference ():
where is the thermal power effectively recovered, and is the number of operating hours per year. With regards to U, five different values were considered. These are representative of the minimum overall heat transfer coefficients attained depending on the types of fluid flowing inside the shell and tubes of the heat exchanger (Table 5).
Table 5.
Minimum overall heat transfer coefficients depending on the types of fluid flowing inside the shell and tubes of the heat exchanger.
Regarding , a set of values in the range between 5 and 30 °C was investigated, on the grounds that more that 90% of waste heat generated in the food and beverage sector is below 100 °C. Taking into account that dairy processes are virtually continuous, was set to 8000 h. The capital cost was evaluated using the cost function proposed by Smith for carbon steel heat exchangers operating at moderate pressure [22], and the Chemical Engineering Plant Cost index (CEPCI) [23] to update the cost from the year 2000 to 2018:
where is the material factor for stainless steel (304 SS, 316 SS) [24], and is the exchange rate from USD to EUR relative to 2018.
Finally, the simple payback period was given by the ratio between and the fuel cost savings () resulting from replacing the thermal energy produced via natural gas (assuming a boiler efficiency of 100%) with the thermal energy recovered via the heat exchanger:
where is the natural gas price for non-domestic customers in Italy, defined according to the Eurostat database as a function of yearly consumption of the i-th production site [25]. The main technical and economic parameters for evaluating the are summarized in Table 6.
Table 6.
Main technical and economic parameters for evaluating .
Based on the assumptions previously described, the actual was lower or at least equal to the value calculated using Equation (6).
4. Evaluation of the Technical and Economic Waste Heat Potential
Using the methodology described in Section 3, the technical waste heat potential was evaluated for each large and energy-intensive dairy industrial site. The resulting data were then aggregated at the regional and national levels, as shown in Table 7. The overall technical waste heat potential amounted to roughly 75.6 GWht/year. The main contributors were represented by the Lombardy and Emilia-Romagna regions, with a share of approximately 40 and 22%, respectively. This was mainly because these regions own almost 50% of the whole sample of dairy industrial sites. Conversely, the contribution of the remaining regions fell to around 1%, except for Sardinia, Trentino-Alto Adige, Veneto and Piedmont, owning shares ranging between 5 and 7%.
Table 7.
Technical waste heat potential of large and energy-intensive Italian dairy industrial sites at regional and national levels, and comparison with the waste heat recovered via the projects proposed in the framework of energy audits.
As shown in the map represented in Figure 5, the mean technical waste heat potential per industrial site largely varied among the Italian regions. The peak value belonged to Marche, while Lombardy held only the fourth highest value (1147.3 MWht/(year×site)), despite providing the largest contribution to the overall technical waste heat potential. Besides Marche and Lombardy, in four more regions (Apulia, Trentino-Alto Adige, Campania and Emilia Romagna), the mean technical waste heat potential per industrial site exceeded 1000 MWht/(year×site), while in the remaining regions it ranged roughly from 100 MWht/(year×site) to 900 MWht/(year×site).
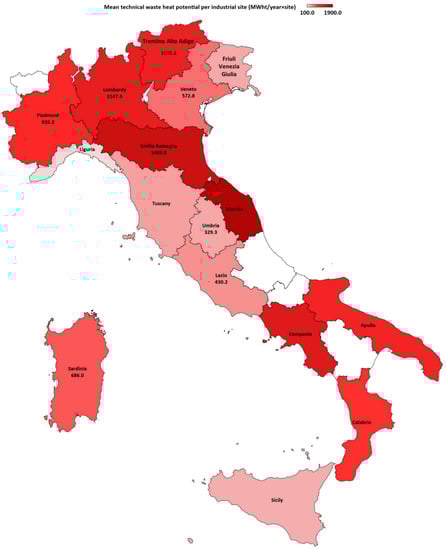
Figure 5.
Map of mean technical waste heat potential per industrial site at regional level.
The technical waste heat potential of large and energy-intensive dairy industrial sites was compared with the waste heat that could be recovered if the projects proposed in the framework of energy audits were implemented (Section 2). To this end, the projects concerning compressed air systems and chillers were excluded, being the waste heat generation related to the use of electricity instead of natural gas or fuel oil.
Overall, the waste heat recovered via the projects proposed on cogeneration plants and production processes would allow a recovery of approximately 26% (19.5 GWht/year) of the technical waste heat potential at the national level.
As shown in Table 7, in most Italian regions, no waste heat recovery projects have already been proposed, despite their non-negligible technical waste heat potential. Two exceptions are represented by Lombardy and Trentino-Alto Adige, where the waste heat recovery projects would allow the reuse of around 62 and 13% of the regional technical waste heat, respectively. In the other regions, such a percentage fell on average to below 4%.
It is noteworthy that the results presented are intended to provide a preliminary indication of the technical waste heat potential of large and energy-intensive dairy enterprises. The evaluation of the real technical waste heat available, which is beyond the scope of this study, would require a detailed assessment of waste heat recovery opportunities identified at each dairy industrial site.
Finally, the economic waste heat potential was evaluated, varying the operating conditions for heat exchange between the waste heat sources and sinks at each dairy site. Figure 6 shows the economic waste heat potential for gas-to-gas and liquid-to-gas heat exchange modes, varying the . For = 5 °C, all recovery projects at the dairy sites were economically unfeasible, since was always higher than 3 years for both heat exchange modes. Increasing from 5 to 30 °C allowed for a drastic reduction in because of the decrease in the . However, only 2 dairy sites out of 79 provided for a lower than 3 years in the case of the liquid-to-gas heat exchange mode. This led to an economic waste heat potential () of less than 8 GWht/year, corresponding to approximately 11% of .
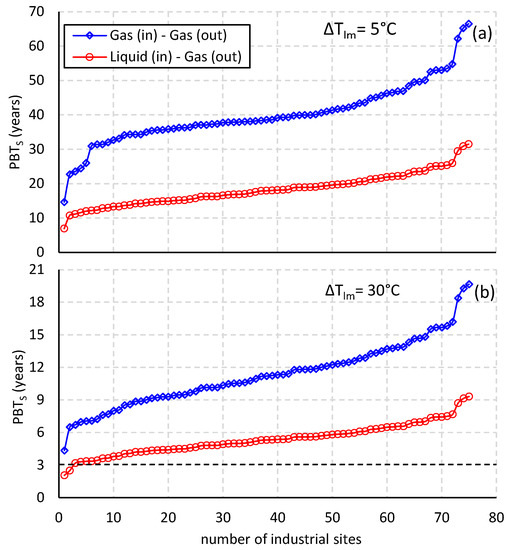
Figure 6.
Simple payback period of waste heat recovery projects at the dairy industrial sites for gas-to-gas and liquid-to-gas heat exchange modes, for = 5 °C (a) and = 30 °C (b).
With the introduction of the EEN 9-11 norm in 2011 [26], the Italian Regulatory Authority for Energy, Networks and Environment (ARERA) has included the eligibility of waste heat recovery projects into the Energy Efficiency Certificates (EECs) scheme [27]. According to the EECs scheme, waste heat recovery projects can receive, for a 5-year period, EECs that provide proof of the end-use energy saved (each EEC represents one ton of oil equivalent saved due to the projects carried out). EECs can be exchanged between industries promoting the waste heat recovery projects (voluntary parties) and the obliged parties, namely the electricity and gas distributors with more than 50,000 clients, which are obliged to reach increasing annual energy efficiency targets. Thus, if the dairy enterprises accessed the EECs scheme, the would decrease due to the additional income from selling the EECs that correspond to the energy savings obtained through the waste heat recovery projects. In this regard, Figure 7 shows the lowest price of EECs that is required to achieve the economic feasibility of the projects (= 3 years). With a few exceptions, in the case of gas-to-gas heat exchange mode, the required price of EECs is always far above the limit of EUR 300/toe, corresponding to the average price recorded during the EECs market sessions of 2018 [28]. Conversely, in the case of liquid-to-gas heat exchange mode, the required price of EECs is lower than the limit value for 64 projects out of 79. Thus, the access to this supporting scheme would allow to increase the to 48.3 GWht/year, corresponding to roughly 64% of the .
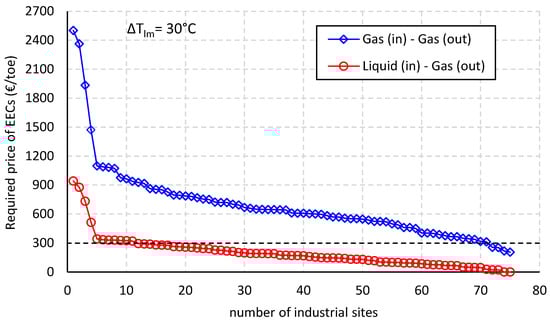
Figure 7.
Required price of EECs to achieve the economic feasibility ( = 3 years) of waste heat recovery projects at industrial sites for gas-to-gas and liquid-to-gas heat exchange modes.
The situation radically changed when considering heat exchange modes providing for higher overall heat transfer coefficients (liquid-to-liquid, pressurized gas-to-liquid and steam-to-liquid heat exchange modes). As shown in Figure 8a, for = 5 °C, the number of industrial sites allowing for economically feasible waste heat recovery projects ranged from 15 (liquid-to-liquid) to 64 (steam-to-liquid) out of 79. When increasing from 5 °C to 10 °C, more than 80% of the dairy sites provided for admissible for all the three heat exchange modes (Figure 8b). Finally, for = 30 °C, all recovery projects at the dairy industrial sites became economically feasible, with always lower than 3 years (Figure 8c). Under these conditions, the coincides with the overall technical waste heat potential multiplied by , which accounts for the heat losses due to the limitations in heat transfer between the heat exchanging streams (waste heat sources and sinks).
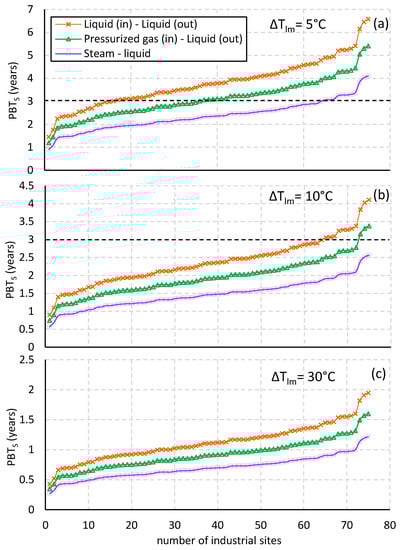
Figure 8.
Simple payback period of waste heat recovery projects at the dairy industrial sites for liquid-to-liquid, pressurized gas-to-liquid and steam-to-liquid heat exchange modes, for = 5 °C (a), 10 °C (b) and 30 °C (c).
Figure 9 shows the effect of on the overall heat exchange surface area (), calculated as the sum of heat exchanger surface areas related to the economic feasible waste heat recovery projects, and the corresponding .
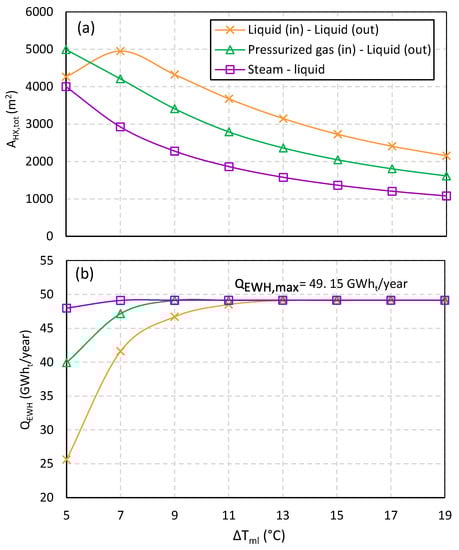
Figure 9.
Overall heat exchange surface area (a) and economic waste heat potential (b) of large and energy-intensive dairy industries varying and the heat exchange mode.
As expected, increasing allows to increase (Figure 9b) while drastically reducing (Figure 9a), despite the increasing number of feasible waste heat recovery projects. Figure 9 also identifies the minimum () leading to the maximum economic waste heat potential ( = 49.15 GWht/year), varying the heat exchange mode (liquid-to-liquid, pressurized gas-to-liquid and steam-to-liquid). In the case of liquid-to-liquid heat exchange, the was around 17 °C, which corresponded to an of around 2409 m2. In the case of the pressurized gas-to-liquid and steam-to-liquid heat exchange modes, the reduced to 13 °C and 9 °C, respectively, while the slightly decreased (2275–2360 m2). This is because the increase in the overall heat transfer coefficient was partially offset by the decrease in .
5. Conclusions
The study aimed to assess the technical and economic waste heat potential of large and energy-intensive Italian dairy industries. For this purpose, a methodological approach relying on key transfer figures adapted to the Italian context and data from energy audits was adopted. Thus, the technical waste heat potential was evaluated by applying key transfer figures to annual consumptions of most relevant energy vectors of dairy enterprises (natural gas and fuel oil). Finally, a conservative estimate of the economic waste heat potential was carried out, assuming waste heat recovery via countercurrent heat exchangers and a three-year threshold for the simple payback period of the initial investment.
The technical waste heat potential of large and energy-intensive dairy industries was estimated at roughly 75.6 GWht/year, most of which was in Lombardy (29.8 GWht/year) and Emilia-Romagna (16.4 GWht/year), since they owned a larger number of industrial sites compared to the other Italian regions. The mean technical waste heat potential per industrial site exceeded 1000 MWht/(year×site) in 6 regions (Marche, Emilia-Romagnia, Campania, Lombardy, Trentino-Alto Adige and Apulia) out of 16, with Lombardy holding only the fourth highest value (1147.3 MWht/(year×site)) despite being the largest contributor to the overall technical waste heat potential.
From an analysis of the energy audits, it also emerged that the waste heat recoverable through the implementation of waste heat recovery projects proposed by the enterprises represented only around 26% of the total technical waste heat resulting from this study.
From an economic perspective, simulation results highlighted that the waste heat recovery projects involving gas-to-gas or liquid-to-gas heat exchange modes were virtually always unfeasible, due to their large heat exchange surface areas. However, in the case of liquid-to-gas heat exchange, a of 48.3 GWht/year could be achieved if the waste heat recovery projects benefited from accessing to the EECs scheme.
On the other side, in the case of liquid-to-liquid, pressurized gas-to-liquid and steam-to-liquid heat exchange modes, the economic waste heat potential largely varied according to the temperature difference between the waste heat sources and sinks. It was found that there existed a minimum , ranging from 9 °C (steam-to-liquid) to 17 °C (liquid-to-liquid), beyond which all waste heat recovery projects became economically feasible. This leads to a of 49.15 GWht/year.
This study is intended to provide an indicative assessment of waste heat recovery opportunities of large and energy-intensive dairy industrial sites. Indeed, due to their considerable energy consumption, these are expected to significantly contribute to the total waste heat potential of the Italian dairy industry. Results from this study can be used to promote the implementation of waste heat recovery projects by reducing the lack of awareness and information among enterprises, and drive the development of public policies and strategies that financially support research into technologies and demonstration projects.
However, it is desirable that future studies extend the analysis to small- and medium-sized enterprises (SMEs). This is of fundamental importance in a sector dominated by SMEs such as the Italian dairy industry. Moreover, additional research should be carried out for the following:
- assess the effect of waste heat recovery technology on the economic waste heat potential;
- validate the results of this study via collaboration with dairy enterprises, in order to evaluate the uncertainty related to the estimation of technical and economic waste heat potential.
Author Contributions
Conceptualization, L.G. and M.B.; methodology, L.G. and M.B.; validation, L.G.; investigation, L.G.; writing—original draft preparation, L.G.; writing—review and editing, L.G., M.B. and M.S.; supervision, M.S.; project administration, M.B.; funding acquisition, M.B. All authors have read and agreed to the published version of the manuscript.
Funding
This research was funded by Electrical System Research 2019–2021, implemented under program agreements between the Italian Ministry for Economic Development and ENEA, CNR and RSE S.p.A.
Institutional Review Board Statement
Not applicable.
Informed Consent Statement
Not applicable.
Data Availability Statement
The data are available on request, and only in anonymous and aggregated form due to privacy/sensitivity restrictions. The data are not publicly available due to sensitivity issues.
Conflicts of Interest
The authors declare no conflict of interest.
Abbreviations
The following abbreviations are used in this manuscript:
| Symbols | |
| AHX | Heat exchanger surface area, m2 |
| CHX | Heat exchanger capital cost, EUR |
| Natural gas cost, EUR/kWh | |
| CEPCI | Chemical Engineering Plant Cost Index |
| EI | Energy intensity, MJ/EUR |
| f | Key transfer figure |
| Material factor | |
| Number of operating hours, h | |
| PBPs | Simple payback period, years |
| Q | Thermal energy, MWht or GWht |
| Sfc | Fuel cost savings, EUR/year |
| U | Overall heat transfer coefficient, W/m2K |
| Greeks | |
| Mean logarithmic temperature difference, °C | |
| εHX | Heat exchanger effectiveness, % |
| Subscripts | |
| ds | Dairy site |
| EWH | Economic waste heat potential |
| F&B | Food and beverage |
| FO | Fuel oil |
| HX | Heat exchanger |
| i | i-th production site |
| NG | Natural gas |
| TWH | Technical waste heat potential |
| Acronyms | |
| EECs | Energy efficiency certificates |
References
- McKenna, R.; Norman, J. Spatial modelling of industrial heat loads and recovery potentials in the UK. Energy Policy 2010, 38, 5878–5891. [Google Scholar] [CrossRef]
- Johnson, I.; Choate, W.T.; Davidson, A. Waste Heat Recovery. Technology and Opportunities in U.S. Industry; BCS corporation: Washington, DC, USA, 2008. [Google Scholar]
- Land, A.L.; Feldhusen, H.; Tvärne, A.; Cronholm, L.-Å.; Sundlöf, C. Industriell Spillvärme—Processer och Potentialer; Svenska Fjärrvärmeföreningen: Stockholm, Sweden, 2002. [Google Scholar]
- Brueckner, S.; Arbter, R.; Pehnt, M.; Laevemann, E. Industrial waste heat potential in Germany—A bottom-up analysis. Energy Effic. 2016, 10, 513–525. [Google Scholar] [CrossRef]
- Persson, U.; Möller, B.; Werner, S. Heat Roadmap Europe: Identifying strategic heat synergy regions. Energy Policy 2014, 74, 663–681. [Google Scholar] [CrossRef]
- Papapetrou, M.; Kosmadakis, G.; Cipollina, A.; La Commare, U.; Micale, G. Industrial waste heat: Estimation of the technically available resource in the EU per industrial sector, temperature level and country. Appl. Therm. Eng. 2018, 138, 207–216. [Google Scholar] [CrossRef]
- Fleiter, T.; Manz, P.; Neuwirth, M.; Mildner, F.; Persson, U.; Kermeli, K.; Crijns-Graus, W.; Rutten, C. Quantification of Synergies between Energy Efficiency First Principle and Renewable Energy Systems; Aalborg Universitet: Aalborg, Denmark, 2020. [Google Scholar]
- Lu, H.; Price, L.; Zhang, Q. Capturing the invisible resource: Analysis of waste heat potential in Chinese industry. Appl. Energy 2015, 161, 497–511. [Google Scholar] [CrossRef]
- Hong, G.-B.; Pan, T.-C.; Chan, D.Y.-L.; Liu, I.-H. Bottom-up analysis of industrial waste heat potential in Taiwan. Energy 2020, 198, 117393. [Google Scholar] [CrossRef]
- Muhumuza, R.; Eames, P. Decarbonisation of heat: Analysis of the potential of low temperature waste heat in UK industries. J. Clean. Prod. 2022, 372. [Google Scholar] [CrossRef]
- Gestore dei Servizi Energetici (GSE). Valutazione del Potenziale Nazionale di Applicazione della Cogenerazione ad alto Rendimento e del Teleriscaldamento Efficiente; GSE: Rome, Italy, 2016. [Google Scholar]
- Dénarié, A.; Fattori, F.; Spirito, G.; Macchi, S.; Cirillo, V.F.; Motta, M.; Persson, U. Assessment of waste and renewable heat recovery in DH through GIS mapping: The national potential in Italy. Smart Energy 2021, 1, 100008. [Google Scholar] [CrossRef]
- European Environment Agency. European Union Emissions Trading System (EU ETS) Data from EUTL. Available online: https://www.eea.europa.eu/data-and-maps/data/european-union-emissions-trading-scheme-17 (accessed on 3 March 2023).
- Republic of Italy. Legislative Decree, 4 July 2014. Available online: http://www.gazzettaufficiale.it/eli/id/2014/07/18/14G00113/sg (accessed on 8 March 2023).
- Benedetti, M.; Giordano, L.; Salvio, M. Explorative study on waste heat production intensity and recovery practices in the textile sector: First steps towards the creation of a decision support tool based on real data. J. Clean. Prod. 2022, 359, 131928. [Google Scholar] [CrossRef]
- Ministero dello Sviluppo Economico. Clarifications Regarding Energy Audits in Fulfillment of Article 8 of the Legislative Decree n.102/2014. Available online: https://www.mimit.gov.it/images/stories/documenti/CHIARIMENTI-DIAGNOSI-14-nov-2016.pdf (accessed on 8 March 2023).
- Gazzetta Ufficiale dell’Unione Europea. Direttiva 2012/27/UE del Parlamento Europeo e del Consiglio, del 25 Ottobre 2012, Sull’efficienza Energetica, che Modifica le Direttive 2009/125/CE e 2010/30/UE e Abroga le Direttive 2004/8/CE e 2006/32/CE. Available online: http://data.europa.eu/eli/dir/2012/27/oj/ita (accessed on 6 March 2023).
- Istituto Nazionale di Statistica (ISTAT). ATECO (Classification of Economic Activity) 2007. Available online: https://www.istat.it/en/archivio/17959 (accessed on 6 March 2023).
- Hammond, G.; Norman, J. Heat recovery opportunities in UK industry. Appl. Energy 2014, 116, 387–397. [Google Scholar] [CrossRef]
- Eurostat. Complete Energy Balances. Available online: https://ec.europa.eu/eurostat/databrowser/view/NRG_BAL_C__custom_4512367/default/table (accessed on 8 March 2023).
- Eurostat. National Accounts Aggregates by Industry (up to NACE A*64). Available online: https://ec.europa.eu/eurostat/databrowser/view/NAMA_10_A64__custom_4512597/default/table (accessed on 8 March 2023).
- Smith, R. Chemical Process Design and Integration, 2nd ed.; John Wiley & Sons Inc.: Chichester, UK, 2016; ISBN 978-1-118-69908-9. [Google Scholar]
- Chemical Engineering. The Chemical Engineering Plant Cost Index (CEPCI). Available online: https://www.chemengonline.com/pci-home/ (accessed on 8 March 2023).
- Towler, G.; Sinnott, R. Chemical Engineering Design—Principles, Practice and Economics of Plant and Process Design, 2nd ed.; Elsevier: Burlington, USA, 2012; ISBN 978-0-08-096660-1. [Google Scholar]
- Eurostat. Gas Prices for Non-Household Consumers—Bi-Annual Data (from 2007 Onwards). Available online: https://ec.europa.eu/eurostat/databrowser/view/NRG_PC_203__custom_4512881/default/table (accessed on 8 March 2023).
- Autorità di Regolazione per Energia reti e Ambiente (ARERA). Deliberazione 27 Ottobre 2011, EEN 9/11. Available online: https://www.autorita.energia.it/allegati/docs/11/009-11eenall.pdf (accessed on 8 March 2023).
- Republic of Italy. Ministerial Decree, 20 July 2004. Available online: https://www.gazzettaufficiale.it/atto/serie_generale/caricaDettaglioAtto/originario?atto.dataPubblicazioneGazzetta=2004-09-01&atto.codiceRedazionale=04A08523&elenco30giorni=false (accessed on 20 March 2023).
- Gestore dei Mercati Energetici (GME). Results of GME’s Markets—Energy Efficiency Certificates Market. Available online: https://www.mercatoelettrico.org/en/Esiti/TEE/TEE.aspx (accessed on 20 March 2023).


Disclaimer/Publisher’s Note: The statements, opinions and data contained in all publications are solely those of the individual author(s) and contributor(s) and not of MDPI and/or the editor(s). MDPI and/or the editor(s) disclaim responsibility for any injury to people or property resulting from any ideas, methods, instructions or products referred to in the content. |
© 2023 by the authors. Licensee MDPI, Basel, Switzerland. This article is an open access article distributed under the terms and conditions of the Creative Commons Attribution (CC BY) license (https://creativecommons.org/licenses/by/4.0/).