2.3. Methodology
The design of a conceptual model is a prerequisite for the quantification of interconnections between the nexus dimensions. The conceptual model clearly presents the interconnections between the different agricultural processes that involve resource use. It was designed based on a literature review and information provided by the cooperative and was an outcome of review iterations between the authors and the stakeholders. An overarching version of the conceptual model is presented in
Figure 2.
The different nexus dimensions are depicted in different colors. The land uses in brown at the center of the conceptual model represent the agricultural land covers of the different crops of the cooperative. The water component is shown in deep and light blue. Deep blue is used when the water use is direct actual water consumption, within the spatial boundaries of the case study; light blue is used when the water use refers to indirect consumption expressed through the water footprint of involved processes and infrastructure/materials [
6,
31,
33,
34,
35]. The elements related to energy are represented in deep and light yellow. Deep yellow is used for actual energy consumption, within the spatial boundaries of the case study; light yellow is used for indirect energy uses as revealed by the life cycle assessments implemented for the different materials and processes [
32,
35]. Greenhouse gas (GHG) emissions are shown in grey. The grey box shows the production of GHGs. GHGs are an indicator of human pressure on climate and a driver of climate change. They are not considered a resource in the conventional way that water and energy are. However, for the needs of our analysis the convention that GHGs are a “reverse resource” is made. While the boxes of the other dimensions denote resource consumption, the grey boxes denote GHG emissions. This means that the emission of GHGs is considered as a pressure in the same way that water consumption is a pressure. Light grey and deep grey are used to show direct GHG emissions in the boundaries of our case study, while light grey is used for GHG emission that is indirect and has occurred outside the boundaries of the case study. This is expressed through the carbon footprint concept [
36]. The food dimension is depicted in red and represents the food and fodder production of the agricultural activity of the cooperative. The brown land-use box contains some red boxes that correspond to crops that are used for food production, while the remaining land uses are denoted with light brown, for crops that are not used for food, such as the industrial crop of cotton and the energy crops of rapeseed and sunflower.
The arrows that link the boxes depict the interlinkages between the nexus dimensions. The arrow direction from element A to element B shows the consumption of resource A that is needed for the use of element B. For example, the blue arrow from “crop water needs” to “land uses” shows the consumption of water resources that is needed for agricultural land uses. Following our convention of “reverse resource”, the grey arrows follow a direction from the grey boxes to the yellow ones, showing that GHGs are emitted/produced—and not consumed—for the needs of energy use. Phantom whitish boxes are used to depict some key processes that entail the use of more than one resource.
Land Use–Food (LF): LF would involve the land cover of the different crops for food production (
Table 1). Other antagonistic agricultural land uses that are not used for food production are also noted to estimate the total irrigation needs for the total of the land uses: The area covered by each of the crops was provided by the cooperative. Maize, wheat, barley, and beans are the crops for food production, while rapeseed, sunflower, and cotton constitute the antagonistic land uses. Apparently, wheat covers almost 50% of the whole area. Food is quantified with the use of a binary expression of protein content in tons and caloric value in kcal [
37], taking into account the food and fodder mass production yields of each crop (Hellenic Statistical Authority, 2020) (
Figure 3).
Water–Food (WF): The WF flow is perceived as the vector addition of WL + LF.
Water–Land Use (WL): The WL flow involves the precipitation (
Table 2) that covers part of the water demand (
Table 3), and the crop water needs per land use. The calculation of the actual water needs required for irrigation is the subtraction of precipitation from crop water demand (
Table 4), as the cooperative claimed that irrigation is adjusted to the precipitation patterns. It should be noted that the water needs of wheat and barley crops are zero as they are considered non-irrigated crops. In the case of the agricultural cooperative of this study, a drip irrigation system is used. By adding the estimated water losses through the irrigation system and evapotranspiration to the water needs, the final quantities of groundwater resources that should be pumped are estimated (
Table 5,
Figure 4 and
Figure 5).
Two additional indirect water consumptions are estimated: the water footprint for agricultural machinery and the greywater footprint due to the pollution caused by excessive use of fertilizers. The agricultural machinery water footprint is estimated according to Mantoam et al. [
38]. The required pieces of machinery used for agricultural purposes were reported by the cooperative; they are associated with the materials used for their manufacturing, maintenance, and repair, and finally, they are assigned a blue water footprint according to material masses (
Table 6), while other water footprints are considered as negligible [
38]. The materials used for the analysis are steel, rubber, glass, plastic, varnish, and others, and the masses of each material composing the tractor and other machinery types used by the cooperative were taken from the work of Nemecek et al. [
32] (
Figure 6). The annual blue water footprint for the machinery is estimated as 181 m
3 taking the assumption of a ten-year use of each machine. The machine use per crop is taken as uniform. Regarding the assessment of greywater footprint, the UNESCO-IHE tier 1 supporting guidelines [
39] are followed. The greywater footprint is estimated as a function of the pollutant load (L), the maximum acceptable concentration of the pollutant (c
max), and the natural background concentration (c
nat) in the receiving waterbody. The pollutant load, which in this case refers to fertilizers, is estimated as a function of the applied masses reduced by case-specific factors relevant to atmospheric input, soil properties, climate conditions, and agricultural practices [
39]. The report includes maps in its appendix that provide estimations of these factors specific to Greece. The cooperative provided data on the type and application mass of fertilizer (
Table 7 and
Table 8). The maximum acceptable concentration is set equal to 0.0113 N kg/m
3 by the National Greek legislation, and the natural concentration is taken as zero, which is the safe-side common practice. Though fertilizing (basic and surface) occurs in specific months for each crop, the greywater footprint is estimated as an annual value, since it is naturally attributed to the whole agricultural circle. Moreover, nitrogen is a conservative pollutant, and monthly analysis would not be meaningful in this context [
40]. For the monthly analysis of water consumption, the annual value is uniformly distributed to all the months of the agricultural annual circle. The greywater footprint estimation is based on urea and not another pollutant because urea is the prevailing one, since pesticides are applied on the plant and not on the soil. The polluted water due to urea includes greywater of any other pollutant, while it would be an overestimation to assess additional greywater footprints (
Table 9).
Energy–Water (EW): For the energy-to-water interlinkage, the energy needed for the irrigation system needs to be calculated. The irrigation for the case study is covered by groundwater and is implemented through drip emitters. Thus, the energy consumed needs to cover the pumping from the aquifer level, which is 150 m deep, the transfer losses, and the pressure demand. The estimation of the energy needed for the pumps’ operation is calculated as the power demand (1) [
41] multiplied by the pumping hours.
where:
P is the power in KW;
hA is the pumping depth (150 m);
γ is the water specific weight (=9810 Ν/m3);
Q is the pumping flow rate in m3/s;
η is the pump efficiency (=0.75);
Dr is engine derating (=0.8).
The irrigation system in the case study does not include a tank. This means that the irrigation is conducted at the exact time when the pumps operate. To estimate the pumping hours per 24 h, the flow rate capacity of the farms needs to be divided by the total amount of water demand. The flow rate capacity of each farm is determined by the number of emitters and the standard emitter base flow rate (equal to 1.01 × 10
−6 m
3/s) [
31]. The number of emitters required per crop type is such that the soil is saturated with water and depends on the surface wetted by each emitter, for the emitters that belong in the same pipeline and corresponding wetted strip, whose radius (
rs = 0.56 cm) is given by Equation (2) and extent (
xs = 0.42 m) is given by Equation (3). For reasons of computational simplification, it is considered that all crops are grown in the same type of soil, which is characterized as between clayey and sandy soils. The minimum distance so that two sprayers, in the same pipeline, do not overlap is equal to 2
rs. The maximum length of a pipeline is 60 m. By dividing the total length of the pipe by the distance between two sprayers, the number of sprayers of each pipe is calculated. The number of required pipelines is estimated by dividing the total crop area by the pipeline cover area (60 m × 0.42 m = 25.2 m
2). Then, the number of emitters for each crop area is estimated as the number of required pipelines multiplied by the number of emitters per pipeline. In
Table 10, the flow rate capacity for each crop area is estimated.
where
and
Ks refer to the type of soil of each crop, with the second variable expressing the permeability of the soil.
The flow expresses the flow of the whole pipe per unit length of pipe. It is equal to the product of the flow of a sprayer with the number of sprayers on the pipe divided by the length of the pipe. The flow must be less than 3 Ks/4a.
Table 11 presents the operation pumping hours for each crop type and per month,
Table 12 presents the estimated energy consumption for pumping per crop type and per month, and
Table 13 presents the estimated energy consumption for pumping per crop type, month, and km
2.
Figure 7 and
Figure 8 present the total energy consumption distribution per crop type and per month, respectively.
Energy–Land(–Food) and (Food–)Land–Energy Interlinkages: The energy consumed for agricultural land is estimated as direct and indirect components. The direct components refer to the actual amounts of energy that are consumed in the geographical boundaries of a case study and involve fuel for the operation of the agricultural machinery and the energy equivalent for human labor. It is crucial for human labor to be estimated in terms of energy, for reasons of comparison between full-machinery and non-machinery paradigms. In a hypothetical extreme case study, where there is no use of machinery at all and all works are implemented by human labor, this would artificially and falsely introduce the bias that this case is a sustainable paradigm regarding energy use and eventually the nexus. However, it would have neglected human fatigue and the respective energy consumed. The indirect components refer to the energy consumed for the agricultural machinery life cycle, including the phases of assembly, repair and maintenance, and disassembly, as well as the energy demand for producing fertilizers and pesticides. Energy for transferring the machinery, the pesticides, the fertilizers, and the seeds is not estimated, since it would not offer anything in regard to this analysis, since it would add a very case-specific energy amount that would not be generalizable.
In the estimation of fuel consumption, it is considered that the fuel used by agricultural machinery is diesel. The machines at the disposal of the cooperative are agricultural tractors and threshing machines. The data for calculating the diesel fuel consumption of tractors and threshing machines were provided by Nemecek and Kägi [
32]. Equation (4) gives the energy consumption of the agricultural machines.
where
(MJ/km
2) is energy due to fuel consumption for agricultural field work processes by agricultural machines,
(m
3/h) is the average fuel consumption, operation time (h/km
2) is the time required for the agricultural work field processes, and
EDD (MJ/m
3) is the energy density of diesel. In
Table 14, the total energy consumed by agricultural machinery for field work processes is shown.
Research work by Mandal et al. [
42], Ozkan et al. [
43], and Unakitan et al. [
44] gives the energy equivalent of human labor in agricultural works (=1.96 MJ/h/farmer); EUROSTAT gives the average annual work effort for Greece in the agricultural sector (=416.9 h); and the Hellenic Statistical Service gives the number of farmers that work on the agricultural land (=20 farmers/km
2). It is assumed that all different crop types demand the same work effort and that the effort is uniformly distributed during the year. The annual energy equivalent for human labor is estimated as being equal to 311 GJ, or 15.3 GJ/km
2.
The energy consumed in the various phases of the machinery life cycle, for machinery with engine power from 50 hp to 130 hp, is calculated as an indirect energy–land interlinkage. These tractors belong to the category of medium power and are widely used by Greek farmers [
45]. The life cycle analysis of a machine includes the phases of assembly, maintenance, and disassembly. For each of these phases, the total energy required is addressed. The estimations are based on the machinery weight and materials: rubber, glass, plastics, various types of varnishes (including paints), and various other materials used to a lesser extent [
32]. Mantoam et al. [
35] give the energy (
Figure 9) and greenhouse gas emission equivalents for the assembly phase of each material. The total assembly energy of the tractor is estimated as being equal to 187,100 MJ. The energy required to repair and maintain the machine is equal to 0.55 times the energy consumed during the assembly phase [
46], while for its disassembly, 0.5 MJ per kg of the machine is consumed [
32]. The energy demand for the three phases is presented in
Table 15.
The indirect energy–land(–food) interlinkage that refers to fertilizers and pesticides is assessed based on the approaches of Unakitan [
44] and Audsley et al. [
47]), respectively. The two phases of fertilizer deposition, basic fertilizing and surface fertilizing, are defined and assessed. Basic fertilization is defined as the addition of essential nutrients to the soil before the growing season. Nitrogen is usually given in small, repeated doses. Surface fertilization is the application of nutrients to plants during the period of their growth. The assumption that the application of fertilizers matches the recommended amount would introduce a major error, since producers commonly share the perception that intense use of fertilizers brings the maximum possible harvest, despite environmental risks, such as eutrophication, increased soil acidity, inability to absorb other nutrients from plants, pollution of the aquifer, unwanted growth of parasitic organisms, and greenhouse gas emissions [
48,
49]. To mitigate such an error, in the assessment of fertilizer and pesticide amounts applied, the actual amounts used by local producers are defined by the cooperative. The equivalent energy index of nitrogen in fertilizers is equal to 66.4 MJ/kg [
44], while the fertilizers applied have a nitrogen mass content equal to 46%. Globally, parasites (insects, fungi, weeds) are responsible for the destruction of crops at a rate of 42–48%, before and after harvest. Pesticides and non-chemical biological tests are used for plant protection (crop rotation, cultivation of different species of the same crop) [
50]. Due to the growing interest in identifying greenhouse gases, many studies focus on emissions from the manufacture of pesticides. Due to the lack of original data, due to commercial secrecy, many studies show discrepancies in the components of the pesticides. The problem is exacerbated by the rapid change in their composition over time. The global pesticide industry needs to provide reliable numbers that can be used universally [
47]. The indirect energy consumption due to pesticides is estimated based on the approach of Audsley et al. [
47], who defined the amount of energy (MJ/hectare) required for the plant protection of each crop. Data on the plant protection of all crop cultivation were provided by the cooperative to avoid the introduction of significant errors, similar to the assessment of fertilizer amounts.
Table 16 shows the total amount of fertilizer- and pesticide-driven indirect energy demand used by the farmers of the cooperative for each crop. There is no assessment of the monthly distribution of the energy consumption, since it does not occur in the geographical boundaries of the case study or at the time of the application; thus, such an assessment is irrelevant to the energy consumption peaks in the agricultural processes.
Table 17 presents the annual energy consumed to produce seeds that are used during the sowing phase, according to Elsoragaby et al. [
51].
The land–energy interlinkage implies the indirect land demand for energy production through the production of energy crops. This interlinkage is assessed based on the approach of Ralph et al. [
52], who used the weight of crop to make fuel (=3.28 kg of raw material/kg of fuel), the energy density of fuel (=43.7 MJ/kg), and the process energy cost for fuel (=0.44 MJ/kg) in the study of oil crops, namely rapeseed and sunflower. For the produced energy crop mass (=390,212 kg), the net energy equivalent is estimated as being equal to 5147 GJ, or 224 GJ/km
2. Reversely, the land needed to produce energy is 0.0045 km
2/GJ.
GHG emissions from energy consumption, the energy–climate Interlinkage: In an agricultural context, crop cultivation land uses do not showcase significant differences in terms of carbon sequestration versus GHG emissions. This would be true if forests or wetlands were included in a context of more extended land use boundaries, or if livestock was one of the agricultural activities. In that case, land use choices would imply a significantly different impact on GHG emissions than on energy consumption. With the selected land use boundaries, the GHG emissions shifts would follow, almost in a flat rate mode, the shifts in energy consumption. For this reason, the GHG emissions estimated are not presented, since they do not introduce any added value to this study and discussion.
For the facilitation of the nexus evaluation of the different crops and the agricultural planning, four indicators are introduced. The first nexus indicator (NI1, Equation (5)) refers to food production, giving equal priority to the caloric value, the protein value, the water and energy consumption, and the land cover. The second, NI2 (Equation (6)), prioritizes the protein value of the food product in comparison to the caloric value, the water and energy consumption, and the land cover. It can be used for planning with the objective of protein-based food security. The third nexus indicator (NI3, Equation (7)) accounts for the economic value of the crops, which can facilitate comparison between food crops, energy crops, and industrial crops. It can be used for planning with the objective of economic sustainability. It should be noted that the prices used for this indicator are taken from the cooperative for the reference year, while for more efficient planning, the dynamic nature of this indicator should be considered. The fourth nexus indicator (NI4, Equation (8)) accounts for the produced energy from energy crops as biofuel. This indicator facilitates comparison between the energy crops and can be used for prioritizing energy security planning scenarios.
Nexus Indicator 1 focusing on food security:
Nexus Indicator 2 focusing on a protein-based food security:
Nexus Indicator 3 focusing on the economy:
Nexus Indicator 4 focusing on energy security:
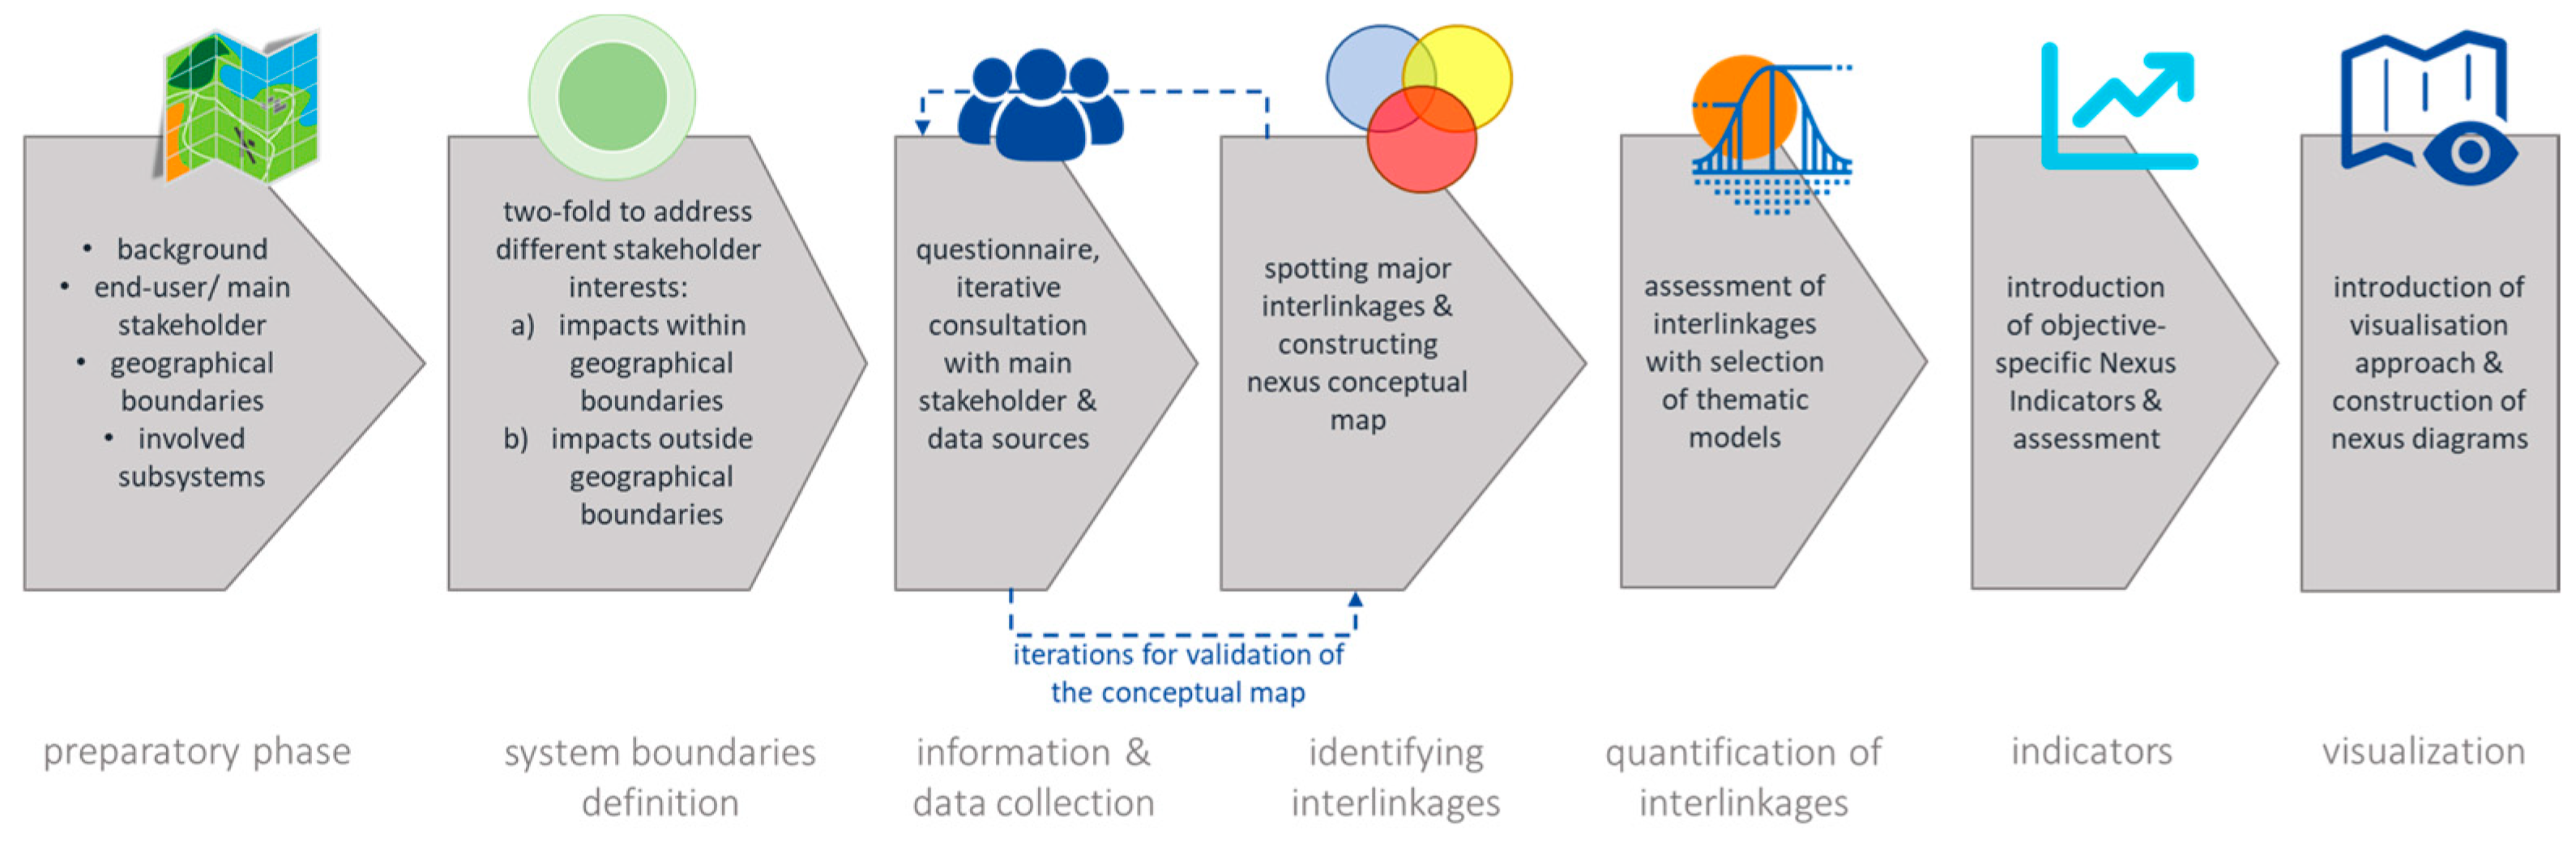
Figure 10 illustrates an overview of the steps followed to conduct the specific nexus analysis of an agricultural context. The steps include (i) the preparatory phase, where the end-user, the case study, and the main systems are identified; (ii) the system boundary definition, where two modes, an internal and an external to the geographical boundaries, are involved to address the concerns of farmers and of a more inclusive audience; (iii) the information and data collection phase; (iv) the interlinkage identification phase, which includes an iterative loop with the previous step; (v) the quantification of interlinkages, where the selection and application of models and empirical equations are conducted; (vi) the introduction and assessment of appropriate indicators, with the use of scenario tests; and (vii) the visualization of results.


