Impact of the Innovative Green Wall Modular Systems on the Urban Air
Abstract
1. Introduction
2. Materials and Methods
- -
- Felt green wall systems;
- -
- Modular green wall systems;
- -
- Container (pot) green wall systems.
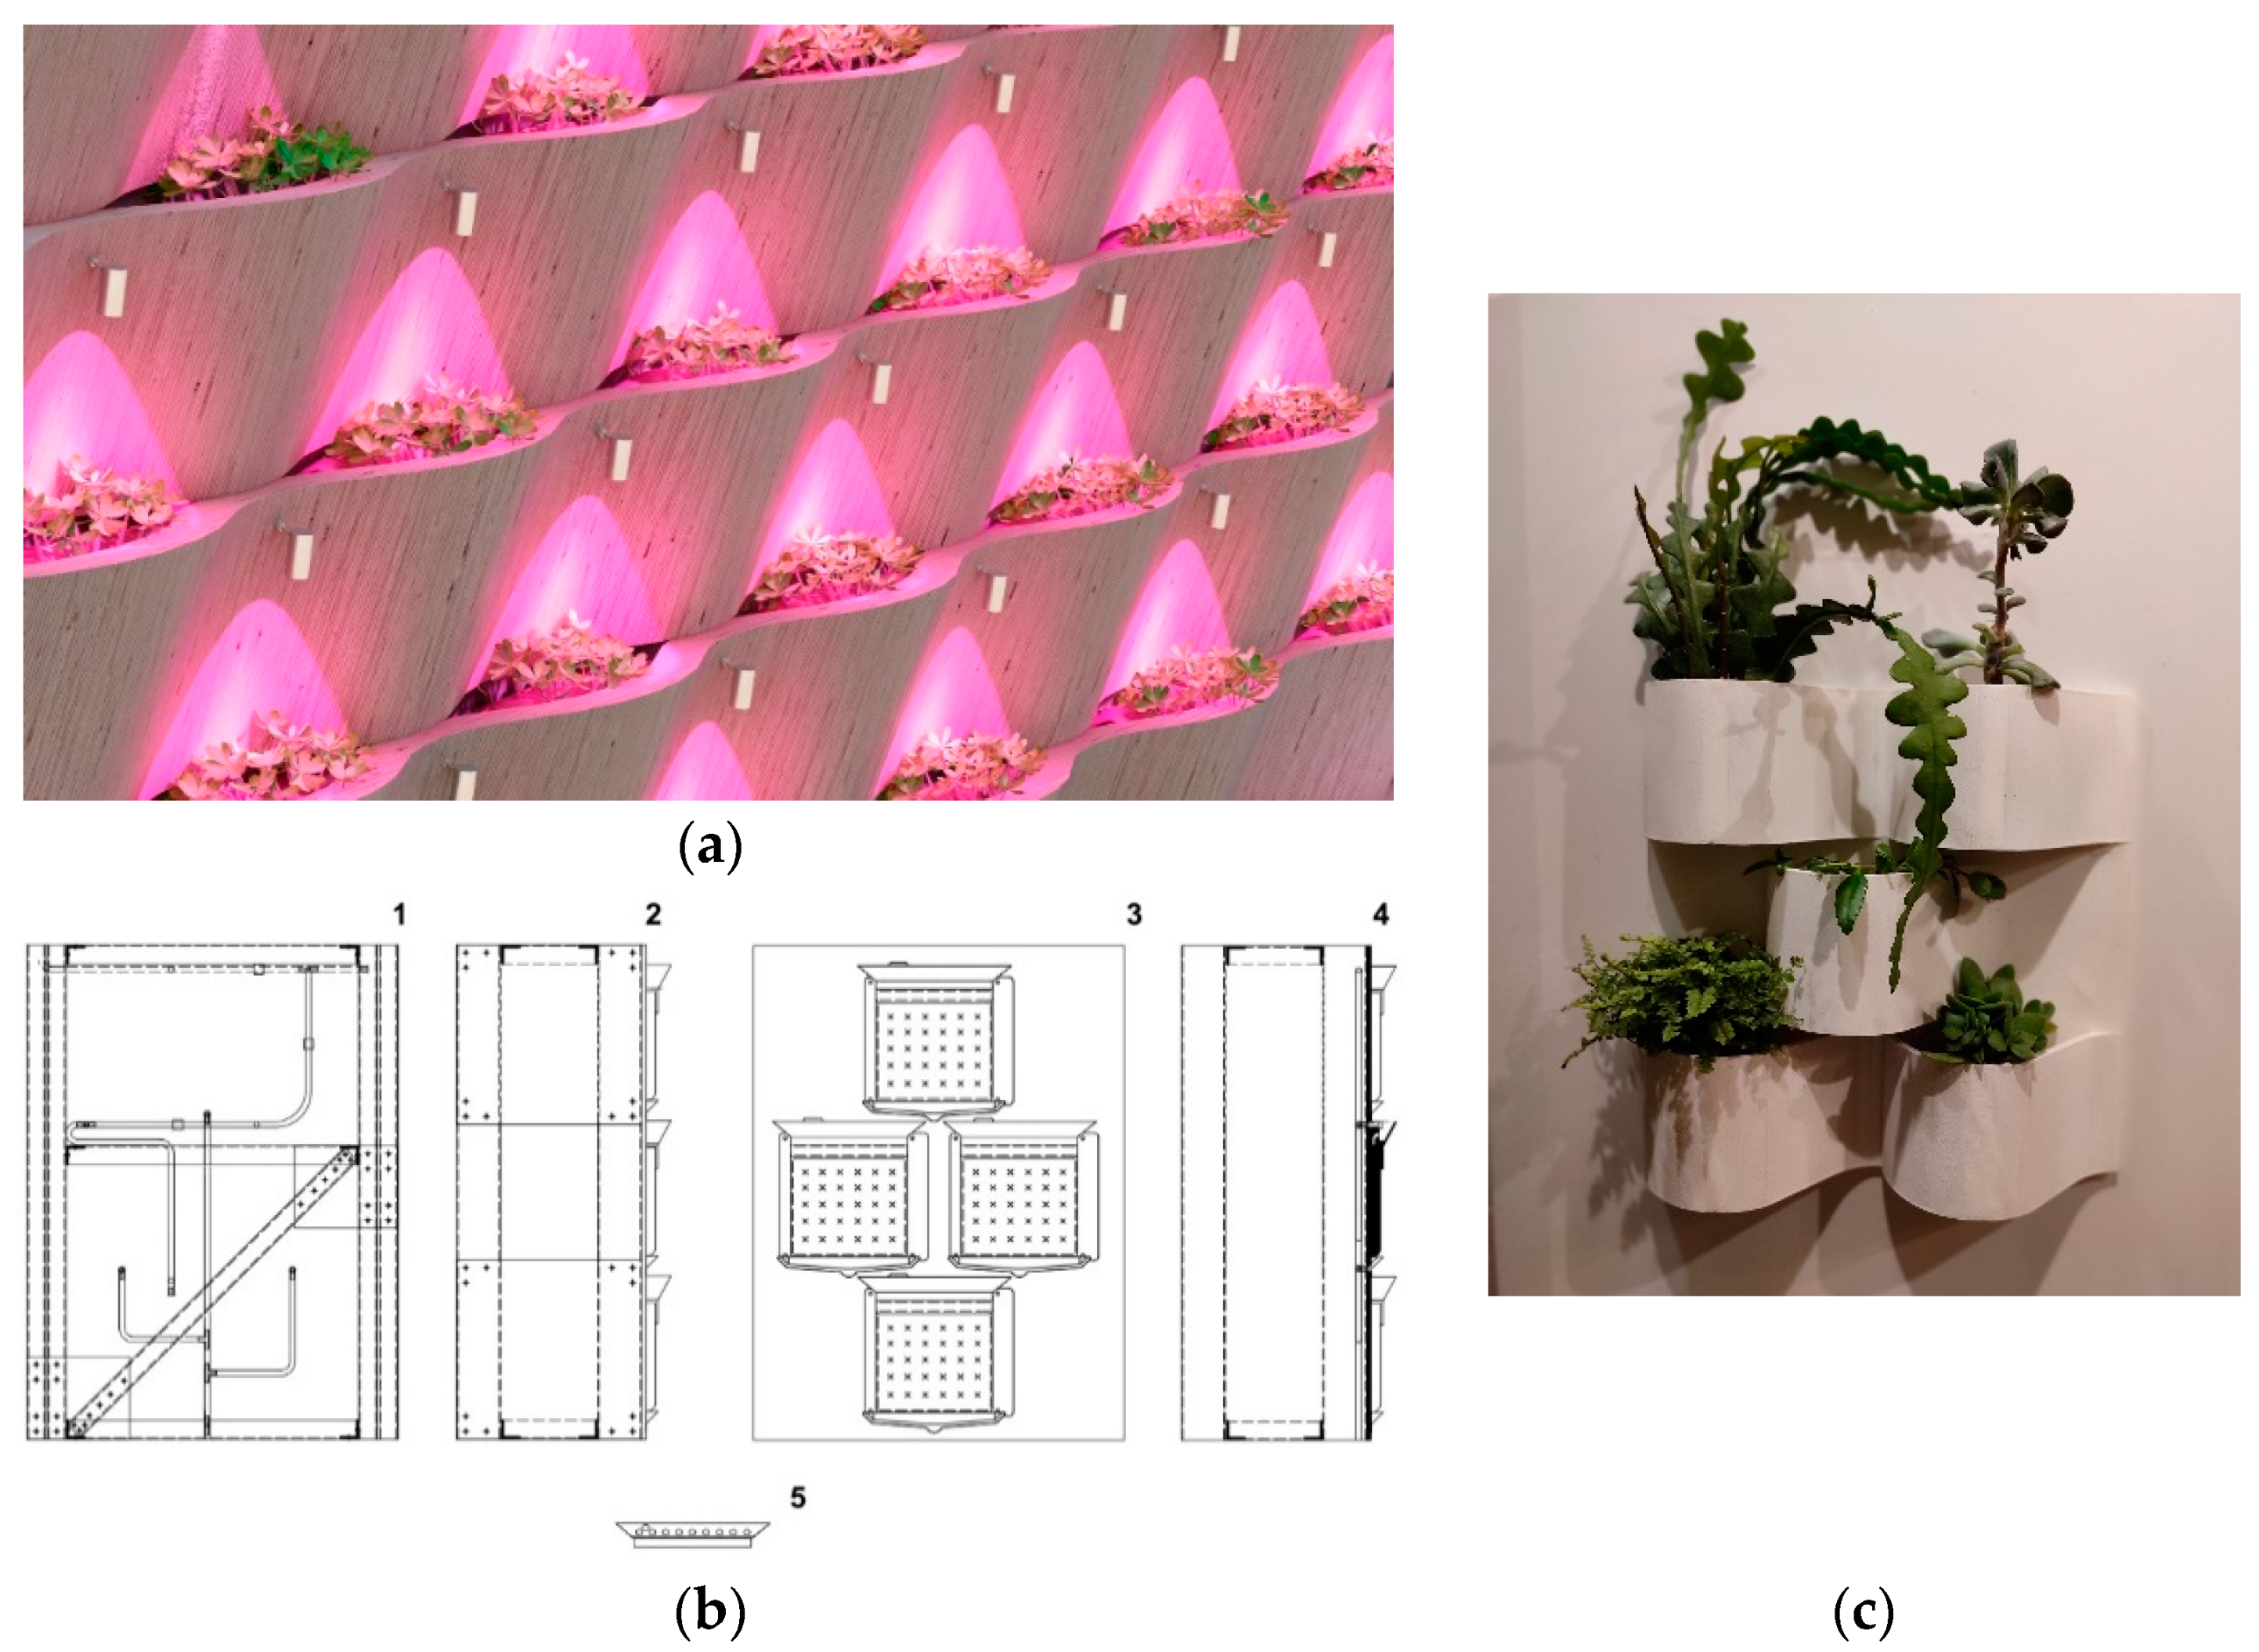
- Easy installation—on the principle of the constructor Lego;
- Integrated irrigation system;
- Unique modular design.
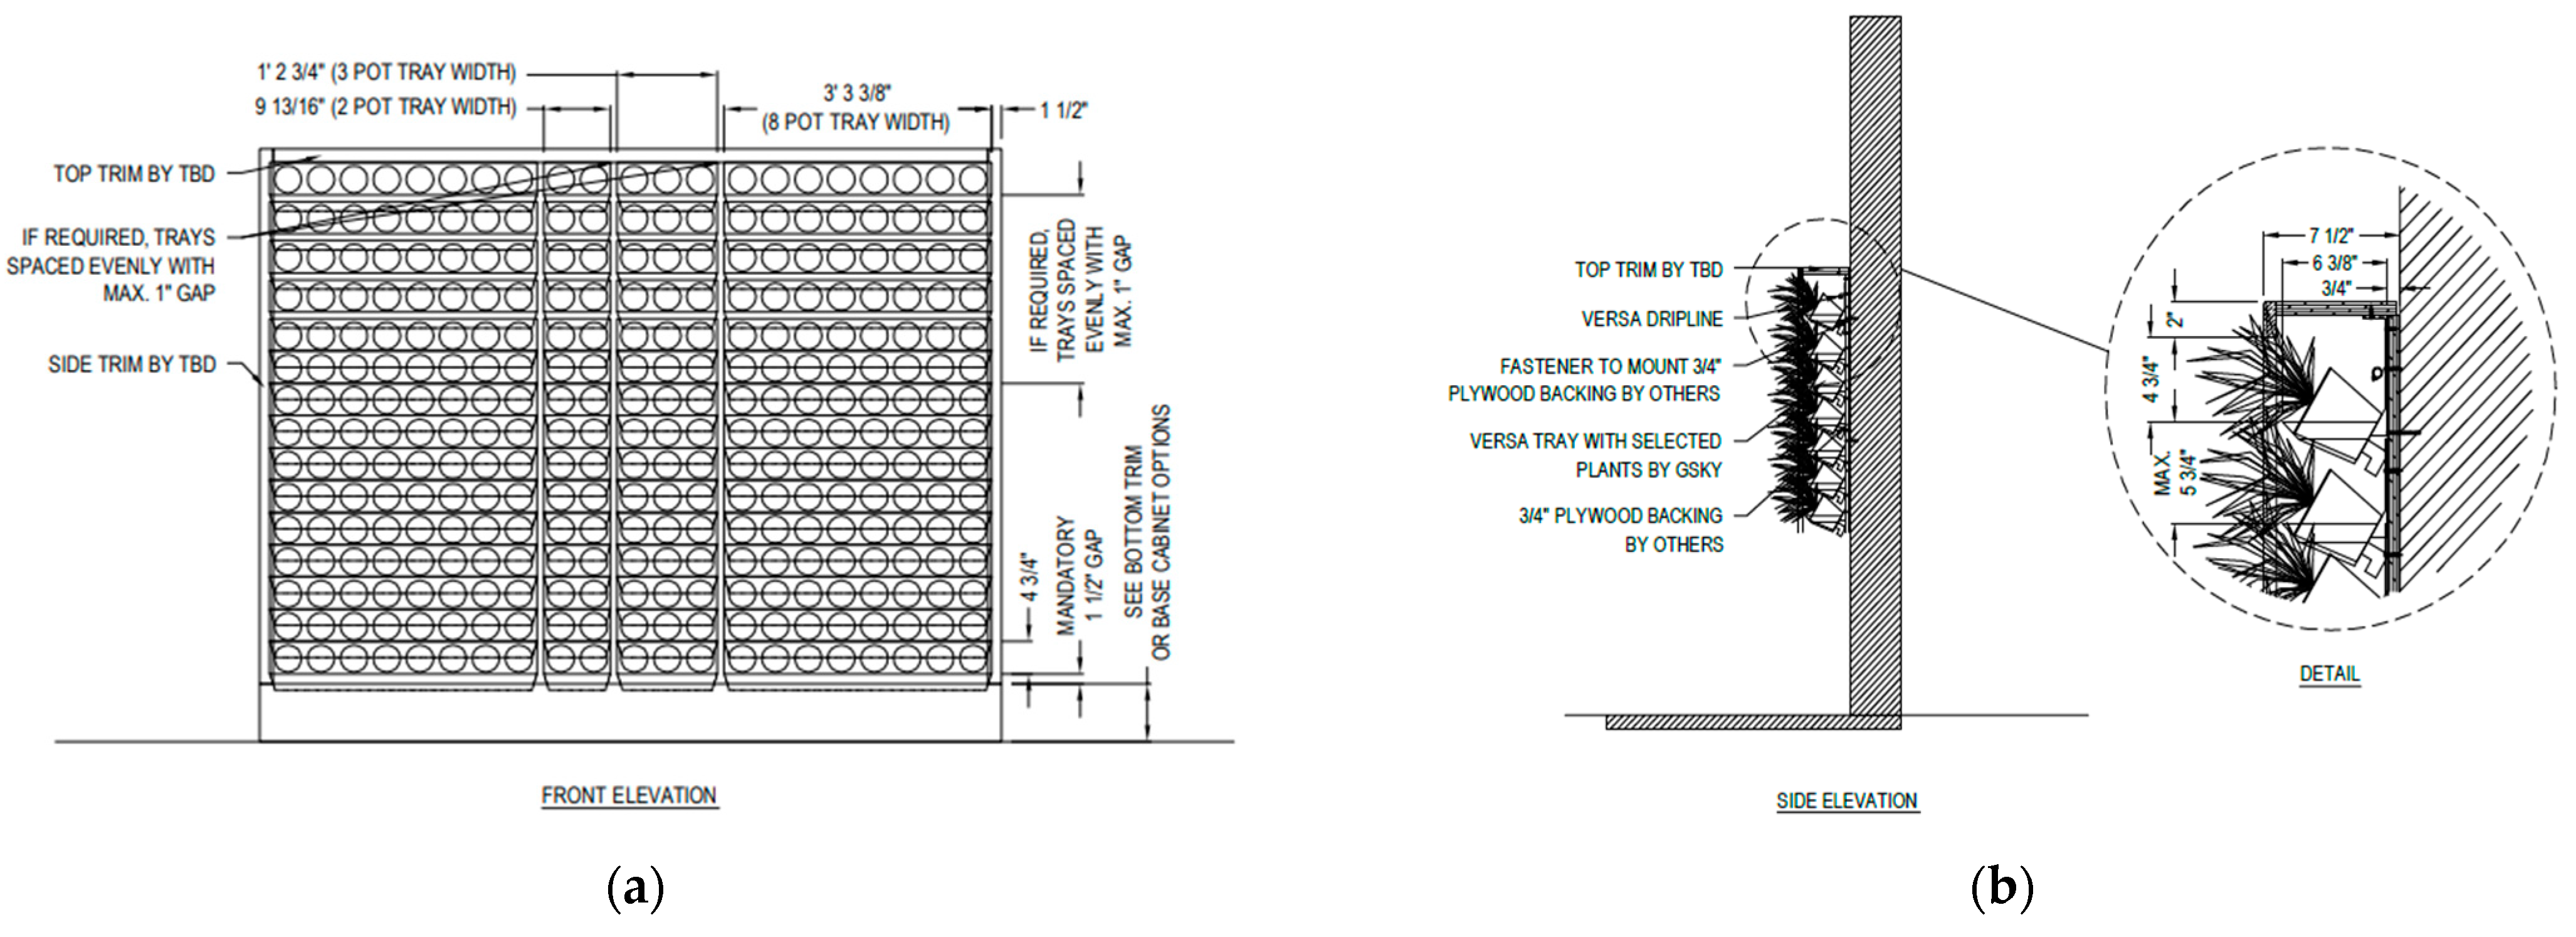
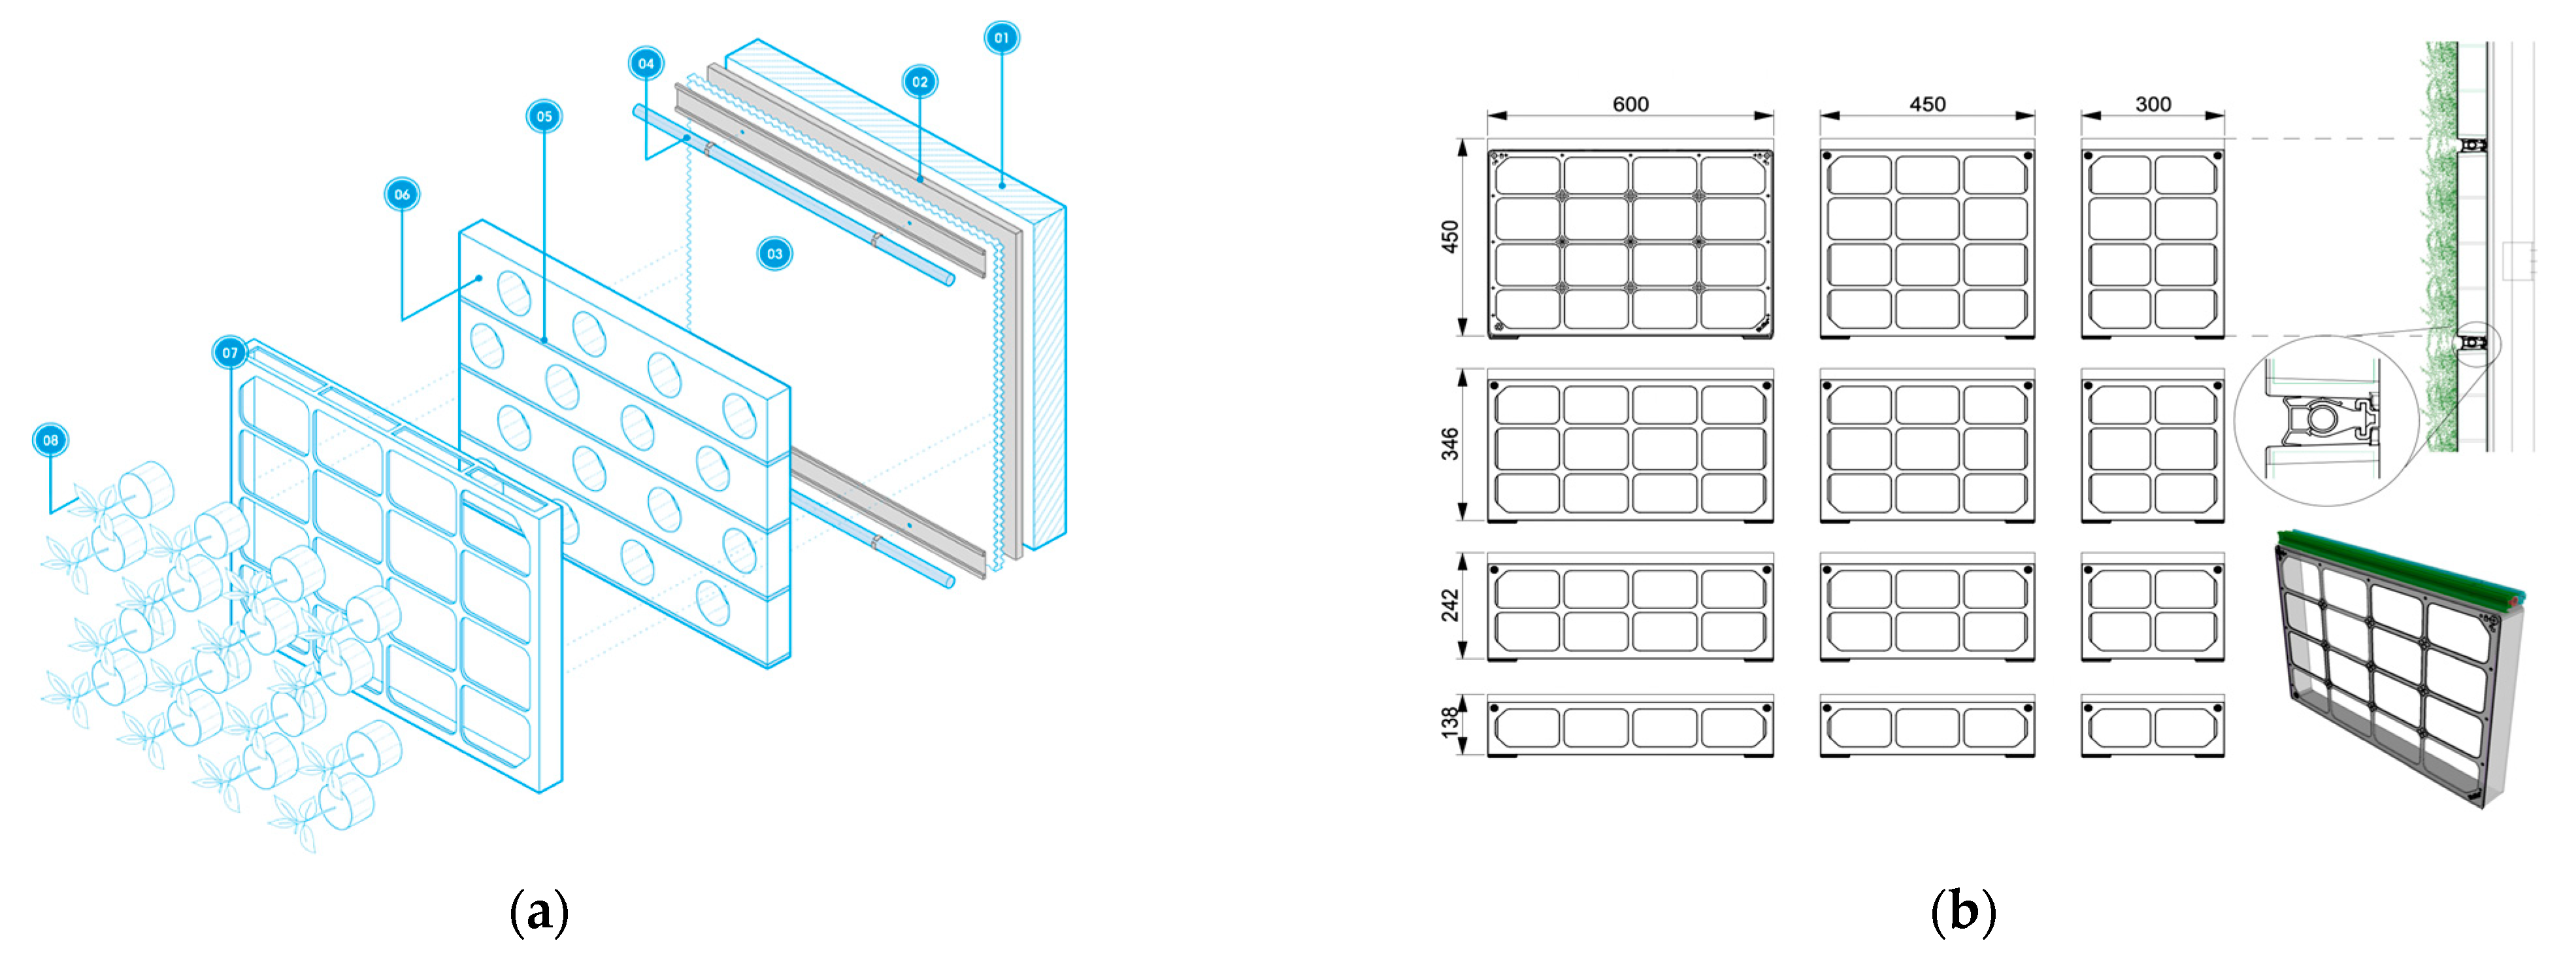
- Versa-wall container system
- -
- Two-pot tray width is 24.92 cm;
- -
- Three-pot tray width is 37.46 cm;
- -
- Eight-pot tray width is 100 cm.
- 2.
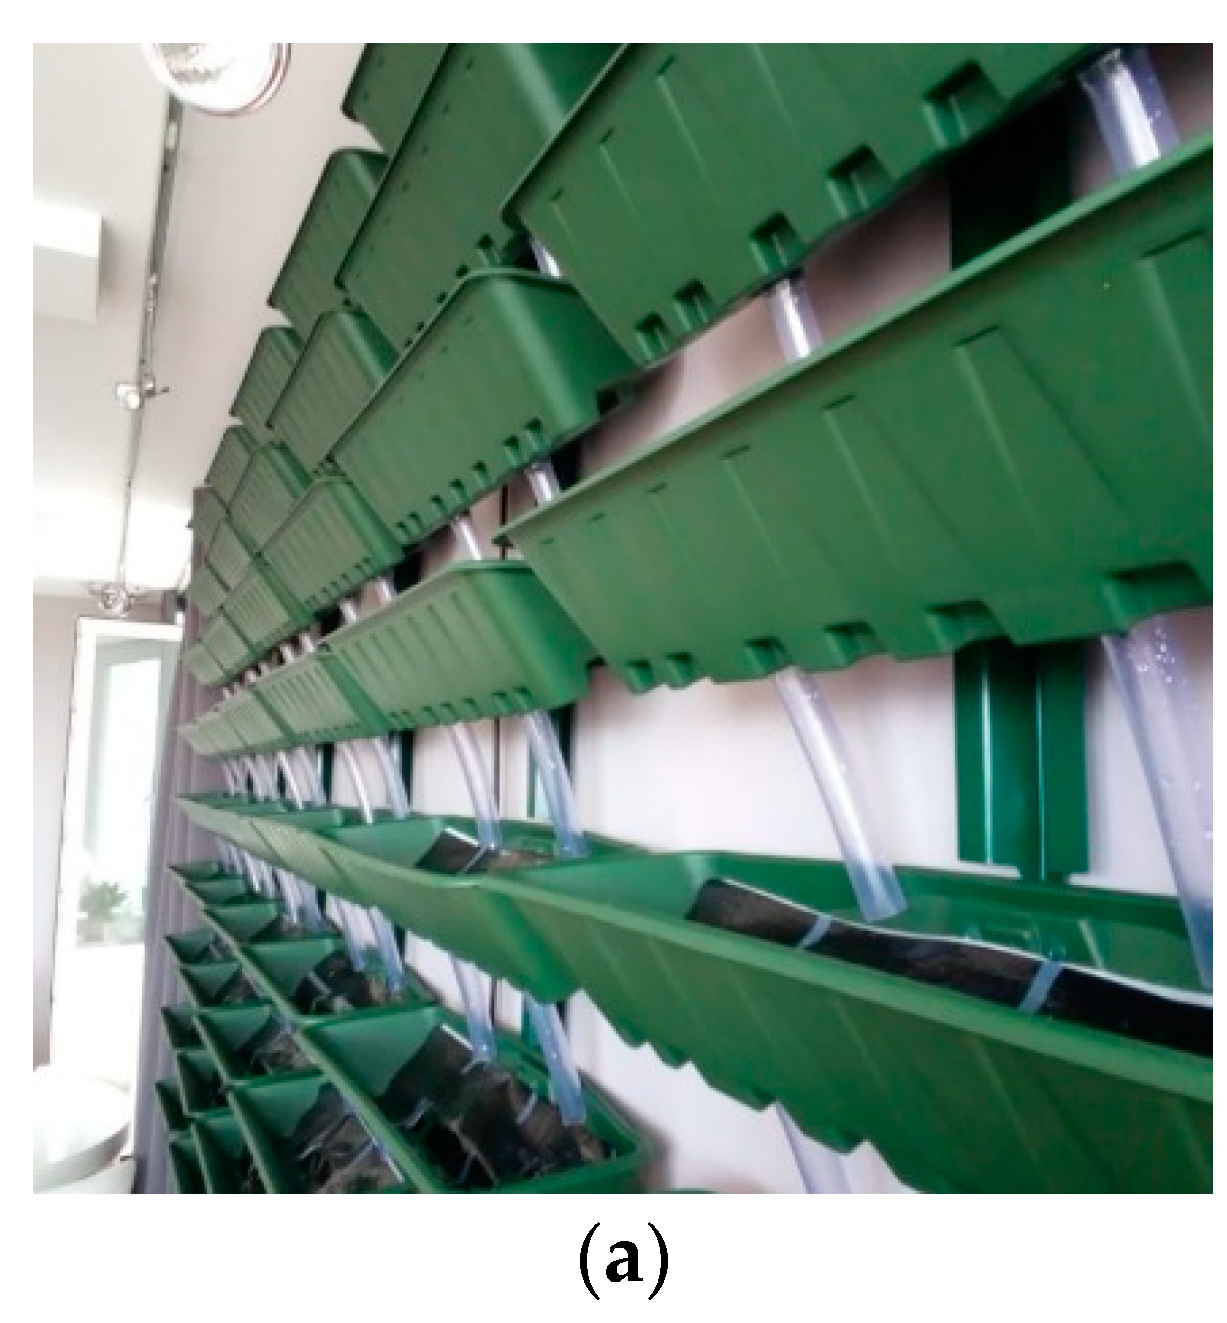
- Alivotec container system
- 3.
- Biotecture modular hydroponic system
- Support system is a galvanized hot rolled steel frame.
- The waterproof backing board is fixed to the support structure. Biotecture Limited (Chichester, UK) uses a 12 mm thick Versapanel Eco as a backing board in their Living Wall system.
- Rear drainage layer is a geotextile material secured by the cladding rail.
- Aluminum rail and dripline (also called panel carrier rails) carry and hold the Biotiles and they are fixed to the backing board.
- Capillary breaks by using geotextile drainage layer.
- Growing medium Grodan is a hydroponic growing medium with a minimal dry density of 17 kg/m3.
- The Biotecture Living Wall System is formed using Biotile modules, each nominally 600 mm wide × 450 mm high × 62 mm thick, constructed from polypropylene.
- Plants. The following plants are suitable for use externally and were included in Engineering Assessment Reports on Living Wall Systems that conformed to the minimum rating requirement of B-s3,d2: Acorus gramineus ‘Ogon’, Asplenium scolopendrium (SYN. Phyllitis scolopendrium)’, Buxus spp, Carex morrowii ‘Irish Green’, Convolvulus cneorum, Euonymus spp., Euphorbia spp., Geranium spp., Hebe spp., Hedera spp., Helleborus spp., Heuchera spp., Iris foetidissima, Lavender spp., Liriope spp., Pachysandra spp., Phlox douglasii ‘Lilac Cloud’, Polystichum spp., Soleirolia soleirolii, Viola odorata, Waldsteinia ternata, etc.
- 4.
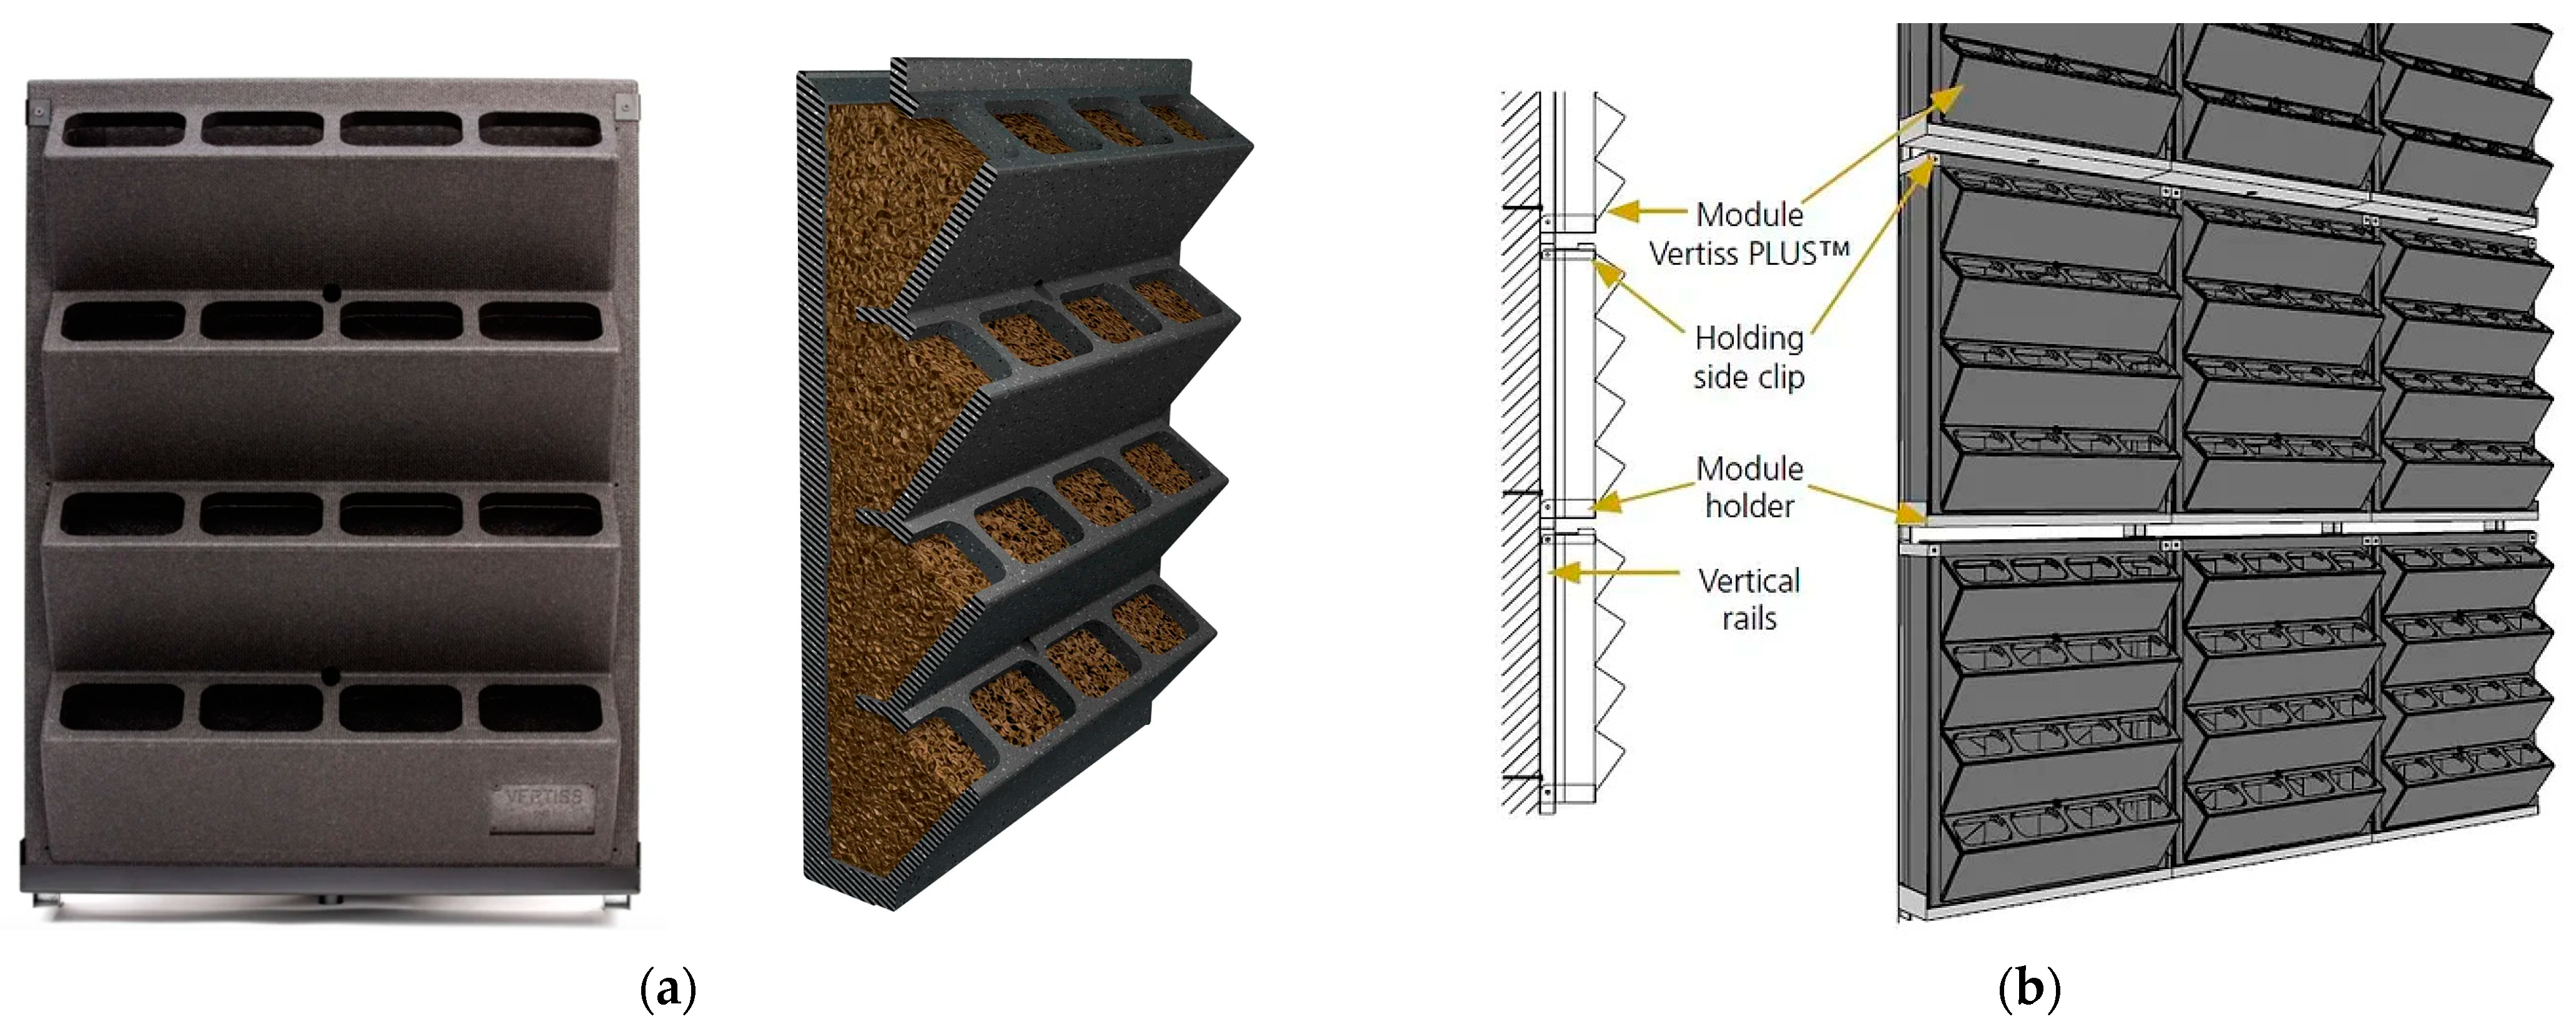
- Vertiss modular substrate system
- 5.
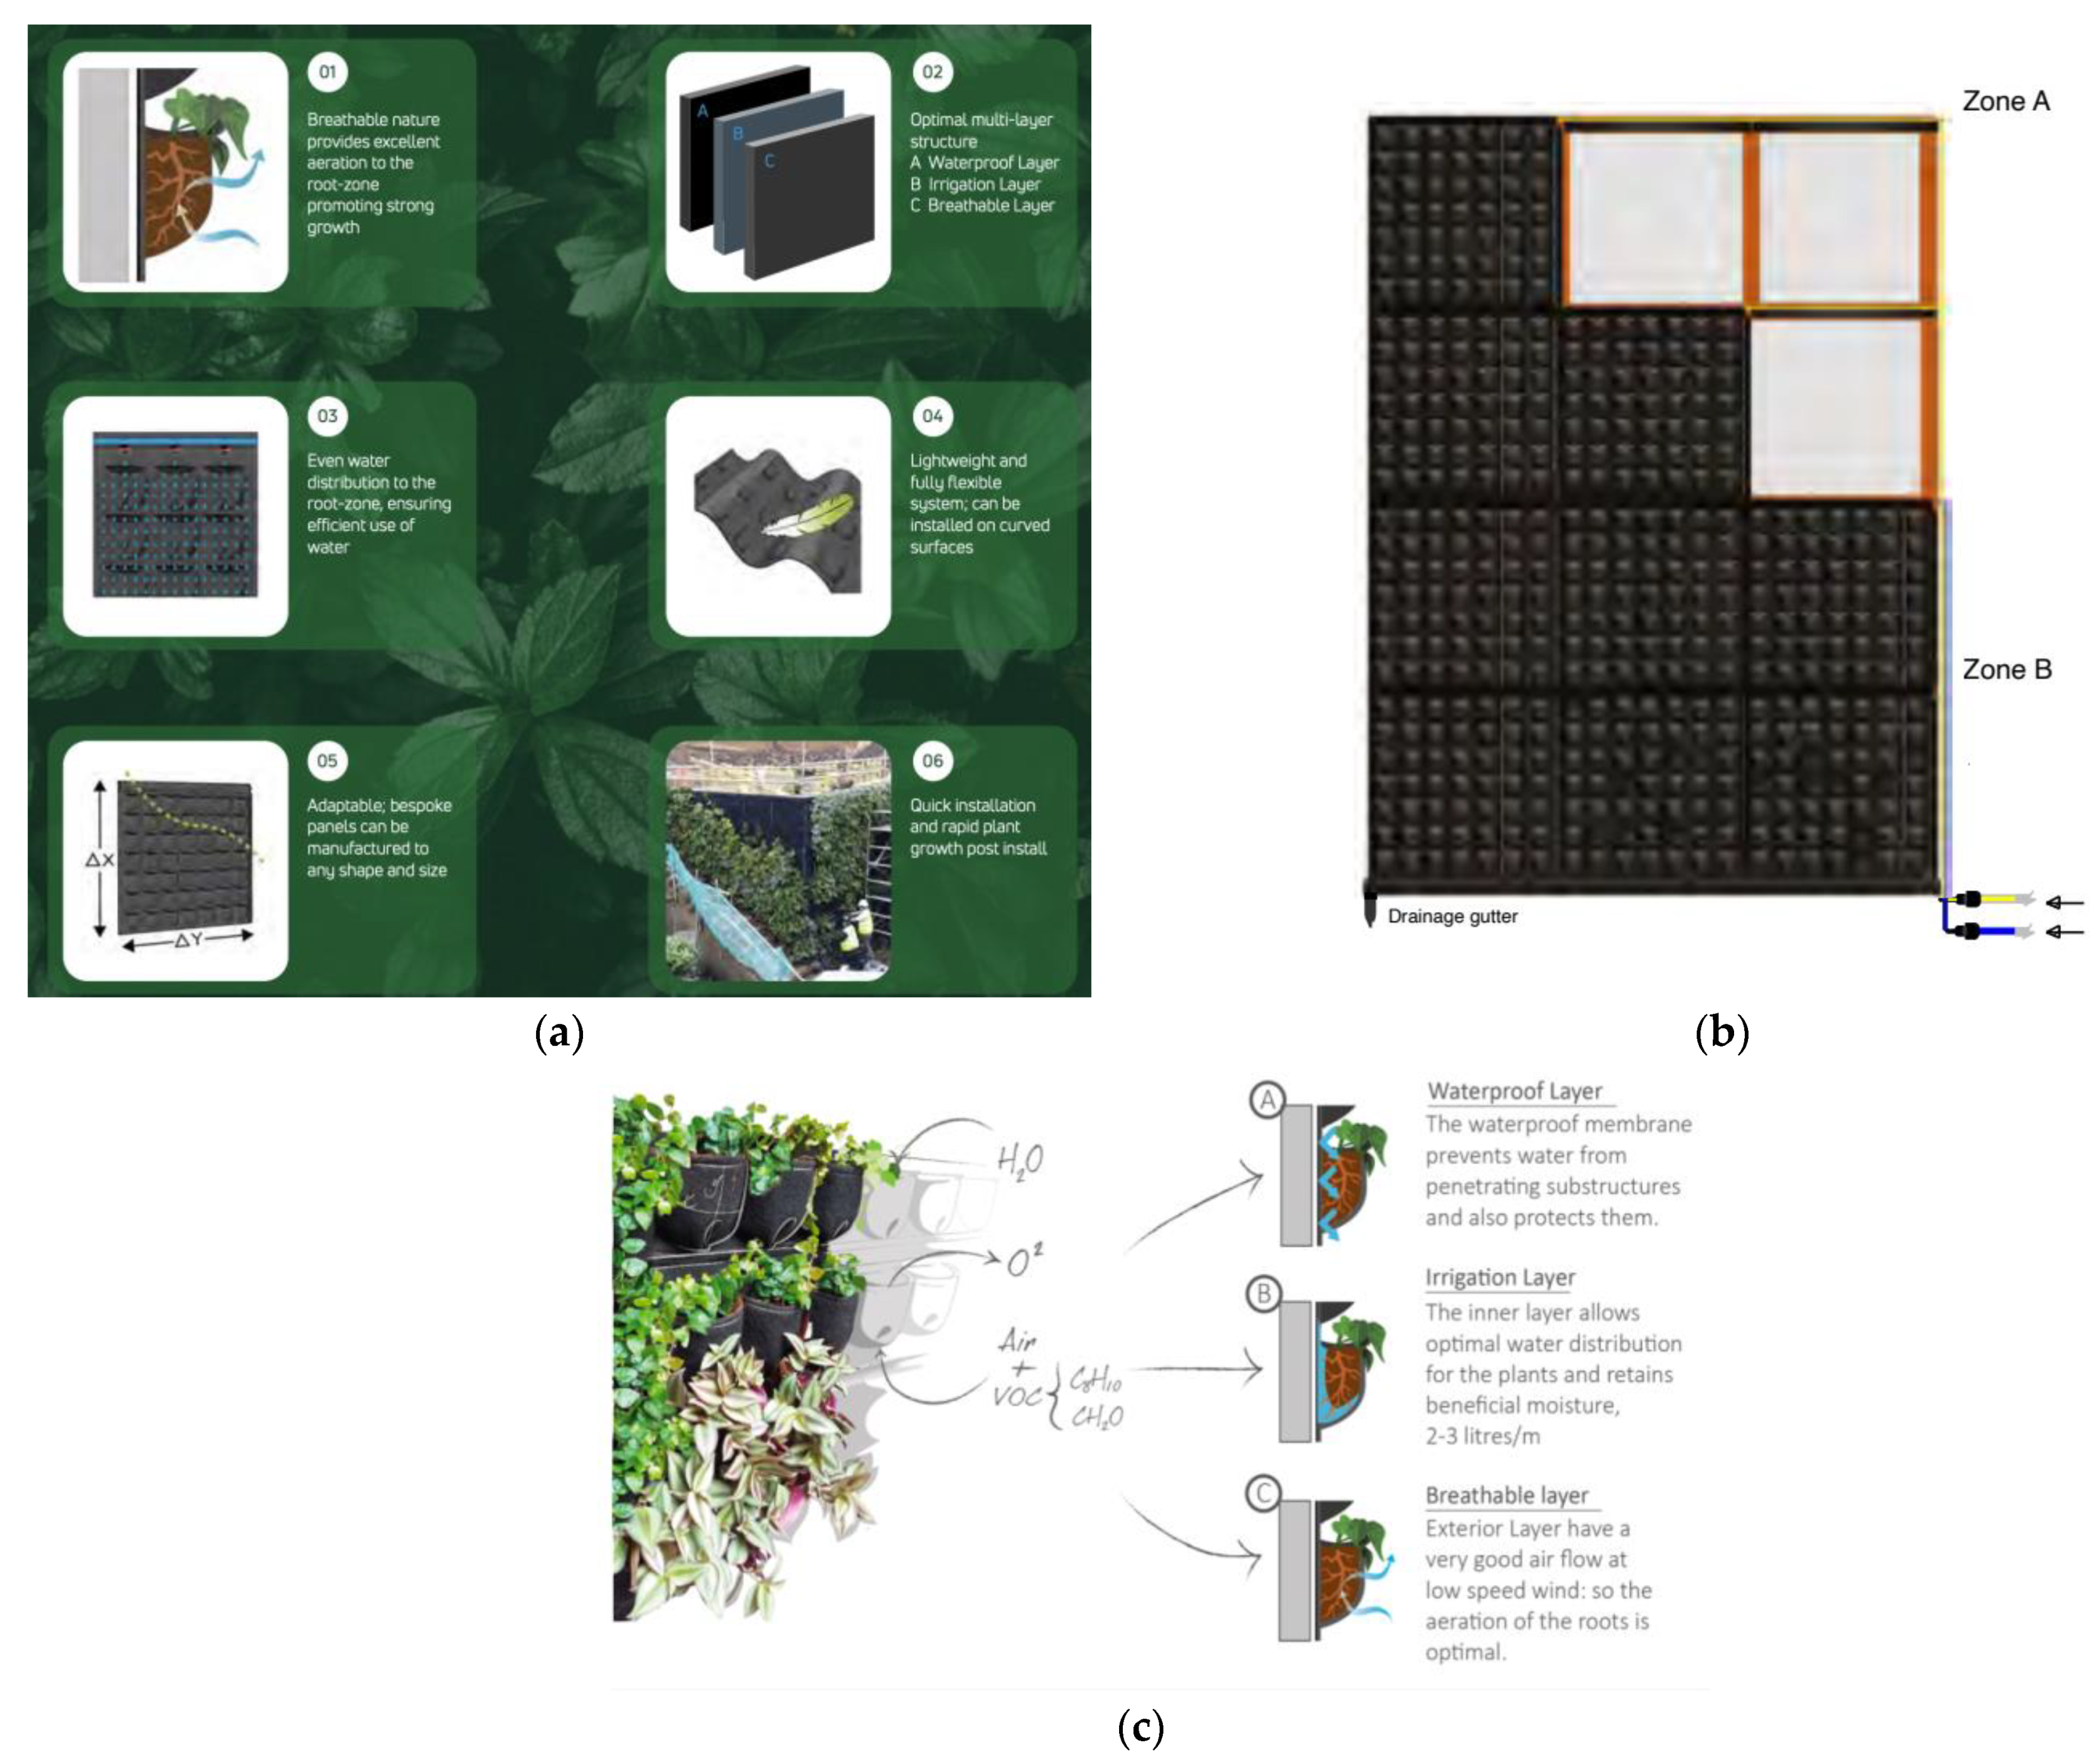
- Scotscape hydroponic wall system
3. Results and Discussion
4. Conclusions
Author Contributions
Funding
Institutional Review Board Statement
Informed Consent Statement
Data Availability Statement
Conflicts of Interest
References
- Manisalidis, I.; Stavropoulou, E.; Stavropoulos, A.; Bezirtzoglou, E. Environmental and health impacts of air pollution: A review. Front. Public Health 2020, 8, 14. [Google Scholar] [CrossRef] [PubMed]
- Ramanathan, V.; Feng, Y. Air Pollution, Greenhouse Gases and Climate Change: Global and Regional Perspectives. Atmos. Environ. 2009, 43, 37–50. [Google Scholar] [CrossRef]
- Zhang, J.; Smith, K.R. Indoor air pollution: A global health concern. Br. Med. Bull. 2003, 68, 209–225. [Google Scholar] [CrossRef] [PubMed]
- Causes, Effects and Solutions to Improve Indoor Air Pollution—Conserve Energy Future. Available online: https://www.conserve-energy-future.com (accessed on 23 February 2023).
- Apte, M.G. Associations between indoor CO2 concentrations and sick building syndrome symptoms in US office buildings: An analysis of the 1994–1996 BASE study data. Indoor Air 2000, 10, 246–257. [Google Scholar] [CrossRef] [PubMed]
- Zheng, X.; Dai, T.; Tang, M. An experimental study of vertical greenery systems for window shading for energy saving in summer. J. Clean. Prod. 2020, 259, 120708. [Google Scholar] [CrossRef]
- Bruno, R.; Bevilacqua, P.; Longo, L.; Arcuri, N. Small Size Single-axis PV Trackers: Control Strategies and System Layout for Energy Optimization. Energy Procedia 2015, 82, 737–743. [Google Scholar] [CrossRef]
- Wahba, S.M.; Kamel, B.A.; Nassar, K.M.; Abdelsalam, A.S. Effectiveness of Green Roofs and Green Walls on Energy Consumption and Indoor Comfort in Arid Climates. Civ. Eng. J. 2018, 4, 2284. [Google Scholar] [CrossRef]
- Hui, S.C.M.; Zheng, Z. Thermal regulation performance of green living walls in buildings. In Proceedings of the Joint Symposium 2013: Innovation and Technology for Built Environment, Hong Kong, China, 12 November 2013. [Google Scholar]
- Korol, E.; Shushunova, N.; Feoktistova, O.; Shushunova, T.; Rubtsov, O. Technical and economical factors in green roof using to reduce the aircraft noise. MATEC Web Conf. 2018, 170, 01081. [Google Scholar] [CrossRef]
- Cameron, R.D. Waste Water as a Water Resource Design, and Operation of an Integrated Biofilter Wastewater Treatment and Reuse System. Ph.D. Thesis, Department of Horticulture, The Pennsylvania State University, State College, PA, USA, 2012. [Google Scholar]
- Başdoğan, G.; Çığ, A. Ecological-Social-Economical Impacts of Vertical Gardens in the Sustainable City Model. Yüzüncü Yıl Üniversitesi Tarım Bilim. Derg. 2016, 26, 430–438. [Google Scholar]
- Susorova, I. Evaluation of the Effects of Vegetation and Green Walls on Building Thermal Performance and Energy Consumption. Ph.D. Thesis, Department of Architecture, The Graduate College of the Illinois Institute, Chicago, IL, USA, 2013. [Google Scholar]
- Ottelé, M.; Perini, K.; Fraaij, A.L.A.; Haas, E.M.; Raiteri, R. Comparative life cycle analysis for green façades and living wall systems. Energy Build. 2011, 43, 3419–3429. [Google Scholar] [CrossRef]
- Minke, G.; Witter, G.; Balcke, C. Häuser mit Grünem Pelz: Ein Handbuch zur Hausbegrünung; Fricke: Pforzheim, Germany, 1983. [Google Scholar]
- Ottelé, M. The Green Building Envelope: Vertical Greening; TU Delft: Delft, The Netherlands, 2011. [Google Scholar]
- NEDLAW Living Walls. 2008. Available online: http://www.naturaire.com/index.php (accessed on 28 February 2011).
- Peck, S.W.; Callaghan, C.; Kuhn, M.E.; Bass, B. Greenbacks from Green Roofs: Forging a New Industry in Canada; Peck & Associates: Norman, OK, USA, 1999. [Google Scholar]
- Browning, W.D.; Kallianpurkar, N.; Ryan, C.O.; Labruto, L.; Watson, S.; Knop, T. The Economics of Biophilia; Terrapin Bright Green LLC.: New York, NY, USA, 2012. [Google Scholar]
- Pumo, D.; Francipane, A.; Alongi, F.; Noto, L.V. The potential of multilayer green roofs for stormwater management in urban area under semi-arid Mediterranean climate conditions. J. Environ. Manag. 2023, 326 Pt A, 116643. [Google Scholar] [CrossRef]
- Cristiano, E.; Deidda, R.; Viola, F. The role of green roofs in urban Water-Energy-Food-Ecosystem nexus: A review. Sci. Total Environ. 2021, 756, 143876. [Google Scholar] [CrossRef]
- Cristiano, E.; Annis, A.; Apollonio, C.; Pumo, D.; Urru, S.; Viola, F.; Deidda, R.; Pelorosso, R.; Petroselli, A.; Tauro, F.; et al. Multilayer blue-green roofs as nature-based solutions for water and thermal insulation management. Hydrol. Res. 2022, 53, 1129–1149. [Google Scholar] [CrossRef]
- Pogliani, L.; Ronchi, S.; Arcidiacono, A.; di Martino, V.; Mazza, F. Regeneration in an ecological perspective. Urban and territorial equalisation for the provision of ecosystem services in the Metropolitan City of Milan. Land Use Policy 2023, 129, 106606. [Google Scholar] [CrossRef]
- Mell, I. Examining the Role of Green Infrastructure as an Advocate for Regeneration. Front. Sustain. Cities 2022, 4, 731975. [Google Scholar] [CrossRef]
- Otsuka, N.; Abe, H.; Isehara, Y.; Miyagawa, T. The potential use of green infrastructure in the regeneration of brownfield sites: Three case studies from Japan’s Osaka Bay Area. Local Environ. 2021, 26, 1346–1363. [Google Scholar] [CrossRef]
- Aung, T.; Liana, S.R.; Htet, A.; Bhaumik, A. Integrating green infrastructure into urban high-rise buildings: Design strategies and benefits. Seybold Rep. 2023, 18, 1571–1579. [Google Scholar] [CrossRef]
- Conejos, S.; Chew, M.Y.L.; Azril, F.H.B. Green maintainability assessment of high-rise vertical greenery systems. Facilities 2019, 37, 1008–1047. [Google Scholar] [CrossRef]
- Razzaghmanesh, M.; Beecham, S.; Salemi, T. The role of green roofs in mitigating Urban Heat Island effects in the metropolitan area of Adelaide, South Australia. Urban For. Urban Green. 2016, 15, 89–102. [Google Scholar] [CrossRef]
- Manso, M.; Castro-Gomes, J. Green wall systems: A review of their characteristics. Renew. Sustain. Energy Rev. 2015, 41, 863–871. [Google Scholar] [CrossRef]
- Planting Module Vertiss Plus. Available online: https://www.vertiss.net/vertiss-plus-le-module-vegetalise?lang=en (accessed on 3 May 2023).
- Scotscape. Available online: https://www.scotscape.co.uk/thank-you-document-download (accessed on 3 May 2023).
- Wolverton, B.C.; Johnson, A.; Bounds, K. Interior Landscape Plants for Indoor Air Pollution Abatement; No. NASA-TM-101766; NASA: Washington, DC, USA, 1989. [Google Scholar]
- Wolverton, B.C. Natural systems for wastewater treatment and water reuse for space and earthly applications. In Proceedings of the American Water Works Association Research Foundation, Wuter Reuse Symposium IV, Denver, CO, USA, 2–7 August 1987; pp. 729–741. [Google Scholar]
- Wolverton, B.C. Aquatic Plants for Wastewater Treatment: An Overview. In Aquatic Plants for Wastewater Treatment and Resource Recovery; Reddy, K.R., Smith, V.H., Eds.; Magnolia Publishing: Orlando, FL, USA, 1987; pp. 3–15. [Google Scholar]
- Wolverton, B.C.; Bounds, B.K. Aquatic plants for pH adjustment and removal of toxic chemicals and dissolved minerals from water supplies. J. Miss. Acad. Sci. 1988, 33, 71–80. [Google Scholar]
- Wolverton, B.C.; McDonald-McCaleb, R.C. Biotransformation of priority pollutants using biofilms and vascular plants. J. Miss. Acad. Sci. 1986, 31, 79–89. [Google Scholar]
- Wolverton, B.C.; McDonald, R.C. Natural processes for treatment of organic chemical waste. Environ. Prof. 1981, 3, 99–104. [Google Scholar]
- McCaleb, R.C.; Bounds, B.K. Biological activated carbon. In Proceedings of the American Water Works Association Research Foundation, Water Reuse Symposium IV, Denver, CO, USA, 2–8 August 1987; pp. 1301–1316. [Google Scholar]
- Gitelson, J.I.; Kovrov, B.G.; Lisovskig, G.M.; Okladnikov, Y.N.; Rerberg, M.S.; Ya Sidko, F.; Terskvo, I.A. Experimental Ecological Systems Including Man. Probl. Space Biol. 1975, 28, 1–312. [Google Scholar]
- Bevilacqua, P. The effectiveness of green roofs in reducing building energy consumptions across different climates. A summary of literature results. Renew. Sustain. Energy Rev. 2021, 151, 111523. [Google Scholar] [CrossRef]
- Bevilacqua, P.; Bruno, R.; Arcuri, N. Green roofs in a Mediterranean climate: Energy performances based on in-situ experimental data. Renew. Energy 2020, 152, 1414–1430. [Google Scholar] [CrossRef]
- Wallace, L.; Pellizzari, E.; Hartwell, T.; Rosenweig, M.; Erickson, M.; Sparacino, C.; Zelon, H. Personal exposureto volatile organic compounds: I. direct measurement in breathing-zone air, drinking water, food and exhaled breath. Environ. Res. 1984, 35, 193–211. [Google Scholar]
- Pellizzari, E.; Hartwell, T.; Sparacino, C.; Shelson, C.; Whitmore, R.; Leininger, C.; Zelon, H. Total Exposure Assessment Methodology (TEAM) Study: First Season, Northern New Jersey—Interim Report; Contract No. 68-02-3679; EPA: Washington, DC, USA, 1984. [Google Scholar]
- Shushunova, N.; Korol, E.; Luzay, E.; Shafieva, D.; Bevilacqua, P. Ensuring the Safety of Buildings by Reducing the Noise Impact through the Use of Green Wall Systems. Energies 2022, 15, 8097. [Google Scholar] [CrossRef]
- Bevilacqua, P.; Morabito, A.; Bruno, R.; Ferraro, V.; Arcuri, N. Seasonal performances of photovoltaic cooling systems in different weather conditions. J. Clean. Prod. 2020, 272, 122459. [Google Scholar] [CrossRef]
- Bevilacqua, P.; Perrella, S.; Bruno, R.; Arcuri, N. An accurate thermal model for the PV electric generation prediction: Long-term validation in different climatic conditions. Renew. Energy 2021, 163, 1092–1112. [Google Scholar] [CrossRef]
- Szyszka, J.; Bevilacqua, P.; Bruno, R. An innovative trombe wall for winter use: The thermo-diode trombe wall. Energies 2020, 13, 2188. [Google Scholar] [CrossRef]

| Versa-Wall | Alivotec | Biotecture | Vertis | Scotscape | |
|---|---|---|---|---|---|
| Standard dimensions of the module/container/wall, mm | 1000 × 1168.8 (8-pot system) | 504 × 1770 | 600 × 450 | 760 × 590 | 1000 × 1000 |
| Standard square, m2 | 1.168 | 0.589 | 0.27 | 0.45 | 1 |
| Number of plants in standard square | 64 | 24 (10–12 cm diameter of pots) | 16 | 14 | 49 |
| Number of plants in 1 m2 | 54 | 40 | 60 | 32 | 49 |
| Comparison Criterion | Versa-Wall | Alivotec | Biotecture | Vertis | Scotscape |
|---|---|---|---|---|---|
| Construction type | Container | Container | Modular (hydroponic) | Modular (substrate) | Hydroponic |
| Mounting method | Containers | Containers | Prepared modules | Prepared modules | Felt pockets |
| Growing medium | Soil | Soil | Rockwool | Pozzolan, cross-linked polymers | Fytotexile |
| Drainage system | Bottom-drained or recycled water | Pipe system connected to the water supply system | Hydroponic | Hydroponic | Hydroponic |
| Irrigation system | The water supply to trays by pipes. It can be manual/automatic | Piping system. Irrigation is performed manually or automatically | Automatic watering system | Automatic watering system | Irrigation pipework |
| Possibility of changing the design | The design can be changed easily by replaced plants | Modifying design by moving containers | Modification of design by rearranging modules | Modification of design by rearranging modules | The design cannot be changed, only dismantled |
| Square, m2 | 1 | 1 | 1 | 1 | 1 |
| Number of plants per 1 m2 | 54 | 40 | 60 | 32 | 49 |
| System weight, kg/m2 | 50 | 30 | 70 | 94 | 40 |
| Trichloroethylene (TCE) | Benzene | Formaldehyde | ||||
|---|---|---|---|---|---|---|
| Surface Area of Plant Leafs (in cm2) | Quantity of Micrograms Removed (per Plant) | Surface Area of Plant Leafs (in cm2) | Quantity of Micrograms Removed (per Plant) | Surface Area of Plant Leafs (in cm2) | Quantity of Micrograms Removed (per Plant) | |
| Gerbera daisy (Gerbera jamesonii) | 4.581 | 38.938 | 4.581 | 107.653 | - | - |
| English ivy (Hedera helix) | 981 | 7.161 | 4.227 | 76.931 | 985 | 9.653 |
| Marginata (Dracaena marginata) | 7.581 | 27.292 | 1.336 | 13.894 | 7.581 | 20.469 |
| Peace lily (Spathiphyllum “Mauna Loa”) | 7.960 | 27.064 | 2.871 | 28.710 | 8.509 | 16.167 |
| Mother-in-law’s tongue (Sane evieria) | 3.470 | 9.720 | 7.242 | 39.107 | 2.871 | 31.294 |
| Warneckei (Dracaena deremensis “Warneckei”) | 7.242 | 13.760 | 7.960 | 41.392 | - | - |
| Bamboo palm (Chamaedorea seitritzii) | 10.325 | 16.520 | 3.085 | 14.500 | 14.205 | 76.707 |
| Mass cane (Dracaena massangeana) | 7.215 | 10.101 | 7.581 | 30.324 | - | - |
| Janet Craig (Dracaena deremensis “Janet Craig”) | 15.270 | 18.300 | 10.325 | 34.073 | 15,275 | 48.880 |
| Number of Plants per 1 m2—54 | Trichloroethylene (TCE) | Benzene | Formaldehyde | |||
|---|---|---|---|---|---|---|
| Quantity of Micrograms Removed (per Plant) | Quantity of Micrograms Removed (per 1 m2) | Quantity of Micrograms Removed (per Plant) | Quantity of Micrograms Removed (per 1 m2) | Quantity of Micrograms Removed (per Plant) | Quantity of Micrograms Removed (per 1 m2) | |
| Gerbera daisy | 38.938 | 2102.652 | 107.653 | 5813.262 | - | - |
| Hedera | 7161 | 386.694 | 76.931 | 4154.274 | 9.653 | 521.262 |
| Dracaena | 27.292 | 1473.768 | 13.894 | 750.276 | 20.469 | 1105.326 |
| Spathiphyllum | 27.064 | 1461.456 | 28.71 | 1550.34 | 16.167 | 873.018 |
| Sane evieria | 9.727 | 525.258 | 39.107 | 2111.778 | 31.294 | 1689.876 |
| Warneckei | 13.76 | 743.04 | 41.392 | 2235.168 | - | - |
| Bamboo | 16.52 | 892.08 | 14.5 | 783 | 76.707 | 4142.178 |
| Cane | 10.101 | 545.454 | 30.324 | 1637.496 | - | - |
| Janet Craig | 18.33 | 989.82 | 34.073 | 1839.942 | 48.88 | 2639.52 |
| Number of Plants per 1 m2—40 | Trichloroethylene (TCE) | Benzene | Formaldehyde | |||
|---|---|---|---|---|---|---|
| Quantity of Micrograms Removed (per Plant) | Quantity of Micrograms Removed (per 1 m2) | Quantity of Micrograms Removed (per plant) | Quantity of Micrograms Removed (per 1 m2) | Quantity of Micrograms Removed (per plant) | Quantity of Micrograms Removed (per 1 m2) | |
| Gerbera daisy | 38.938 | 1557.52 | 107.653 | 4306.12 | - | - |
| Hedera | 7.161 | 286.44 | 76.931 | 3077.24 | 9.653 | 386.12 |
| Dracaena | 27.292 | 1091.68 | 13.894 | 555.76 | 20.469 | 818.76 |
| Spathiphyllum | 27.064 | 1082.56 | 28.71 | 1148.4 | 16.167 | 646.68 |
| Sane evieria | 9.727 | 389.08 | 39.107 | 1564.28 | 31.294 | 1251,76 |
| Warneckei | 13.76 | 550.4 | 41.392 | 1655.68 | - | - |
| Bamboo | 16.52 | 660.8 | 14.5 | 580 | 76.707 | 3068.28 |
| Cane | 10.101 | 404.04 | 30.324 | 1212.96 | - | - |
| Janet Craig | 18.33 | 733.2 | 34.073 | 1362.92 | 48.88 | 1955.2 |
| Number of Plants per 1 m2—60 | Trichloroethylene (TCE) | Benzene | Formaldehyde | |||
|---|---|---|---|---|---|---|
| Quantity of Micrograms Removed (per Plant) | Quantity of Micrograms Removed (per 1 m2) | Quantity of Micrograms Removed (per Plant) | Quantity of Micrograms Removed (per 1 m2) | Quantity of Micrograms Removed (per Plant) | Quantity of Micrograms Removed (per 1 m2) | |
| Gerbera daisy | 38.938 | 2336.28 | 107.653 | 6459.18 | - | - |
| Hedera | 7.161 | 429.66 | 76.931 | 4615.86 | 9.653 | 579.18 |
| Dracaena | 27.292 | 1637.52 | 13.894 | 833.64 | 20.469 | 1228.14 |
| Spathiphyllum | 27.064 | 1623.84 | 28.71 | 1722.6 | 16.167 | 970,02 |
| Sane evieria | 9.727 | 583.62 | 39.107 | 2346.42 | 31.294 | 1877.64 |
| Warneckei | 13.76 | 825.6 | 41.392 | 2483,52 | - | - |
| Bamboo | 16.52 | 991.2 | 14.5 | 870 | 76.707 | 4602.42 |
| Cane | 10.101 | 606.06 | 30.324 | 1819.44 | - | - |
| Janet Craig | 18.33 | 1099.8 | 34.073 | 2044.38 | 48.88 | 2932.8 |
| Number of Plants per 1 m2—32 | Trichloroethylene (TCE) | Benzene | Formaldehyde | |||
|---|---|---|---|---|---|---|
| Quantity of Micrograms Removed (per Plant) | Quantity of Micrograms Removed (per 1 m2) | Quantity of Micrograms Removed (per Plant) | Quantity of Micrograms Removed (per 1 m2) | Quantity of Micrograms Removed (per Plant) | Quantity of Micrograms Removed (per 1 m2) | |
| Gerbera daisy | 38.938 | 1246.016 | 107.653 | 3444.896 | - | - |
| Hedera | 7.161 | 229.152 | 76.931 | 2461.792 | 9.653 | 308.896 |
| Dracaena | 27.292 | 873.344 | 13.894 | 444.608 | 20.469 | 655.008 |
| Spathiphyllum | 27.064 | 866.048 | 28.71 | 918.72 | 16.167 | 517.344 |
| Sane evieria | 9.727 | 311.264 | 39.107 | 1251.424 | 31.294 | 1001.408 |
| Warneckei | 13.76 | 440.32 | 41.392 | 1324.544 | - | - |
| Bamboo | 16.52 | 528.64 | 14.5 | 464 | 76.707 | 2454.624 |
| Cane | 10.101 | 323.232 | 30.324 | 970.368 | - | - |
| Janet Craig | 18.33 | 586.56 | 34.073 | 1090.336 | 48.88 | 1564.16 |
| Number of Plants per 1 m2—49 | Trichloroethylene (TCE) | Benzene | Formaldehyde | |||
|---|---|---|---|---|---|---|
| Quantity of Micrograms Removed (per Plant) | Quantity of Micrograms Removed (per 1 m2) | Quantity of Micrograms Removed (per Plant) | Quantity of Micrograms Removed (per 1 m2) | Quantity of Micrograms Removed (per Plant) | Quantity of Micrograms Removed (per 1 m2) | |
| Gerbera daisy | 38.938 | 1907.962 | 107.653 | 5274.997 | - | - |
| Hedera | 7.161 | 350.889 | 76.931 | 3769.619 | 9.653 | 472.997 |
| Dracaena | 27.292 | 1337.308 | 13.894 | 680.806 | 20.469 | 1002.981 |
| Spathiphyllum | 27.064 | 1326.136 | 28.71 | 1406.79 | 16.167 | 792.183 |
| Sane evieria | 9.727 | 476.623 | 39.107 | 1916.243 | 31.294 | 1533.406 |
| Warneckei | 13.76 | 674.24 | 41.392 | 2028.208 | - | - |
| Bamboo | 16.52 | 809.48 | 14.5 | 710.5 | 76.707 | 3758.643 |
| Cane | 10.101 | 494.949 | 30.324 | 1485.876 | - | - |
| Janet Craig | 18.33 | 898.17 | 34.073 | 1669.577 | 48.88 | 2395.12 |
| Trichloroethylene (TCE) | |||||
|---|---|---|---|---|---|
| Versa-Wall | Alivotec | Biotecture | Vertis | Scotscape | |
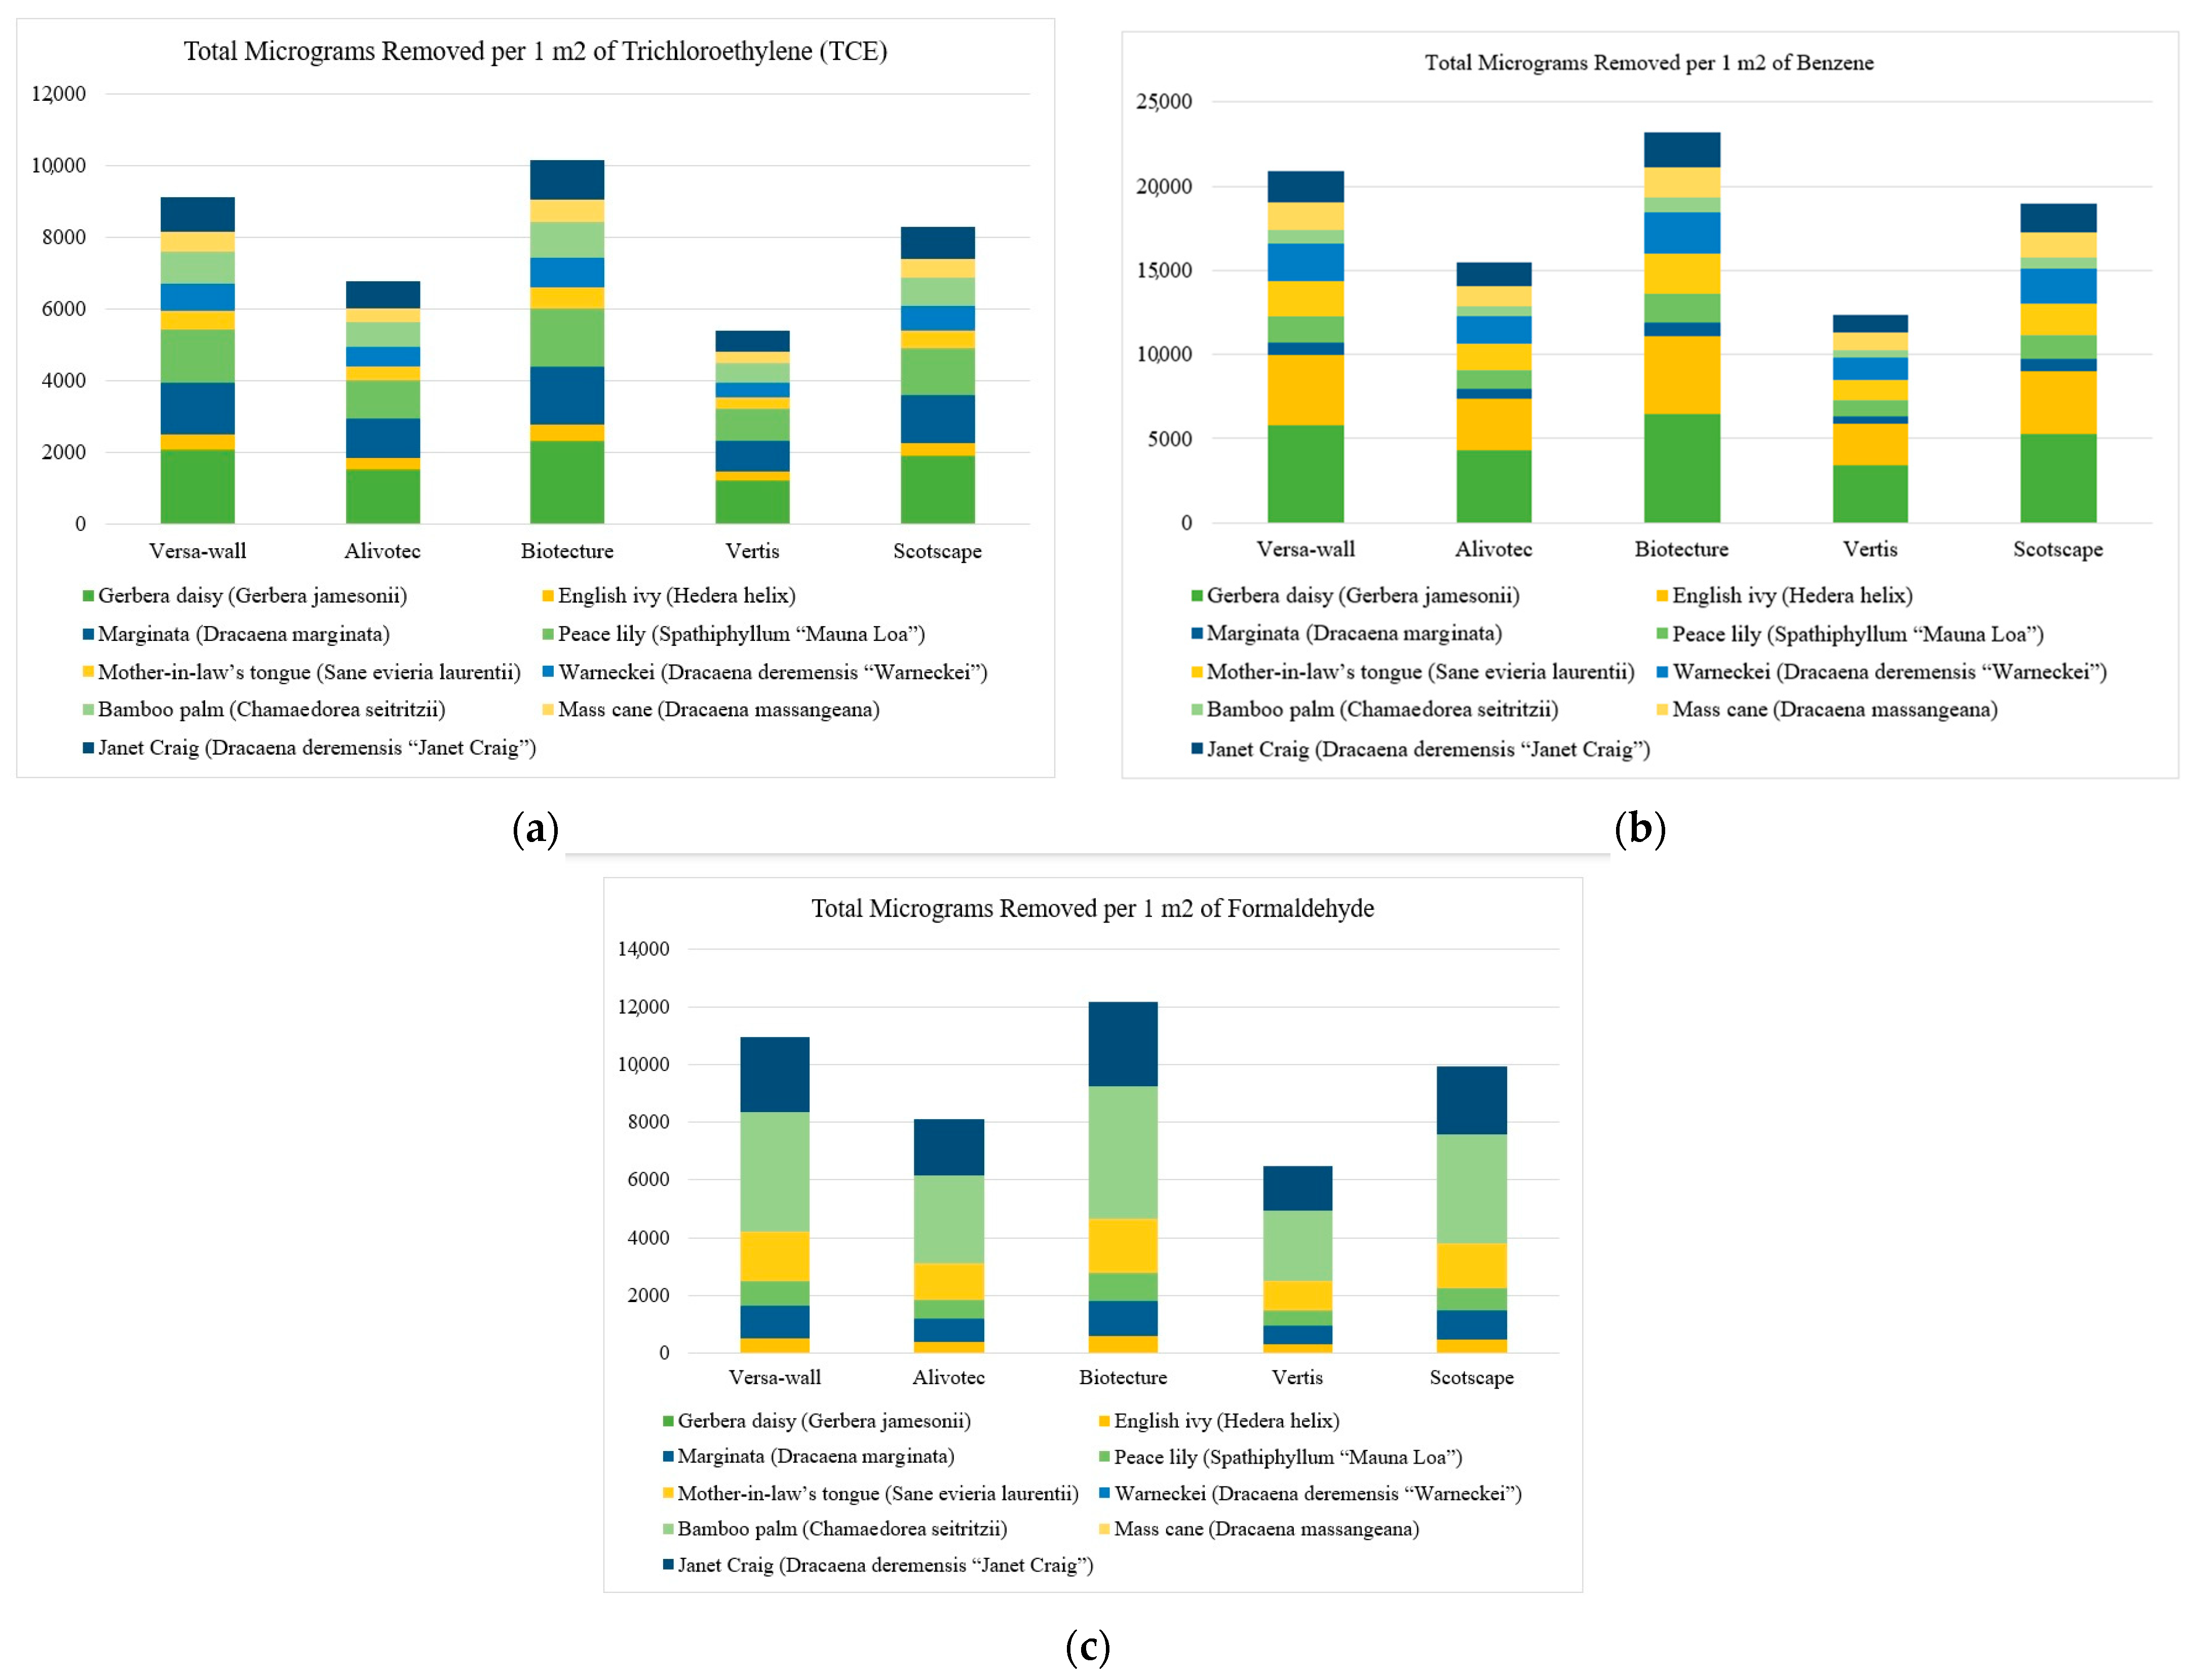
| Gerbera daisy | 2102.652 | 1557.52 | 2336.28 | 1246.016 | 1907.962 |
| Hedera | 386.694 | 286.44 | 429.66 | 229.152 | 350.889 |
| Dracaena | 1473.768 | 1091.68 | 1637.52 | 873.344 | 1337.308 |
| Spathiphyllum | 1461.456 | 1082.56 | 1623.84 | 866.048 | 1326.136 |
| Sane evieria | 525.258 | 389.08 | 583.62 | 311.264 | 476.623 |
| Warneckei | 743.04 | 550.4 | 825.6 | 440.32 | 674.24 |
| Bamboo | 892.08 | 660.8 | 991.2 | 528.64 | 809.48 |
| Cane | 545.454 | 404.04 | 606.06 | 323.232 | 494.949 |
| Janet Craig | 989.82 | 733.2 | 1099.8 | 586.56 | 898.17 |
| Benzene | |||||
| Versa-wall | Alivotec | Biotecture | Vertis | Scotscape | |
| Gerbera daisy | 5813.262 | 4306.12 | 6459.18 | 3444.896 | 5274.997 |
| Hedera | 4154.274 | 3077.24 | 4615.86 | 2461.792 | 3769.619 |
| Dracaena | 750.276 | 555.76 | 833.64 | 444.608 | 680.806 |
| Spathiphyllum | 1550.34 | 1148.4 | 1722.6 | 918.72 | 1406.79 |
| Sane evieria | 2111.778 | 1564.28 | 2346.42 | 1251.424 | 1916.243 |
| Warneckei | 2235.168 | 1655.68 | 2483.52 | 1324.544 | 2028.208 |
| Bamboo | 783 | 580 | 870 | 464 | 710.5 |
| Cane | 1637.496 | 1212.96 | 1819.44 | 970.368 | 1485.876 |
| Janet Craig | 1839.942 | 1362.92 | 2044.38 | 1090.336 | 1669.577 |
| Formaldehyde | |||||
| Versa-wall | Alivotec | Biotecture | Vertis | Scotscape | |
| Gerbera daisy | - | - | - | - | - |
| Hedera | 521.262 | 386.12 | 579.18 | 308.896 | 472.997 |
| Dracaena | 1105.326 | 818.76 | 1228.14 | 655.008 | 1002.981 |
| Spathiphyllum | 873.018 | 646.68 | 970.02 | 517.344 | 792.183 |
| Sane evieria | 1689.876 | 1251.76 | 1877.64 | 1001.408 | 1533.406 |
| Warneckei | - | - | - | - | - |
| Bamboo | 4142.178 | 3068.28 | 4602.42 | 2454.624 | 3758.643 |
| Cane | - | - | - | - | - |
| Janet Craig | 2639.52 | 1955.2 | 2932.8 | 1564.16 | 2395.12 |
| Matrix of Reduction | Trichloroethylene (TCE) | Benzene | Formaldehyde | Sum of Reduced Pollutants |
|---|---|---|---|---|
| 1 VW | 2102.652 | 5813.26 | 0 | 7915.91 |
| 2 VW | 892.08 | 783 | 4142.178 | 5817.26 |
| 3 VW | 1461.456 | 1550.34 | 873.018 | 3884.81 |
| 1 A | 1557.52 | 4306.12 | 0 | 5863.64 |
| 2 A | 660.8 | 580 | 3068.28 | 4309.08 |
| 3 A | 1082.56 | 1148.4 | 646.68 | 2877.64 |
| 1 B | 2336.28 | 6459.18 | 0 | 8795.46 |
| 2 B | 991.2 | 870 | 4602.42 | 6463.62 |
| 3 B | 1623.84 | 1722.6 | 970.02 | 4316.46 |
| 1 V | 1246.016 | 3444.9 | 0 | 4690.91 |
| 2 V | 528.64 | 464 | 2454.624 | 3447.26 |
| 3 V | 866.048 | 918.72 | 517.344 | 2302.11 |
| 1 S | 1907.962 | 5275 | 0 | 7182.96 |
| 2 S | 809.48 | 710.5 | 3758.643 | 5278.62 |
| 3 S | 1326.136 | 1406.79 | 792.183 | 3525.11 |
| Max reduction | 2336.28 | 6459.18 | 4602.42 |
| Trichloroethylene (TCE) | Benzene | Formaldehyde | |
|---|---|---|---|
| Average daily MPC, mg/m3 | 1 | 0.1 | 0.01 |
| Room volume, m3 | 26.1 | 26.1 | 26.1 |
| Average daily MPC in a room | 26.1 | 2.61 | 0.261 |
| The actual concentration of pollutants | 28.71 | 3.132 | 0.29232 |
| Excess of MPC, % | 10 | 20 | 12 |
| № | System and Plant/Pollutant | Trichloroethylene (TCE) | Benzene | Formaldehyde | Sum of Reduced Pollutants |
|---|---|---|---|---|---|
| 1 | Biotecture (gerbera daisy) | 2336.28 | 6459.18 | 0 | 8795.46 |
| 2 | Versa-wall (gerbera daisy) | 2102.652 | 5813.262 | 0 | 7915.914 |
| 3 | Scotscape (gerbera daisy) | 1907.962 | 5274.99 | 0 | 7182.952 |
| 4 | Versa wall (bamboo palm) | 892.08 | 783 | 4142.178 | 5817.258 |
| Sum of reduction (of each pollutant) | 7238.974 | 18,330.432 | 4142.178 |
| mg/m3 | ||||
|---|---|---|---|---|
| Name of Pollutant | Benzene | Trichloroethylene (TCE) | Formaldehyde | |
| Average daily MPC in a room | 2.61 | 26.1 | 0.261 | |
| The actual concentration of pollutants / reduced | 3.132 | 28.71 | 0.29232 | |
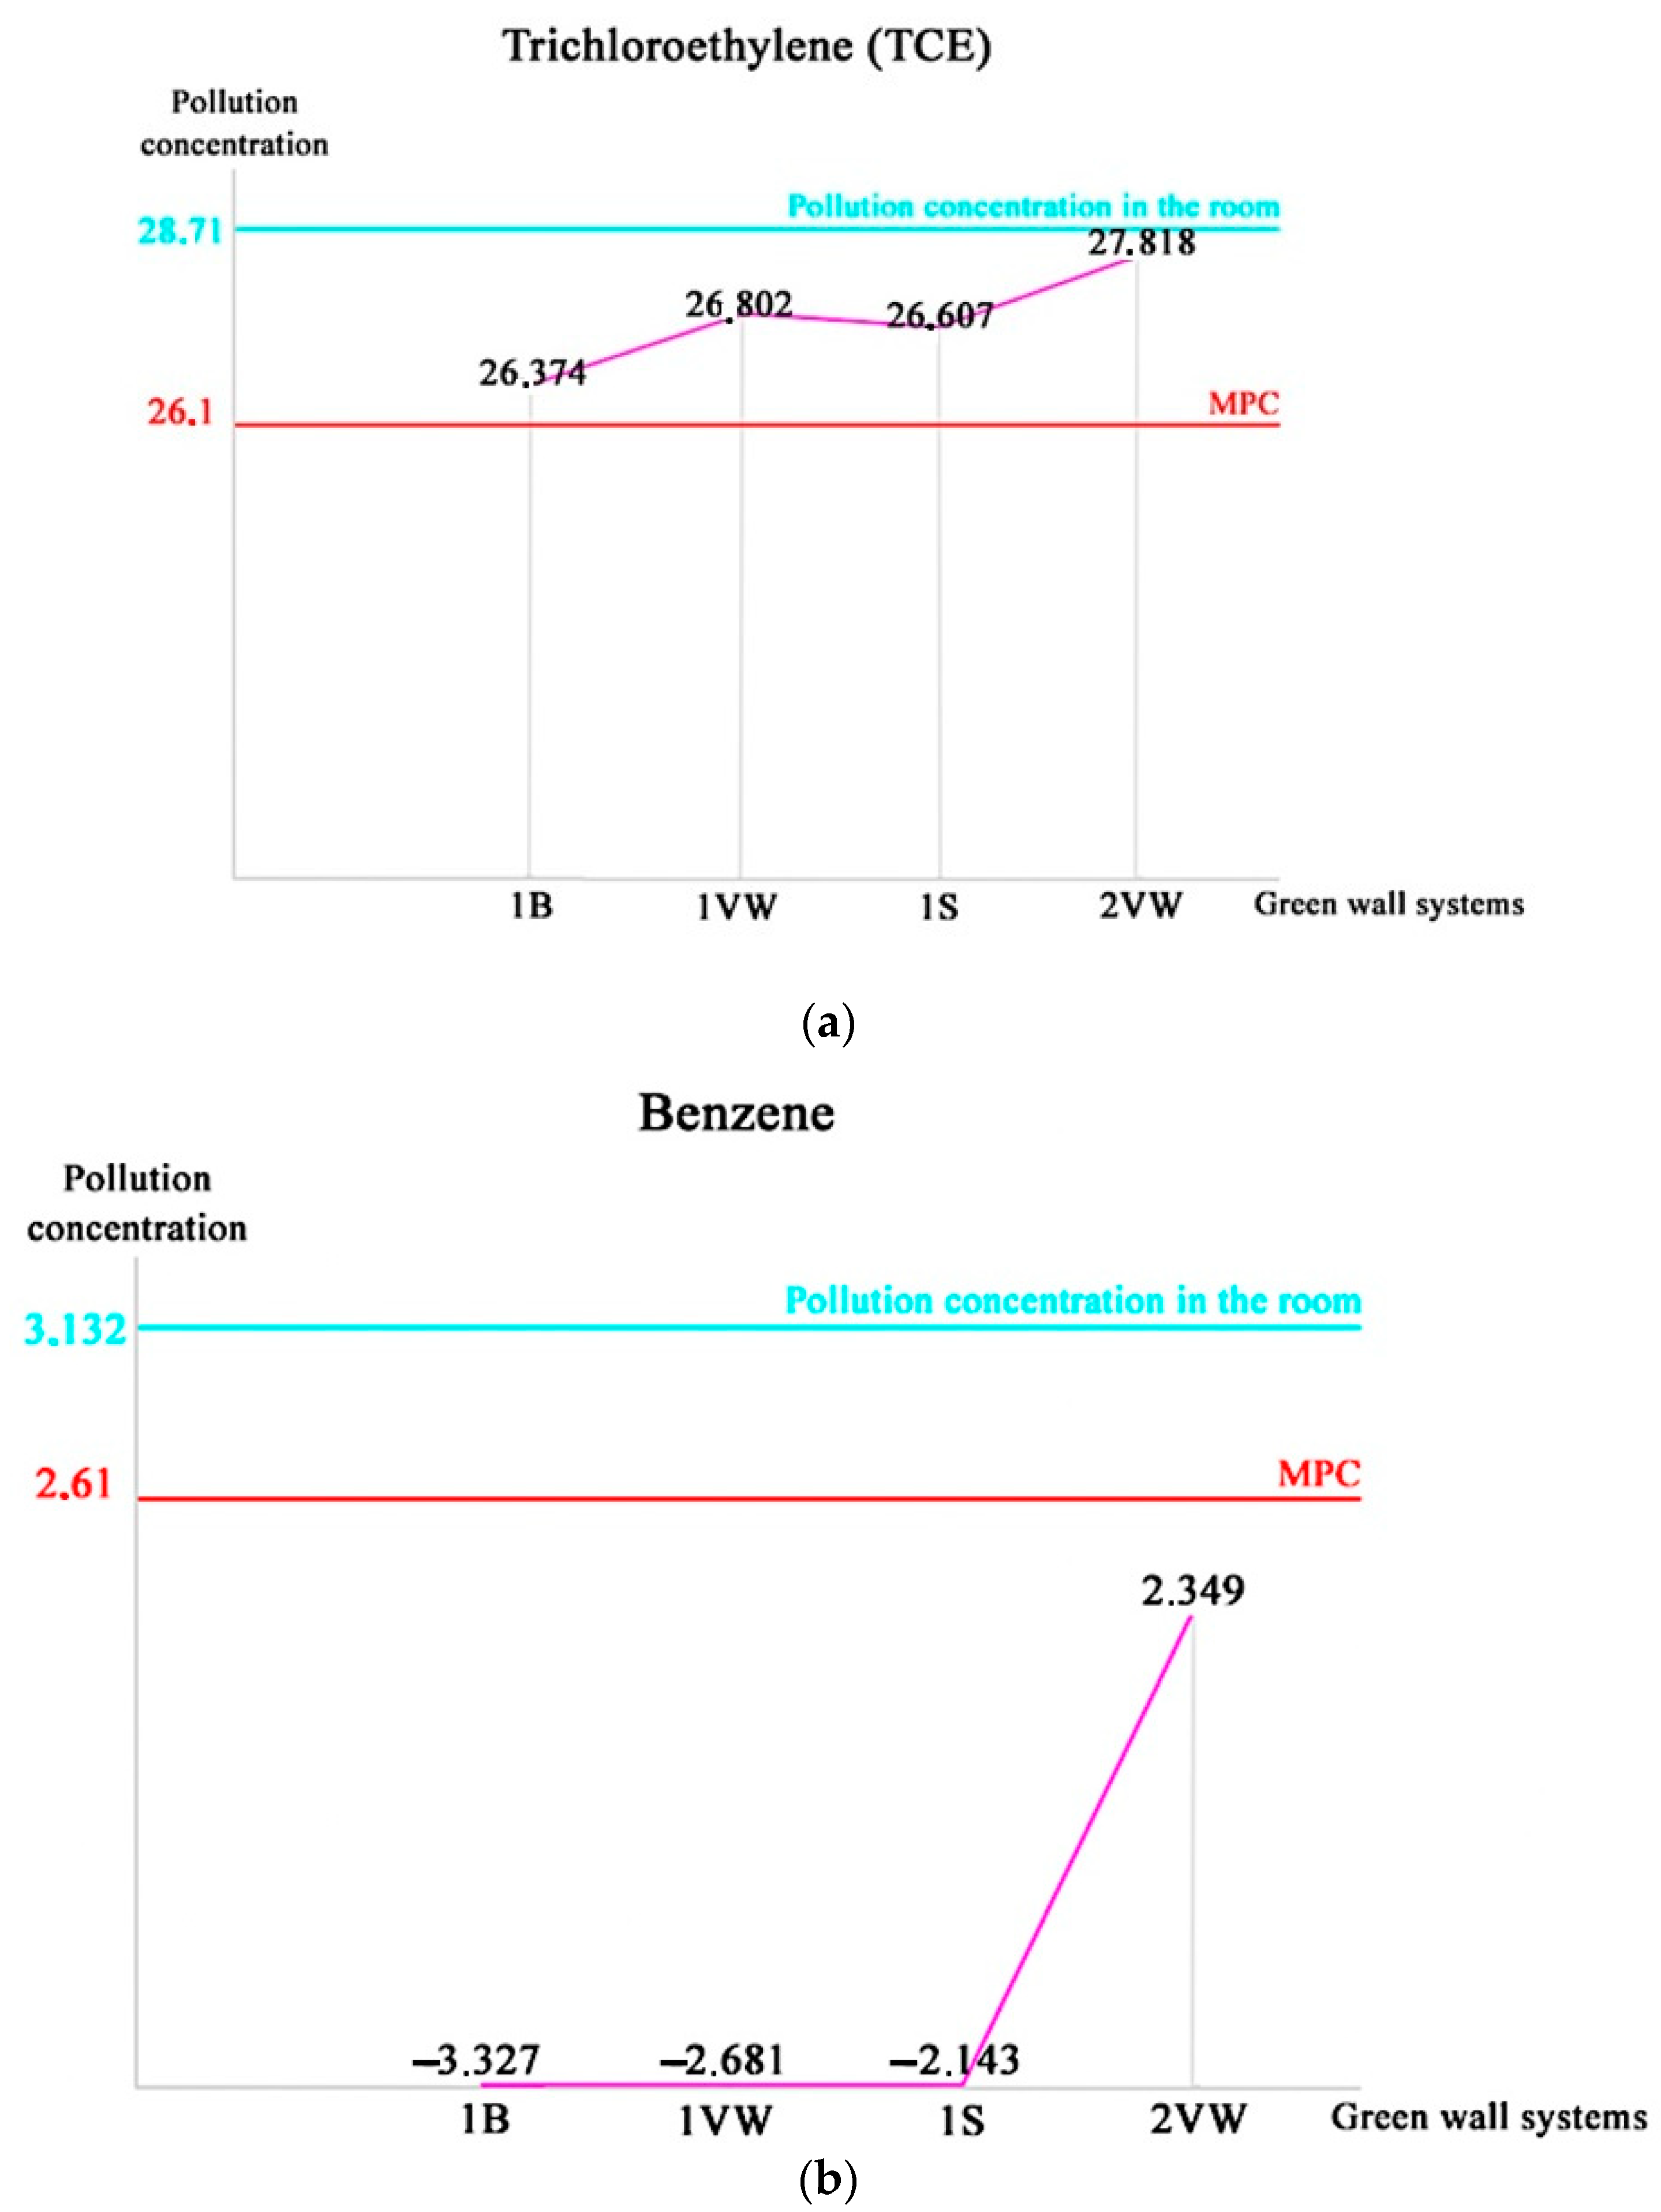
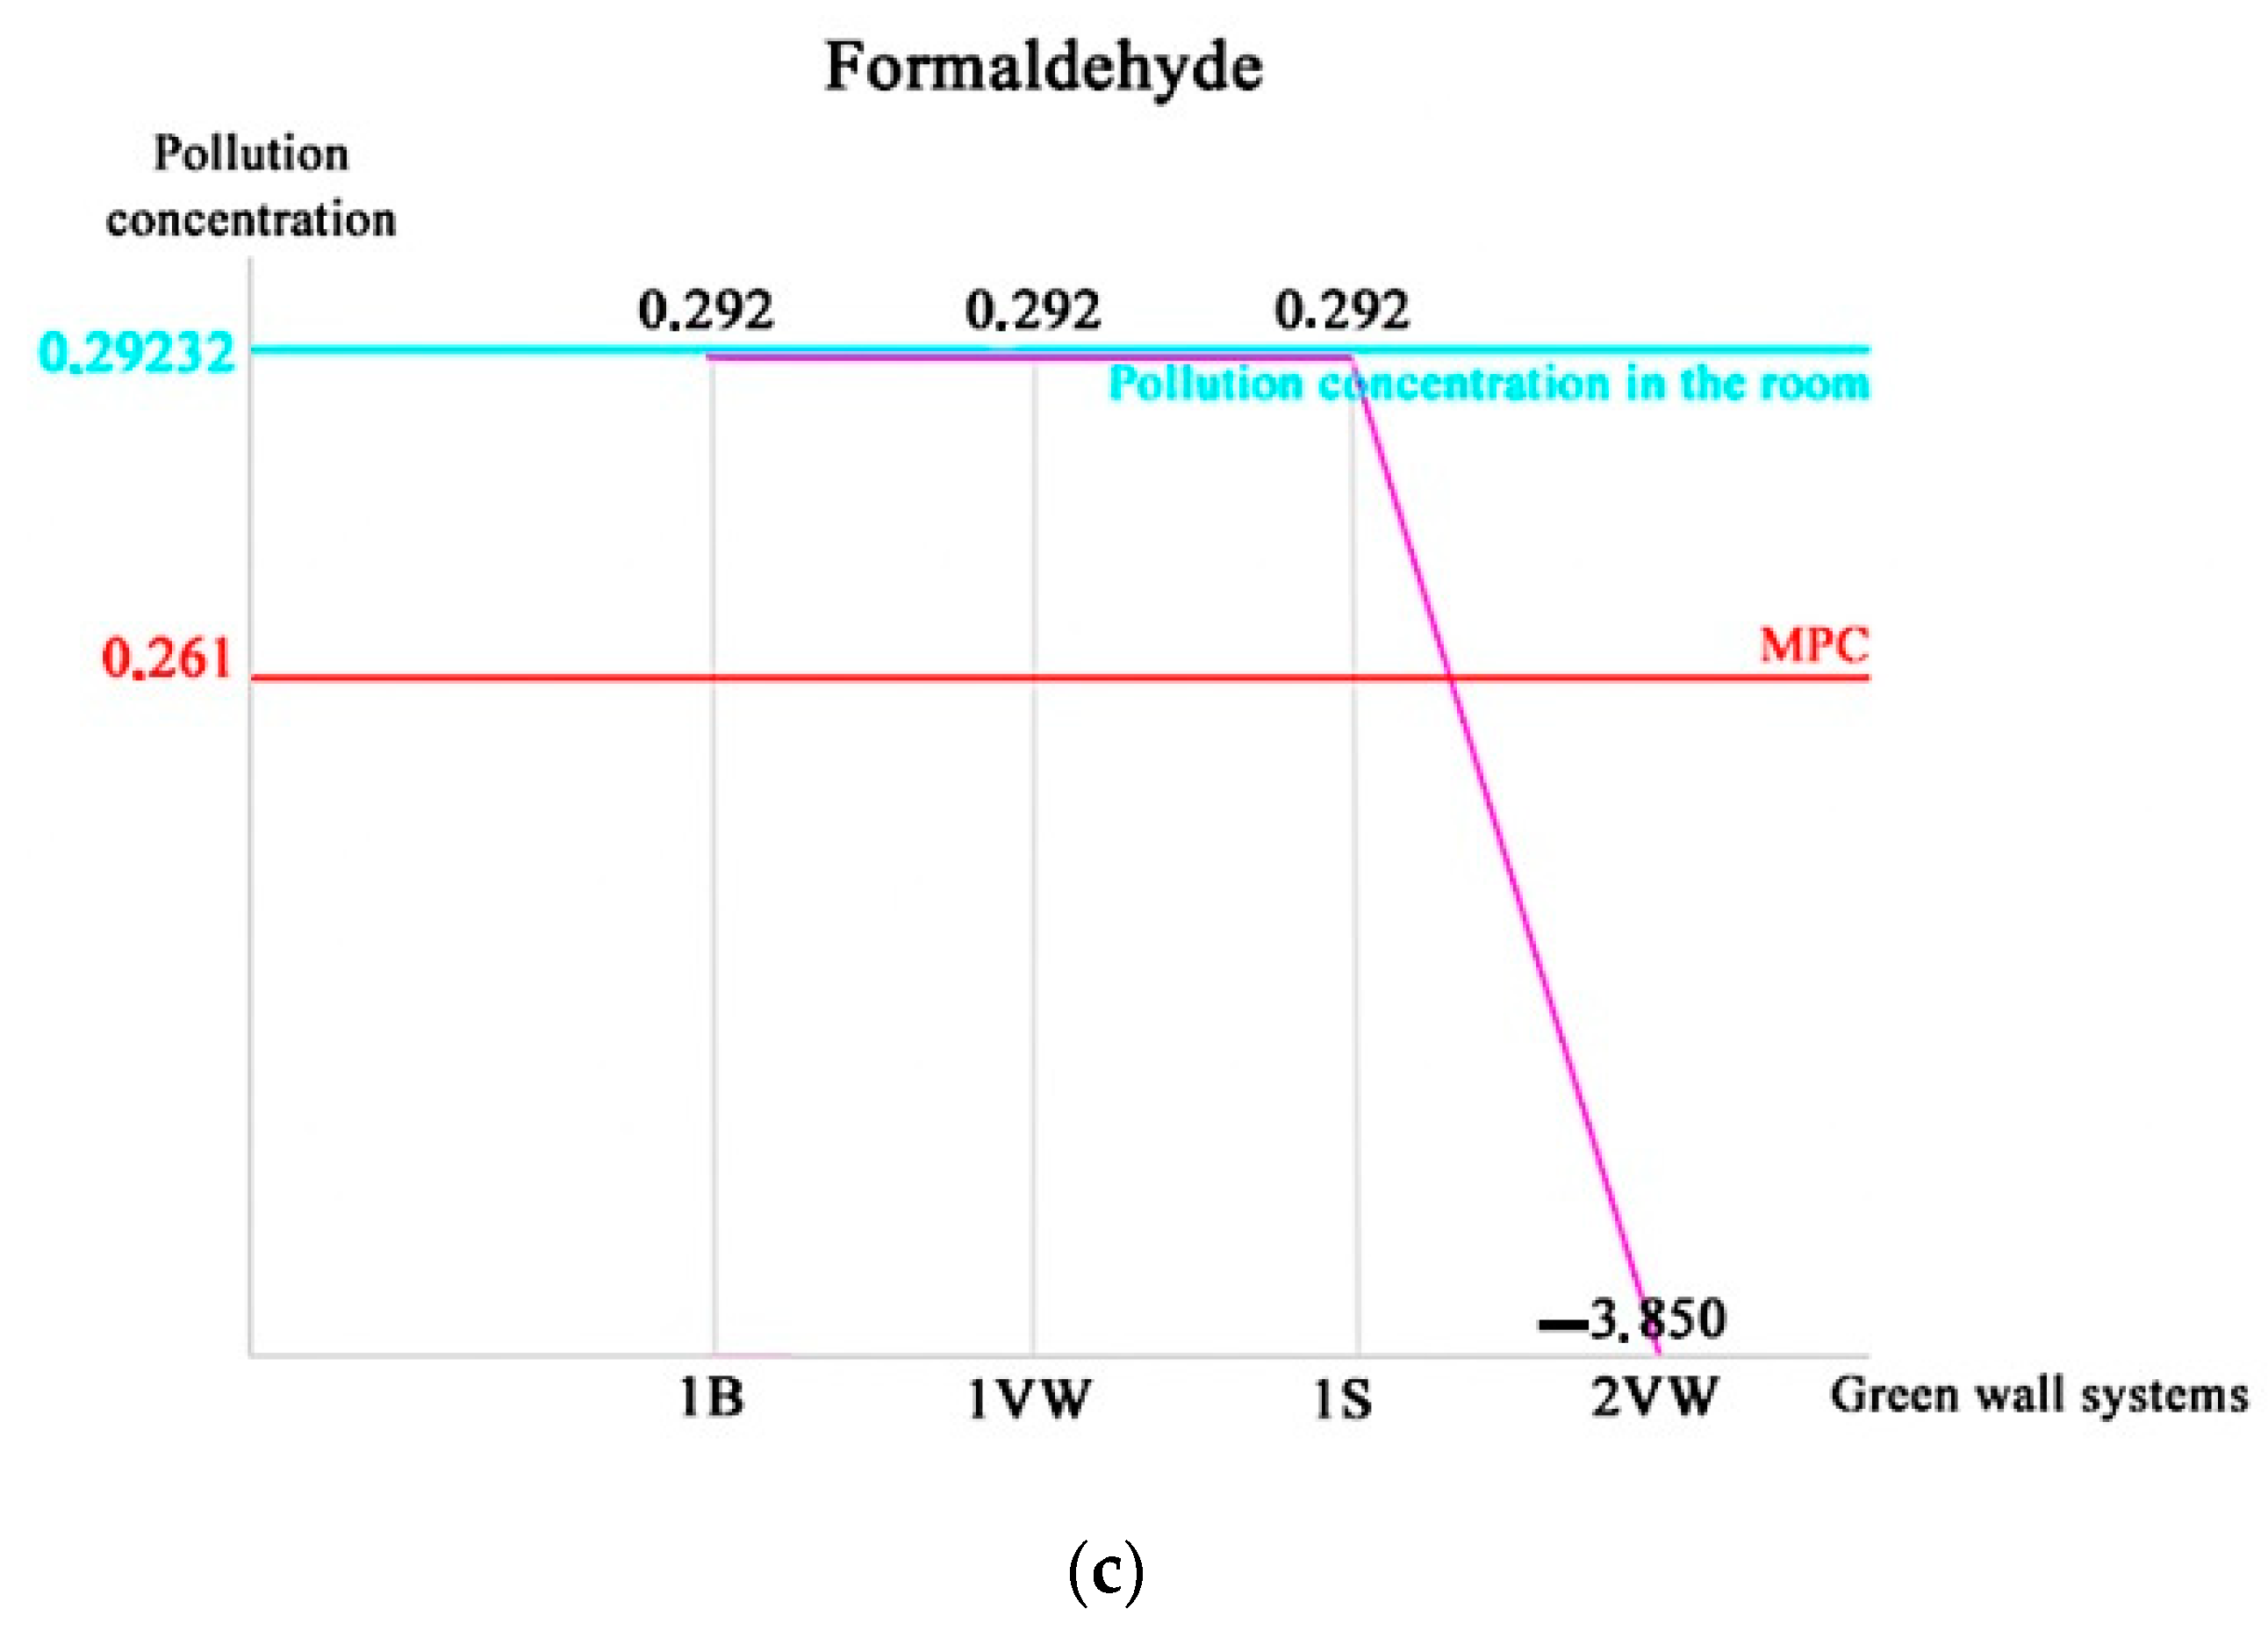
| 1 | Biotecture (gerbera daisy) | −3.327 | 26.374 | 0.292 |
| 2 | Versa-wall (gerbera daisy) | −2.681 | 26.607 | 0.292 |
| 3 | Scotscape (gerbera daisy) | −2.143 | 26.802 | 0.292 |
| 4 | Versa wall (bamboo palm) | 2.349 | 27.818 | −3.850 |
| № of Combination | System and Plant/Pollutant | Trichloroethylene (TCE) | Benzene | Formaldehyde | Sum of Reduced Pollutants |
|---|---|---|---|---|---|
| 1 | Versa-wall (gerbera daisy) | 1051.326 | 2906.631 | 0 | 3957.957 |
| Versa-wall (bamboo palm) | 446.04 | 391.5 | 2071.089 | 2908.629 | |
| Sum of reduction (of each pollutant) | 1497.366 | 3298.131 | 2071.089 | ||
| 2 | Biotecture (gerbera daisy) | 1168.14 | 3229.59 | 0 | 4397.73 |
| Biotecture (bamboo palm) | 495.6 | 435 | 2301.21 | 3231.81 | |
| Sum of reduction (of each pollutant) | 1663.74 | 3664.59 | 2301.21 | ||
| 3 | Scotscape (gerbera daisy) | 953.981 | 2637.4985 | 0 | 3591.4795 |
| Scotscape (bamboo palm) | 404.74 | 355.25 | 1879.3215 | 2639.3115 | |
| Sum of reduction (of each pollutant) | 1358.721 | 2992.7485 | 1879.3215 |
| mg/m3 | ||||
|---|---|---|---|---|
| Name of Pollutant | Benzene | Trichloroethylene (TCE) | Formaldehyde | |
| Average daily MPC in a room | 2.61 | 26.1 | 0.261 | |
| The actual concentration of pollutants/reduced | 3.0015 | 28.71 | 0.29232 | |
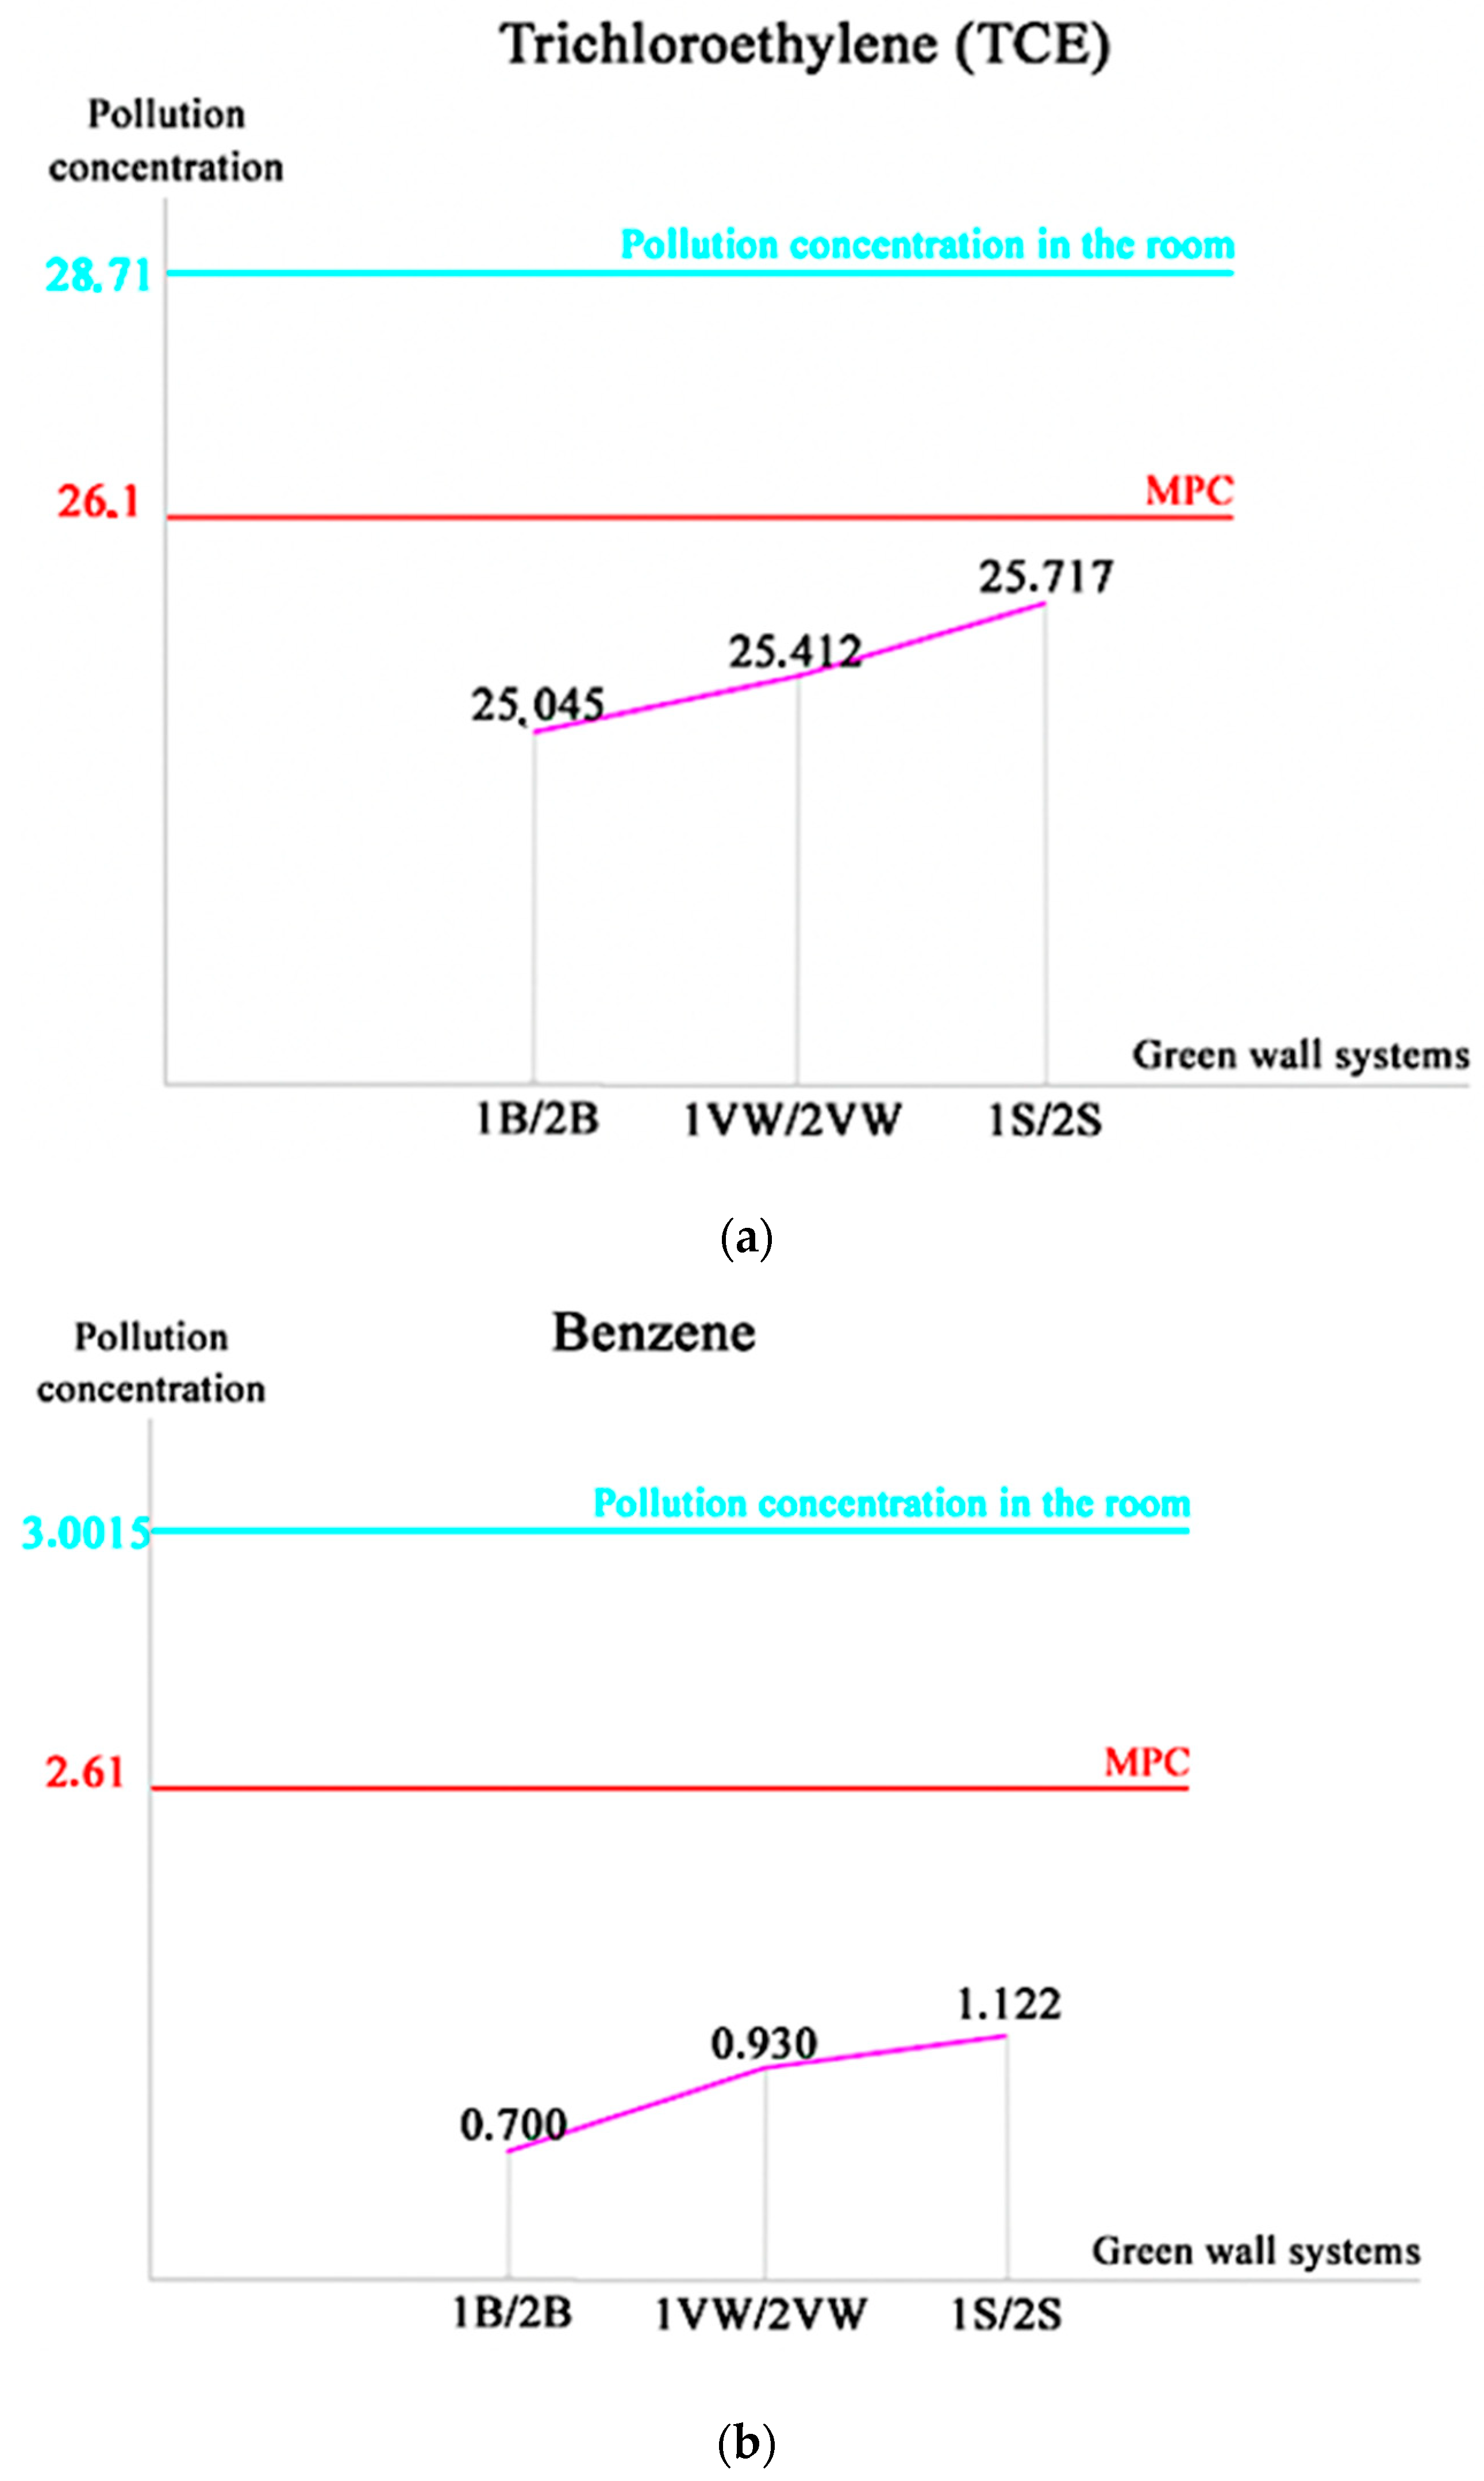
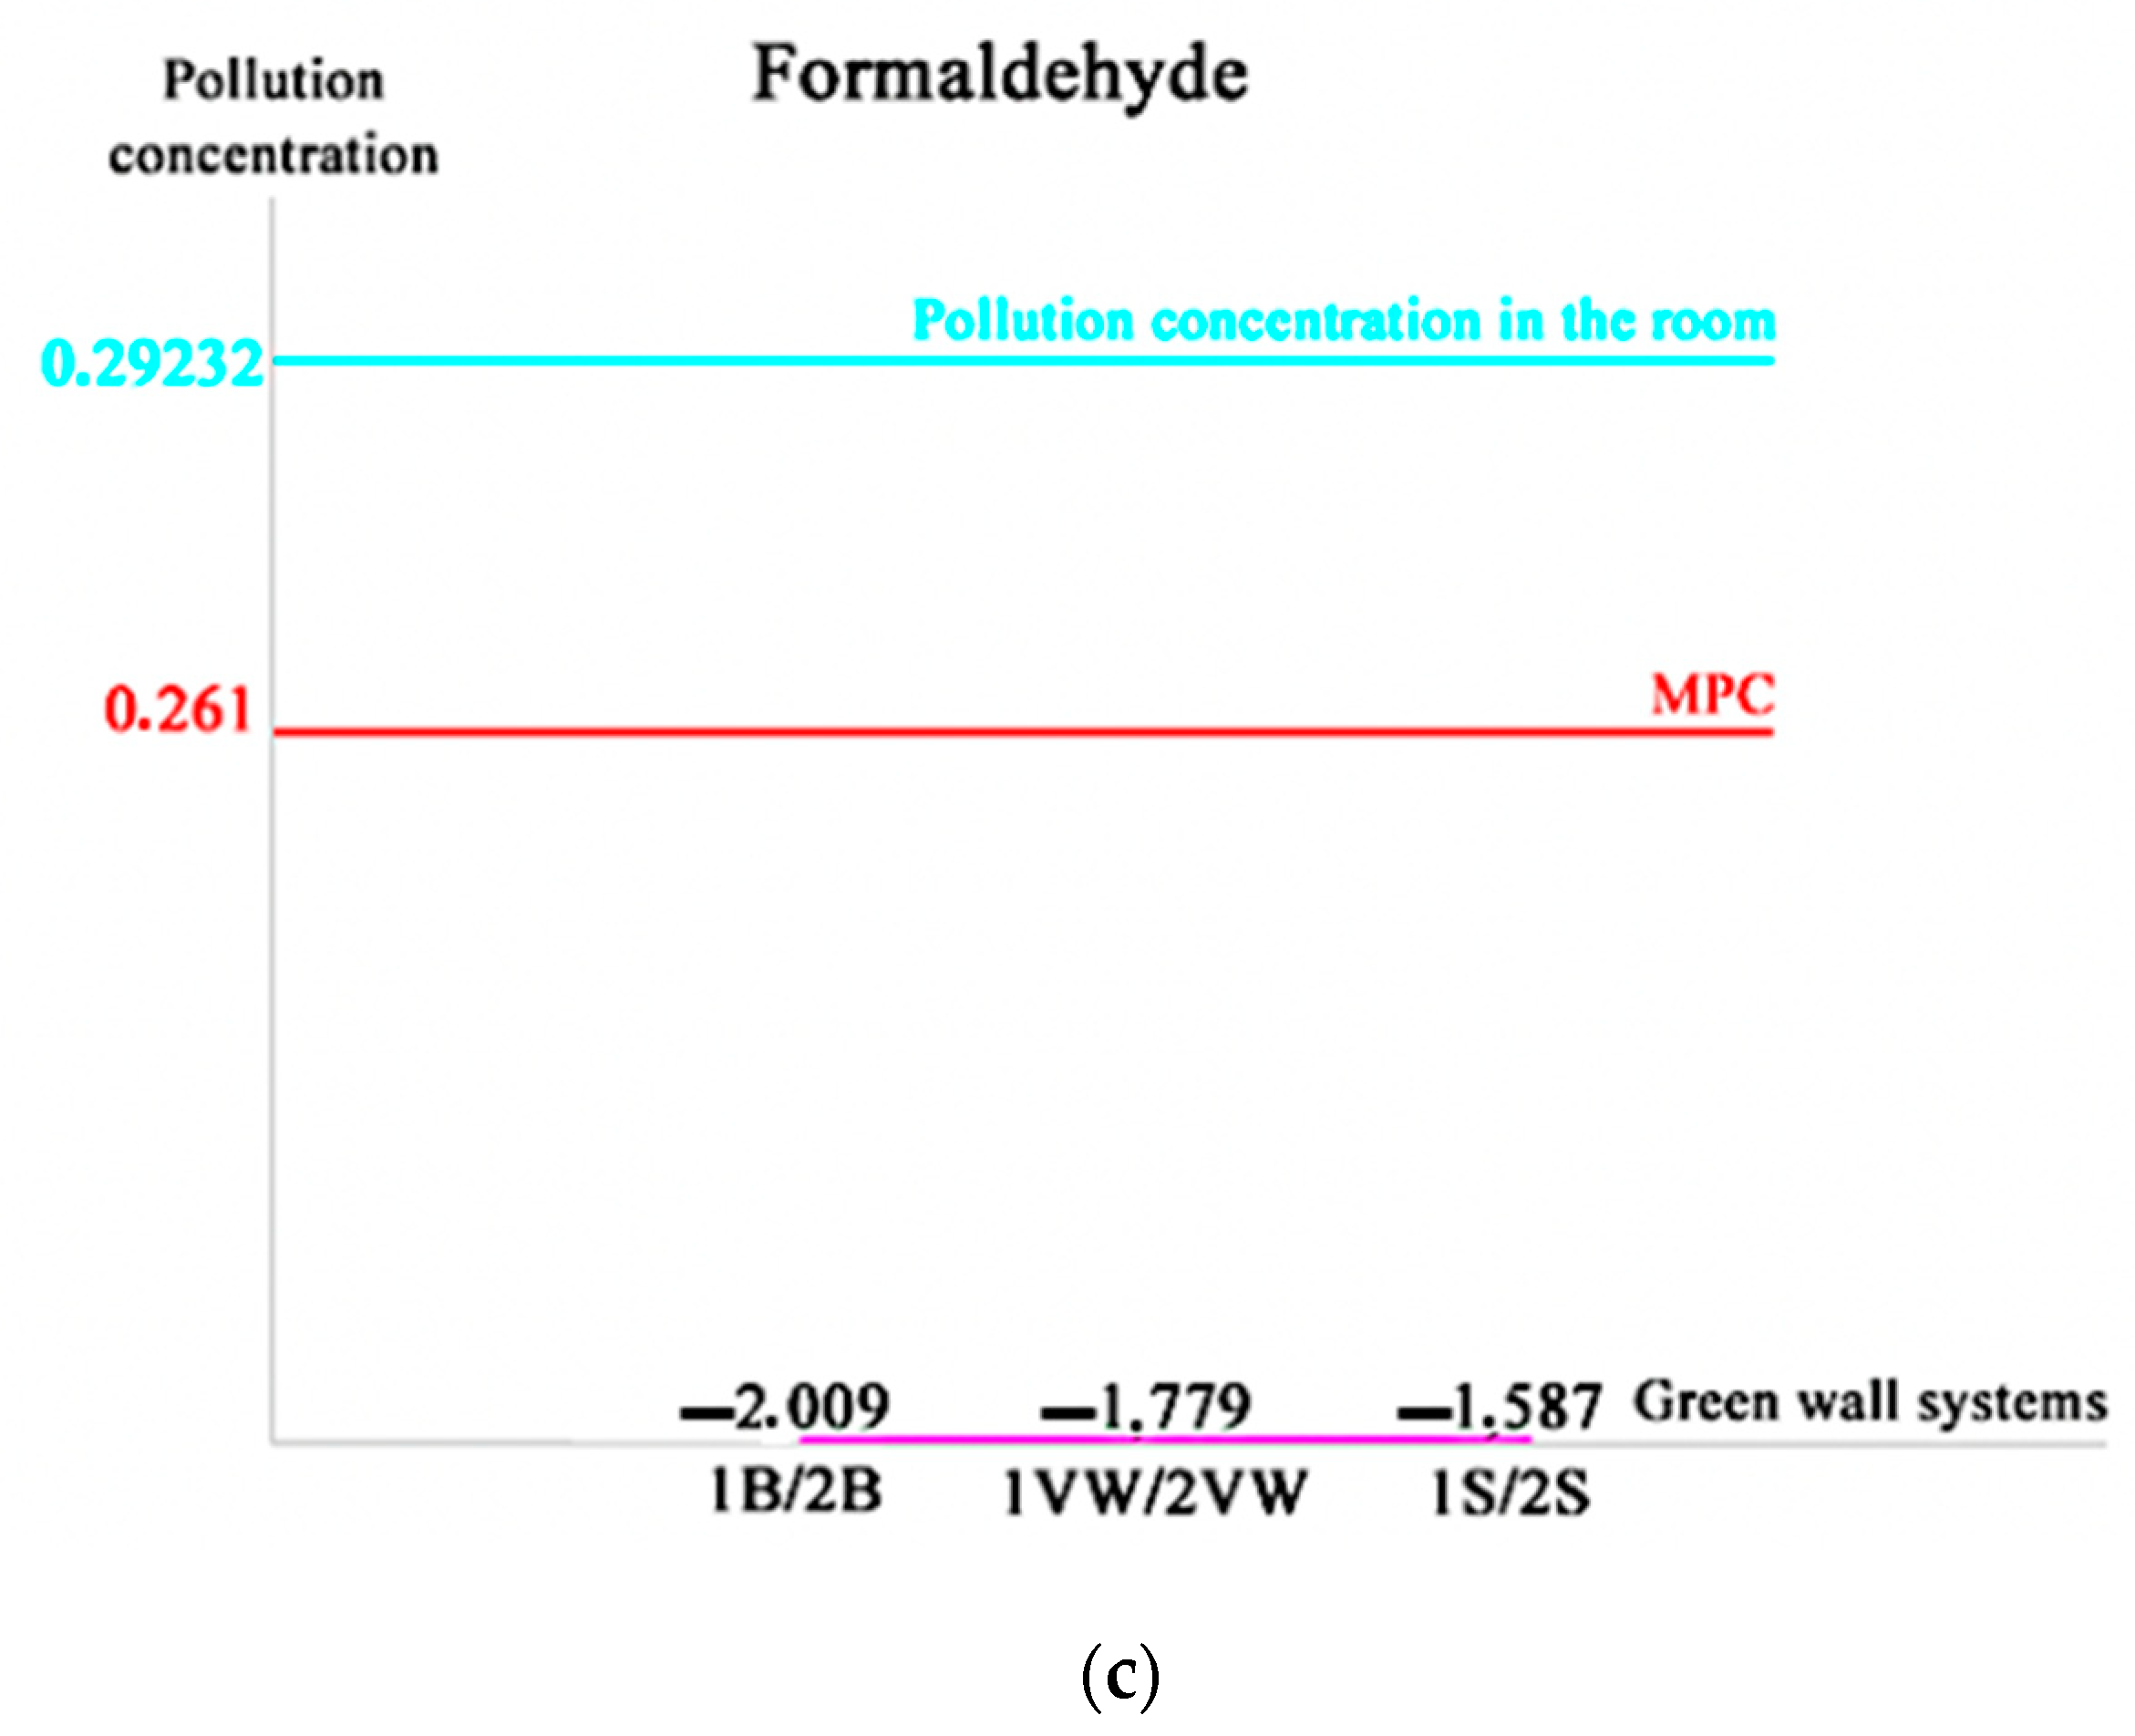
| 1 | Versa-wall | 0.930 | 25.412 | −1.779 |
| 2 | Biotecture | 0.700 | 25.045 | −2.009 |
| 3 | Scotscape | 1.122 | 25.717 | −1.587 |
Disclaimer/Publisher’s Note: The statements, opinions and data contained in all publications are solely those of the individual author(s) and contributor(s) and not of MDPI and/or the editor(s). MDPI and/or the editor(s) disclaim responsibility for any injury to people or property resulting from any ideas, methods, instructions or products referred to in the content. |
© 2023 by the authors. Licensee MDPI, Basel, Switzerland. This article is an open access article distributed under the terms and conditions of the Creative Commons Attribution (CC BY) license (https://creativecommons.org/licenses/by/4.0/).
Share and Cite
Shushunova, N.; Korol, E.; Luzay, E.; Shafieva, D. Impact of the Innovative Green Wall Modular Systems on the Urban Air. Sustainability 2023, 15, 9732. https://doi.org/10.3390/su15129732
Shushunova N, Korol E, Luzay E, Shafieva D. Impact of the Innovative Green Wall Modular Systems on the Urban Air. Sustainability. 2023; 15(12):9732. https://doi.org/10.3390/su15129732
Chicago/Turabian StyleShushunova, Natalia, Elena Korol, Elisaveta Luzay, and Diana Shafieva. 2023. "Impact of the Innovative Green Wall Modular Systems on the Urban Air" Sustainability 15, no. 12: 9732. https://doi.org/10.3390/su15129732
APA StyleShushunova, N., Korol, E., Luzay, E., & Shafieva, D. (2023). Impact of the Innovative Green Wall Modular Systems on the Urban Air. Sustainability, 15(12), 9732. https://doi.org/10.3390/su15129732


