
Evaluating Methods That Calculate Aircraft Emission Impacts on Air Quality: A Systematic Literature Review


Abstract
:1. Introduction
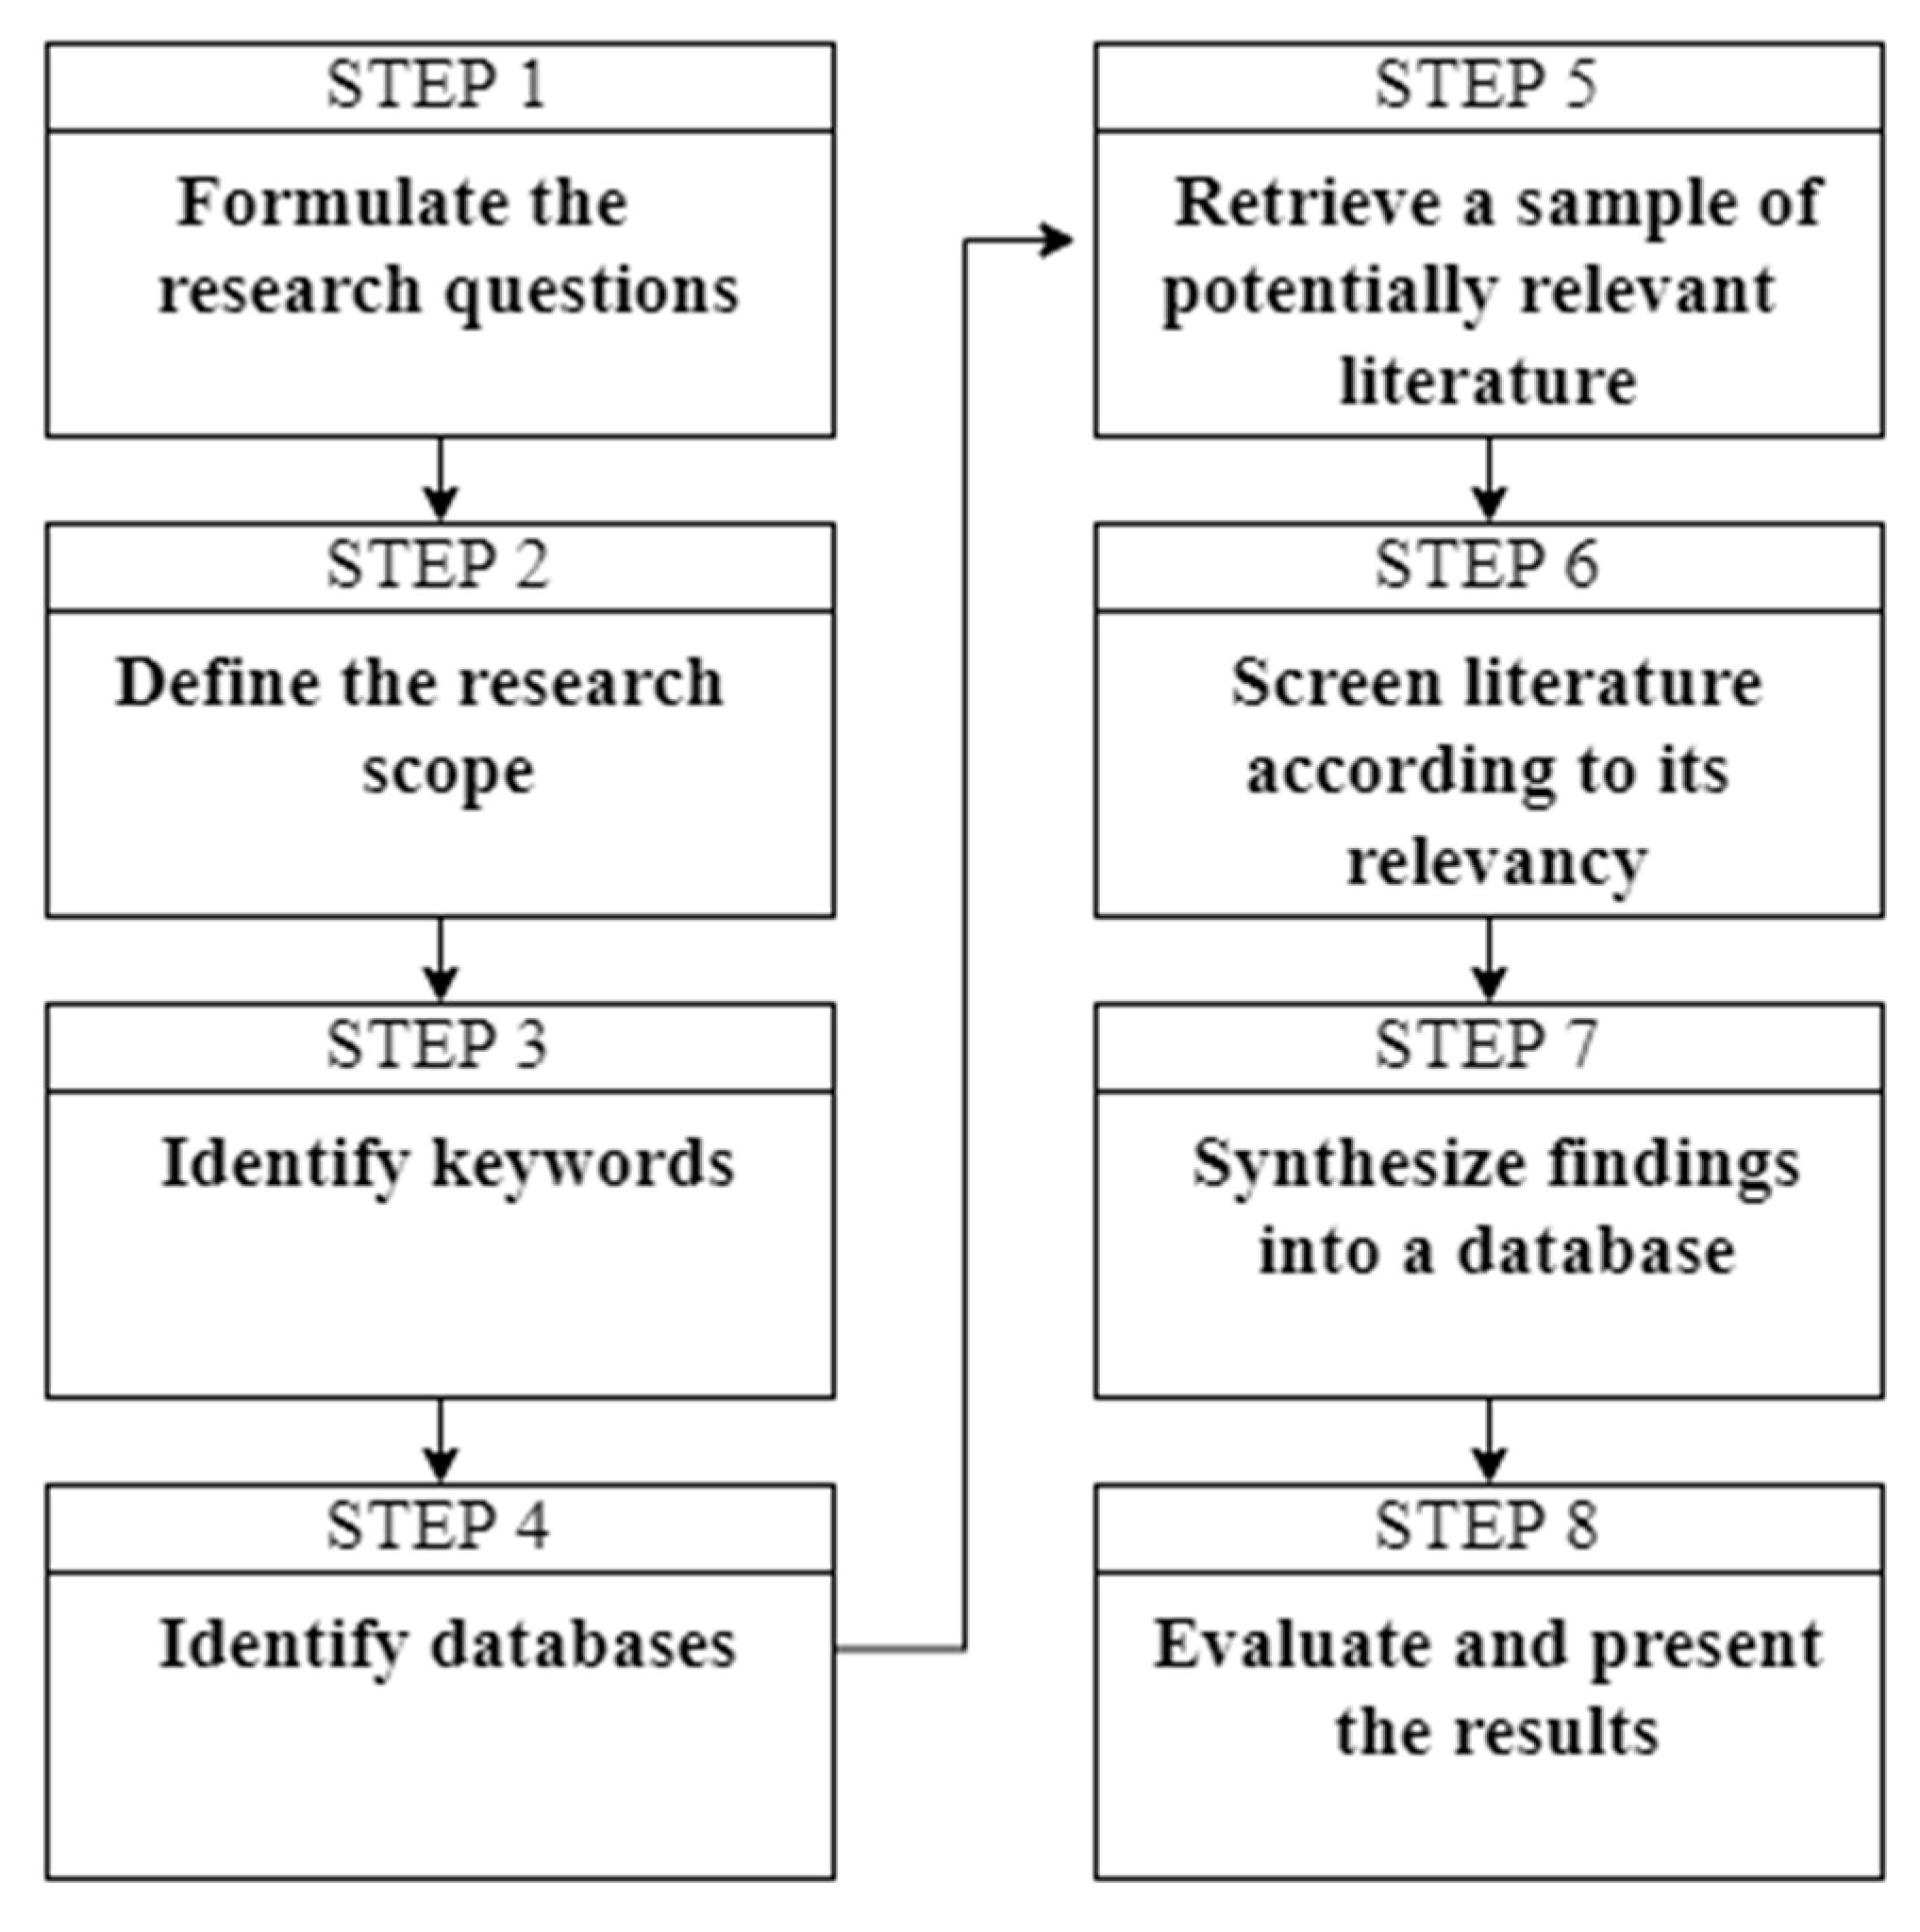
2. Methods
2.1. Formulate the Research Questions and Scope
2.2. Identify Keywords and Databases
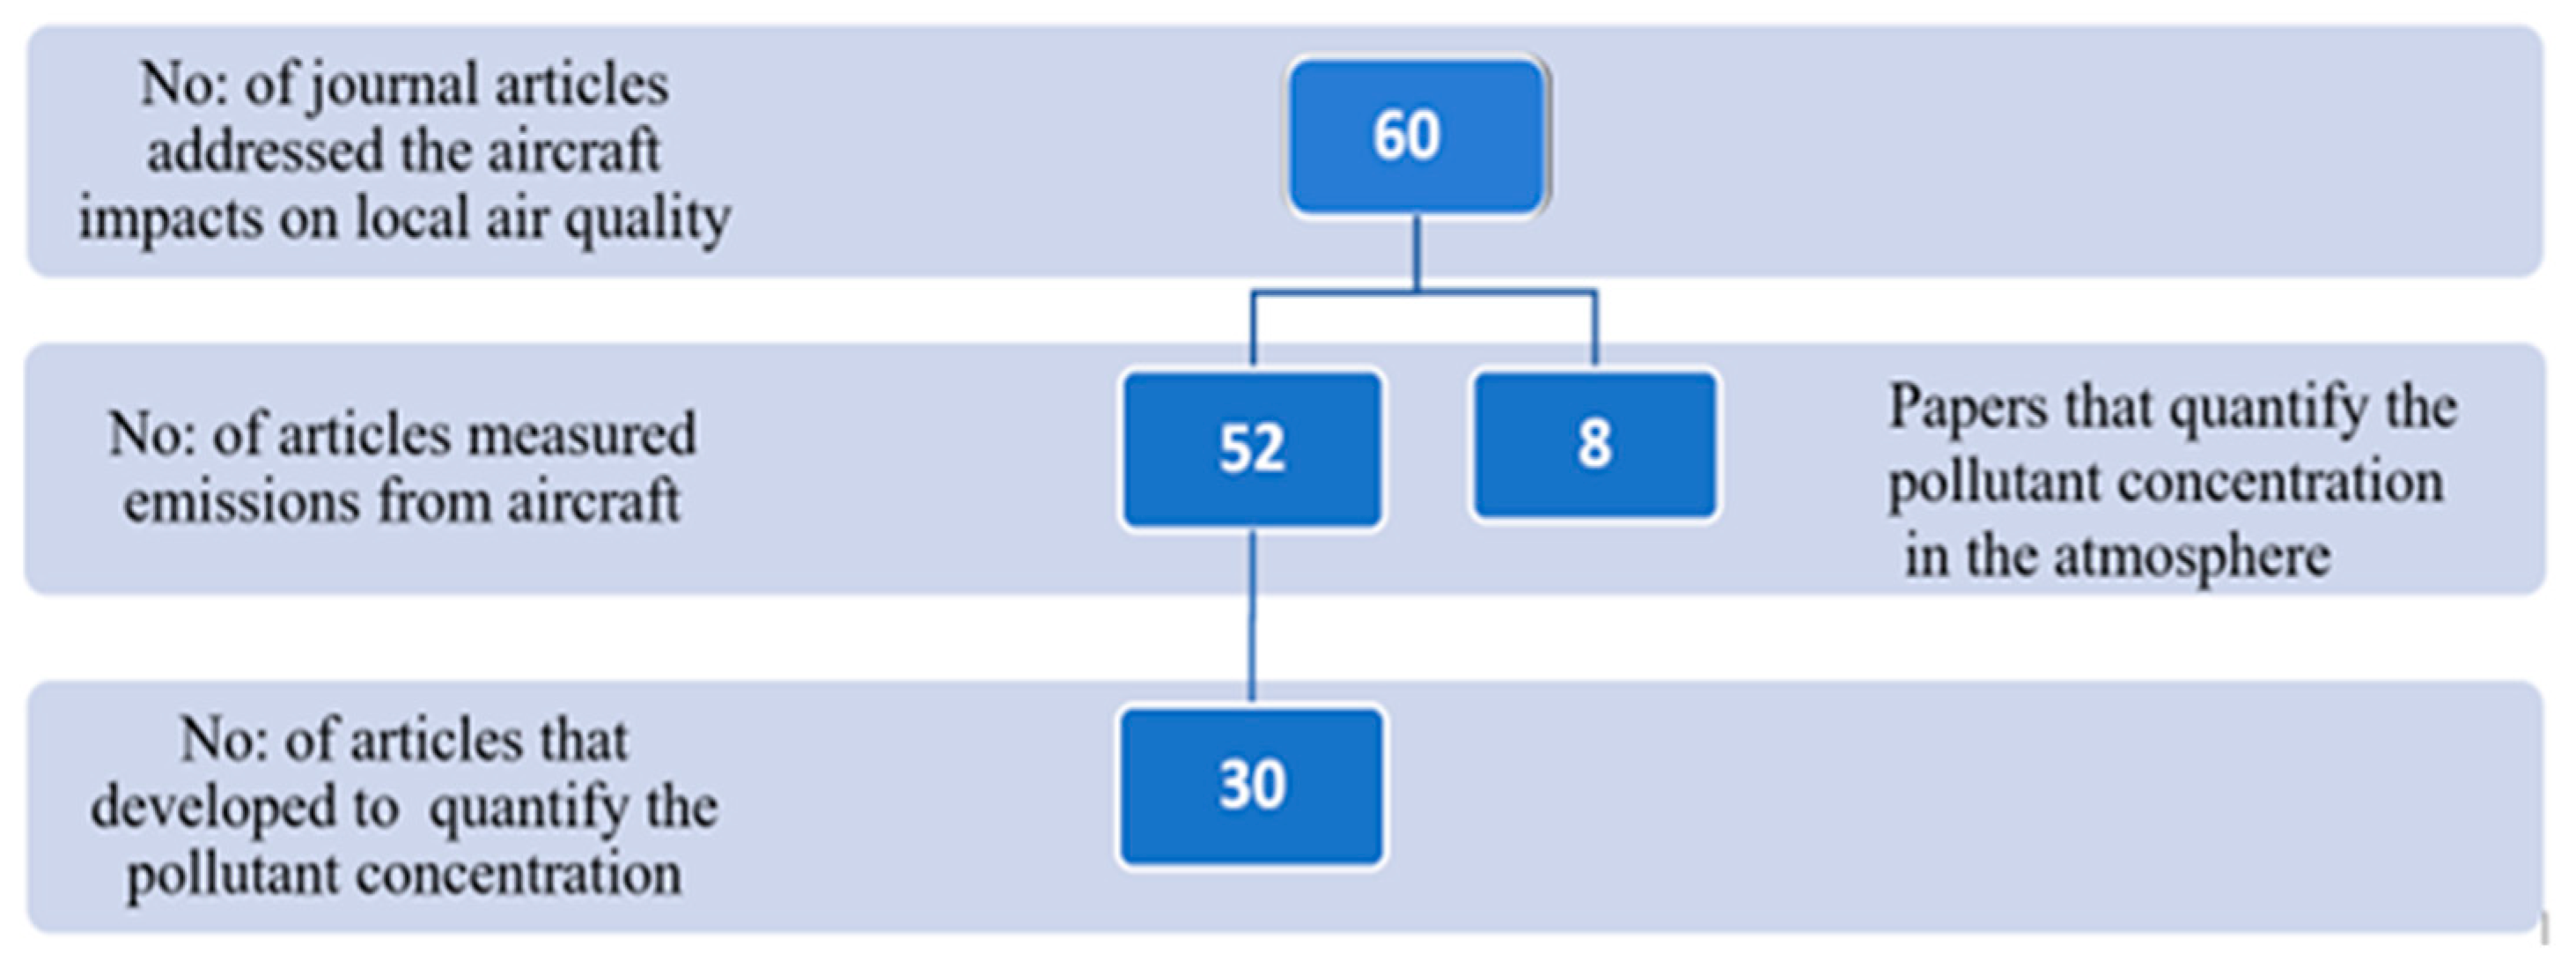
2.3. Retrieve Potential Literature and Screen
2.4. Synthesize Findings
3. Results and Discussion
3.1. Descriptive Analysis of Findings
3.2. Local, Regional, and Global Aircraft Operation and Air Quality
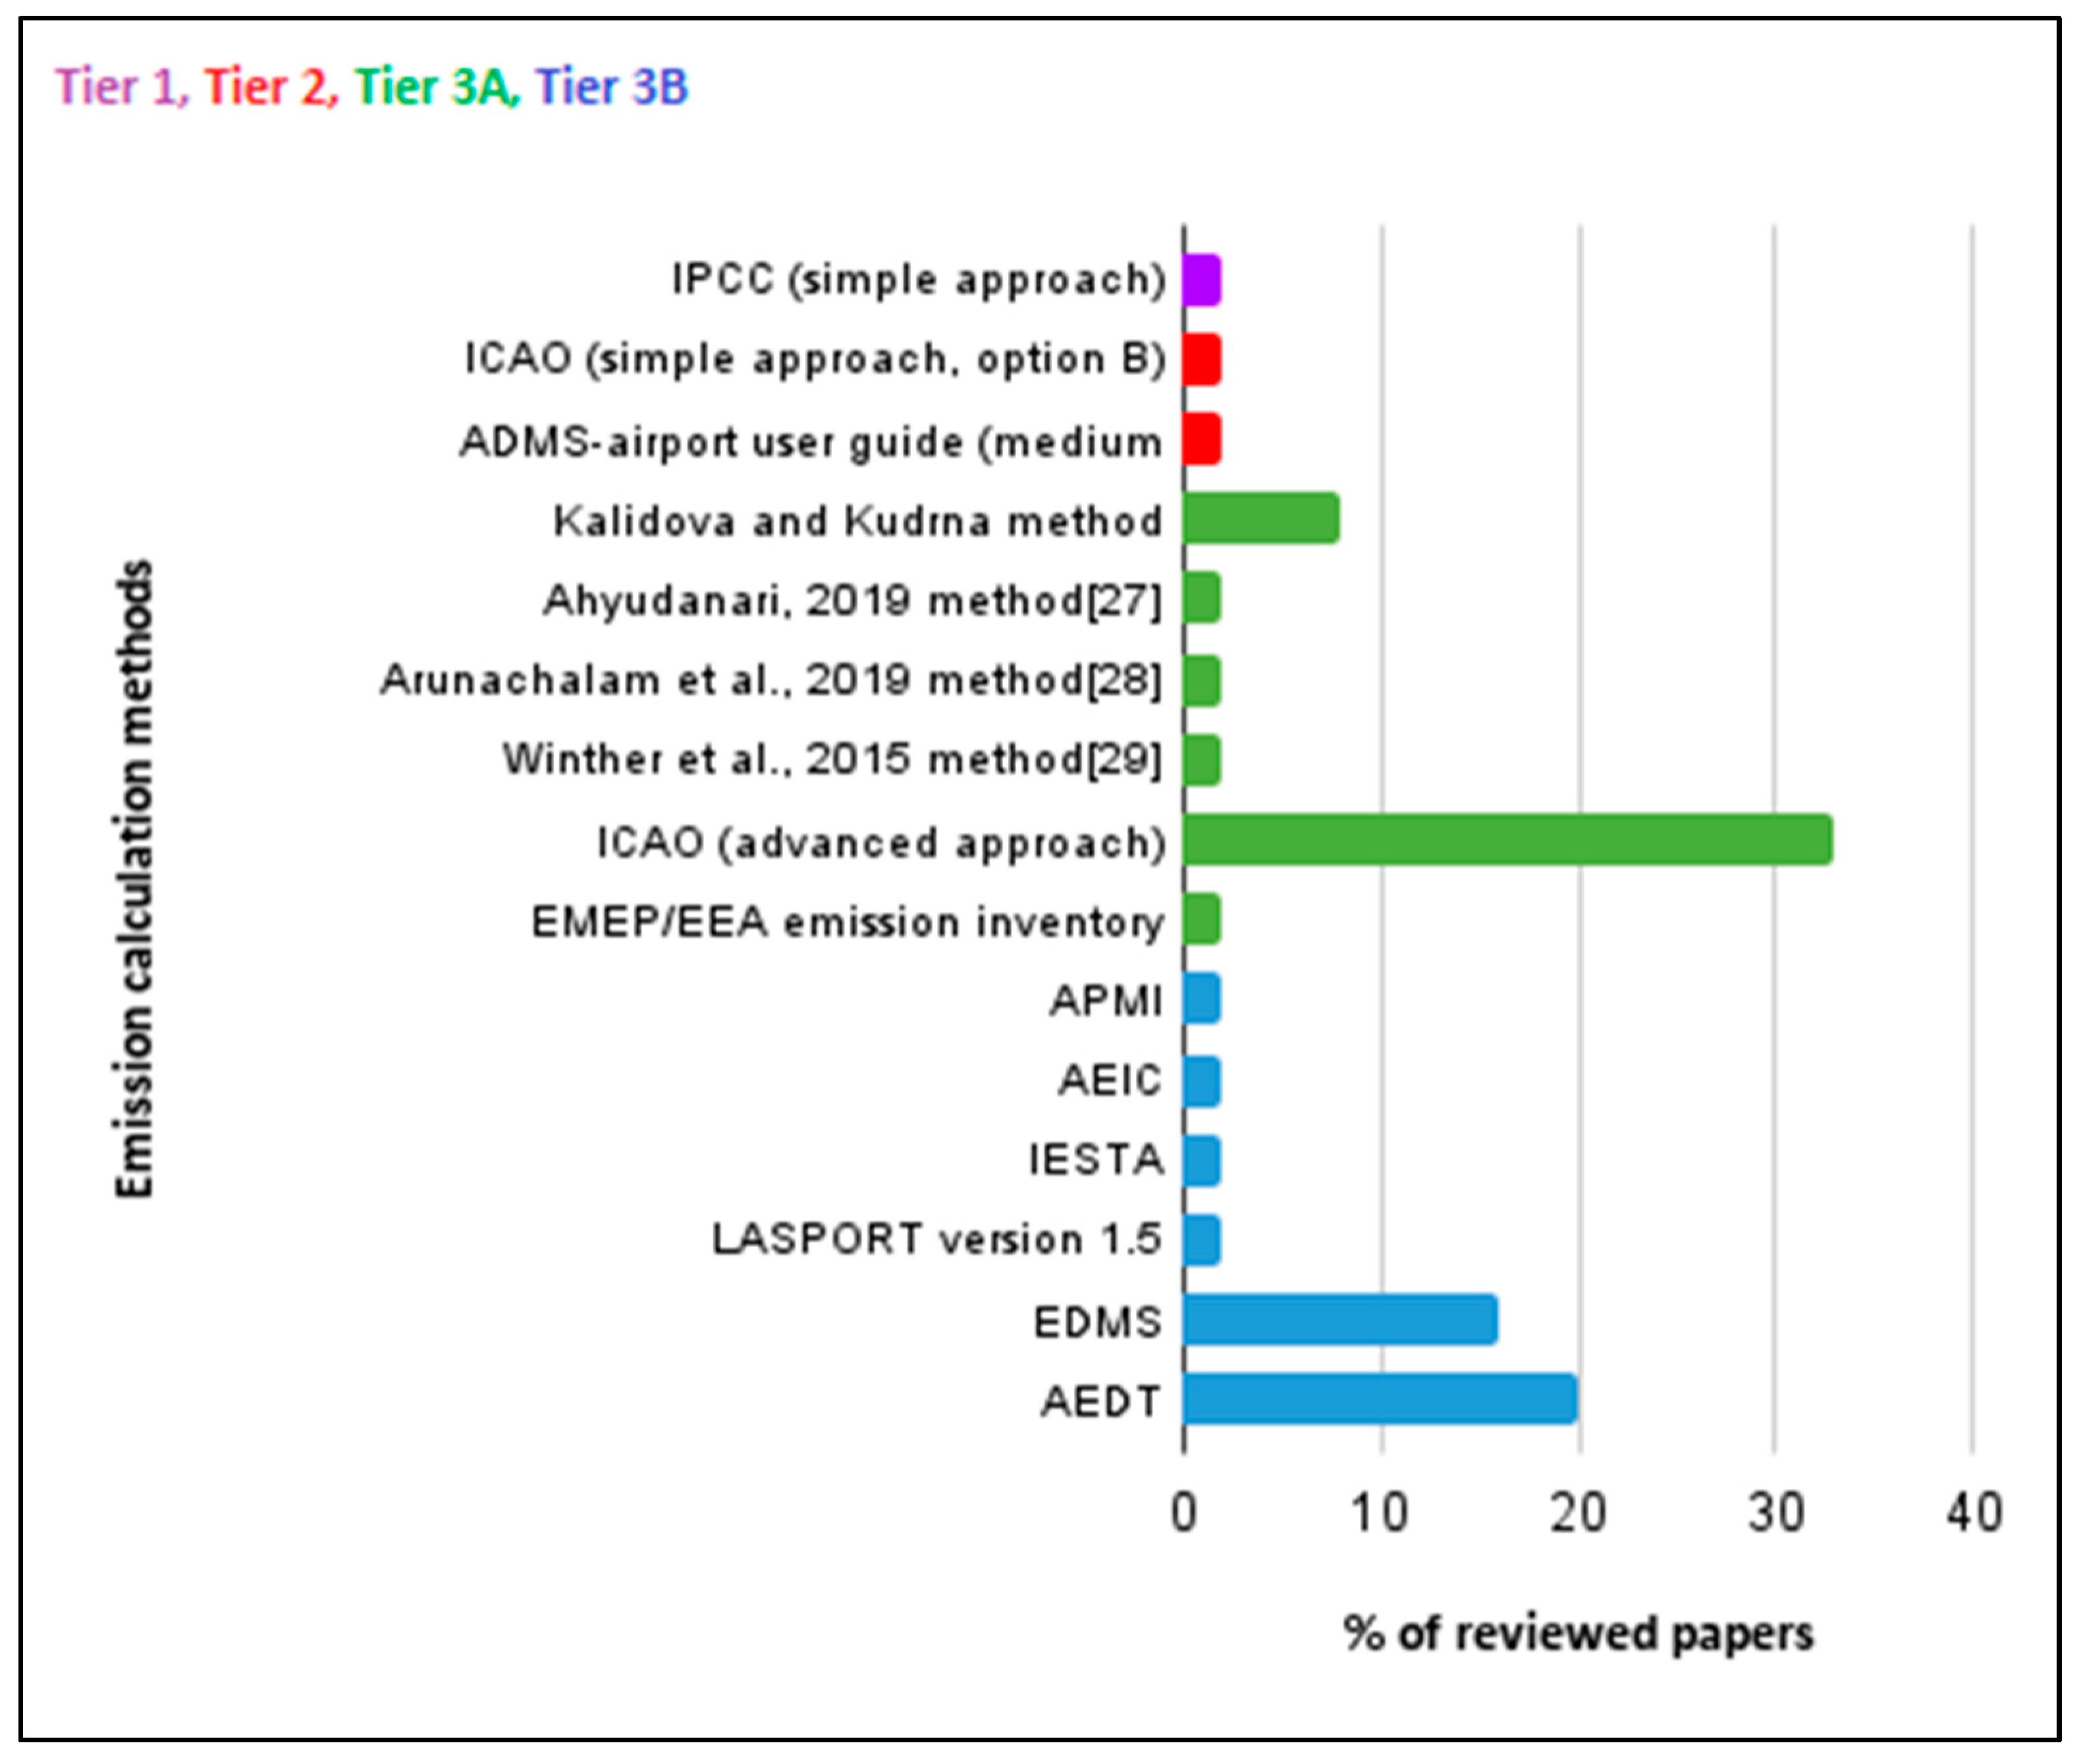
3.3. Tier Method
3.3.1. Tier 3A
3.3.2. Tier 3B
4. Conclusions
Author Contributions
Funding
Institutional Review Board Statement
Informed Consent Statement
Data Availability Statement
Acknowledgments
Conflicts of Interest
References
- UNFCCC. Adoption of the Paris Agreement. In Proceedings of the Paris Climate Change Conference—November 2015, Paris, France, 30 November–11 December 2015; p. 32. [Google Scholar]
- Brasseur, G.P.; Mtiller, J.-F.; Granier, C. Atmospheric impact of NOx emissions by subsonic aircraft: A three-dimensional model study. Geophys. Res. 1996, 101, 1423–1428. [Google Scholar] [CrossRef]
- Sutkus, D.J.; Baughcum, S.L.; Dubois, D.P. Scheduled Civil Aircraft Emission Inventories for 1999: Database Development and Analysis; Nasa Cr-2001-211216; Boeing Commercial Airplane Group: Washington, DC, USA, 2001. [Google Scholar]
- Lee, D.S.; Fahey, D.W.; Forster, P.M.; Newton, P.J.; Wit, R.C.; Lim, L.L.; Owena, B.S.; Sausen, R. Robert Aviation and global climate change in the 21st century. Atmos. Environ. 2009, 43, 3520–3537. [Google Scholar] [CrossRef] [PubMed] [Green Version]
- FAA. Aviation Emissions, Impacts & Mitigation: A Primer; FAA office of Environment and Energy: Washington, DC, USA, 2015.
- National Academies of Sciences, Engineering, and Medicine. ACRP Report 11: Guidebook on Preparing Airport Greenhouse Gas Emissions Inventories; The National Academies Press: Washington, DC, USA, 2009. [Google Scholar] [CrossRef]
- Oguntona, O. Longer-term aircraft fleet modelling: Narrative review of tools and measures for mitigating carbon emissions from aircraft fleet. CEAS Aeronaut. J. 2020, 11, 13–31. [Google Scholar] [CrossRef]
- Kim, J.H.; Kim, D.; Lee, D.B.; Chun, H.Y.; Sharman, R.D.; Williams, P.D.; Kim, Y.J. Impact of climate variabilities on trans-oceanic flight times and emissions during strong NAO and ENSO phases. Environ. Res. Lett. 2020, 15, 105017. [Google Scholar] [CrossRef]
- Georgieva, H.; Georgiev, K. Modeling of Aircraft Jet Noise in Airports; EDP Sciences: Les Ulis, France, 2018. [Google Scholar] [CrossRef] [Green Version]
- ICAO. Executive Committee Report, Assembly Forty-First Session; Authority of the Secretary General: Montréal, QC, Canada, 2022. [Google Scholar]
- ICAO. ICAO and the United Nations Sustainable Development Goals. Available online: https://www.icao.int/about-icao/aviation-development/Pages/SDG.aspx (accessed on 6 June 2023).
- EPA. U.S. Environmental Protection Agency, Air Topics. Available online: https://www.epa.gov/environmental-topics/air-topics (accessed on 23 March 2022).
- Batóg, J.; Forys, I.; Gaca, R.; Głuszak, M.; Konowalczuk, J. Investigating the Impact of Airport Noise and Land Use Restrictions on House Prices: Evidence from Selected Regional Airports in Poland. Sustainability 2019, 11, 412. [Google Scholar] [CrossRef] [Green Version]
- Rajé, F.; Dimitriu, D.; Radulescu, D.; Burtea, N.; Hooper, P. Competing Agendas for Land-Use Around Airports. In Aviation Noise Impact Management; Leylekian, L., Covrig, A., Maximova, A., Eds.; Springer: Berlin/Heidelberg, Germany, 2022. [Google Scholar] [CrossRef]
- UNCC. Climate Action and Support Trends; United Nations Climate Change Secretariat: Bonn, Germany, 2019. [Google Scholar]
- IPCC. 2006 IPCC Guidelines for National Greenhouse Gas Inventories; IGES: Hayama, Japan, 2006.
- ICAO. Annex 16: Environmental Protection, Volume II Aircraft Engine Emissions; ICAO: Montreal, QC, Canada, 2008. [Google Scholar]
- ICAO. About ICAO. Available online: https://www.icao.int/about-icao/Pages/default.aspx (accessed on 1 May 2022).
- ICAO. Doc 9889, Airport Air Quality Manual; ICAO: Montreal, QC, Canada, 2011. [Google Scholar]
- Moher, D.; Liberati, A.; Tetzlaff, J.; Altman, D.G.; Group, P. Preferred reporting items for systematic reviews and meta-analyses: The PRISMA statement. BMJ 2009, 339, 332–336. [Google Scholar] [CrossRef] [PubMed] [Green Version]
- Pickering, C.; Byrne, J. The benefits of publishing systematic quantitative literature reviews for PhD candidates and other early-career researchers. High. Educ. Res. Dev. 2014, 33, 534–548. [Google Scholar] [CrossRef] [Green Version]
- Denyer, D.; Tranfield, D. Producing a Systematic Review. In The SAGE Handbook of Organizational Research Methods; Buchanan, D.A., Bryman, A., Eds.; Sage Publications Ltd.: Thousand Oaks, CA, USA, 2009; pp. 671–689. [Google Scholar]
- Harrison, R.M.; Masiol, M.; Vardoulakis, S. Civil aviation, air pollution and human health. Environ. Res. Lett. 2015, 10, 041001. [Google Scholar] [CrossRef] [Green Version]
- Shea, B.J.; Reeves, B.C.; Thuku, M.; Moran, J.; Moher, D.; Tugwell, P.; Welch, V.; Kristjansson, E.; Henry, D.A. AMSTAR 2: A Critical Appraisal Tool for Systematic Reviews that Include Randomised or Non-Randomised Studies of Healthcare Interventions, or Both; BMJ: London, UK, 2017. [Google Scholar] [CrossRef] [Green Version]
- Melbourne Airport. Melbourne Airport Environment Strategy 2018; Melbourne Airport: Melbourne, Australia, 2018. [Google Scholar]
- Statista. Carbon Dioxide Emissions Worldwide from 1965 to 2020, by Region. Available online: https://www.statista.com/statistics/205966/world-carbon-dioxide-emissions-by-region/ (accessed on 25 March 2022).
- Ahyudanari, E. Airport location of city center and its contribution to air quality. Geogr. Tech. 2019, 14, 176–184. [Google Scholar] [CrossRef]
- Arunachalam, S.; Naess, B.; Seppanen, C.; Valencia, A.; Brandmeyer, J.E.; Venkatram, A.; Weil, J.; Isakov, V.; Barzyk, T. A new bottom-up emissions estimation approach for aircraft sources in support of air quality modelling for community-scale assessments around airports. Int. J. Environ. Pollut. 2019, 65, 43–58. [Google Scholar] [CrossRef]
- Winther, M.; Kousgaard, U.; Ellermann, T.; Massling, A.; Nøjgaard, J.K.; Ketzel, M. Emissions of NOx, particle mass and particle numbers from aircraft main engines, APU’s and handling equipment at Copenhagen Airport. Atmos. Environ. 2015, 100, 218–229. [Google Scholar] [CrossRef]
- Kuzu, S.L. Estimation and dispersion modeling of landing and take-off (LTO) cycle emissions from Atatürk International Airport. Air Qual. Atmos. Health 2018, 11, 153–161. [Google Scholar] [CrossRef]
- Khardi, S. Optimization of aircraft fuel consumption and reduction of pollutant emissions: Environmental impact assessment. Adv. Aircr. Spacecr. Sci. 2014, 1, 311–330. [Google Scholar] [CrossRef] [Green Version]
- Dissanayaka, D.M.M.S.; Adikariwattage, V.V.; Pasindu, H.R. Evaluation of CO2 Emission at Airports from Aircraft Operations within the Landing and Take-Off Cycle. Transp. Res. Rec. 2020, 2674, 444–456. [Google Scholar] [CrossRef]
- Li, J.; Yang, H.T.; Liu, X.G.; Yu, N.; Tian, Y.; Zhou, X.N.; Zhang, P.; Wang, K. Aircraft Emission Inventory and Characteristics of the Airport Cluster in the Guangdong-Hong Kong-Macao Greater Bay Area, China. Atmosphere 2020, 11, 323. [Google Scholar] [CrossRef] [Green Version]
- Taghizadeh, S.A.; Shafabakhsh, G.H.; Aghayan, I. Evaluation of aircraft emission at Imam Khomeini International Airport and Mehrabad International Airport. Int. J. Environ. Sci. Technol. 2019, 16, 6587–6598. [Google Scholar] [CrossRef]
- Hu, R.; Zhu, J.L.; Zhang, J.F.; Zheng, L.J.; Liu, B.W. Characteristics and mitigation measures of aircraft pollutant emissions at Nanjing Lukou International Airport (NKG), China. Promet—Traffic Transp. 2020, 32, 461–474. [Google Scholar] [CrossRef]
- Kafali, H.; Altuntas, O. The analysis of emission values from commercial flights at Dalaman international airport Turkey. Aircr. Eng. Aerosp. Technol. 2020, 92, 1451–1457. [Google Scholar] [CrossRef]
- Yang, X.; Cheng, S.; Lang, J.; Xu, R.; Lv, Z. Characterization of aircraft emissions and air quality impacts of an international airport. J. Environ. Sci. 2018, 72, 198–207. [Google Scholar] [CrossRef] [PubMed]
- Yin, J.; Ma, Y.; Hu, Y.; Han, K.; Yin, S.; Xie, H. Delay, Throughput and Emission Tradeoffs in Airport Runway Scheduling with Uncertainty Considerations. Netw. Spat. Econ. 2021, 21, 85–122. [Google Scholar] [CrossRef]
- Synylo, K.; Duchene, N. Methods for assessment of NOx emissions from aircraft engine. Int. J. Sustain. Aviat. 2019, 5, 324–342. [Google Scholar] [CrossRef]
- Koudis, G.S.; Hu, S.J.; Majumdar, A.; Jones, R.; Stettler, M.E.J. Airport emissions reductions from reduced thrust takeoff operations. Transp. Res. Part D Transp. Environ. 2017, 52, 15–28. [Google Scholar] [CrossRef]
- Zhu, C.X.; Hu, R.; Liu, B.W.; Zhang, J.F. Uncertainty and its driving factors of airport aircraft pollutant emissions assessment. Transp. Res. Part D-Transp. Environ. 2021, 94, 102791. [Google Scholar] [CrossRef]
- Xu, H.; Xiao, K.; Cheng, J.; Yu, Y.; Liu, Q.; Pan, J.; Chen, J.; Chen, F.; Fu, Q. Characterizing aircraft engine fuel and emission parameters of taxi phase for Shanghai Hongqiao International Airport with aircraft operational data. Sci. Total Environ. 2020, 720, 137431. [Google Scholar] [CrossRef]
- Xu, H.; Fu, Q.; Yu, Y.; Liu, Q.; Pan, J.; Cheng, J.; Wang, Z.; Liu, L. Quantifying aircraft emissions of Shanghai Pudong International Airport with aircraft ground operational data. Environ. Pollut. 2020, 261, 114115. [Google Scholar] [CrossRef] [PubMed]
- Sherry, L. Improving the accuracy of airport emissions inventories using disparate datasets. IIE Trans. 2015, 47, 577–585. [Google Scholar] [CrossRef]
- Stettler, M.E.J.; Eastham, S.; Barrett, S.R.H. Air quality and public health impacts of UK airports. Part I: Emissions. Atmos. Environ. 2011, 45, 5415–5424. [Google Scholar] [CrossRef]
- Yim, S.H.L.; Stettler, M.E.J.; Barrett, S.R.H. Air quality and public health impacts of UK airports. Part II: Impacts and policy assessment. Atmos. Environ. 2013, 67, 184–192. [Google Scholar] [CrossRef]
- Creţu, M.; Dobre, T.; Teleaba, V.; Dragasanu, L. Quantification by modeling and measurement of aircraft contribution to air pollution in airport area. UPB Sci. Bull Ser. B 2013, 75, 129–142. [Google Scholar]
- Wasiuk, D.K.; Lowenberg, M.H.; Shallcross, D.E. An aircraft performance model implementation for the estimation of global and regional commercial aviation fuel burn and emissions. Transp. Res. Part D Transp. Environ. 2014, 35, 142–159. [Google Scholar] [CrossRef] [Green Version]
- Xu, K.; Cui, K.; Young, L.-H.; Wang, Y.-F.; Hsieh, Y.-K.; Wan, S.; Zhang, J. Air Quality Index, Indicatory Air Pollutants and Impact of COVID-19 Event on the Air Quality near Central China. Aerosol Air Qual. Res. 2020, 20, 1204–1221. [Google Scholar] [CrossRef] [Green Version]
- Tobías, A.; Carnerero, C.; Reche, C.; Massagué, J.; Via, M.; Minguillón, M.C.; Alastuey, A.; Querol, X. Changes in air quality during the lockdown in Barcelona (Spain) one month into the SARS-CoV-2 epidemic. Sci. Total Environ. 2020, 726, 138540. [Google Scholar] [CrossRef] [PubMed]
- Hewitt, C.N.; Ashworth, K.; MacKenzie, A.R. Using green infrastructure to improve urban air quality (GI4AQ). Ambio 2020, 49, 62–73. [Google Scholar] [CrossRef] [PubMed] [Green Version]
- Arter, C.A.; Arunachalam, S. Assessing the importance of nonlinearity for aircraft emissions’ impact on O3 and PM2.5. Sci. Total Environ. 2021, 777, 146121. [Google Scholar] [CrossRef]
- Arunachalam, S.; Wang, B.; Davis, N.; Baek, B.H.; Levy, J.I. Effect of chemistry-transport model scale and resolution on population exposure to PM2.5 from aircraft emissions during landing and takeoff. Atmos. Environ. 2011, 45, 3294–3300. [Google Scholar] [CrossRef]


| Combination | Search Terms | Scopus | Web of Science | ProQuest | Total |
|---|---|---|---|---|---|
| 1 | (Aviation OR aircraft) AND (Emission* OR GHGs) AND (“air quality” OR “LTO cycle”) | 428 | 654 | 294 | 1376 |
| 2 | (“Aircraft emission*” OR “Emission* from aircraft” OR “emission* of aircraft”) AND (“air Quality”) | 108 | 101 | 61 | 270 |
| Reason Number | Description |
|---|---|
| 1 | Papers that address soot, black carbon, particle matters (PM), and volatile organic compounds (VOCs) |
| 2 | Papers that address the CO2 or emission from aircraft (above the LTO cycle) |
| 3 | Papers that address the aircraft emission due to technological advances |
| 4 | Papers that address the sustainable aviation |
| 5 | Papers that address public opinion concerning aircraft emission |
| 6 | Papers that address the health impact of aircraft emission |
| 7 | Papers do not focus directly on the topic of review |
| 8 | Papers that do not address the emission calculation methodology |
| 9 | Papers with literature review |
| Variables Used for Emission Calculations | |||||||||||||||||
|---|---|---|---|---|---|---|---|---|---|---|---|---|---|---|---|---|---|
| LTO Cycle | Emission Factor (EF) | Duration | Fuel Flow (FF) | No of Engines per Aircraft Type | Emission Rate per LTO (Mode Specific) | Pollutant Load | Software in Modeling Emissions Inventory | ||||||||||
| Tier | Methods | No. of LTO | No. of LTO per Engine Type | EF per LTO | EF per Engine Type | EF per Engine Type (Mode Specific) | Time = Distance/Speed | Time per Grid Cell | TIM per Engine Type | Fuel Use | FF per Engine Type | Fuel Use per LTO | FF per Engine Type (Mode Specific) | ||||
| 1 | Simple estimation approach of IPCC | ✓ | ✓ | ||||||||||||||
| 2 | ICAO simple approach (option B) | ✓ | ✓ | ✓ | ✓ | ✓ | |||||||||||
| Kalidova and Kudrna method | ✓ | ✓ | ✓ | ✓ | |||||||||||||
| Medium approach of ADMS-airport User Guide | ✓ | ✓ | ✓ | ✓ | ✓ | ||||||||||||
| 3A | ICAO advanced approach | ✓ | ✓ | ✓ | ✓ | ||||||||||||
| Emission Inventory Guidebook of European Environment Agency | ✓ | ✓ | ✓ | ||||||||||||||
| New methodology (Ref [27]) | ✓ | ✓ | ✓ | ||||||||||||||
| New methodology (Ref [28]) | ✓ | ✓ | ✓ | ✓ | ✓ | ||||||||||||
| New methodology (Ref [29]) | ✓ | ✓ | ✓ | ✓ | ✓ | ||||||||||||
| 3B | AEDT | ✓ | |||||||||||||||
| EDMS | ✓ | ||||||||||||||||
| APMI | ✓ | ||||||||||||||||
| AEIC | ✓ | ||||||||||||||||
| IESTA | ✓ | ||||||||||||||||
| LASPORT version 1.5 | ✓ | ||||||||||||||||
| Continent | Tier | |||
|---|---|---|---|---|
| 1 | 2 | 3A | 3B | |
| Asia | 1 | 4 | 12 | 1 |
| Europe | 0 | 2 | 8 | 4 |
| North America | 0 | 0 | 3 | 16 |
| Australia | 0 | 0 | 1 | 0 |
Disclaimer/Publisher’s Note: The statements, opinions and data contained in all publications are solely those of the individual author(s) and contributor(s) and not of MDPI and/or the editor(s). MDPI and/or the editor(s) disclaim responsibility for any injury to people or property resulting from any ideas, methods, instructions or products referred to in the content. |
© 2023 by the authors. Licensee MDPI, Basel, Switzerland. This article is an open access article distributed under the terms and conditions of the Creative Commons Attribution (CC BY) license (https://creativecommons.org/licenses/by/4.0/).
Share and Cite
Dissanayaka, M.; Ryley, T.; Spasojevic, B.; Caldera, S. Evaluating Methods That Calculate Aircraft Emission Impacts on Air Quality: A Systematic Literature Review. Sustainability 2023, 15, 9741. https://doi.org/10.3390/su15129741
Dissanayaka M, Ryley T, Spasojevic B, Caldera S. Evaluating Methods That Calculate Aircraft Emission Impacts on Air Quality: A Systematic Literature Review. Sustainability. 2023; 15(12):9741. https://doi.org/10.3390/su15129741
Chicago/Turabian StyleDissanayaka, Manori, Tim Ryley, Bojana Spasojevic, and Savindi Caldera. 2023. "Evaluating Methods That Calculate Aircraft Emission Impacts on Air Quality: A Systematic Literature Review" Sustainability 15, no. 12: 9741. https://doi.org/10.3390/su15129741
APA StyleDissanayaka, M., Ryley, T., Spasojevic, B., & Caldera, S. (2023). Evaluating Methods That Calculate Aircraft Emission Impacts on Air Quality: A Systematic Literature Review. Sustainability, 15(12), 9741. https://doi.org/10.3390/su15129741