Abstract
China’s economic development has made world-renowned achievements which have subsequently brought serious environmental pollution problems. As a large manufacturing country, the industrial value added in China accounts for nearly 30% of the global share. However, the manufacturing industry lacks competence. Therefore, considering environmental protection issues while promoting manufacturing industry upgrading (MIU) is a critical goal for China at present. By applying panel data from China’s Yangtze River Economic Belt (YREB) from 2010 to 2019, this paper uses a spatial econometric model to study the effect of green finance (GF) on upgrading (hereafter, upgrading refers to the improvement of the manufacturing structure and the transition toward green manufacturing) the manufacturing industry. This study found that the impact of GF on MIU in the YREB is significantly positive. GF has a good positive spatial spillover effect. Moreover, the high level of urbanization and high freight volume have positive impacts, the impacts of foreign investment and government fiscal expenditure are significantly negative, and the effect of the level of human capital on upgrading is not obvious. Therefore, vigorously developing green finance, optimizing the environment for manufacturing upgrades, and cultivating green and high-quality talents should be the future direction of government policy formulation.
1. Introduction
In the history of world economic development, books have been written on economic development and environmental destruction. In an attempt to avoid the development model of pollution first and governance later, green development has received an increasing amount of attention [1,2,3]. Since the reform and opening up in 1978, China’s economy has witnessed rapid development; however, this has brought problems such as unreasonable industrial structures, low-quality goods in excess capacity, and serious environmental problems [4,5]. As a result, the Chinese government has drafted a series of strategies and policies dedicated to addressing such economic development issues.
The green development of the manufacturing industry in China is inseparable from the development of GF. The green credit balance of China increased from CNY 5.2 trillion in 2013 to CNY 22.03 trillion in 2022. The scale and number of green bonds issued continue to increase. In 2021, the number of green bonds issued reached 485, with an issuance amount of CNY 607.5 billion. At the end of June 2022, China’s green bond stock reached up to CNY 1.2 trillion.
The process of upgrading China’s manufacturing industry is now at a critical moment. The economic growth rate is gradually declining, the manufacturing industry is facing the pressures of intensified resource and environmental constraints, the market is squeezed and compressed, the development model is outdated, and the development momentum is insufficient. For this reason, China proposed “Made in China 2025”, which proposed goals and requirements for upgrading the manufacturing industry. Upgrading means not only upgrading the industrial structure, changing the national economic growth mode from labor-intensive to capital-intensive and knowledge-intensive, profoundly changing the resource operation mode to a product and knowledge operation growth mode, and implying the transition toward green manufacturing but also increasing the average added value of products in the industry. Research on supporting economic growth has proven the financial industry to be the economy’s lifeblood [6]. GF is of great importance to green development and MIU. It encourages the manufacturing industry to change its traditional business models, adjust its growth structure, and transform the upgrading of kinetic energy [7]. In the research process, reasonable and reliable calculations not only provide references for the upgrading of the green financial service and manufacturing industry in China but also for the further promotion of the development of GF in provinces, a task which has very important practical significance.
In addition, GF is an important type of development in the new era. Promoting GF development is conducive to the realization of green development. As an important industrial corridor in China, the YREB spans the country. It has a large economic scale, is rich in resources, and has a high development potential. Studying MIU in the YREB will provide a theoretical reference for regional industrial upgrading. Therefore, this research is based on a spatial model and uses provincial panel data from the YREB from 2010 to 2019 to explore the impact of GF on MIU.
The contributions of this research are as follows. Firstly, this paper integrates green finance and manufacturing industry upgrading, analyzes the spatial effects of relevant factors on manufacturing industry upgrading, and provides a theoretical basis for developing regional green financial development policies and polices for upgrading the manufacturing industry. Secondly, as it considers the YREB, which was determined to be a key development area by the Chinese government, this research is representative. Thirdly, this paper constructs a comprehensive indicator evaluation system for green finance and levels of upgrading the manufacturing industry, and it scientifically evaluates the actual development level of the YREB.
2. Literature Review
2.1. Green Finance
As an investment and financing activity, the implementation of green finance implies concern for the environment, ecology, and sustainable living. Through the flow of funds, it increases environmentally friendly investments, encourages the development of green enterprises, reduces environmentally harmful investments, and restricts the development of highly polluting enterprises [8]. The original concept of green finance partly comes from considering environmental quality; economic development should not occur at the expense of seriously damaging the environment [9]. With the deepening of the research, the interpretation of GF has become more abundant and detailed. GF is a financial resource designed to support green growth, improve the environment to reduce the emissions of greenhouse gas and air pollutants, reduce water pollution, and protect biodiversity [10,11]. GF is seen as a monetary tool aimed at enabling green development and promoting sustainable practices [12]. GF plays a positive role in promoting sustainable development and green finance projects [13,14]. The synergy generated by the combination of GF and regulatory policies has clearly stimulated technological innovation in polluting enterprises; the enterprises with strong financial constraints have more significant effects [15,16]. Based on research conducted on 1138 China A-share companies from 2007 to 2016, findings show that the policy incentives of the green financial policy are conducive to the innovation of green patents [17]. Certainly, some scholars hold opposing opinions on green finance. He et al. [18] argue that GF is not favorable to the issuance of bank loans nor the improvement of investment efficiency in the energy sector. Liu et al. [19] found that improvements in regional economic efficiency made through the development of China’s GF are generally not significant, and Sinha et al. [20] argue that economic transformation should not include the intervention of a green financing mechanism as the mechanism is not conducive to the fulfillment of environmental and social responsibilities. Wang [21] used a spatial model based on YREB data from 2007 to 2019 to indicate that although the governance level of China’s policies related to GF has improved, the governance effect is not obvious enough.
2.2. Manufacturing Industry Upgrading
The industrial sector, referring to all manufacturing industries, has traditionally been called “the main engine of rapid growth” [22]. There is an abundance of academic research exploring manufacturing upgrading. There are two main perspectives in understanding the connotation of upgrading the manufacturing industry: a microperspective and a macroperspective. Gereffi [23] believes that industrial upgrading is a process in which an enterprise integrates into the global value chain, produces differentiated products, and obtains higher profits. Poon [24] pointed out that manufacturing upgrading refers to the process of transformation of enterprises from producing labor-intensive products to producing technology-intensive products. Another view is based on a macroperspective, which focuses on the inspection of industrial structures. Porter [25] states that manufacturing industry upgrading is a phenomenon in which a country has a comparative advantage in high-tech and capital-intensive industries. The above understanding of manufacturing industry upgrading is consistent with the development of the fourth stage, the “Drive to Maturity,” to the fifth stage, the “Age of Mass Consumption”, in Rostow’s stage theory [26]. Some scholars also propose different views; Heckscher-Ohlin insists that factor endowments rather than competitive advantages play the critical role [27]. No matter how different the understanding of the concept of manufacturing industry upgrading is, the purpose of manufacturing industry upgrading is to obtain new economic growth drivers and better promote sustainable economic development. Manufacturing industry upgrading can be improved by integrating global innovation resources [28]. According to the Romer endogenous growth model, technology is embodied in material products, and knowledge is an endogenous factor of production which can form a virtuous circle with investment to permanently increase the growth rate. The government needs to incentivize and protect innovation [29]. It is much better and more strategic to upgrade manufacturing capabilities than do something else [30]. In terms of industrial upgrading, the ratio of manufacturing output value to GDP is used to reflect changes in industry structures [31,32]. However, this measurement is incomplete and should involve a change in structural proportions and an improvement in technical productivity [33,34].
2.3. Green Finance and Manufacturing Industry Upgrading
Regarding GF and MIU, scholars first studied GF and the upgrading of the entire industry. Ge et al. [35] found that renewable energy is indispensable in industrial upgrading at a high level of GF development. Fang and Shao [36] believe that the relationship between GF and industrial upgrading is dynamic and interactive; ultimately, it is conducive to achieving high-quality development. A good green development method plays a decisive role in improving manufacturing industry upgrading [37]. More scholars have considered whether green technology innovation can effectively promote MIU. Xie et al. [38] hold that green technology innovation is effective for upgrading low-value-added sectors due to the results of the econometric regression model, which employed data from China’s 35 industrial sectors from 2002 to 2019. Green innovation can help enterprises upgrade, enhance their competitiveness, and achieve better market performance [39]. Heavily polluting Chinese firms that engage in green innovation perform better than those that do not innovate [40]. Green innovation not only promotes transformation and upgrading for individual companies but also pushes forward the upgrading of the entire industry [41,42]. There is no substitute for solving green industrial transformation problems except green technology innovation [43]. There are also opposing views that green technology innovation has a negative impact on economic conditions due to high innovation costs, long times, and uncertain outcomes [44,45]. Scholars also studied government green policies on manufacturing upgrading using panel data from China’s 30 provinces within the sample period of 2000–2016 and found that energy conservation target policies and new energy substitution policies are conducive to industrial low-carbon upgrading, while the collection of sewage charges is not conducive to upgrading [46].
2.4. Literature Summary
The above literature has conducted research on green finance, manufacturing industry upgrading, and the relationship between them. However, it can be seen that most scholars have studied the impact of technological innovation brought about by green finance on industrial upgrading, but few studies have focused on GF’s impact on MIU. In terms of the development level of GF and the measurement of MIU, a consistent approach must be formed. These deficiencies are also the problems that this paper attempts to analyze.
3. Theoretical Basis and Research Methods
3.1. Theoretical Basis
This paper believes that through the guidance and support of policies, the development and allocation of the market will be developed by green finance, and this will affect manufacturing industry upgrading in three ways: industrial structure greening, technological progress, and upgrading human capital.
3.1.1. Greening of Industrial Structure
The direct impact of GF is that polluting industries are gradually replaced by green industries, and the industrial structure realizes green development. The green industry took advantage of green finance to receive sufficient financial support, the cost of borrowing for the green industry has been significantly reduced, and sustainable development and scale operation have become possible. The booming of the green industry has also conveyed the concept of environmental protection to enterprises and individuals. Enterprises have increasingly turned to green production and implemented green transformation, and individuals have established healthy concepts of green consumption and supported the manufacture of green products. In contrast, traditional polluting enterprises are suppressed by green finance, their financing scale is limited, and their financing conditions are becoming more stringent. Green finance increases the “punishment” of polluting enterprises from both positive and negative directions and also provides more support for green industries, leading the industrial structure to develop in a green direction. The greening of the industrial structure will effectively lead to the greening of the manufacturing industry.
3.1.2. Technological Progress
Green finance promotes corporate green technology innovation, and technological improvement is the core driving force for manufacturing industry upgrading. Only when green finance is fully developed can there be vigorous innovation in green technology. Green finance policy provides a guarantee for the innovation of enterprises by providing targeted green financial support. The green finance market provides the funding requirements for green finance companies to innovate. In the initial stage of innovation, green enterprises will prioritize green innovation in areas that can directly generate green benefits, improve the resource utilization rate of a single enterprise, and reduce the pollution emission level of the enterprise. After the deepening and diffusion of innovation, the total factor productivity of the entire industry will be qualitatively improved. Finally, the relevant upstream and downstream enterprises also conduct green technology innovation; accordingly, each line of the industrial chain will realize the industrial upgrading of the manufacturing industry.
3.1.3. Human Capital Upgrading
Human resources are capital with greater value-added potential than capital, technology, and other hardware. Green finance puts forward new requirements for human resources in the new era. Talented individuals with green ideas and green technologies that can give full play to their innovation and creativity are selected and promoted, effectively allocating the existing resources of enterprises, adjusting them in time, and realizing the green development strategies of enterprises according to the new situation. Green finance comprehensively improves the quality and ability of human resources in multiple dimensions, such as education and training, knowledge, and information. These improvements will have an important impact on the total factor productivity level of the manufacturing industry and affect the upgrading profoundly.
3.2. Model Setting
Spatial econometrics considers geographical factors when studying the relationships between things, enriching the research on the relationship between regions. In 1988, Anselin found that a specific economic characteristic of a spatial unit tends to be correlated with the economic characteristics of surrounding spatial units [47]. This paper introduces the spatial measurement method to evaluate the impact of GF on MIU in the YREB and explores the mechanism in depth.
In this study, research on the impact of GF on MIU includes a spatial analysis. There are three commonly used spatial econometric models: the spatial lag model (SAR), spatial Durbin model (SDM), and spatial error model (SEM). The SDM considers more comprehensive factors; therefore, it was chosen for further analysis, and the constructed model is provided as follows:
In this formula, and are the manufacturing industry upgrading level and green financial development level, respectively, and , , and represent the control variables. represents the constant term, is the parameter to be estimated, is the preset spatial weight matrix, is the coefficient of the spatial item, represents the individual fixed effect, represents the time fixed effect, and represents the error term. While only using the regional distance matrix cannot reflect other relationships between regions [48,49], the weight matrix setting for research combines economic and geographical factors together into the model for analysis, and its form is:
represents the Euclidean distance between two provinces, is the average annual per capita GDP level of the province during the observation period, the expression is , and is the average annual per capita GDP of the sample.
3.3. Spatial Autocorrelation Test
3.3.1. Global Spatial Autocorrelation Test
A global spatial autocorrelation test must be performed before the spatial econometric analysis, and its significance lies in judging whether the research object has a spatial correlation. The spatial model analysis is applicable only if there is a spatial correlation. Moran’s I is used to measure the spatial autocorrelations of research objects, and the calculation formula is as follows:
In the formula, is the sample variance, and represent the observed values of two regions, respectively, is the sample mean, and is the spatial weight between the two regions. Generally, the range of Moran’s index is [−1, 1]. When the index falls between (0, 1], the data variables exhibit a positive spatial correlation; when the index falls between [−1, 0], the data variables exhibit a negative spatial correlation; when the index is equal to 0, it illustrates that there is no spatial correlation.
3.3.2. Local Spatial Correlation Test
The global Moran index can help judge the spatial correlation of the whole data set; however, it cannot grasp the character of the spatial aggregation within the specific range of data. Therefore, the local Moran’s I index is introduced to study the spatiality of a specific region, and its formula is:
If the index is greater than 0, then regions with the same economic levels and attributes are clustered together; if the index is less than 0, then regions with opposite economic levels and attributes are clustered together. Moran scatter plots are used to assist in this judgment. Each region studied in the scatter diagram will be distributed in four quadrants in the diagram according to its characteristics. Among them, the first quadrant belongs to the high–high aggregation area (HH). In this quadrant, the region itself is at a high development level, and the surrounding regions are also at high levels. The second quadrant is a low–high aggregation area (LH). The region itself is at a low development level, but the surrounding regions are at high levels. The third quadrant is a low–low aggregation area (LL). The region itself is at a low development level in this quadrant, and the surrounding regions are also at low levels. The fourth quadrant is a high–low aggregation area (HL). In this quadrant, the region itself is at a high development level, but the surrounding regions are at low levels. High and low values do not represent absolute strengths but rather a relative comparison between neighboring areas.
3.4. Model-Selection-Related Tests
In order to select an appropriate spatial econometric model for regression, many tests are required [50]. Firstly, the LM test is performed to judge whether there are spatial error effects and spatial lag effects; secondly, the Hausman test is performed to determine if the fixed effect model or the random effect model should be selected; finally, the LR test and Wald test are performed to judge whether the SDM is the best fit.
4. Variable Selection and Model Testing
4.1. Variable Selection
4.1.1. Explained Variable
The explained variable is the level of manufacturing industry upgrading (MIU). This paper comprehensively constructs an indicator system of MIU in the YREB and expresses it with a comprehensive score calculated via the global principal component analysis method (GPCA). Table 1 presents the specific content of the indicator system. The average columns in the table are obtained by averaging the annual averages of the item in each province.

Table 1.
Index system of MIU.
The KMO value was 0.611, and the p value corresponding to the Bartlett test was significantly less than 0.01. Among the nine principal components generated, the first three principal components were extracted, and the cumulative variance rate reached 88.011%. Based on the PCA principle, the principal component expression is obtained:
The comprehensive score of the principal components can then be calculated and shown in Figure 1.
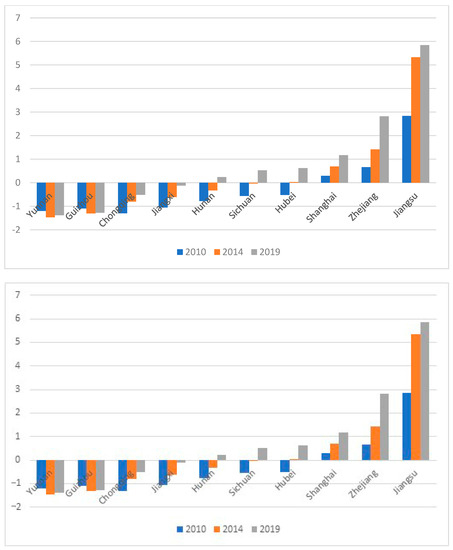
Figure 1.
The MIU level of the YREB from 2010 to 2019.
4.1.2. Explanatory Variable
The explanatory variable is the level of green financial development (GFD). This paper constructs an evaluation system for the level of GFD in the YREB, using the entropy weight method to impart objective weights to the selected indicators, as shown in Table 2. The results obtained via the entropy weight method show that the eastern regions take the lead in green finance development, followed by the central regions, and the development of western regions lags behind. This result is consistent with the finding of Huang and Liu [51,52].
Table 2.
Evaluation system for GFD level.
4.1.3. Control Variables
In addition to the GFD level, there are many factors affecting the upgrading level of the manufacturing industry. The level of globalization (UL), foreign direct investment (FDI), human capital quality (EDU), and regional traffic level (TRA) are used as control variables. The government’s financial support can provide a sufficient financial guarantee for manufacturing upgrading; the higher the urbanization level of the city, the more fully it is developed, and the more demand for manufacturing upgrading there will be; foreign direct investment can inject diversified resources into manufacturing upgrading; funds and talents are important factors in driving manufacturing upgrading; and the quality of regional transportation also determines the levels of communication and interaction between the local manufacturing industry and other regions.
4.2. Data Sources
The above data are sourced from the National Bureau of Statistics of China [53], the China Statistical Yearbook [54], Provincial Statistical Yearbooks [55,56,57,58,59,60,61,62,63,64,65], the CSMAR database [66], and the Wind database [67]. The descriptive statistics of each type of data are shown in Table 3.
Table 3.
Descriptive statistics of data.
Before spatial measurement, a unit root test was executed on all variables to ensure that the data were stable and to avoid spurious regression. The result is shown in Table 4. Test results show that all variables reject the null hypothesis of having a unit root significantly.
Table 4.
Unit root test of data.
4.3. Spatial Inspection
4.3.1. Global Spatial Autocorrelation Analysis
The results of the spatial autocorrelation test are shown in Table 5. From 2010 to 2019, Moran’s I was significantly positive at the 1% level, indicating that the manufacturing industry upgrading had a significant positive spatial correlation. Therefore, it is a correct and reasonable choice to use this method of spatial measurement for analysis.
Table 5.
Moran’s I index of manufacturing industry upgrade.
4.3.2. Local Spatial Correlation Test
Using the Moran scatter diagram, the indexes of each region are shown in Figure 2 and Figure 3 below, and the years 2010 and 2019 are selected as representatives.
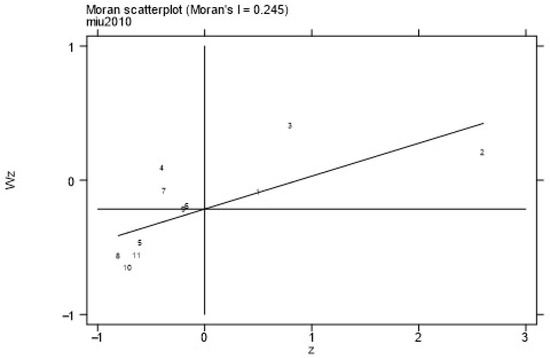
Figure 2.
Moran scatter diagram of the MIU level in 2010. Notes: 1—Shanghai; 2—Jiangsu; 3—Zhejiang; 4—Anhui; 5—Jiangxi; 6—Hubei; 7—Hunan; 8—Chongqing; 9—Sichuan; 10—Yunnan; 11—Guizhou.
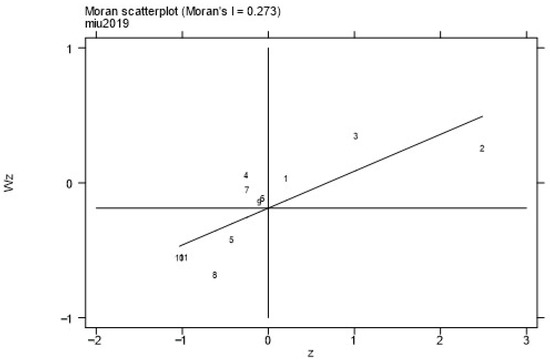
Figure 3.
Moran scatter diagram of the MIU level in 2019. Notes: 1—Shanghai; 2—Jiangsu; 3—Zhejiang; 4—Anhui; 5—Jiangxi; 6—Hubei; 7—Hunan; 8—Chongqing; 9—Sichuan; 10—Yunnan; 11—Guizhou.
Table 6.
Local Moran’s I test.
4.3.3. Model-Selection-Related Tests
From Table 7, the results of the LM test are very significant at the 1% level, so this study rejects the null hypothesis of using a mixed OLS panel model in favor of using a spatial panel econometric model. The Hausman test result is significant at the 1% level. Thus, the fixed effect model was selected. The two statistics of the LR test and Wald test passed the significant test at the 1% level, indicating that SDM cannot degenerate into SAR or SEM and that SDM is the most suitable model for further analysis and cannot be replaced by the other two spatial models.
Table 7.
Spatial-model-selection-related Tests.
5. Spatial Empirical Results
5.1. Spatial Durbin Model Test Results
From Table 8 above, the spatial effect of the development level of GF in the YREB on the MIU level can be observed. The spatial autoregressive coefficient of the explained variable MIU is −0.104, which is significant at the 5% level, indicating a significant negative spatial spillover effect. This means that the high level of MIU in this region will inhibit the manufacturing of adjacent regions. The reason for this is that the manufacturing industry has a large scale, a large number of employees, and production has a certain threshold and scale effect. When a region takes the lead in realizing manufacturing industry upgrading, the region can greatly reduce production costs, improve product quality, and make profits, thus establishing regional comparative advantages and restraining MIU in the same industry in adjacent regions.
Table 8.
SDM regression results.
5.2. Spatial Effect Decomposition
In order to better understand the spatial effect of GFD on MIU, the spatial effect presented above is further decomposed.
By decomposing the spatial hysteresis effect, the spatial effect is attained, as shown in Table 9. The direct, indirect, and total effects of GFD are all significant, passing the 1% significance test. When the region is at a relatively high level of GFD, the local green financial market will be relatively well developed. This market will not only help to accumulate and allocate capital but will also promote technological progress in manufacturing, which ultimately promotes MIU. From a microperspective, GF supports large-scale environmentally friendly enterprises in the manufacturing industry in implementing technological innovation through multiple channels and methods, and the positive externality of technology spillover will drive the development of smaller green enterprises. Traditional high-pollution, high-energy-consuming, non-green manufacturing companies are forced to transform from traditional industries into green industries under the financial constraints of financial institutions in an effort to survive, thus realizing the upgrading of manufacturing industries. A possible reason for the positive indirect effect of GF is that local GFD can serve as a good model for surrounding areas. After learning from the excellent local experience with developing green finance, the surrounding areas introduced green financial products that were in line with the surrounding localities. At the same time, the environmental pressure faced by the region forced the surrounding areas to vigorously develop green finance and actively promote technological innovation in manufacturing and green industrial transformation, thus improving the level of upgrading in the surrounding provinces. In summary, green financial development in this region promotes the development of the manufacturing industry and stimulates surrounding manufacturing industries to upgrade.
Table 9.
Decomposition of the SDM effect.
The effect of government support is significantly negative. The government’s financial expenditure plays a negative role in upgrading in local and nearby regions. Too much fiscal intervention will inhibit innovation and development, and subsidies such as finance and taxation are not conducive to upgrading. Urbanization has a significantly positive effect on MIU. As the degree of local urbanization intensifies, there will be a larger labor force, greater employment space, and higher market demand. These elements will strongly promote the level of upgrading. The urbanization of the region can effectively promote MIU, and it can also effectively promote upgrading in surrounding areas. Foreign investment is significantly negative, indicating that foreign investment not only has an adverse impact on the local area but also spills over into surrounding areas, and over-reliance on foreign investment is not conducive to manufacturing upgrading. The direct effect of human capital quality is not significant. Still, its indirect effect and total effect are significantly negative; the improvement in the quality of human capital in this region is not conducive to upgrading manufacturing nearby. Solving the mismatch between the existing human capital structure and the new demand for manufacturing industry upgrading is a topic for the future.
5.3. Robustness Test
In order to avoid regression endogeneity, this paper examined the robustness of the relationship between MIU and GFD by gradually adding control variables. First, four control variables that affect MIU were introduced into the model: government support, urbanization level, foreign direct investment, and human capital level, and then the level of transportation was added to perform regression again. The results are shown in Table 9.
It can be seen in Table 10 that the coefficient of GFD on MIU does not change fundamentally after the newly added control variable, transportation level, indicating that the relationship between GFD and MIU is robust.
Table 10.
Robustness test.
6. Conclusions and Policy Recommendations
6.1. Conclusions
This paper used panel data from 2010 to 2019 to conduct a spatial econometric empirical analysis of the effect of GF on MIU in China’s YREB. The economic geography matrix among provinces was established using Moran’s index. The global spatial autocorrelation and the local spatial correlation between regions were tested, and the SDM was selected to study the industrial upgrading of the manufacturing industry. The conclusions reached for this paper after the analyses and estimations attained are as follows:
First, from the empirical results of the time-fixed SDM regression, GF has a significant positive impact on the MIU of the YREB. GF has good positive spatial spillover effects. Therefore, the experience of developing GF in surrounding areas can serve as an excellent template for the development of the region. The environmental pressure faced by the surrounding areas will force the region to vigorously develop green finance and actively promote the local manufacturing industry. Thus, the innovation of enterprises can effectively improve the MIU level.
Second, each control variable has a different effect on upgrading. The high level of urbanization has a positive impact on MIU in total; government fiscal expenditure in the manufacturing industry has a significant negative impact; increasing foreign investment will have a significant adverse effect on upgrading; and the quality of human capital has no significant effect.
6.2. Policy Recommendations
- (1)
- Vigorously develop green finance. At the national level, overall planning must first be carried out to further improve the GF system. A complete, clear, and concise GF catalog ought to be built, and the scope of the existing green financial standards should be expanded. Second, it is necessary to establish more green financial intermediary institutions to provide services for parties who in need of green finance. These institutions alleviate the information asymmetry problem and reduce financing costs. Finally, the green capital market must be further opened. Capital market financial instruments with lower costs and a higher degree of freedom in borrowing time can both be used to solve the problem of corporate capital term mismatch. Local governments can make plans for promoting green financials based on regional conditions and regional realities. It is necessary to make full use of financial institutions in guiding the market, innovating GF products, and leading the flow of funds to green industries.
- (2)
- Optimizing the environment for manufacturing upgrading. The scale of financial support should be effectively controlled within a reasonable range. Financial means such as subsidies and taxes can be used appropriately to make the transition smoother over a short period; however, blindly expanding financial support will result in ineffective financial waste and excessive dependence on finance. Optimization of the transportation network should be continued. All provinces and cities should build a transportation network with the comprehensive development of water, land, and air to save time and cost in the transportation process and speed up the flow of production factors and talents in the province. Foreign capital should be used rationally. High-quality foreign capital has a good effect on upgrading, but the blind introduction of foreign capital will affect the healthy development of the manufacturing industry. The quality of the supervision of the introduction of foreign capital should be strengthened.
- (3)
- Cultivate green and high-quality talents. Talent is the key factor to realizing MIU, and the development of green talents should be strengthened from three aspects. First is an innovative talent training model. Universities and enterprises should be guided to connect and build a two-way talent cultivation base. Green vocational education should be strengthened. A talent team should be cultivated according to the needs of an enterprise’s transformation to reduce the learning costs of employees. Secondly, external experts can also be hired to provide good strategies for enterprise transformation from the perspective of top-level design. Last, differentiated talent policies should be implemented. The eastern provinces and cities with leading economic levels and obvious talent advantages should actively absorb advanced green transformation talents in the future and be at the forefront of green transformation and upgrading. The central provinces in the economic belt should their increase investments in education and vigorously cultivate local green technical talents. For western provinces where the MIU level is relatively lagging and the GFD is insufficient, it is necessary to accumulate human capital resources, strengthen the local education and training at all stages, and improve the quality of the labor force.
Author Contributions
Conceptualization, X.Z. and D.T.; methodology, Z.S.; software, Z.S.; validation, D.T., Z.S., and X.Z.; formal analysis, X.Z., Z.S., D.T. and X.W.; investigation, X.Z.; resources, X.Z.; data curation, X.Z. and D.T.; writing—original draft preparation, X.Z., D.T. and Z.S.; writing—review and editing, X.Z., Z.S., D.T. and X.W.; visualization, X.W.; supervision, D.T.; project administration, D.T.; funding acquisition, X.Z. and D.T. All authors have read and agreed to the published version of the manuscript.
Funding
This research was funded by Social Science Foundation of Jiangsu Province of China: A study on low carbon upgrading of high energy-consuming manufacturing industries in Jiangsu Province driven by digital, Grant No. 22EYD006.
Institutional Review Board Statement
Not applicable.
Informed Consent Statement
Not applicable.
Data Availability Statement
Data available on request.
Acknowledgments
We would like to thank Valentina Boamah for her contributions in polishing the language and content of the paper.
Conflicts of Interest
The authors declare no conflict of interest.
References
- Yan, Z.; Sun, Z.; Shi, R.; Zhao, M. Smart city and green development: Empirical evidence from the perspective of green technological innovation. Technol. Forecast. Soc. Change 2023, 191, 122507. [Google Scholar] [CrossRef]
- Jin, P.; Peng, C.; Song, M. Macroeconomic uncertainty, high-level innovation, and urban green development performance in China. China Econ. Rev. 2019, 55, 1–18. [Google Scholar] [CrossRef]
- Sun, C.; Tong, Y.; Zou, W. The evolution and a temporal-spatial difference analysis of green development in China. Sustain. Cities Soc. 2018, 41, 52–61. [Google Scholar] [CrossRef]
- Wang, Z.W. Chinese product surplus, overcapacity and economic structure adjustment. For. Econ. Chin. Res. Rep. 2011, 9, 351–357. [Google Scholar]
- Zhang, J.; Chang, Y.; Zhang, L.; Li, D. Do technological innovations promote urban green development?—A spatial econometric analysis of 105 cities in China. J. Clean. Prod. 2018, 182, 395–403. [Google Scholar] [CrossRef]
- Jiang, M.; Luo, S.; Zhou, G. Financial development, OFDI spillovers and upgrading of industrial structure. Technol. Forecast. Soc. Change 2020, 155, 119974. [Google Scholar] [CrossRef]
- Cao, J.; Law, S.H.; Samad, A.R.B.A.; Mohamad, W.N.B.W.; Wang, J.; Yang, X. Effect of financial development and technological innovation on green growth—Analysis based on spatial Durbin model. J. Clean. Prod. 2022, 365, 132865. [Google Scholar] [CrossRef]
- Wang, R. Evaluation of China’s Green Finance Governance Effect and Green Policy Choice—Based on the Micro Data of 334 Public Companies. Macroecon. Res. 2021, 6, 133–145. [Google Scholar]
- Grossman, G.; Krueger, A. Environmental Impacts of a North American Free Trade Agreement; NBER Working Paper No. 3914; National Bureau of Economic Research, Inc.: Cambridge, MA, USA, 1991. [Google Scholar]
- Chowdhury, T.; Datta, R.; Mohajan, H. Green finance is essential for economic development and sustainability. Int. J. Res. Commer. Econ. Manag. 2013, 3, 104–108. [Google Scholar]
- Höhne, N.; Khosla, S.; Fekete, H.; Gilbert, A. Mapping of Green Finance Delivered by IDFC Members in 2011; Ecofys: Cologne, Germany, 2012. [Google Scholar]
- Mohd, S.; Kaushal, V.K. Green Finance: A Step towards Sustainable Development. MUDRA J. Financ. Account. 2018, 5, 59–74. [Google Scholar] [CrossRef]
- Abakah, E.J.A.; Nasreen, S.; Tiwari, A.K.; Lee, C.-C. U.S. leveraged loan and debt markets: Implications for optimal portfolio and hedging. Int. Rev. Financial Anal. 2023, 87, 102514. [Google Scholar] [CrossRef]
- Bai, J.; Chen, Z.; Yan, X.; Zhang, Y. Research on the impact of green finance on carbon emissions: Evidence from China. Econ. Res.-Ekon. Istraživanja 2022, 35, 6965–6984. [Google Scholar] [CrossRef]
- Zhu, X.D.; Huang, Y.Y.; Zhu, S.J.; Huang, H.F. China’s polluting industry technological innovation and its spatial differences under the influence of green finance. Geogr. Sci. 2021, 41, 777–787. [Google Scholar]
- Xie, Q.X. Environmental Regulation, Green Finance Development and Enterprise Technology Innovation. Sci. Res. Manag. 2021, 42, 65–72. [Google Scholar]
- Hu, G.; Wang, X.; Wang, Y. Can the green credit policy stimulate green innovation in heavily polluting enterprises? Evidence from a quasi-natural experiment in China. Energy Econ. 2021, 98, 105134. [Google Scholar] [CrossRef]
- He, L.; Liu, R.; Zhong, Z.; Wang, D.; Xia, Y. Can green financial development promote renewable energy investment efficiency? A consideration of bank credit. Renew. Energy 2019, 143, 974–984. [Google Scholar] [CrossRef]
- Liu, R.; Wang, D.; Zhang, L.; Zhang, L. Can green financial development promote regional ecological efficiency? A case study of China. Nat. Hazards 2019, 95, 325–341. [Google Scholar] [CrossRef]
- Sinha, A.; Mishra, S.; Sharif, A.; Yarovaya, L. Does green financing help to improve environmental & social responsibility? Designing SDG framework through advanced quantile modelling. J. Environ. Manag. 2021, 292, 112751. [Google Scholar] [CrossRef]
- Wang, F.; Wang, R.; He, Z. The impact of environmental pollution and green finance on the high-quality development of energy based on spatial Dubin model. Resour. Policy 2021, 74, 102451. [Google Scholar] [CrossRef]
- Rodrik, D. Growth after the Crisis; Centre for Economic Policy Research: London, UK, 2009; p. 02138. [Google Scholar]
- Gereffi, G. International trade and industrial upgrading in the apparel commodity chain. J. Int. Econ. 1999, 48, 37–70. [Google Scholar] [CrossRef]
- Poon, T.S.C. Beyond the global production networks: A case of further upgrading of Taiwan’s information technology industry. Int. J. Technol. Glob. 2004, 1, 130–144. [Google Scholar] [CrossRef]
- Porter, M.E. Competitive Advantage of Nations: Creating and Sustaining Superior Performance; Simon and Schuster: New York, NY, USA, 2011. [Google Scholar]
- Rostow, W.W. The Stages of Economic Growth: A Non-Communist Manifesto; Cambridge University Press: Cambridge, UK, 1990. [Google Scholar]
- Morrow, P.M.; Trefler, D. How do endowments determine trade? quantifying the output mix, factor price, and skill-biased technology channels. J. Int. Econ. 2022, 137, 103620. [Google Scholar] [CrossRef]
- Liu, S.; He, W.; Chen, X.; Zhang, J. Innovation Ecosystem and Innovation Cooperation Networks: The Embeddedness of Global Innovation Chain of Guangdong’s Manufacturing Sectors towards Industry 4.0. In Proceedings of the 2020 IEEE International Conference on Artificial Intelligence and Computer Applications (ICAICA), Dalian, China, 27–29 June 2020; pp. 1161–1165. [Google Scholar]
- Romer, P.M. The origins of endogenous growth. J. Econ. Perspect. 1994, 8, 3–22. [Google Scholar] [CrossRef]
- Steenhuis, H.-J.; Pretorius, L. The additive manufacturing innovation: A range of implications. J. Manuf. Technol. Manag. 2017, 28, 122–143. [Google Scholar] [CrossRef]
- Cheng, Z.; Li, L.; Liu, J. Industrial structure, technical progress and carbon intensity in China’s provinces. Renew. Sustain. Energy Rev. 2018, 81, 2935–2946. [Google Scholar] [CrossRef]
- Du, K.; Cheng, Y.; Yao, X. Environmental regulation, green technology innovation, and industrial structure upgrading: The road to the green transformation of Chinese cities. Energy Econ. 2021, 98, 105247. [Google Scholar] [CrossRef]
- Zhu, W.; Zhu, Y.; Lin, H.; Yu, Y. Technology progress bias, industrial structure adjustment, and regional industrial economic growth motivation—Research on regional industrial transformation and upgrading based on the effect of learning by doing. Technol. Forecast. Soc. Change 2021, 170, 120928. [Google Scholar] [CrossRef]
- Han, Y.; Zhang, F.; Huang, L.; Peng, K.; Wang, X. Does industrial upgrading promote eco-efficiency? ─A panel space estimation based on Chinese evidence. Energy Policy 2021, 154, 112286. [Google Scholar] [CrossRef]
- Ge, T.; Cai, X.; Song, X. How does renewable energy technology innovation affect the upgrading of industrial structure? The moderating effect of green finance. Renew. Energy 2022, 197, 1106–1114. [Google Scholar] [CrossRef]
- Fang, Y.; Shao, Z. Whether green finance can effectively moderate the green technology innovation effect of heterogeneous environmental regulation. Int. J. Environ. Res. Public Health 2022, 19, 3646. [Google Scholar] [CrossRef] [PubMed]
- Gramkow, C.; Anger-Kraavi, A. Developing green: A case for the brazilian manufacturing industry. Sustainability 2019, 11, 6783. [Google Scholar] [CrossRef]
- Xie, R.; Teo, T.S. Green technology innovation, environmental externality, and the cleaner upgrading of industrial structure in China—Considering the moderating effect of environmental regulation. Technol. Forecast. Soc. Change 2022, 184, 122020. [Google Scholar] [CrossRef]
- Zhou, X.; Cai, Z.; Tan, K.H.; Zhang, L.; Du, J.; Song, M. Technological innovation and structural change for economic development in China as an emerging market. Technol. Forecast. Soc. Change 2021, 167, 120671. [Google Scholar] [CrossRef]
- Xie, X.M.; Huo, J.G.; Zou, H.L. Green process innovation, green product innovation, and corporate financial performance: A content analysis method. J. Bus. Res. 2019, 101, 697–706. [Google Scholar] [CrossRef]
- Hu, D.; Jiao, J.; Tang, Y.; Xu, Y.; Zha, J. How global value chain participation affects green technology innovation processes: A moderated mediation model. Technol. Soc. 2022, 68, 101916. [Google Scholar] [CrossRef]
- Xu, L.; Fan, M.; Yang, L.; Shao, S. Heterogeneous green innovations and carbon emission performance: Evidence at China’s city level. Energy Econ. 2021, 99, 105269. [Google Scholar] [CrossRef]
- Kemp, R.; Never, B. Green transition, industrial policy, and economic development. Oxf. Rev. Econ. Policy 2017, 33, 66–84. [Google Scholar] [CrossRef]
- Arfi, W.B.; Hikkerova, L.; Sahut, J.M. External knowledge sources, green innovation and performance. Technol. Forecast. Soc. Change 2018, 129, 210–220. [Google Scholar] [CrossRef]
- Yan, Z.; Zou, B.; Du, K.; Li, K. Do renewable energy technology innovations promote China’s green productivity growth? Fresh evidence from partially linear functional-coefficient models. Energy Econ. 2020, 90, 104842. [Google Scholar] [CrossRef]
- Li, K.; Qi, S.; Shi, X. Environmental policies and low-carbon industrial upgrading: Heterogenous effects among policies, sectors, and technologies in China. Technol. Forecast. Soc. Change 2023, 191, 122468. [Google Scholar] [CrossRef]
- Anselin, L. Lagrange multiplier test diagnostics for spatial dependence and spatial heterogeneity. Geogr. Anal. 1988, 20, 1–17. [Google Scholar] [CrossRef]
- Zhang, M.; Liu, Y. Influence of digital finance and green technology innovation on China’s carbon emission efficiency: Empirical analysis based on spatial metrology. Sci. Total Environ. 2022, 838, 156463. [Google Scholar] [CrossRef]
- Zhang, H.; Geng, C.; Wei, J. Coordinated development between green finance and environmental performance in China: The spatial-temporal difference and driving factors. J. Clean. Prod. 2022, 346, 131150. [Google Scholar] [CrossRef]
- Le Gallo, J. Cross-Section Spatial Regression Models. In Handbook of Regional Science; Springer: Berlin/Heidelberg, Germany, 2021; pp. 2117–2139. [Google Scholar] [CrossRef]
- Huang, Y.; Chen, C.; Lei, L.; Zhang, Y. Impacts of green finance on green innovation: A spatial and nonlinear perspective. J. Clean. Prod. 2022, 365, 132548. [Google Scholar] [CrossRef]
- Liu, Y.; Lei, J.; Zhang, Y. A Study on the sustainable relationship among the green finance, environment regulation and green-total-factor productivity in China. Sustainability 2021, 13, 11926. [Google Scholar] [CrossRef]
- The National Bureau of Statistics of China. Available online: http://www.stats.gov.cn/ (accessed on 8 April 2018).
- The China Statistical Yearbook. Available online: http://www.stats.gov.cn/sj/zgtjnj/ (accessed on 4 April 2023).
- Provincial Statistical Yearbooks. Available online: https://tjj.sh.gov.cn/tjnj/index.html (accessed on 4 April 2023).
- Provincial Statistical Yearbooks. Available online: https://tj.jiangsu.gov.cn/col/col87172/index.html (accessed on 4 April 2023).
- Provincial Statistical Yearbooks. Available online: http://tjj.zj.gov.cn/col/col1525563/index.html (accessed on 4 April 2023).
- Provincial Statistical Yearbooks. Available online: http://tjj.ah.gov.cn/ssah/qwfbjd/tjnj/index.html (accessed on 4 April 2023).
- Provincial Statistical Yearbooks. Available online: http://tjj.jiangxi.gov.cn/col/col38595/index.html (accessed on 4 April 2023).
- Provincial Statistical Yearbooks. Available online: http://tjj.hunan.gov.cn/tjsj/tjnj/ (accessed on 4 April 2023).
- Provincial Statistical Yearbooks. Available online: https://tjj.hubei.gov.cn/tjsj/sjkscx/tjnj/qstjnj/ (accessed on 4 April 2023).
- Provincial Statistical Yearbooks. Available online: http://tjj.cq.gov.cn/zwgk_233/tjnj/ (accessed on 4 April 2023).
- Provincial Statistical Yearbooks. Available online: http://stats.yn.gov.cn/tjsj/tjnj/ (accessed on 4 April 2023).
- Provincial Statistical Yearbooks. Available online: http://stjj.guizhou.gov.cn/tjsj_35719/sjcx_35720/gztjnj_40112/ (accessed on 4 April 2023).
- Provincial Statistical Yearbooks. Available online: http://tjj.sc.gov.cn/scstjj/c105855/nj.shtml (accessed on 4 April 2023).
- The CSMAR database. Available online: https://www.gtarsc.com/ (accessed on 4 April 2023).
- The Wind database. Available online: https://www.wind.com.cn/ (accessed on 4 April 2023).


Disclaimer/Publisher’s Note: The statements, opinions and data contained in all publications are solely those of the individual author(s) and contributor(s) and not of MDPI and/or the editor(s). MDPI and/or the editor(s) disclaim responsibility for any injury to people or property resulting from any ideas, methods, instructions or products referred to in the content. |
© 2023 by the authors. Licensee MDPI, Basel, Switzerland. This article is an open access article distributed under the terms and conditions of the Creative Commons Attribution (CC BY) license (https://creativecommons.org/licenses/by/4.0/).