
An Approach for Measuring Complexity Degree of International Engineering Projects

Abstract
1. Introduction
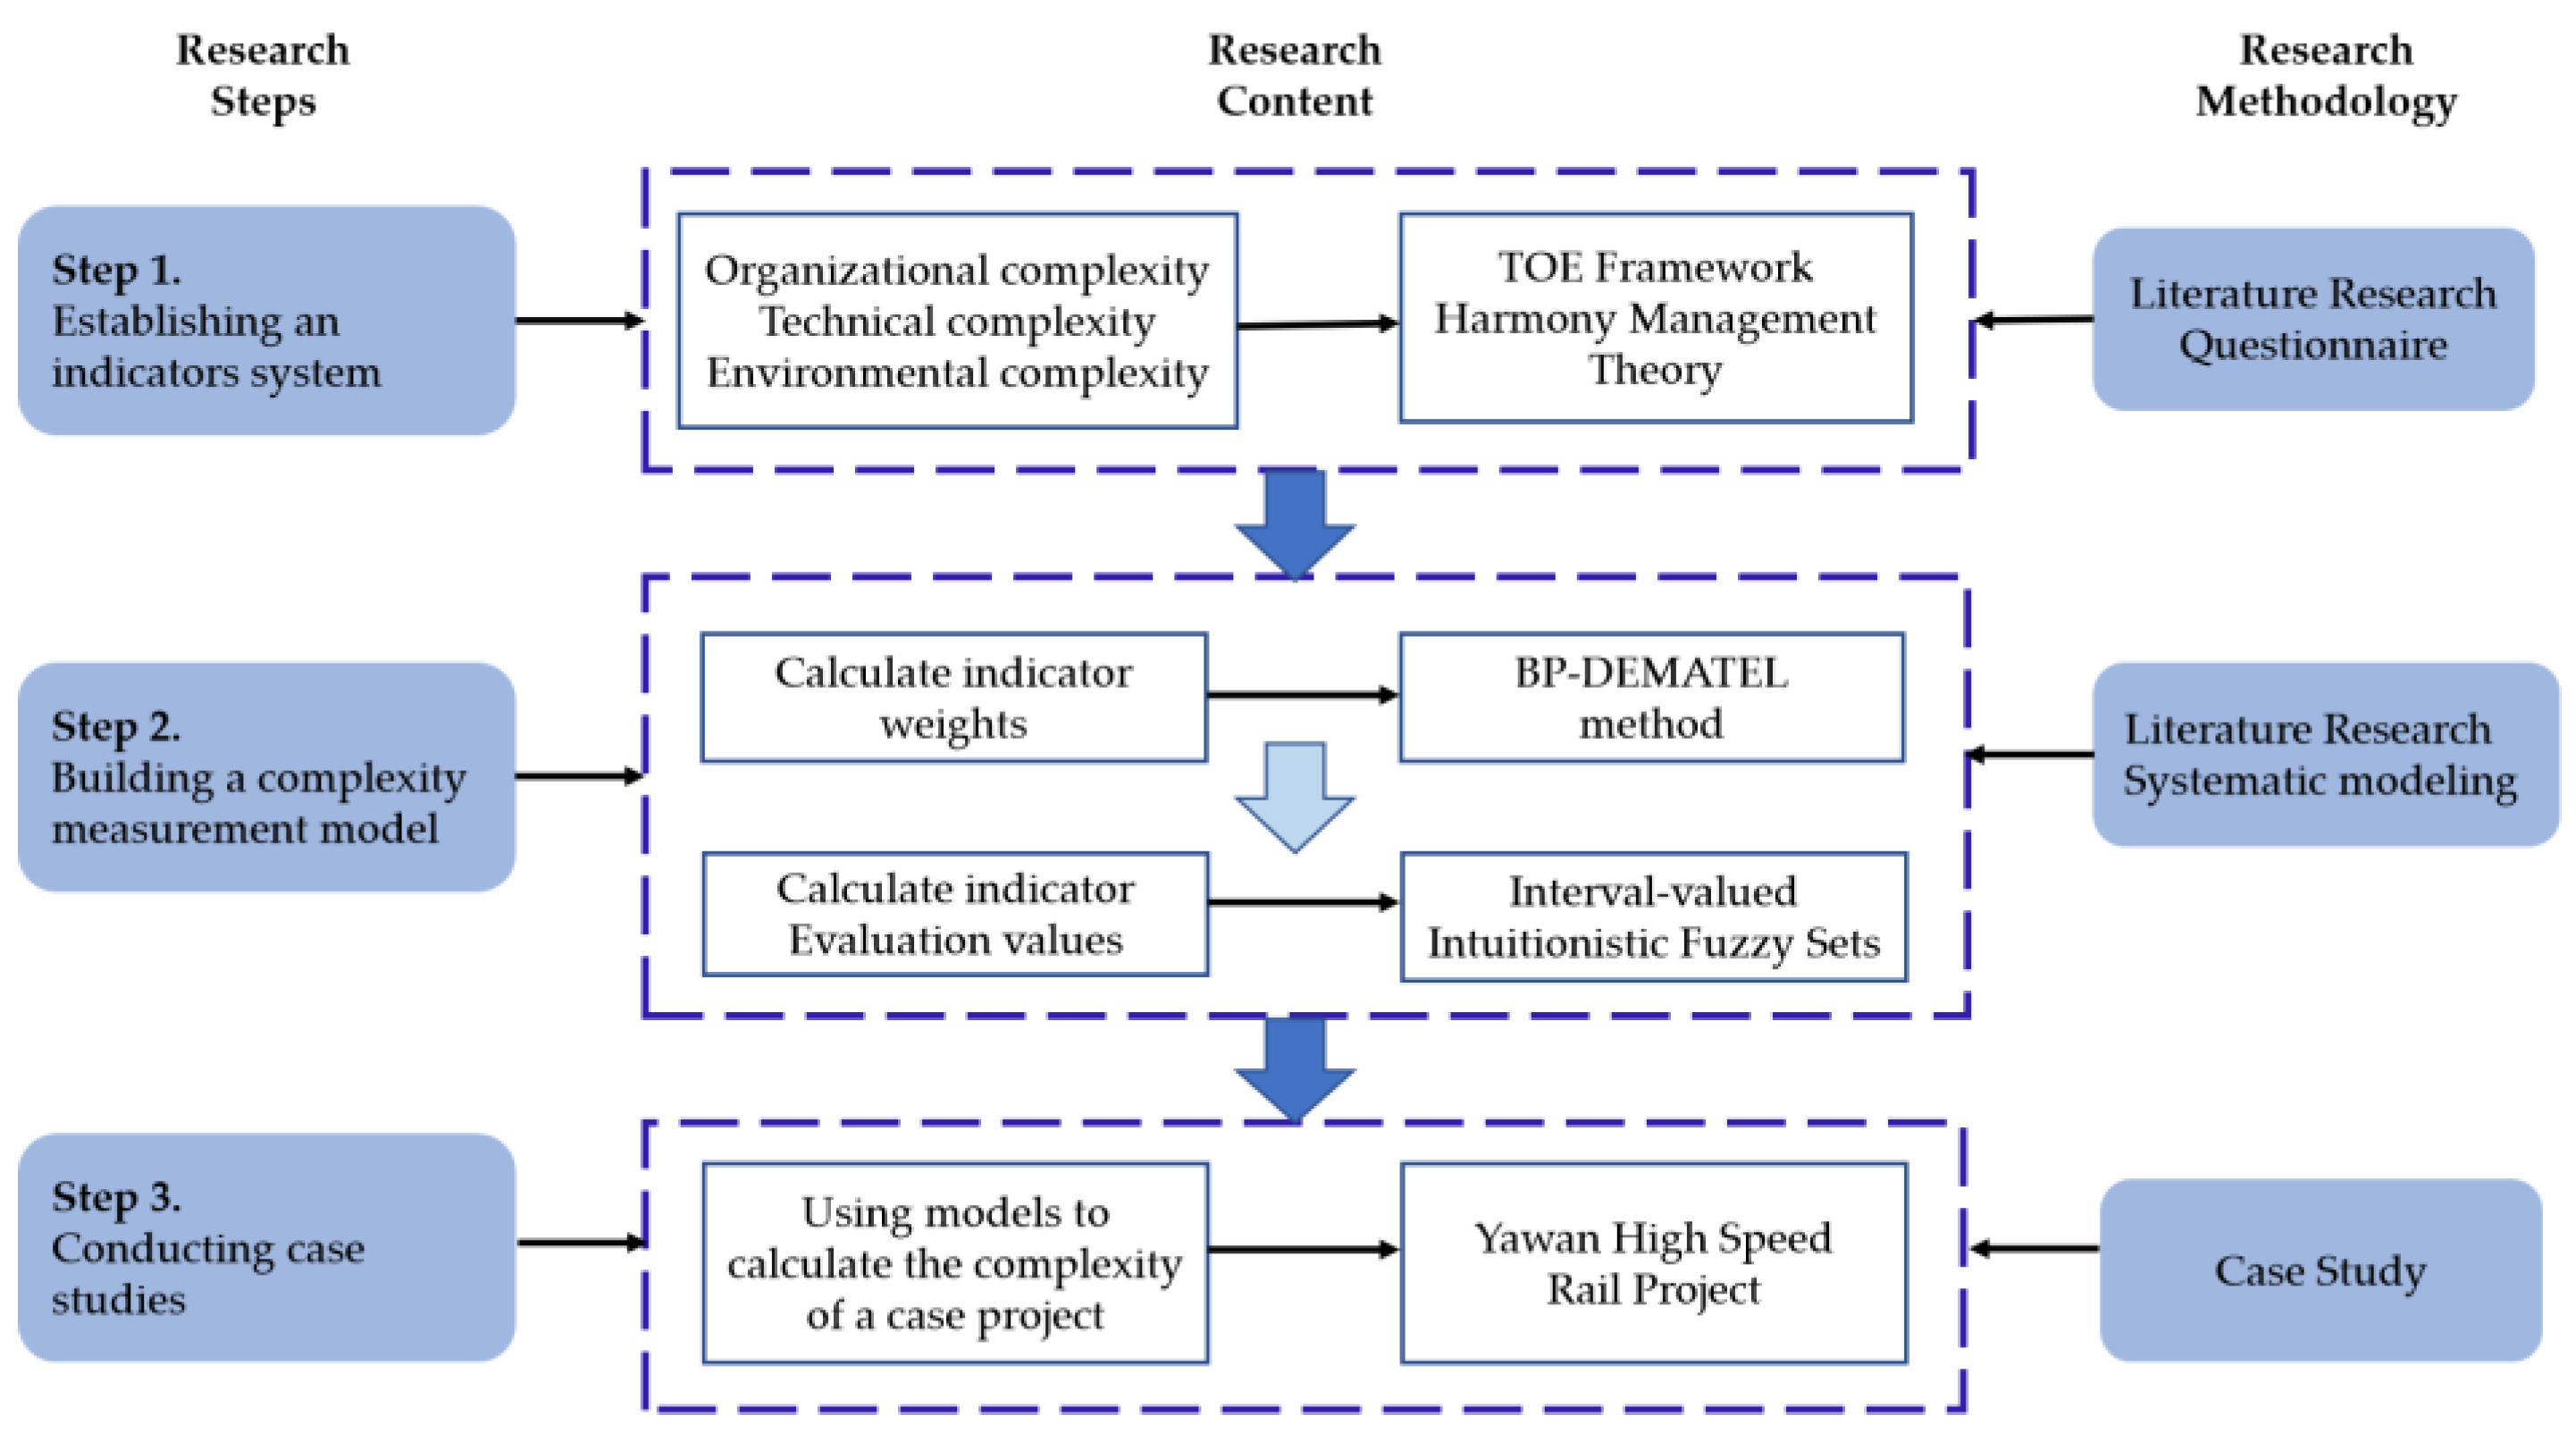
2. Methodology
3. Indicator System for International Engineering Projects Complexity (CIEPs)
3.1. Overall Framework for CIEPs Indicator Selection
3.2. Organizational Complexity
- (1)
- Discordance between different elements
- (2)
- Discordance of the ideal state and actual state of a certain element
- (3)
- Quantification of the fit between the elements
- (4)
- Dissonance of the elements
- (5)
- Dissonance of subsystems
3.3. Technical Complexity
3.4. Environmental Complexity
3.5. Constructing the Evaluation Index System of International Engineering Complexity
4. Measurements for CIEPs
4.1. BP-DEMATEL Method to Determine the Index Weights
- (1)
- Construction of expert evaluation matrix
- (2)
- Construction of BP neural network model
- (3)
- Training network
- (4)
- Obtain expert evaluation correction values
- (5)
- Construction of direct correlation matrix
- (6)
- Normalized direct correlation matrix
- (7)
- Construct the full correlation matrix T
- (8)
- Based on the full correlation matrix, the centrality and causality of each indicator are obtained
- (9)
- The centrality is normalized, i.e., the weight profile of each complexity influencing factor is obtained
4.2. Determination of Index Evaluation Value Based on Interval Intuitionistic Fuzzy Set
- (1)
- Expert Evaluation
- (2)
- Build interval intuitionistic fuzzy sets
- (3)
- Find the weight of each expert to give the evaluation value of the index
- (4)
- To derive the comprehensive evaluation value of expert evaluation information
- (5)
- The final evaluation value is derived
- (6)
- Score function can be expressed as follows:
5. Case Study
5.1. Project Overview and Data Collection
5.2. BP-DEMATEL Model Construction of International Engineering Complexity Influencing Factors
5.3. Application of Interval Intuitionistic Fuzzy Sets
5.4. Analysis of Evaluation Results
5.4.1. Measures for Managing Organizational Complexity
5.4.2. Management Measures for Technical Complexity
5.4.3. Management Measures for Environmental Complexity
6. Conclusions
- (1)
- For measuring the complexity of international engineering projects, three aspects of technical, organizational, and environmental complexity are needed. Meanwhile, in order to consider the influence of uncertainty of human elements on the complexity of international engineering projects, it is necessary to divide the influencing factors of complexity into human elements and physical elements based on the harmony theory.
- (2)
- Among the technical, organizational, and environmental complexity of Yawan high-speed rail project, technical complexity scored the highest, and T1 (diversity of technology types) is the most important aspect. Environmental complexity was in the middle, with E3 (the extent to which local policies and regulations differ from domestic ones) being the most important indicator. Organizational complexity has the lowest score, with O3 (dissonance of internal environment) being the most important indicator.
- (3)
- Combined with our findings, this study makes the following recommendations: (i) Strengthen the management of technology in stages and tasks and improve the efficiency of the use of technological tools, (ii) pay attention to the degree of differences in domestic and foreign policies and regulations, and when disputes occur, strengthen ex ante and ex post controls and summaries, (iii) improve the work and living standards of project labor and staff, strengthen interpersonal communication, communication, and cooperation, and focus on project staff’s psychological condition.
Author Contributions
Funding
Informed Consent Statement
Data Availability Statement
Acknowledgments
Conflicts of Interest
References
- Alencar, L.; Alencar, M.; Lima, L.; Alencar, M.; Silva, L. Sustainability in the Construction Industry: A Systematic Review of the Literature. J. Clean. Prod. 2020, 289, 125730. [Google Scholar]
- Chen, X.; Chang-Richards, A.Y.; Pelosi, A.; Jia, Y.; Shen, X.; Siddiqui, M.K.; Yang, N. Implementation of technologies in the construction industry: A systematic review. Eng. Constr. Archit. Manag. 2021. ahead of print. [Google Scholar] [CrossRef]
- Okudan, O.; Budayan, C.; Dikmen, I. A Knowledge-Based Risk Management Tool for Construction Projects using Case-based Reasoning. Expert Syst. Appl. 2021, 173, 114776. [Google Scholar] [CrossRef]
- Pan, Y.; Zhang, L. Roles of artificial intelligence in construction engineering and management: A critical review and future trends. Autom. Constr. 2021, 122, 103517. [Google Scholar] [CrossRef]
- Zhu, J.; Mostafavi, A. Discovering complexity and emergent properties in project systems: A new approach to understanding project performance. Int. J. Proj. Manag. 2017, 35, 1–12. [Google Scholar] [CrossRef]
- Wang, S.; Han, T.; Chen, X. The Impact of Construction Project Complexity on Performance: An Empirical Study from China’s Construction Industry. For. Chem. Rev. 2021, 1228–1242. [Google Scholar]
- Vrchota, J.; Eho, P.; Maíková, M.; Pech, M. Critical Success Factors of the Project Management in Relation to Industry 4.0 for Sustainability of Projects. Sustainability 2020, 13, 281. [Google Scholar] [CrossRef]
- Ngowi, A.B.; Pienaar, E.; Talukhaba, A.; Mbachu, J. The globalisation of the construction industry—A review. Build. Environ. 2005, 40, 135–141. [Google Scholar] [CrossRef]
- Bashan, A.; Kordova, S. Globalization, quality and systems thinking: Integrating global quality Management and a systems view. Heliyon 2021, 7, e06161. [Google Scholar] [CrossRef] [PubMed]
- Long, H.; Zhang, Y.; Ma, L.; Tu, S. Land Use Transitions: Progress, Challenges and Prospects. Land 2021, 10, 903. [Google Scholar] [CrossRef]
- Yang, J.; Cheng, Q. The Impact of Organisational Resilience on Construction Project Success: Evidence from Large-Scale Construction in China. J. Civ. Eng. Manag. 2020, 26, 775–788. [Google Scholar] [CrossRef]
- Viswanathan, S.K.; Jha, K.N. Critical risk factors in international construction projects: An Indian perspective. Eng. Constr. Archit. Manag. 2020. ahead of print. [Google Scholar] [CrossRef]
- Gaterell, M.; Hutchinson, D.; Faris, H. Investigating underlying factors of collaboration for construction projects in emerging economies using exploratory factor analysis. Int. J. Constr. Manag. 2022, 22, 514–526. [Google Scholar]
- Baccarini, D. The concept of project complexity—A review. Int. J. Proj. Manag. 1996, 14, 201–204. [Google Scholar] [CrossRef]
- Bosch-Rekveldt, M.; Jongkind, Y.; Mooi, H.; Bakker, H.; Verbraeck, A. Grasping project complexity in large engineering projects: The TOE (Technical, Organizational and Environmental) framework. Int. J. Proj. Manag. 2011, 29, 728–739. [Google Scholar] [CrossRef]
- Gao, N.; Chen, Y.; Wang, W.; Wang, Y. Addressing Project Complexity: The Role of Contractual Functions. J. Manag. Eng. 2018, 34, 04018011. [Google Scholar] [CrossRef]
- Wu, W.; Hou, Y.; Cheng, H. Engineering project management in the perspective of harmony management theory. J. Chongqing Univ. Constr. 2007, 29, 129–132. (In Chinese) [Google Scholar]
- Tang, F.; Ma, J.; Xi, Y. The coupling mechanism of harmonious management and its emergence of complexity. Syst. Eng. Theory Pract. 2004, 24, 68–75. (In Chinese) [Google Scholar]
- Xi, Y.; Xiong, C.; Liu, P. Review on Harmonious Management Theory and its Application Review. Manag. World 2020, 36, 16. (In Chinese) [Google Scholar]
- Xia, B.; Chan, A. Measuring complexity for building projects: A Delphi study. Engineering 2012, 19, 7–24. [Google Scholar] [CrossRef]
- He, Q.; Luo, L.; Hu, Y.; Chan, A.P. Measuring the complexity of mega construction projects in China—A fuzzy analytic network process analysis. Int. J. Proj. Manag. 2015, 33, 549–563. [Google Scholar] [CrossRef]
- Nguyen, A.T.; Nguyen, L.D.; Long, L.H.; Dang, C.N. Quantifying the complexity of transportation projects using the fuzzy analytic hierarchy process. Int. J. Proj. Manag. 2015, 33, 1364–1376. [Google Scholar] [CrossRef]
- Cui, K. Research on prediction model of geotechnical parameters based on BP neural network. Neural Comput. Appl. 2019, 31, 8205–8215. [Google Scholar] [CrossRef]
- Kim, S.; Nguyen, M.V. Mapping the Complexity of International Development Projects Using DEMATEL Technique. J. Manag. Eng. 2021, 37, 05020016. [Google Scholar] [CrossRef]
- Pan, Y.; Zhang, L.; Li, Z.W.; Ding, L. Improved Fuzzy Bayesian Network-Based Risk Analysis with Interval-Valued Fuzzy Sets and D-S Evidence Theory. IEEE Trans. Fuzzy Syst. 2019, 28, 2063–2077. [Google Scholar] [CrossRef]
- Li, J.; Wang, J.; Chen, G. Research on the harmony of engineering project management. Mod. Sci. Manag. 2008, 104–105. (In Chinese) [Google Scholar] [CrossRef]
- Yazdi, M.; Khan, F.; Abbassi, R.; Rusli, R. Improved DEMATEL methodology for effective safety management decision-making. Saf. Sci. 2020, 127, 104705. [Google Scholar] [CrossRef]
- Abdullah, L.; Zulkifli, N. A new DEMATEL method based on interval type-2 fuzzy sets for developing causal relationship of knowledge management criteria. Neural Comput. Appl. 2019, 31, 4095–4111. [Google Scholar] [CrossRef]
- Lee, Y.; Hu, H.; Yen, T.; Lee, Y.C. Kano’s Model and Decision Making Trial and Evaluation Laboratory Applied to Order Winners and Qualifiers Improvement: A Study of the Computer Industry. Inf. Technol. J. 2008, 7, 702–714. [Google Scholar] [CrossRef]
- Wang, Y.; Tian, L.; Chen, Z. A Reputation Bootstrapping Model for Ecommerce Based on Fuzzy DEMATEL Method and Neural Network. IEEE Access 2019, 7, 52266–52276. [Google Scholar] [CrossRef]
- Atanassov, K.T. Intuitionistic fuzzy sets. Fuzzy Sets Syst. 1986, 20, 87–96. [Google Scholar] [CrossRef]
- Hong, D.H.; Choi, C.H. Multicriteria fuzzy decision-making problems based on vague set theory. Fuzzy Sets Syst. 2000, 114, 103–113. [Google Scholar] [CrossRef]
- Song, Y. Divergence-based cross entropy and uncertainty measures of Atanassov’s intuitionistic fuzzy sets with their application in decision making. Appl. Soft Comput. 2019, 84, 105703. [Google Scholar] [CrossRef]
- Atanassov, K.; Gargov, G. Interval valued intuitionistic fuzzy sets. Fuzzy Sets Syst. 1989, 31, 343–349. [Google Scholar] [CrossRef]
- Liu, Y.; Jiang, W. A new distance measure of interval-valued intuitionistic fuzzy sets and its application in decision making. Soft Comput. 2020, 24, 6987–7003. [Google Scholar] [CrossRef]
- Ashtiani, B.; Haghighirad, F.; Makui, A.; Ali Montazer, G. Extension of fuzzy TOPSIS method based on interval-valued fuzzy sets. Appl. Soft Comput. 2009, 9, 457–461. [Google Scholar] [CrossRef]
- Asiain, M.J.; Bustince, H.; Mesiar, R.; Kolesarova, A.; Takáč, Z. Negations with Respect to Admissible Orders in the Interval-Valued Fuzzy Set Theory. IEEE Trans. Fuzzy Syst. 2017, 26, 556–568. [Google Scholar] [CrossRef]
- de Bruijn, H.; de Jong, P.; Korsten, A.; van Zanten, W. Grote Projecten: Besluitvorming & Management. Alphen Aan Den Rijn Ned. Samsom HD Tjeenk Willink 1996. [Google Scholar]
- Xi, Y.; Wang, Y.; Li, H. Management School, Xi’an Jiaotong University, Xi’an, China. Harmony Theory. Syst. Sci. Syst. Eng. 1993, 14. [Google Scholar]
- Xi, Y.; Wang, Y.; Li, H. Diagnostic model of system state harmony. J. Manag. Eng. 1989, Z1, 1–10+26. (In Chinese) [Google Scholar]
- Huang, D.; Xi, Y. Theoretical basis of harmonious management: Interpretation of harmony. J. Manag. Eng. 2001, 3, 69–72. (In Chinese) [Google Scholar]
- Lan, L.; He, Q.; Jaselskis, E.J.; Xie, J. Construction Project Complexity: Research Trends and Implications. J. Constr. Eng. Manag. 2017, 143, 04017019. [Google Scholar]
- Xi, Y.; Xiao, H.; Wang, H. The proposal of harmonious management theory and the new development of its principle. J. Manag. 2005, 2, 10. (In Chinese) [Google Scholar]
- He, Q.; Tian, Z.; Luo, L. Construction of the complexity dimension model of Chinese major engineering based on rooted theory. China Sci. Technol. Forum 2021, 8, 126–134. (In Chinese) [Google Scholar]
- San Cristóbal, J.R.; Carral, L.; Diaz, E.; Fraguela, J.A.; Iglesias, G. Complexity and Project Management: A General Overview. Complexity 2018, 2018, 4891286. [Google Scholar] [CrossRef]
- Pheng, L.S.; Chuan, Q.T. Environmental factors and work performance of project managers in the construction industry. Int. J. Proj. Manag. 2006, 24, 24–37. [Google Scholar] [CrossRef]
- Zhang, S.; Qin, X.; Hu, S.; Zhang, Q.; Dong, B.; Zhao, J. Importance Degree Evaluation of Spare Parts Based on Clustering Algorithm and Back-Propagation Neural Network. Math. Probl. Eng. 2020, 2020, 6161825. [Google Scholar] [CrossRef]
- Wang, Z.; Li, K.W.; Wang, W. An approach to multiattribute decision making with interval-valued intuitionistic fuzzy assessments and incomplete weights. Inf. Sci. 2009, 179, 3026–3040. [Google Scholar] [CrossRef]
- Nayagam, V.; Muralikrishnan, S.; Sivaraman, G. Multi-criteria decision-making method based on interval-valued intuitionistic fuzzy sets. Expert Syst. Appl. 2011, 38, 1464–1467. [Google Scholar] [CrossRef]
- Yan, H.; Elzarka, H.; Gao, C.; Zhang, F.; Tang, W. Critical Success Criteria for Programs in China: Construction Companies’ Perspectives. J. Manag. Eng. 2019, 35, 04018048. [Google Scholar] [CrossRef]
- Dodanwala, T.C.; San Santoso, D.; Shrestha, P. The mediating role of work–family conflict on role overload and job stress linkage. Built Environ. Proj. Asset Manag. 2022, 12, 924–939. [Google Scholar] [CrossRef]
- Pamidimukkala, A.; Kermanshachi, S.; Nipa, T.J. Impacts of COVID-19 on Health and Safety of Workforce in Construction Industry. In Proceedings of the ASCE International Conference on Transportation & Development, Austin, TX, USA, 14–17 June 2021. [Google Scholar]
- Luo, L.; Zhang, L.; Yang, D.; He, Q. A probabilistic approach to assessing project complexity dynamics under uncertainty. Soft Comput. 2022, 26, 3969–3985. [Google Scholar] [CrossRef]
- Luo, H.; Liu, J.; Li, C.; Chen, K.; Zhang, M. Ultra-rapid delivery of specialty field hospitals to combat COVID-19: Lessons learned from the Leishenshan Hospital project in Wuhan. Autom. Constr. 2020, 119, 103345. [Google Scholar] [CrossRef]
- Tam, N.V.; Diep, T.N.; Toan, N.Q.; Le Dinh Quy, N. Factors affecting adoption of building information modeling in construction projects: A case of Vietnam. Cogent Bus. Manag. 2021, 8, 1918848. [Google Scholar]
- Amirtash, P.; Jalal, P.M.; Jelodar, B.M. Integration of project management services for International Engineering, Procurement and Construction projects. Built Environ. Proj. Asset Manag. 2021, 11, 330–349. [Google Scholar] [CrossRef]


| Indicators | Components (Indicator Description) |
|---|---|
| SQ-System Quality |
|
| |
| |
| |
| LE-Leadership Role |
|
| |
| |
| |
| |
| IE-Internal Environment |
|
| |
| |
|
| Target Layer | Category | Indicators | References |
|---|---|---|---|
| International Engineering Projects Complexity (CIEPs) | O-Organizational Complexity | O1-Dissonance of system qualities O2-Dissonance of leadership role O3-Dissonance of internal environment | [17,18,43] |
| T-Technical complexity | T1-Diversity of technology types T2-The difficulty of the technology T3-The degree of difference between technical specifications and technical standards and domestic T4-The degree of inappropriateness of various technologies and engineering | [15,16,21] | |
| E-Environmental Complexity | E1-Instability of the political, economic, and social environment in the project country E2-The level of non-support for the project from the local government and people E3-The extent to which local policies and regulations differ from domestic ones E4-Likelihood of local natural disasters | [16,21,46] |
| Indicators | O1 | O2 | O3 | T1 | T2 | T3 | T4 | E1 | E2 | E3 | E4 |
|---|---|---|---|---|---|---|---|---|---|---|---|
| O1 | 2.98 | 4.54 | 3.25 | 3.98 | 3.60 | 1.78 | 1.23 | −0.04 | 2.86 | 1.10 | 0.06 |
| O2 | 2.78 | 2.75 | 4.03 | −1.28 | −0.04 | 4.83 | 1.28 | 2.35 | 3.54 | 1.08 | 1.22 |
| O3 | 2.22 | 2.00 | 2.76 | 2.02 | 3.13 | 0.93 | 1.43 | 1.96 | 1.12 | 2.32 | −0.65 |
| T1 | 3.60 | 2.00 | 1.89 | 2.60 | 2.19 | 2.57 | 4.43 | 0.45 | 1.30 | 2.93 | 2.48 |
| T2 | 2.86 | 1.69 | 2.83 | 3.59 | 3.20 | 2.07 | 0.47 | 1.25 | 3.31 | 3.03 | −2.43 |
| T3 | 4.26 | 2.75 | 2.12 | 2.17 | 2.30 | 3.00 | 3.11 | 1.89 | 9.14 | 1.91 | 1.76 |
| T4 | 1.95 | 3.09 | 2.96 | 3.42 | 3.72 | 4.20 | 2.80 | 1.81 | 2.51 | 1.82 | 0.07 |
| E1 | 2.95 | 1.89 | 2.36 | 3.44 | 0.39 | 4.47 | 2.55 | 1.80 | 4.61 | 2.99 | −1.07 |
| E2 | 2.00 | 3.45 | 2.90 | 3.32 | 2.92 | 2.60 | 1.89 | 2.19 | 3.00 | 3.10 | 1.55 |
| E3 | 0.60 | 2.98 | 1.40 | 4.17 | 1.17 | 1.85 | 0.70 | 1.62 | 3.58 | 1.60 | 1.35 |
| E4 | 0.74 | 1.36 | 1.19 | 1.64 | 1.23 | 1.66 | 1.59 | 1.89 | 0.78 | 0.96 | 1.20 |
| Indicators | O1 | O2 | O3 | T1 | T2 | T3 | T4 | E1 | E2 | E3 | E4 |
|---|---|---|---|---|---|---|---|---|---|---|---|
| O1 | 0.19 | 0.33 | 0.29 | 0.30 | 0.27 | 0.25 | 0.18 | 0.12 | 0.32 | 0.20 | 0.05 |
| O2 | 0.26 | 0.19 | 0.30 | 0.15 | 0.16 | 0.32 | 0.17 | 0.18 | 0.35 | 0.18 | 0.08 |
| O3 | 0.21 | 0.21 | 0.15 | 0.21 | 0.21 | 0.18 | 0.15 | 0.14 | 0.22 | 0.20 | 0.01 |
| T1 | 0.30 | 0.27 | 0.26 | 0.21 | 0.24 | 0.28 | 0.28 | 0.14 | 0.30 | 0.25 | 0.12 |
| T2 | 0.25 | 0.23 | 0.25 | 0.28 | 0.15 | 0.23 | 0.15 | 0.14 | 0.32 | 0.24 | -0.03 |
| T3 | 0.38 | 0.37 | 0.34 | 0.34 | 0.30 | 0.28 | 0.29 | 0.22 | 0.60 | 0.29 | 0.12 |
| T4 | 0.28 | 0.32 | 0.31 | 0.32 | 0.30 | 0.35 | 0.17 | 0.19 | 0.37 | 0.25 | 0.05 |
| E1 | 0.31 | 0.30 | 0.30 | 0.33 | 0.21 | 0.36 | 0.25 | 0.14 | 0.43 | 0.28 | 0.03 |
| E2 | 0.27 | 0.33 | 0.30 | 0.32 | 0.27 | 0.30 | 0.22 | 0.20 | 0.28 | 0.28 | 0.10 |
| E3 | 0.19 | 0.26 | 0.21 | 0.29 | 0.18 | 0.23 | 0.16 | 0.15 | 0.32 | 0.15 | 0.09 |
| E4 | 0.14 | 0.16 | 0.15 | 0.17 | 0.13 | 0.17 | 0.14 | 0.13 | 0.18 | 0.13 | 0.03 |
| Indicators | O1 | O2 | O3 | T1 | T2 | T3 | T4 | E1 | E2 | E3 | E4 |
|---|---|---|---|---|---|---|---|---|---|---|---|
| Influenced degree D | 2.78 | 2.96 | 2.86 | 2.92 | 2.42 | 2.97 | 2.15 | 1.75 | 3.70 | 2.45 | 0.64 |
| Impact degree C | 2.49 | 2.33 | 1.90 | 2.65 | 2.21 | 3.54 | 2.93 | 2.94 | 2.87 | 2.22 | 1.52 |
| Centering degree D + C | 5.27 | 5.29 | 4.76 | 5.57 | 4.63 | 6.51 | 5.08 | 4.69 | 6.57 | 4.67 | 2.17 |
| Reason degree D − C | −0.29 | −0.64 | −0.97 | −0.26 | −0.20 | 0.56 | 0.78 | 1.19 | −0.83 | −0.22 | 0.88 |
| Indicators | O1 | O2 | O3 | T1 | T2 | T3 | T4 | E1 | E2 | E3 | E4 |
|---|---|---|---|---|---|---|---|---|---|---|---|
| Weights | 0.10 | 0.10 | 0.09 | 0.10 | 0.08 | 0.12 | 0.09 | 0.08 | 0.12 | 0.08 | 0.04 |
| Category | O (organizational complexity) | T (technical complexity) | E (environmental complexity) | ||||||||
| Weights | 0.28 | 0.39 | 0.33 | ||||||||
| Indicators | Rate the Value |
|---|---|
| O1 | ⟨[0.23, 0.39], [0.40, 0.55]⟩ |
| O2 | ⟨[0.24, 0.43], [0.38, 0.54]⟩ |
| O3 | ⟨[0.30, 0.41], [0.42, 0.52]⟩ |
| T1 | ⟨[0.45, 0.57], [0.17, 0.34]⟩ |
| T2 | ⟨[0.39, 0.53], [0.23, 0.43]⟩ |
| T3 | ⟨[0.43, 0.56], [0.24, 0.44]⟩ |
| T4 | ⟨[0.42, 0.57], [0.17, 0.41]⟩ |
| E1 | ⟨[0.26, 0.42], [0.44, 0.57]⟩ |
| E2 | ⟨[0.20, 0.34], [0.50, 0.62]⟩ |
| E3 | ⟨[0.54, 0.64], [0.18, 0.29]⟩ |
| E4 | ⟨[0.41, 0.61], [0.24, 0.36]⟩ |
| Category | Rate the Value |
|---|---|
| Organizational complexity | ⟨[0.26, 0.41], [0.40, 0.54]⟩ |
| Technical complexity | ⟨[0.42, 0.56], [0.20, 0.41]⟩ |
| Environmental Complexity | ⟨[0.34, 0.49], [0.38, 0.51]⟩ |
| Indicators | O1 | O2 | O3 | T1 | T2 | T3 | T4 | E1 | E2 | E3 | E4 |
|---|---|---|---|---|---|---|---|---|---|---|---|
| Score | 0.39 | 0.42 | 0.43 | 0.67 | 0.59 | 0.60 | 0.64 | 0.40 | 0.32 | 0.72 | 0.62 |
| Category | Organizational complexity | Technical complexity | Environmental Complexity | ||||||||
| Score | 0.41 | 0.62 | 0.48 | ||||||||
Disclaimer/Publisher’s Note: The statements, opinions and data contained in all publications are solely those of the individual author(s) and contributor(s) and not of MDPI and/or the editor(s). MDPI and/or the editor(s) disclaim responsibility for any injury to people or property resulting from any ideas, methods, instructions or products referred to in the content. |
© 2023 by the authors. Licensee MDPI, Basel, Switzerland. This article is an open access article distributed under the terms and conditions of the Creative Commons Attribution (CC BY) license (https://creativecommons.org/licenses/by/4.0/).
Share and Cite
Ju, Q.; Sun, Y.; Chen, R. An Approach for Measuring Complexity Degree of International Engineering Projects. Sustainability 2023, 15, 9791. https://doi.org/10.3390/su15129791
Ju Q, Sun Y, Chen R. An Approach for Measuring Complexity Degree of International Engineering Projects. Sustainability. 2023; 15(12):9791. https://doi.org/10.3390/su15129791
Chicago/Turabian StyleJu, Qianqian, Yankun Sun, and Ran Chen. 2023. "An Approach for Measuring Complexity Degree of International Engineering Projects" Sustainability 15, no. 12: 9791. https://doi.org/10.3390/su15129791
APA StyleJu, Q., Sun, Y., & Chen, R. (2023). An Approach for Measuring Complexity Degree of International Engineering Projects. Sustainability, 15(12), 9791. https://doi.org/10.3390/su15129791