1. Introduction
The outbreak of COVID-19 was accompanied by an “infodemic”—an over-abundance of information about the outbreak [
1]. There has been both a surge in scientific publications [
2] and an increase in the number of discussions on social networks. The Twitter dataset provides a wide range of relevant information related to user behavior, emotions, and opinions about world events [
3]. Researchers have explored methods to assess the psychological tension of social network users and predict psychological distress during the pandemic [
4].
Machine learning [
5] is widely being used to predict psychological distress among social network users. A study by Ahmed et al. [
6] analyzed Facebook posts to predict anxiety and depression among users during the pandemic. Researchers have also used sentiment analysis to examine the psychological tension of social network users. Hossain et al. [
7] examined the sentiment of tweets related to COVID-19 and found that negative sentiment was associated with higher psychological distress among users.
Text analysis of a tweet corpus is complicated by the fact that tweets are very short messages, often combined with images, videos, and emoticons, and text analysis is not as obvious as on other corpus types [
8].
Twitter sentiment analysis starts from scanning the tweets for hashtags to collect all related data. The next step is to pre-process and clean up the tweets. Then, the tweets are analyzed depending on the specific purpose. Sentiment analysis uses a list of words associated with strongly positive or negative sentiment [
9]. Budiharto and Meiliana [
10] used polarity as the difference among the list of positive and negative words in every text separated by the total number of sentiment words when predicting presidential elections.
The simplest tone dictionary is a list of words with a sentiment value for each word [
11]. The Russian language is rarely used for tonal analysis research [
12,
13]. However, a method for extracting Russian vocabulary [
14] was designed for grammatically correct media texts and not for Internet content. To determine public opinion in Russian texts, a Tone Dictionary was developed [
15].
Previous studies have suggested that NLP (Natural Language Processing), machine learning [
16], and sentiment analysis [
17] are effective methods for assessing psychological tension of social network users during the coronavirus pandemic. These methods can provide insights into the emotional state and language use of individuals on social networks during the pandemic. This can be used in predictive analysis to identify individuals or groups at higher risk of psychological distress and develop targeted interventions to help.
Despite the promising results, there are limitations to these methods. For instance, NLP may not capture the nuance of human language, and machine learning algorithms may suffer from over fitting or bias problems. Therefore, it is crucial to develop reliable and validated methods for assessing psychological tension of social network users during the pandemic.
In view of the mentioned limitations, this research is aimed at creating methods for determining “emotional charge” of user-generated Internet content, as well as creating predictive models for assessing the psychological and social well-being of the population in the context of the coronavirus pandemic.
The research here proposes to examine the interaction between emoji and text. Additionally, based on the previous studies, the following three hypothesis were formed.
The first hypothesis is that emoticons affect their accompanying texts depending on the valency. Positive emojis make the message more positive, while negative emojis make it more negative [
18,
19].
Looking at the valency of emoticons used, Derks et al. [
20] reported that the valence of emoji corresponded to the valence of the context, suggesting that emojis reflect the valence of the context, and serve to clarify the valence of the message (second hypothesis).
The third hypothesis is that the repetition of emojis enhances the emotional valence of the message. Based on this hypothesis, this article proposes a method for calculating the IPTt (Index of Psychological Tension for tweet) indicator.
The approach proposed in this article has the following features:
- -
A five-rank scale is used to assess the emotional charge of terms and emojis;
- -
Emojis are considered, with a multiplying factor used when using multiple identical emojis;
- -
Parameters can be applied both at the level of a tweet and at the level of an array of tweets.
The objectives of this research work are as follows:
- i.
Analysis of collections of tweets using proprietary software for highlighting tonal words about socio-psychological accounting;
- ii.
Creation of a tonal dictionary of terms (with assignment of a rank and type of tonality);
- iii.
Development of methods for assessing the psychological state of social network users based on sentiment analysis of messages;
- iv.
Creation of methods for assessing the dynamics of the psychological state of network users as a reflection of their subjective result;
- v.
Creating a methodology for analyzing the predictive accounting for psychological heightened severity, with the mood of tweets and pandemic indicators.
The proposed dictionaries contain not only ranked terms, but also ranked emojis and text emoticons. The dictionaries contain all detected word forms with a common root, including abbreviations, intentional change in the spelling of words.
2. Related Work
Article [
21] shows that English is the dominant language used in sentiment analysis studies. Most authors have studied texts in English. The text of bilingual documents (in English and other languages) was translated into English to extract the useful information.
A study by Chen et al. [
22] analyzed over 100 million tweets related to COVID-19 and found that the dominant sentiments were negative, with fear being the most prevalent emotion. The study also found that there was a significant increase in negative sentiments during the early stages of the pandemic. Similarly, a study by Almishal et al. [
23] analyzed over 60,000 tweets related to COVID-19 and found that the dominant sentiment was anxiety, followed by sadness and anger. The study also found that there was a significant increase in negative sentiments as the number of COVID-19 cases increased.
Study by Abdel-Basset et al. [
24] analyzed over 400,000 tweets related to COVID-19 and found that the dominant sentiment was negative, with fear being the most prevalent emotion.
Cao et al. [
25] used sentiment analysis to evaluate the emotional state of social network users during COVID-19. The study analyzed over 6 million Weibo posts related to COVID-19 and found that negative emotions such as anxiety and anger were prevalent among social network users.
Li et al. [
26] used topic modeling to identify the key topics discussed by social network users during COVID-19. The study analyzed over 2 million Weibo posts related to COVID-19 and found that topics related to health, the economy, and government policies were prevalent. The study also found that the level of discussion of these topics was associated with the psychological tension of social network users.
A study by Liao et al. [
27] used network analysis to examine the social network structure of Twitter users during COVID-19. The study analyzed over 1.6 million tweets related to COVID-19 and found that users who were more connected to others in their network reported lower levels of psychological tension. Gao et al. (2021) analyzed tweets to identify the emotional state of social media users during the pandemic [
28].
Samuel et al. [
29] analyzed the text of tweets in the United States during the COVID-19 peak to track the evolution of the fear–panic–despair triad associated with COVID-19. Bhat et al. [
30] examined the positive, neutral, and negative sentiments of tweets related to the spread of COVID-19. Lwin et al. [
31] studied global Twitter emotional trends in relation to the pandemic by applying a lexical approach and the Crystal-Feel algorithm to four emotions (fear, anger, sadness, and joy).
An exploratory study and sentiment analysis on a big dataset about the COVID-19 pandemic focusing on the Omicron variant was proposed by Thakur N. et al. [
32]. The role of Twitter during the COVID-19 pandemic in spreading information and misinformation was presented through sentiment analysis [
33].
The researchers proposed various indices to measure the sentiment of tweets. For example, the Sentiment Index represents the proportion of the difference of positive emotions and negative emotions to the totality of positive emotions, negative emotions, and neutral emotions of users [
34,
35].
Gann et al. [
36] chose 6799 tokens based on Twitter data, and each token was assigned a sentiment score, specifically the
TSI (Total Sentiment Index), indicating whether it is a positive or negative token:
where
p is the number of occurrences of a token in positive tweets and
n is the number of occurrences of a token in negative tweets. Furthermore,
tp/tn is the ratio of total positive tweets to total negative tweets.
The Sentiment Index was used to analyze and forecast customer changes and feelings over time [
37]:
where
P denotes the number of positive tweets,
N the number of negative tweets, and
Nt the number of neutral tweets.
Sentiment Score assesses a good or negative statement in a text or document [
38]. Ratings can be given on a scale of 0 to 10, with 0 indicating a negative score, 4 indicating neutral, and 7 indicating a good score. In general, the sentiment score is defined as the weighted average of the document’s sentiment score [
39].
Panchenko [
40] evaluated Russian-language texts on Facebook using various methods. The Word Sentiment Index is a measure of the proportion of positive to negative terms in all texts (posts and comments). The Text Sentiment Index (
TSI) is a ratio of positive to negative texts in a corpus. The Word Emotion Index is a ratio of emotional (positive or negative) words in the corpus of texts. The Text Emotion Index is a ratio of positive and negative texts in the corpus. Two approaches concentrate on emotive terms, while the other two concentrate on text classification.
During the coronavirus pandemic, researchers analyzed public opinion, emotions, and sentiment in social media posts. Twitter is one of the best social networks for gathering news [
41]. To analyze sentiment in India [
42], visualization methods were used—a word cloud and a graphical representation of emotions. Rustam et al. extracted tweets related to COVID-19 and visualized people’s moods by dividing tweets into positive, neutral, and negative [
43]. Naseem et al. when analyzing opinions about COVID-19, each tweet is marked as positive, negative, or neutral [
44].
Zhang et al. [
45] suggested a sentiment classification system that organizes opinion terms in the WordNet lexical method dataset to categorizing text at the sentence level rather than the document level.
Sanders et al. examined one million tweets to gauge public opinion on the usage of masks as a preventive approach during the COVID-19 epidemic [
46]. Based on Twitter data, NLP was utilized to analyze the increase in the frequency of positive tweets, as well as perform topic clustering and visualization.
Jalil et al. [
47] conducted a statistical analysis of keyword trends in the corpus of tweets about the coronavirus disease pandemic and analyzed the sentiment of the collected tweets using various feature sets and classifiers.
3. Materials and Methods
A technique for sentiment analysis of tweets based on English-language tweets is proposed. The technique is based on ranking of emotional words and emojis. To determine the tone of tweets, experts created dictionaries of ranked words and emojis (emotional components, elements). A five-point system (−2, −1, 0, +1 or +2) was chosen to determine the degree of emotional charge of dictionary elements, and each element of the dictionary was assigned a degree of emotional charge.
Tweets were collected in Excel format, using the Vicinitas API, while marking up the texts of tweets by words and by the tweets themselves. Next, the text processing system was used to extract terms from tweets, and the addresses of occurrences of terms were saved. After that, the terms were normalized; a separate list of normalized terms was created, including the address of the term in its original form.
The list of stop-words was used to filter the list of selected words. A large number of stop-words have been created. The biggest challenge in extracting keywords from tweets using the standard set of python stop-words (the standard set comprises only conjunctions, interjections, etc., which were eliminated from consideration) was similar to “noise”, namely, many words that are unrelated to the explored topic. Categories of stop-words were added based on expert analysis (place names, dates, days of the week, names of months, proper names, names of institutions, positions, and so on). New stop-words were added to the collection on a regular basis.
Then, the list of terms was processed by an expert with the assignment of ranks according to the emotional scale. The list of terms in the database includes the following elements: term, its rank, synonyms, abbreviations, derivatives, informal spellings. This makes it possible to compare the different representations of the same term with its main meaning and eliminate errors in determining the frequency of use of the term in messages.
Tweets often use informal notations for common words. After analyzing the tweets, following categories of spelling errors are identified.
Internet memes (Lol), slang (kinda, wonna, outta), informal abbreviations (government as gov’t, gvnt; children as cdns; kid as kd; years as yrs; season as szn; month as mths; COVID as cvd), informal spellings (because as cuz, bc, bec; you as u; no as n;), repeating letters in a word (dieeeeee, knowwww), hiding informal vocabulary (fwcked, fkg, fking), informal exclamations (ummmm, ew).
These distortions were considered when extracting terms from tweets by comparing them with the correct form of the words. Some categories of word distortion were used to add emotion to the text of tweets, such as letter repetition, informal vocabulary, and informal exclamations. This was considered when assessing the emotionality of a tweet.
In addition, the emotionality of tweets is enhanced using emojis. A list of emojis was compiled and ranked on a five-digit emotional scale. When assessing the emotionality of a tweet, ranks of the words (in various spellings) and emojis were considered. Then, an additive evaluation of the “emotional charge” of each tweet was performed and the average value of the evaluation for the collection of tweets was calculated. An Index of Psychological Tension (IPT) is proposed. IPT is calculated as the sum of the ranks of emotionally charged words and emojis for each tweet:
where,
IPTt—Index of Psychological Tension for the tweet,
—ranks of the emotional words in tweet,
—ranks of emojis in tweet,
k—enhancing coefficient:
me—number of emoji repeats.
For the collection of tweets, the proposed equation to evaluate the average
is:
where,
is Index of Psychological Tension for collection of tweets,
—number of tweets in the collection.
Data for research (Results,
Section 1) were downloaded from Twitter from 22 April 2022 to 30 April 2022). Data for research (Results,
Section 2) were downloaded from Twitter from 1 January 2021 to 31 January 2023). Data for research (Results,
Section 3) were downloaded from Twitter from 20 November 2021 to 8 December 2021). These time periods were chosen such that they were comparable to the average incidence rate (excluding periods of sharp spikes in incidence) (Results,
Section 1 and
Section 3). The period of pandemic development was chosen (excluding the initial period of the pandemic development and the end period) (Results,
Section 2). The upload was carried out using the analytical mechanisms of Twitter (
https://www.vicinitas.io/) (accessed on 22 March 2023). This allows for uploading the Tweet Id, Tweet Type, hashtags, User Id, Name, location. Vicinitas is an effective way to import tweets using Twitter’s streaming API. Vicinitas allows us to search and display up to 2000 tweets for free. The results have been integrated into Microsoft Excel to remove duplicate content [
45]. The whole procedure took place in real time. This research contains 7830 English tweets (including retweets) (
Section 1), 4771 English original tweets (
Section 2), and 4024 Russia original tweets (
Section 3).
For the automated calculation of the IPT, a set of programs in the python language was developed, which implemented the following functions:
- -
Building a corpus of tweets based on the created database structure in sqlite3, including the tweet body, author, geographic label, creation date, tweet type;
- -
Extracting of terms from tweets, the address of the occurrence of the term in the tweet is simultaneously fixed for navigation through terms to analyze their context;
- -
Expert assessment of the degree of emotional charge of terms with the setting of ranks on a scale of “−2, −1, 0, +1, +2” (from strongly negative to strongly positive) and the assignment of expert ranks to terms in the database;
- -
Calculation of IPT based on the calculation of the additive rank of the terms in tweets, considering their frequency, and outputting the results to an excel table.
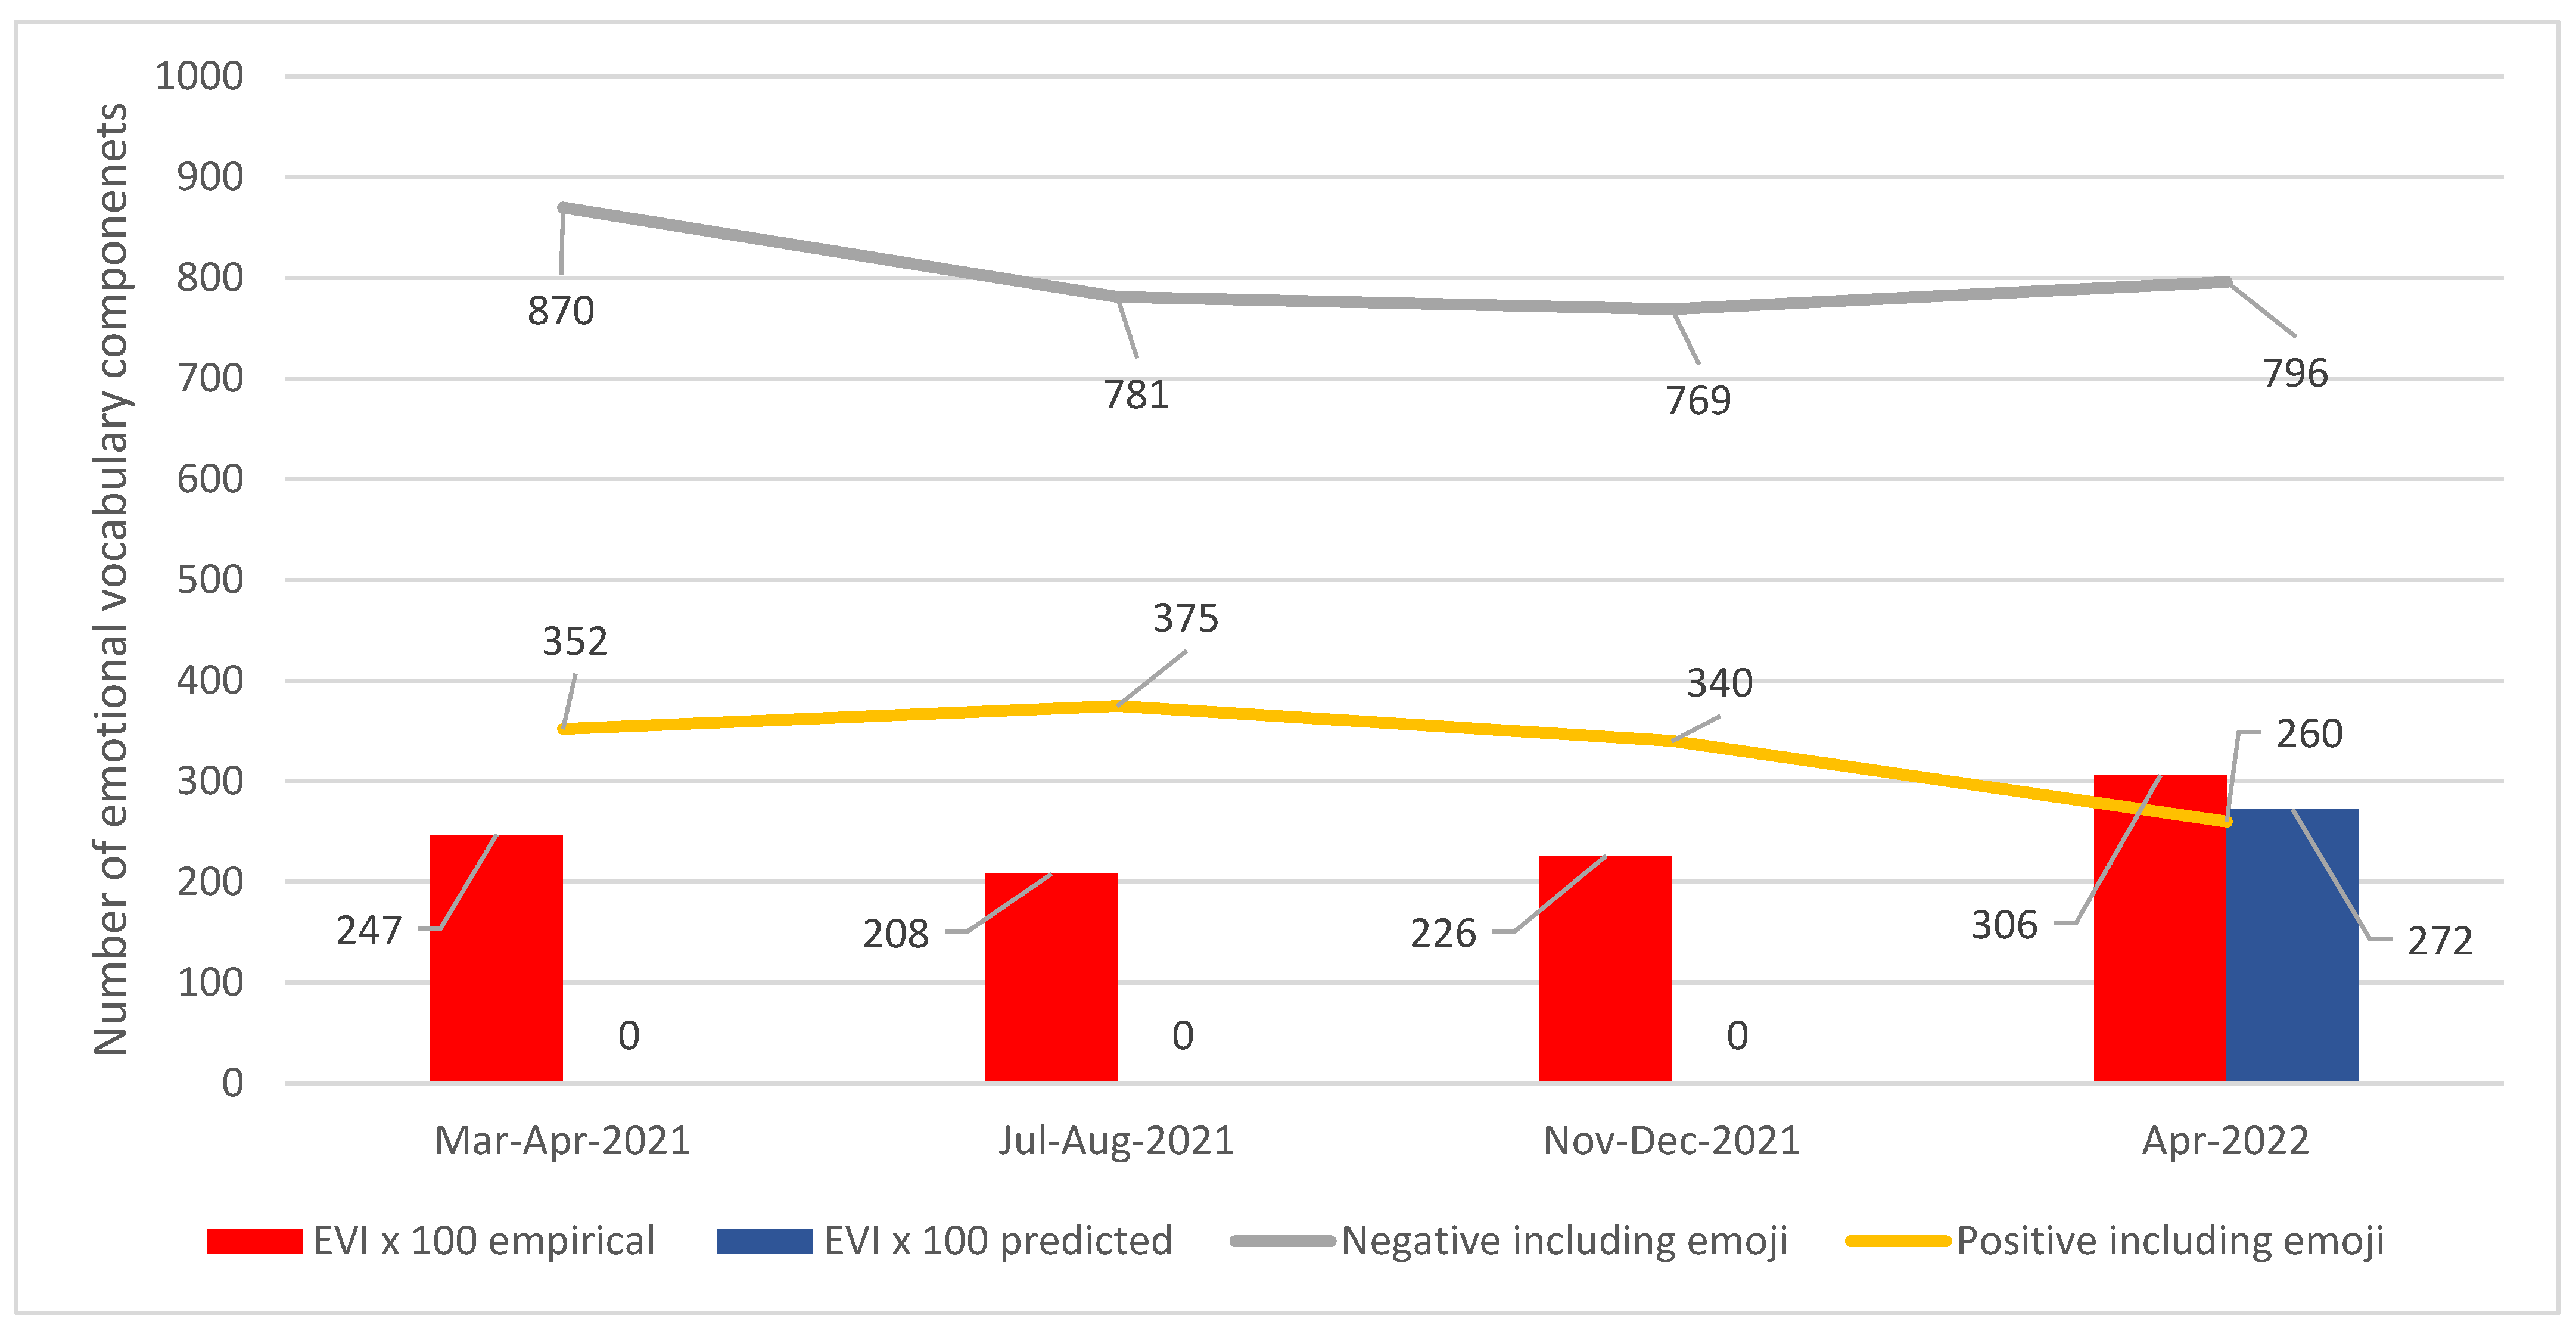
The predictive analysis method assumed that, in tweets discussing the coronavirus, the main emotions are related to the coronavirus disease. The emotional background of people was undoubtedly influenced by reports of morbidity and mortality during the pandemic, illness, and death among the social circle. From the published indicators of the coronavirus pandemic, the considered indicators were: (1) the average mortality per week (for the period of publication of the tweets of the collection); (2) the average incidence per day (over the period of publication of the collection); (3) average increase in incidence (thousand people) for 4 months prior the period of publication of tweets. Then, a search was made for the correlation of these indicators with the results of sentiment analysis of tweets. The predictive analysis technique was tested on Russian-language messages related to the coronavirus from Twitter for the periods March–April, July–August, and November–December 2021.
Collections of user messages from the tweets were prepared for different periods of time (
Table 1).
A method of predictive analysis of the growth of psychological tension was created, based on the rankings of the IPT. The predictive analysis technique included the following sequence of steps: (1) Preparation of collections of tweets for different periods of time; (2) Expert compilation of dictionaries of both negatively and positively colored vocabulary, selected from the collections; (3) Machine calculation of the modification of the IPT coefficient into the Emotional Vocabulary Index (EVI) as the ratio of negative to positive vocabulary for each array, per 1000 messages; (4) Graphical representation of the calculation results; (5) Choice of an indicator characterizing the pandemic, which correlates with the EVI; (6) EVI forecast.
To assess the dynamics of the psychological state of social network users as a reflection of their subjective well-being, this article proposes to define the value of the Subjective Well-being Index (SWI) of messages for a certain period (year, month, and week).
The
SWI was calculated using the formula:
where,
is the number of negative tweets,
is the number of positive tweets,
n is the total number of tweets. Negative and positive tweets were ranked by IPT.
The Emotional Vocabulary Index (
EVI) was calculated for a collection of tweets. It is equal to the ratio of negative to positive vocabulary (including emojis) per thousand tweets:
where,
EVI is Emotional Vocabulary Index,
is the number of negative words in collection of tweets including emojis,
is the number of positive words in collection of tweets, including emojis, and
n is the number of tweets.
5. Discussion
A model for ranking the degree of emotional coloring (tonality) of tweets using statistical approaches is developed. Methods for calculating special coefficients (index of psychological tension, index of subjective well-being) are proposed.
The proposed compiled socio-psychological dictionaries for vocabulary and emojis differ from the existing ones in the following ways:
This dictionary contains ranked terms and emojis based on five ranks (−2, −1, 0, +1, +2), where rank “−2” corresponds to strongly negative emotions, rank “−1” to moderately negative emotions, rank “0” to neutral emotional coloring, rank “+1” to moderately positive emotions, and rank “+2” to strongly positive emotions. In existing works, as a rule, a smaller number of ranks are used. The ranks “−1, 0, +1” are used to create a lexicon of emoticon moods in [
51]. The same ranks were used to assign values to emoticons based on the mood of the tweets [
52].
The novelty of the proposed approach is to rank emojis by mood, considering both the mood of tweets and the dictionary meanings of emojis. A novel method for involuntary calculation of the IPT index based on a sentiment analysis of tweets and on previously developed thematic ranked dictionaries has been proposed. Words, expressions, and emojis in the tweets are assigned ranking values taken from dictionaries. The index of psychological tension is proposed to be calculated as the total value of the ranks of emotionally charged words and emojis for each tweet. The author’s program for the automated calculation of the IPT is developed.
Additionally, a novel method was developed to assess the dynamics of the psychological state of social network users as a reflection of their subjective well-being, which is proposed to be defined as the average value of the subjective well-being index (SWI) of a particular user’s messages for a certain period, as the individual IPT.
The study was limited by: (1) geographical limitations for predictive analysis; (2) time constraints (selected periods of time); (3) only tweets in Russian and English were considered; and (4) a subjective approach when assigning ranks to terms and emojis within the framework of sentiment analysis.
Further research will focus on extracting new knowledge on infectious diseases from scientific publications and social networks.


 ,
, 


