Article

Comparing the Substitution of Nuclear Energy or Renewable Energy for Fossil Fuels between the United States and Africa

Department of Management Science, National Yang Ming Chiao Tung University, 1001 Ta-Hsueh Road, Hsinchu 300, Taiwan
*
Author to whom correspondence should be addressed.
Sustainability 2023, 15(13), 10076; https://doi.org/10.3390/su151310076
Submission received: 30 April 2023 / Revised: 16 June 2023 / Accepted: 19 June 2023 / Published: 26 June 2023

Abstract

:
This study explores the differences in energy consumption between the highly economically developed United States and economically underdeveloped Africa. This study conducted the parameter estimation and equilibrium analysis of a Lotka–Volterra model to investigate the short-term and long-term relations of different types of energy, respectively. The parameter estimation results show that nuclear energy consumption increases the consumption of fossil fuels in the United States but decreases fossil fuel consumption in Africa. This implies that Africa can replace fossil fuels with nuclear energy in the short run. Given the current state of energy consumption, the results of the equilibrium analysis indicate that the United States’ nuclear and fossil fuel consumption will reach a stable long-term equilibrium. However, Africa will experience significant fluctuations in nuclear and fossil fuel consumption, and both nuclear and fossil fuel consumption will eventually be depleted. The highly economically developed United States arranges energy consumption in an environmentally friendly way and reshapes economies to achieve sustainability, so its long-term energy consumption is more stable than economically underdeveloped Africa. Accuracy analysis results show that the nuclear or renewable energy consumption predicted by the Lotka–Volterra model is more accurate than that of a Bass model since the Lotka–Volterra model considers energy interactions.

1. Introduction

The environmental Kuznets curve indicates that environmental protection decreases with economic growth under a certain national income level, while environmental protection conversely increases with economic growth as the national income accumulates over a certain level. From the perspective of the environmental Kuznets curve, at early stages of economic development, the economy is prioritized over environmental protection, but as the economy develops, environmental protection is prioritized over the economy to a certain extent [1,2,3]. To examine the environmental Kuznets curve, this work focuses on the highly economically developed United States and economically underdeveloped Africa. We explore whether the United States practices environmental protection by means of the proper design of energy circularity and whether Africa ignores environmental deterioration to consume energy for the purpose of economic development. For the first time, this study examined differences in the short-term and long-term relationships between fossil fuels and nuclear energy and the relationship between fossil fuels and renewable energy in developing and developed countries using a Lotka–Volterra model since the parameter estimation and equilibrium analysis of the Lotka–Volterra model can be used to elucidate short-term and long-term energy relationships [4].
Global carbon emissions have been increasing along with the expansion of the economy. Since 1980, the concentration of carbon dioxide in the atmosphere has gradually risen [5]. Many countries have become aware of this serious issue. A study conducted on 29 OECD countries from 1992 to 2018 investigated the impact of carbon emissions and the process of reducing them [6]. The study found that the carbon intensity of OECD countries showed a declining trend, but the convergence was slow. The main factors contributing to this trend were economic development, energy structure, and energy efficiency [6]. Among these factors, energy efficiency was found to be the most important. To transition into a low-carbon economy, the deep decarbonization of an energy system, including improving the utilization of non-fossil energy and developing renewable energy sources, is required [6]. The proper implementation of a low-carbon economy is necessary to ensure economic growth while maintaining the use of carbon dioxide [7]. Previous studies on global warming and abnormal climate phenomena found that the energy used for electricity generation results in carbon dioxide (CO2) emissions and greenhouse effects [8,9,10]. To slow down CO2 emissions and generate cleaner electricity, previous studies have suggested the usage of clean energy to replace fossil fuels [11,12,13]. Previous studies have regarded nuclear energy or renewable energy as clean energy that can be used to generate electricity and have proposed using clean energy to replace fossil fuels. Both BRICS countries (including the Federative Republic of Brazil, the Russian Federation, the Republic of India, the People’s Republic of China, and the Republic of South Africa) and developed European nations have made resolute decisions to explore alternatives and trends in the new energy market in order to develop low-carbon economies [14,15,16]. Nguyena et al. [17] described the goals and potentials of renewable energy development in Vietnam. Hoang et al. [18] illustrated that the COVID-19 pandemic has accelerated development policies of renewable energy infrastructure to provide sustainable resources of power generation. However, the key factors determining the new energy market are capital and technology, and the development trends of different types of new energy sources, such as biomass energy, tidal energy, hydrogen energy, geothermal energy, nuclear energy, solar energy, and wind energy, vary among countries [19]. These trends also reflect the significant differences in substitutability within the new energy market among various countries [14]. Currently, nuclear energy, solar energy, wind energy, and biomass energy have become the most widely used and consumed new energy sources [20,21,22]. For this reason, this study explores the impact of nuclear energy or renewable energy on fossil fuel consumption.
The electricity generated by nuclear power plants does not require fossil fuels and does not produce CO2 during its power generation process, so nuclear energy is considered to produce zero CO2 emissions [23,24,25]. In contrast, previous studies have argued that the entire lifecycle of a nuclear power plant wastes a large amount of electricity [26,27,28,29]. At first, raw uranium materials are explored, enriched, transformed, and transported to nuclear power plants. Then, the radioactive waste from nuclear electricity generation needs to be treated, solidified, and buried. Finally, nuclear power plants need to be decommissioned. These studies explained why the whole life cycle of nuclear energy needs to consume great amounts of fossil fuels. Furthermore, some scholars have debated the idea that nuclear energy decreases the consumption of fossil fuels, with studies indicating the radiation risks of nuclear energy [30,31,32]. Bowen et al. [33] studied the price decline of the United States’ energy stocks after the Three Mile Island incident. Fields and Janjigian [34] indicated abnormal negative returns of the United States’ energy stocks after the Chernobyl accident and found that the stock price of nuclear energy declined. To resolve arguments about the relations between fossil fuels and nuclear energy, this work was intended to examine the short-term nuclear energy substitution of fossil fuels using the parameter estimation of the Lotka–Volterra model.
Additionally, previous research has discussed the feasibility of using renewable energy to replace fossil fuels. Betzer et al. [35] showed that after the Fukushima disaster, non-renewable energy stocks slightly declined but renewable energy stocks increased by more than 20%. Investors regard renewable energy as an alternative to nuclear energy and have purchased a large number of renewable energy stocks, leading to a substantial price rise for renewable stocks. Ferstl et al. [36] interpreted the impact of the 311 earthquakes on energy stocks in Japan, the United States, France, and Germany. After the nuclear disaster triggered by the Great East Japan Earthquake, these countries have been accelerating the use of renewable energy and implementing electricity tariff systems. Consequently, the stock prices of renewable energy have increased. Academic fields have long paid attention to the renewable power infrastructure that the United States has developed. Due to the lack of utility grids and a large power infrastructure in Africa, renewable energy for small-scale, decentralized installations is an appropriate power solution. Compared with the traditional large-scale power plants that need to build high-voltage transmission lines, the construction costs required for renewable energy may be relatively small, which could lead to the construction of solar and wind power plants to engage in electricity generation in Africa. Since Africa has the aforementioned features, the academic field has gradually been paying attention to the replacement of fossil fuels with nuclear and renewable energy. Thus, the second purpose of this paper was to examine the substitution of renewable energy for fossil fuels using the parameter estimation of the Lotka–Volterra model.
The third purpose of this study was to utilize equilibrium analyses of the Lotka–Volterra model to examine differences in the long-term trajectories of different energy resources between the United States and Africa. Chen and Pao [15] emphasized that economic growth can enhance a circular economy, under which energy and resources are recycled in an environmentally friendly way to reshape economies to achieve energy sustainability. Pao and Chen [16] found evidence that a circular economy would use recyclable raw materials and reduce CO2 emissions in the European Union. The highly economically developed United States has the knowledge and technology to reshape economies to achieve energy sustainability, and long-term energy consumption is likely to be stable under the advanced arrangement of a circular economy. In Africa, however, the proportion of nuclear energy consumption is much lower than that of fossil fuels. Currently, South Africa has the only two nuclear reactors in the African continent, though about 20% of the world’s uranium reserves are in Africa. With growing electricity demands, economically underdeveloped Africa tends to consume nuclear energy and fossil fuels to generate electricity without the advanced design of a circular economy. For this reason, the third purpose of this work was to compare differences in the long-term energy consumption trajectories of the United States and Africa.
Historical data on annual energy consumption from 1965 to 2021 were collected and applied to our proposed binary Lotka–Volterra model. By utilizing the Lotka–Volterra model to determine the relationship between fossil fuels, nuclear energy, and renewable energy, the impact factors across different types of energy sources were identified via the statistical significance of the estimated parameters. The equilibrium stability between two types of energy was also analyzed with the estimated parameters, assuming that energy technology does not change in the future. Additionally, a Bass model was constructed in our study to examine whether our Lotka–Volterra model could outperform it because the Bass model ignores interactive competitive or cooperative effects [37,38,39]. We were motivated to prove whether our proposed Lotka–Volterra model could more accurately predict energy consumption than the Bass model. The results of the equilibrium analysis showed that long-term energy consumption was predicted to be more stable in the United States than in Africa. This suggests that the United States, with its high level of national income, applies the circular economy concept to energy consumption in contrast to Africa, which does not, consistent with the environmental Kuznets curve. Our accuracy analysis results showed that nuclear or renewable energy consumption predicted by the Lotka–Volterra model is more accurate than that of the Bass model since the Lotka–Volterra model considers energy interactions.

2. Methodology

2.1. Lotka–Volterra Model of Energy Consumption

The Lotka–Volterra model considers the interaction between two species [40,41]. In this work, the consumption relationship analysis of the two different types of energy was divided into two pairs. The first pair consisted of fossil fuels and nuclear energy, and the second pair comprised fossil fuels and renewable energy. These paired Lotka–Volterra model analyses were applied to different regions, the United States and Africa, via differential Equations (1) and (2), respectively, for each pair.
d X 1 d t = a 1 b 1 X 1 c 1 X 2 X 1 = a 1 X 1 b 1 X 1 2 c 1 X 1 X 2
and
d X 2 d t = a 2 b 2 X 2 c 2 X 1 X 2 = a 2 X 2 b 2 X 2 2 c 2 X 2 X 1
where X 1 0 and X 2 0 ; X 1 and X 2 represent the annual consumption of different energy types; d X 1 d t and d X 2 d t represent annual energy growth rates; X 1 2 and X 2 2 represent increasing and decreasing tendencies of energy growth, respectively; and X 1 X 2 and X 2 X 1 denote interactions with each other. Parameter a i denotes the impact of ith energy on ith energy growth. Parameter b i denotes the acceleration of the impact of ith energy on ith energy growth. If parameter b i is positive, the impact of ith energy on ith energy growth decreases with time. Parameter c i denotes the impact of the other energy source on energy growth, which indicates the substitution of a different energy source. Parameter c i in the Lotka–Volterra model is used to analyze the interactions between different energy sources.
Since the Lotka–Volterra equation is a continuous model that could not fit our sample data, this work converted the equation into a discrete-time version [26,42]. The discrete-time formats of Equations (1) and (2) are denoted as Equations (3) and (4), respectively.
X 1 t + 1 = α 1 X 1 ( t ) 1 + β 1 X 1 t + γ 1 X 2 ( t )
and
X 2 t + 1 = α 2 X 2 ( t ) 1 + β 2 X 2 t + γ 2 X 1 ( t )
where α i , β i and γ i are the coefficients. The coefficients in continuous Lotka–Volterra Equations (1) and (2) can be calculated through discrete-time Lotka–Volterra Equations (3) and (4) using the following Equations (5) to (7).
a i = l n α i
b i = β i α i α i 1 = β i l n α i α i 1
c i = γ i b i β i = γ i β i β i l n α i α i 1 = γ i l n α i α i 1
The sign of γ i in Equation (7) is the same as c i because ln α i α i 1 is always positive when α i 1 . The sign of γ i expresses the marginal effect of one energy source on another energy source. The sign of β i in Equation (7) is the same as b i because ln α i α i 1 is always positive when α i 1 . Through the sign and statistical significance of γ i , we can judge how nuclear and renewable energy consumption affect fossil fuels. This work examined the energy consumption relationships in the United States and Africa by repeating the simulations from Equations (1) to (7), in which X 1 represents the annual consumption of fossil fuels and X 2 represents the annual consumption of nuclear and renewable energy in the first and second pairs, respectively.

2.2. Equilibrium Stability Analysis

When reaching equilibrium points, trajectories do not change over time. Lotka–Volterra model Equations (1) and (2) are equal to zero when the equilibrium stability described by Equation (8) is reached.
d X 1 d t = 0 ,   a n d   d X 2 d t = 0
Solving Equation (8) yields four equilibrium points—(X1, X2) = (0, 0), ( a 1 b 1 , 0 ), and (0, a 2 b 2 )—and the cross points of the two lines— d X 1 d t = 0   a n d   d X 2 d t = 0 —as shown in Equation (9):
X 1 = a 1 c 1 X 2 b 1 ,   a n d   X 2 = a 2 c 2 X 1 b 2
This shows that the consumption trends of two energy types reach stable states and do not change over time. Next, this work utilized the eigenvalues of a Jacobian matrix to examine equilibrium stability. The negative real parts of a Jacobian matrix were required to prove the equilibrium stability of our Lotka–Volterra equations. Additionally, this work chose Lyapunov functions to examine equilibrium stability. Positive Lyapunov functions and the negative first differentials of Lyapunov functions were required to prove the equilibrium stability of our Lotka–Volterra equations.

2.3. Predictive Ability Analysis

This work constructed the Bass model [43] expressed as Equation (10) for comparison with the Lotka–Volterra model in order to demonstrate forecast performance.
d X i d t = ( g X i + h X i X i ) ( m X i X i )
Given that X i is consumption at year t, we estimated g X i , h X i , and m X i . Parameter m X i is defined as the maximum size of this energy consumption. This work estimated all the parameters in the Bass and Lotka–Volterra models from training sample data ranging from 1965 to 2014 and calculated the forecast values during the test period from 2015 to 2021.
The mean absolute percentage error (MAPE) was utilized to measure the predictive ability of the Lotka–Volterra model. The MAPE can be calculated by M A P E = 1 n t = 1 n Z t z ^ t Z t , where Z t and z ^ t are the actual and predicted values, respectively, of energy consumption. According to Martin and Witt [44], the predictive ability of a model is “excellent” when the MAPE is smaller than 10%, the predictive ability is “good” when the MAPE is between 10% and 20%, and the predictive ability is “reasonable” when the MAPE is between 20% and 50%.

3. Sample and Data

In 2017, the consumption of fossil fuels in the United States and Africa accounted for 16.18% and 3.56% of the total world energy use, respectively. In the United States, fossil fuels accounted for 82.25%, while nuclear and renewables represented 8.58% and 4.24%, respectively. In Africa, fossil fuels accounted for 89.92%, while nuclear and renewables represented 0.8% and 1.22%, respectively. As more fossil fuels are consumed, more CO2 is emitted; therefore, this study focused on examining whether the use of clean energy, nuclear and renewable energy, reduces fossil fuel usage. Accordingly, sample data on energy usage in the United States and Africa from 1965 to 2021 were collected from the 2023 Statistical Review of World Energy published on the BP company website. We used training period data from 1965 to 2014 to construct the models and test period data from 2015 to 2021 to conduct the forecast accuracy analysis.

4. Empirical Results

4.1. Coefficient Estimation Results

4.1.1. Relationships between Fossil Fuels and Nuclear Energy in the United States

To deeply understand the interactions between fossil fuel and nuclear energy consumption, this study considered nuclear energy and renewable energy to explore which factor affects the consumption of fossil fuels in the United States and Africa. The Lotka–Volterra model estimation results of the consumption of nuclear and fossil fuels in the United States are shown in Table 1. The parameter results of pair one showed that γ1 was significantly negative and γ2 was insignificant according to the t-statistics. As mentioned above, the signs of γi and ci were found to be equal. Therefore, nuclear energy stimulates the growth of fossil fuels, but fossil fuels do not affect the growth of nuclear energy. A possible reason for this is that electricity is consumed during uranium mining, nuclear power plant operations, landfill treatment, and decommissioning; the United States is a developed nation that has the most nuclear power plants of any country in the world, and many of the United States’ power plants have been decommissioned in recent years. Under a scenario with no alternative energy sources, the long-term management of the United States’ nuclear power plants requires a lot of electricity, which increases the consumption of fossil fuels. The arguments of previous studies [26,27,28] coincide with our results regarding the relationship between nuclear energy and fossil fuels. The United States’ nuclear power plants may not emit CO2 from electricity generation, but they still increase fossil fuel consumption from uranium mining to nuclear power plant decommissioning. The Paris Agreement promises carbon reductions, but the United States suffers from a lack of sufficient alternative energy sources. The pressure and difficulty of carbon reduction may cause the United States to withdraw from the Paris Agreement. The United States imports a great amount of energy to achieve its economic development. Because the United States is not overexploiting energy minerals within the United States, the United States still protects the environment, consistent with the environmental Kuznets curve theory. Here, coefficient β1 (and b1) of fossil fuel consumption was found to be significantly positive, indicating that the self-growth coefficient b1 is limited due to saturation and is the dominant factor limiting the growth rate. The coefficient of nuclear energy β2 was found to be positive as well, indicating a decreasing nuclear energy growth rate. The growth rate of these two types of energy sources will be slowed by growth pressures.

4.1.2. Relationships between Fossil Fuels and Renewable Energy in the United States

Table 1 also shows the results of pair two, renewable energy and fossil fuel. Table 1 exhibits that γ1 and γ2 were both found to be insignificantly negative, suggesting no significant relationships between renewable energy and fossil fuels. Table 1 confirms that there is no obvious relation between renewable energy and fossil fuels. Our empirical results show that renewable energy has no impact on fossil fuels but nuclear energy does. These empirical results suggest that nuclear energy significantly influences the growth of fossil fuels and that renewable energy has no significant effect on fossil fuels. These results shown in Table 1 explain why the whole life cycle of nuclear energy needs to consume great amounts of fossil fuels in the United States. The construction of large-scale nuclear power plants requires lots of concrete and steel, the fabrication of which necessitates the use of lots of fossil fuels.

4.1.3. Relationships between Fossil Fuels and Nuclear Energy in Africa

Table 2 shows the energy consumption trends of two different sources in Africa. The parameter results of pair one showed that γ1 was positive, γ2 was negative, and both were significant according to the t-statistics. Nuclear energy was found to reduce the growth of fossil fuels, and fossil fuels were found to increase the growth of nuclear energy. A prey–predator interaction was found between fossil fuels and nuclear energy in Africa. The self-coefficient β1 of fossil fuel consumption was insignificantly negative, indicating that the major suppression force is nuclear energy. However, coefficient β2 was significantly positive, which means that self-growth coefficient b1 was also positive. This means that the consumption of nuclear energy is limited by itself, although fossil fuels are an enhancement force.

4.1.4. Relationships between Fossil Fuels and Renewable Energy in Africa

In Table 2, the parameter results of pair two, fossil fuel and renewable energy, show that γ1 was significantly negative and γ2 was insignificant according to the t-statistics. Because the signs of γi and ci were equal, the results suggest that renewable energy can enhance the growth of fossil fuel consumption. The results also imply that the construction of solar and wind power plants to engage in renewable power generation in Africa still needs a great amount of electricity, which will increase the consumption of fossil fuels. Neither Africa nor the United States can rely on renewable energy to replace fossil fuels at the current stage. The self-coefficient coefficient β1 of fossil fuel consumption was found to be significantly positive, indicating that fossil fuel consumption growth has decreased with time in Africa. On the other hand, renewable energy growth was shown to be controlled by neither fossil fuels nor itself.

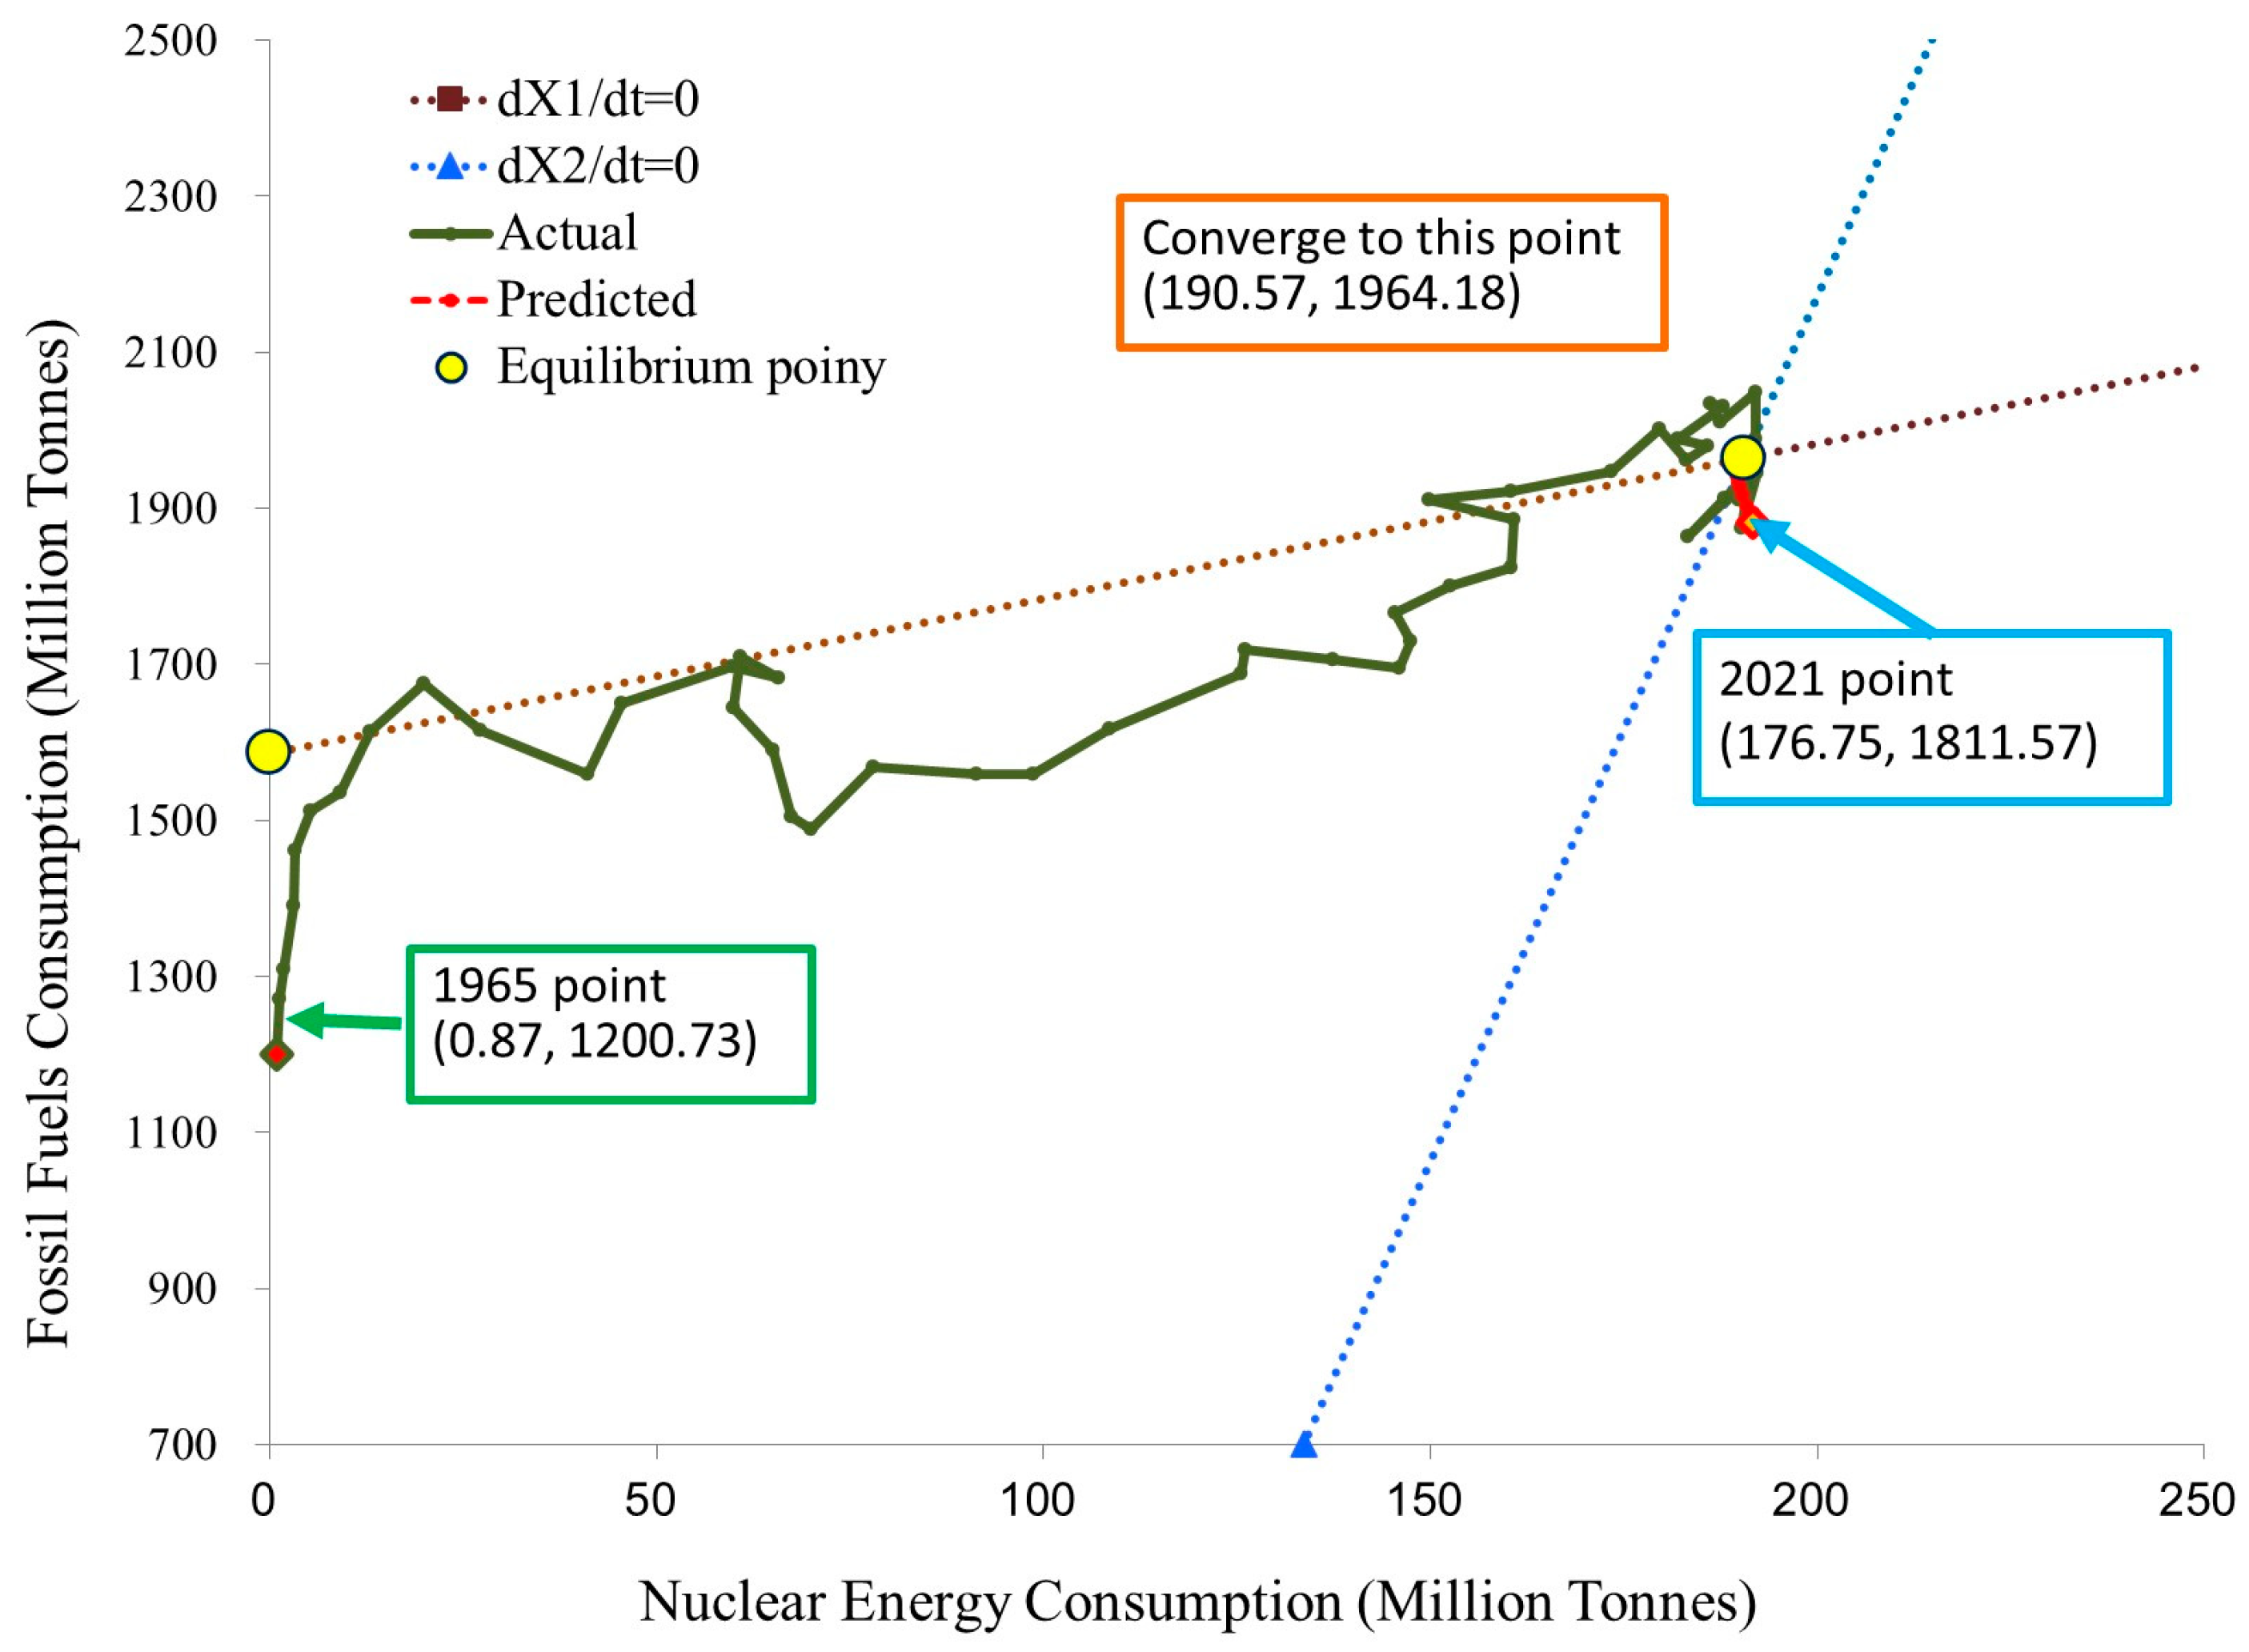
4.2. Equilibrium Analysis Results

This study further explored the equilibrium stability of pair one, nuclear and fossil fuels in the United States since we found obvious correlations between the two energy types. This work utilized the eigenvalues of the Jacobian matrix to examine equilibrium stability. This work computed the negative real parts of the Jacobian matrix of the Lotka–Volterra equations for the pairs of nuclear and fossil fuel consumption in the United States. This work additionally used Lyapunov functions to examine equilibrium stability. This work computed the positive Lyapunov functions and the negative first differentials of the Lyapunov functions to prove the equilibrium stability. Figure 1 depicts the consumption trajectories of fossil fuels and nuclear energy in the United States. The trajectories were found to start in 1965 and rise with simultaneous increases in nuclear energy and fossil fuel consumption. The intersecting point of the two straight lines, which are two linear functions (a1b1X1 − c1X2 = 0, and a2b2X2c2X1 = 0), is the equilibrium point. Fossil fuel and nuclear energy consumption reached 1811.57 and 176.75 million tons of oil equivalent in 2021, respectively, and were not over the saturation boundaries. As our proposed Lotka–Volterra equations were shown to satisfy the stable conditions proposed by Hritonenko and Yatsenko [45], the annual consumption of fossil fuels and nuclear energy approached 1964.18 and 190.57 million tons of oil equivalent, respectively.
The x-axis and y-axis in Figure 1 represent nuclear energy and fossil fuel consumption in the United States, respectively. During the period from 1979 to 1983, the coordinate point, the values in 1979, of the trajectories started from X < d X 2 / d t and Y < d X 1 / d t to X < d X 2 / d t and Y > d X 1 / d t because fossil fuel consumption continually decreased, i.e., d X 1 / d t < 0 , while nuclear energy increased over time, i.e., d X 2 / d t > 0 . However, fossil fuel consumption inversely increased after 1983, which implies that nuclear energy cannot entirely replace fossil fuels; the whole world continued using these two energy types. The annual consumption of these two energy types was found to converge to long-term equilibria of 190.57 and 1964.18, respectively. This suggests that in the long term, the adoption of nuclear energy raises fossil fuel consumption.
Due to the significant relationship of pair one, fossil fuels and nuclear energy in Africa, this study further analyzed their equilibria. The x-axis and y-axis in Figure 2 represent nuclear energy and fossil fuel consumption in Africa, respectively. The fossil fuel trajectories started in 1965 and moved in the rising direction. Africa does not have many countries that fully exploit their commercial, manufacturing, and industrial potential, so energy consumption is much lower in Africa than anywhere else in the world due to a lack of infrastructure, production, and activities. Africa did not develop nuclear power until 1984, so there are currently not enough available data on nuclear power generation in Africa. When we used the existing data and estimated parameters a1, b2, and c2 in Table 2 to simulate the future trajectories of nuclear power generation in Africa, the simulated trajectories of fossil fuel and nuclear energy were found to greatly fluctuate, as shown in Figure 2. Africa prioritizes the economy over environmental protection and fails to utilize energy as efficiently as the United States. In addition, technological improvements and industrialization evolutions have caused substantial changes in electricity generation. Consequently, energy consumption fluctuation in Africa is much greater than that in the United States.
Currently, the proportion of nuclear energy is much lower than that of fossil energy in Africa at its current initial stage of economic development. African countries, especially South Africa, have provided tax incentives to encourage enterprises to use more green energy and less fossil energy, which has led to substantial increases in nuclear power use. Developing countries in Africa have substantially increased both nuclear power and fossil fuel power station use during their industrialization evolutions. Africa is inclined to develop its economy at the cost of environmental damage and uranium overexploitation. When we used the small available amount of African nuclear energy data, we estimated parameters a1, b2, and c2 in order to conduct the equilibrium analysis; African fossil fuel and nuclear energy consumption were found to eventually converge to an equilibrium point of −1109 million tons of oil equivalent and zero tons of oil equivalent, respectively. This work further computed the negative real parts of the Jacobian matrix of the Lotka–Volterra equations, the positive Lyapunov functions, and the negative first differentials of Lyapunov functions for the pairs of nuclear and fossil fuel consumption in Africa. The equilibrium analysis results showed that Africa’s long-term energy sources will be depleted as they converge to an equilibrium point where nuclear energy consumption is zero and fossil fuel consumption is negative. This suggests that Africa’s fossil fuel and uranium consumption will increase in the future if Africa continues to inefficiently consume energy without circular energy knowledge and technology. Consistent with the environmental Kuznets curve theory, the United States engages in energy consumption in a more environmentally friendly way than Africa, so the United States’ long-term trajectories are more stable than Africa’s.

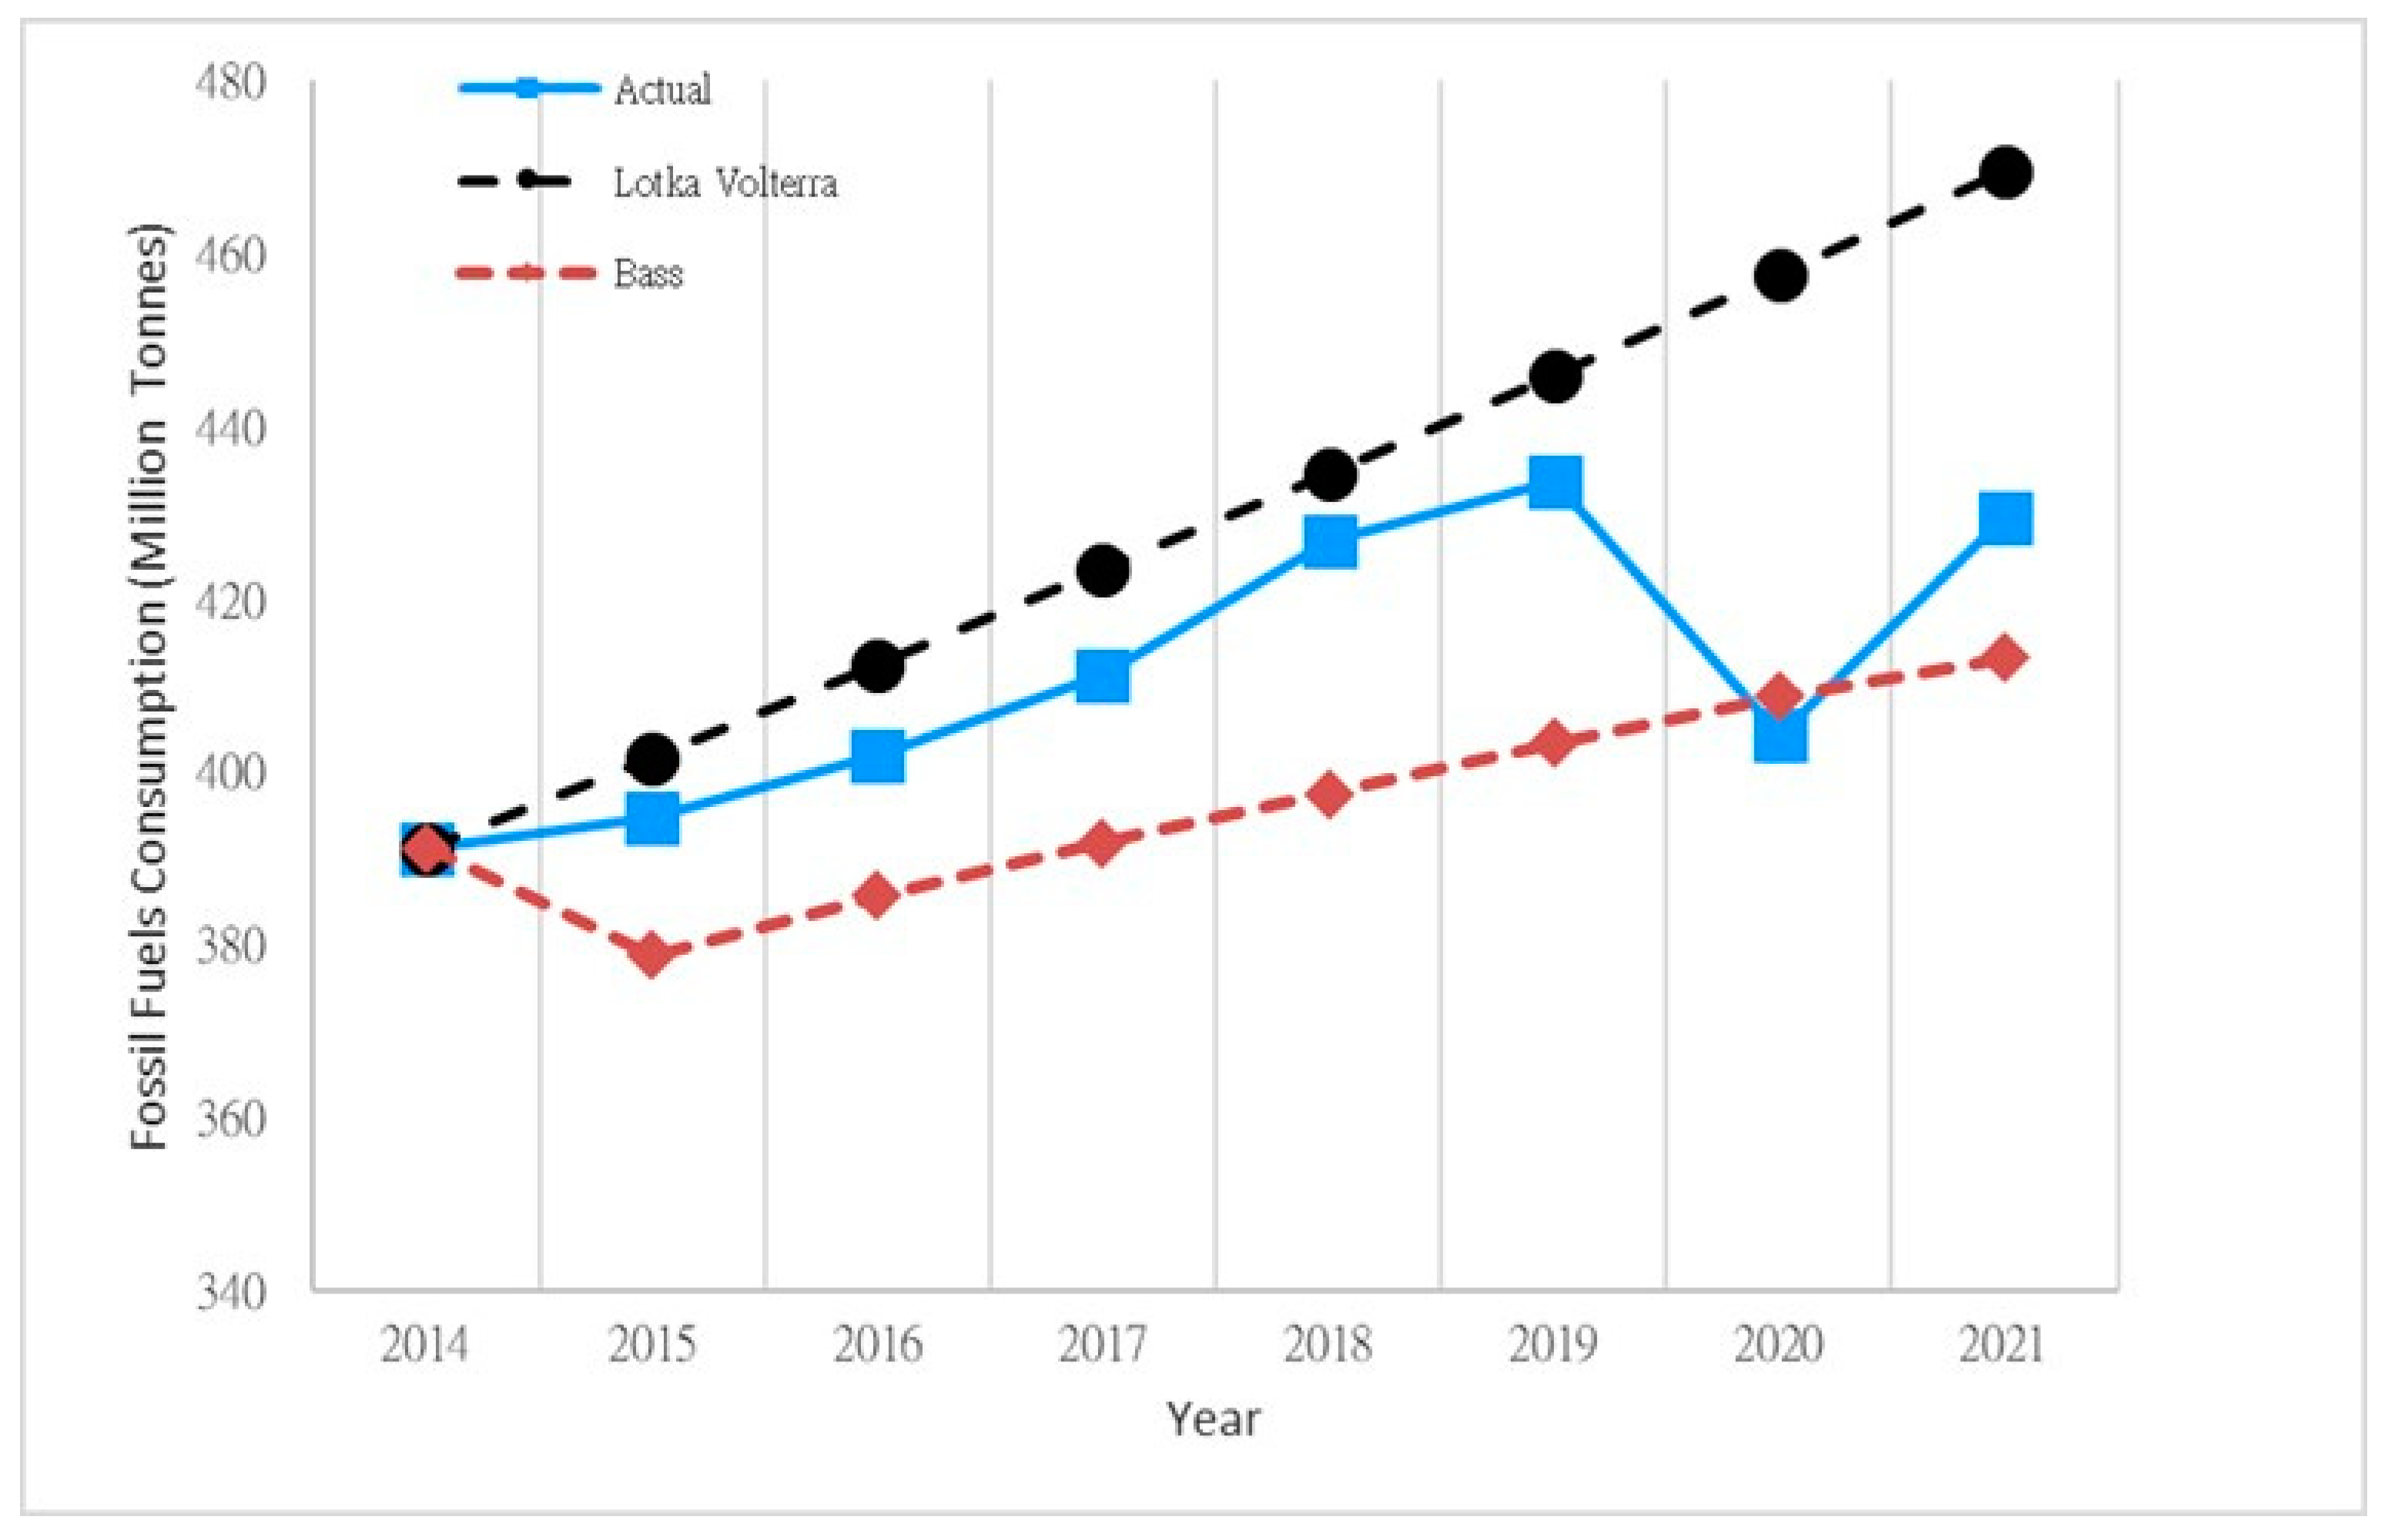
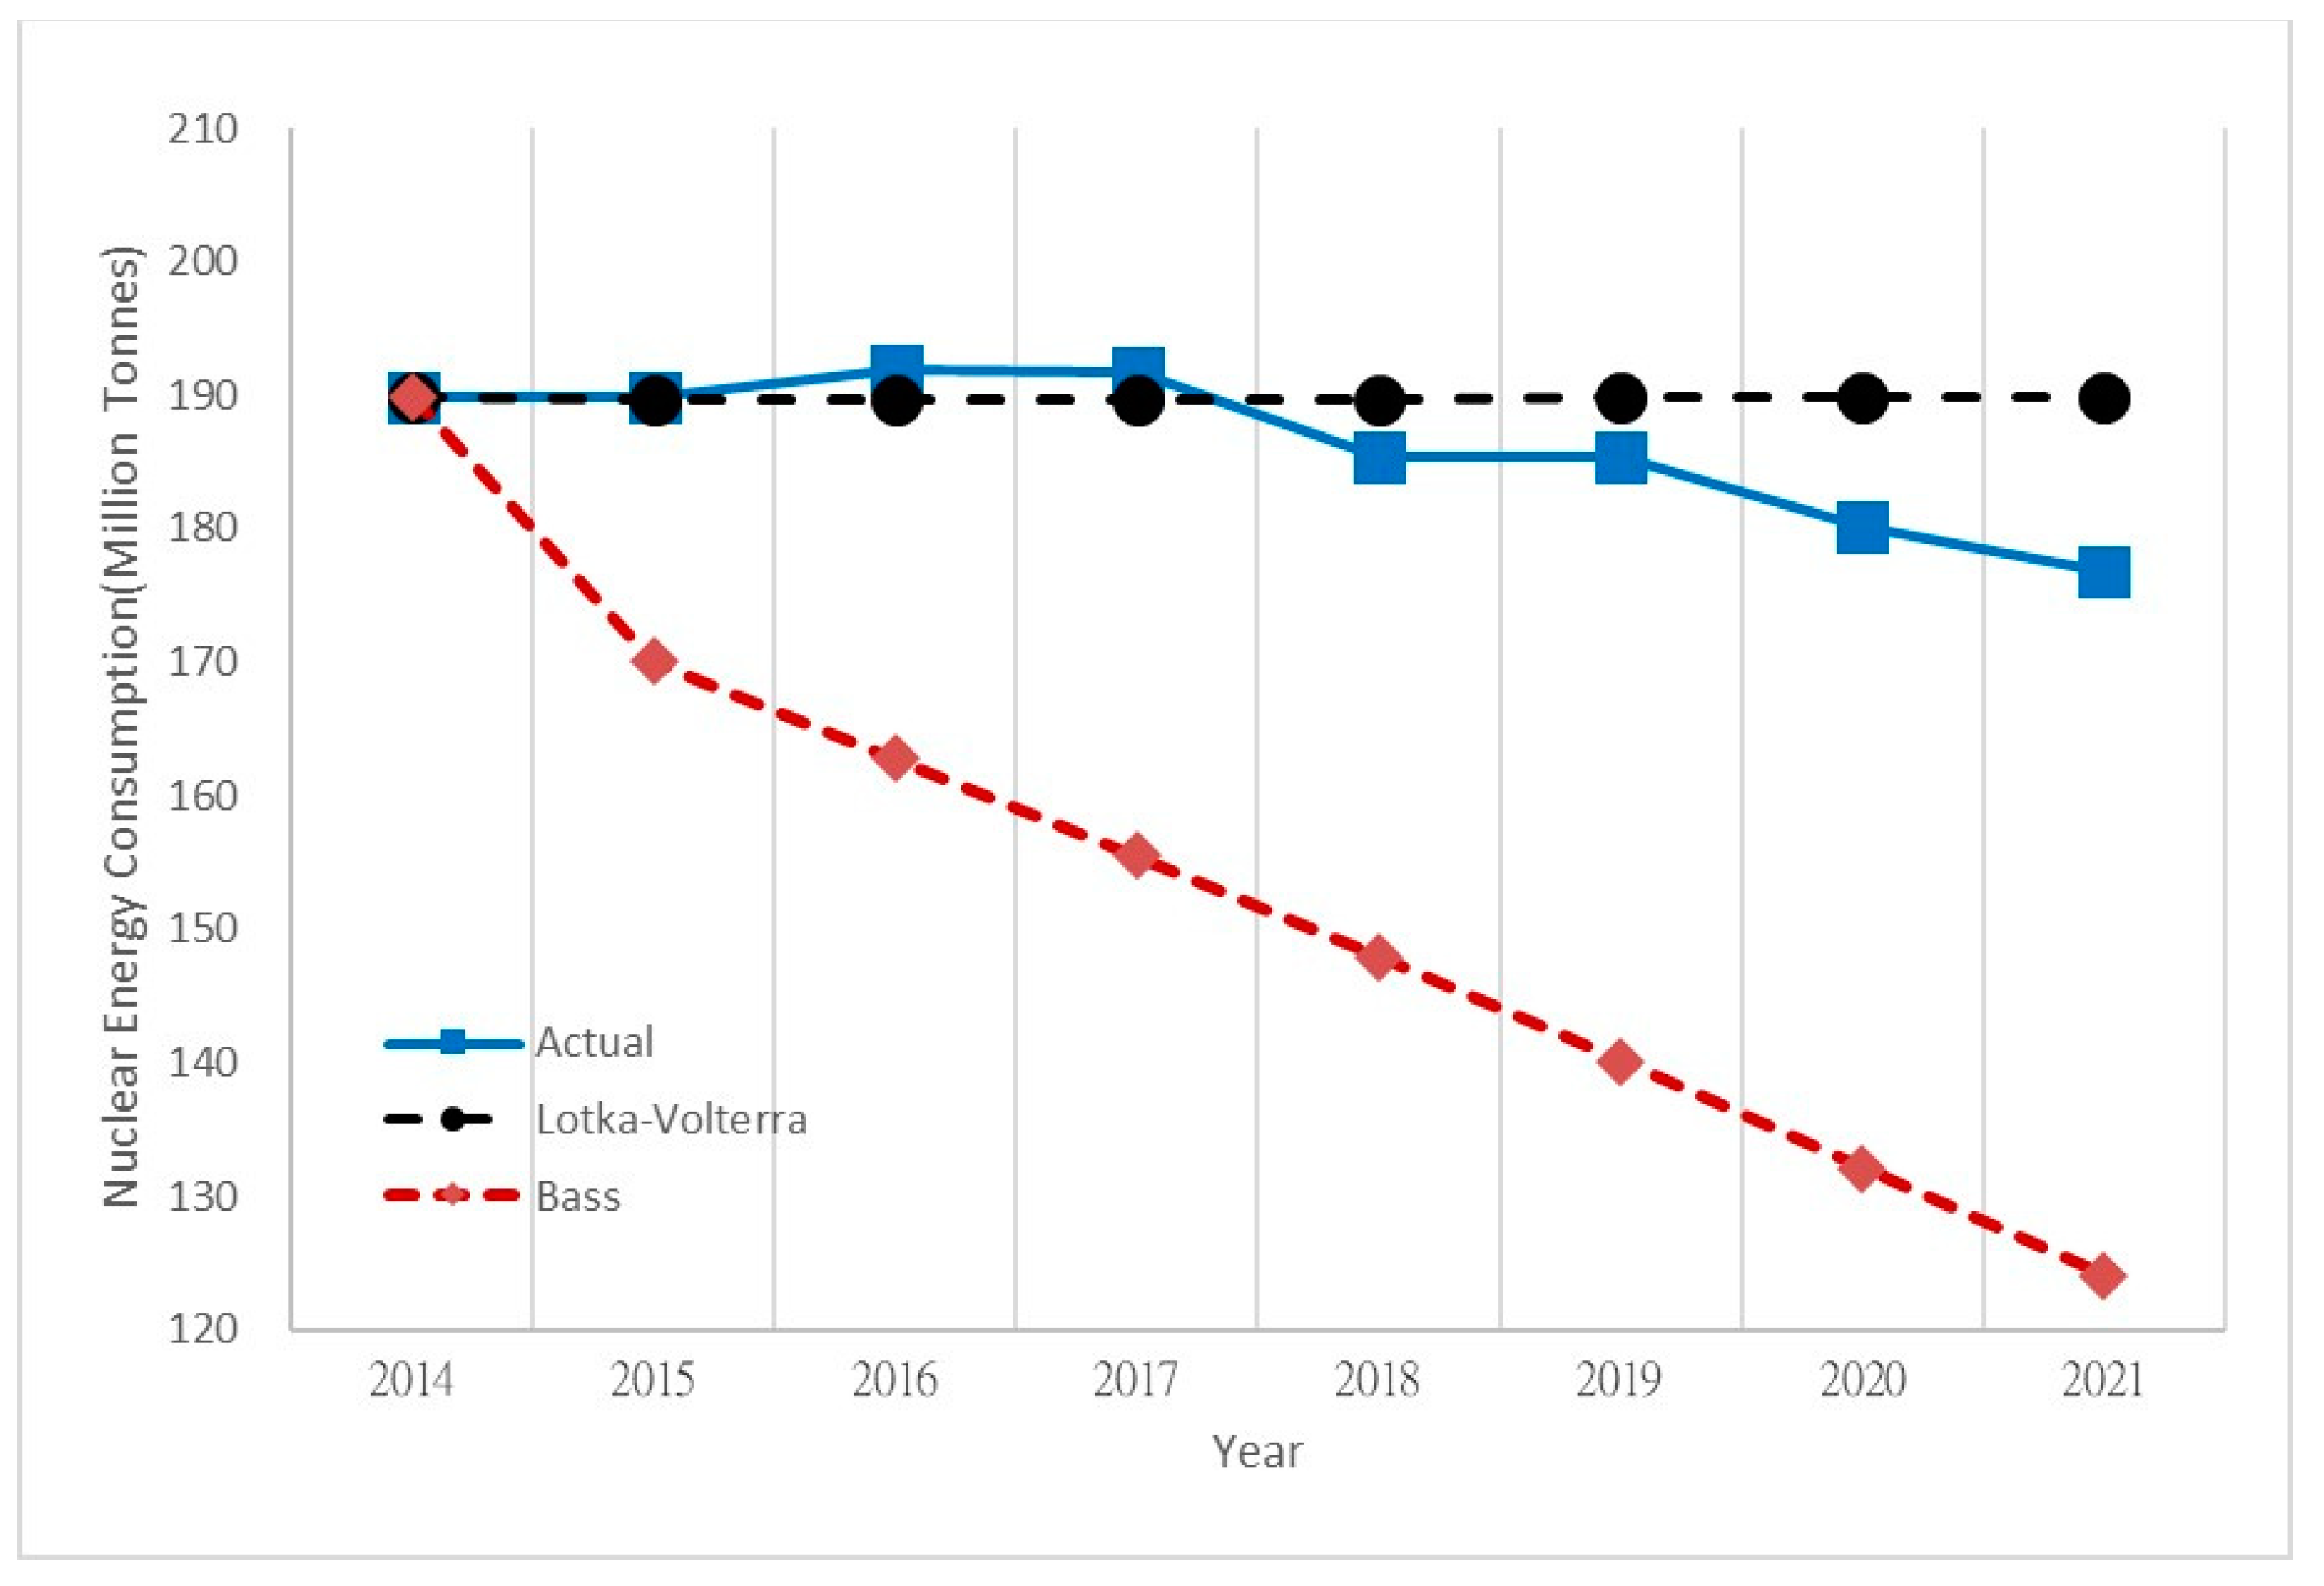
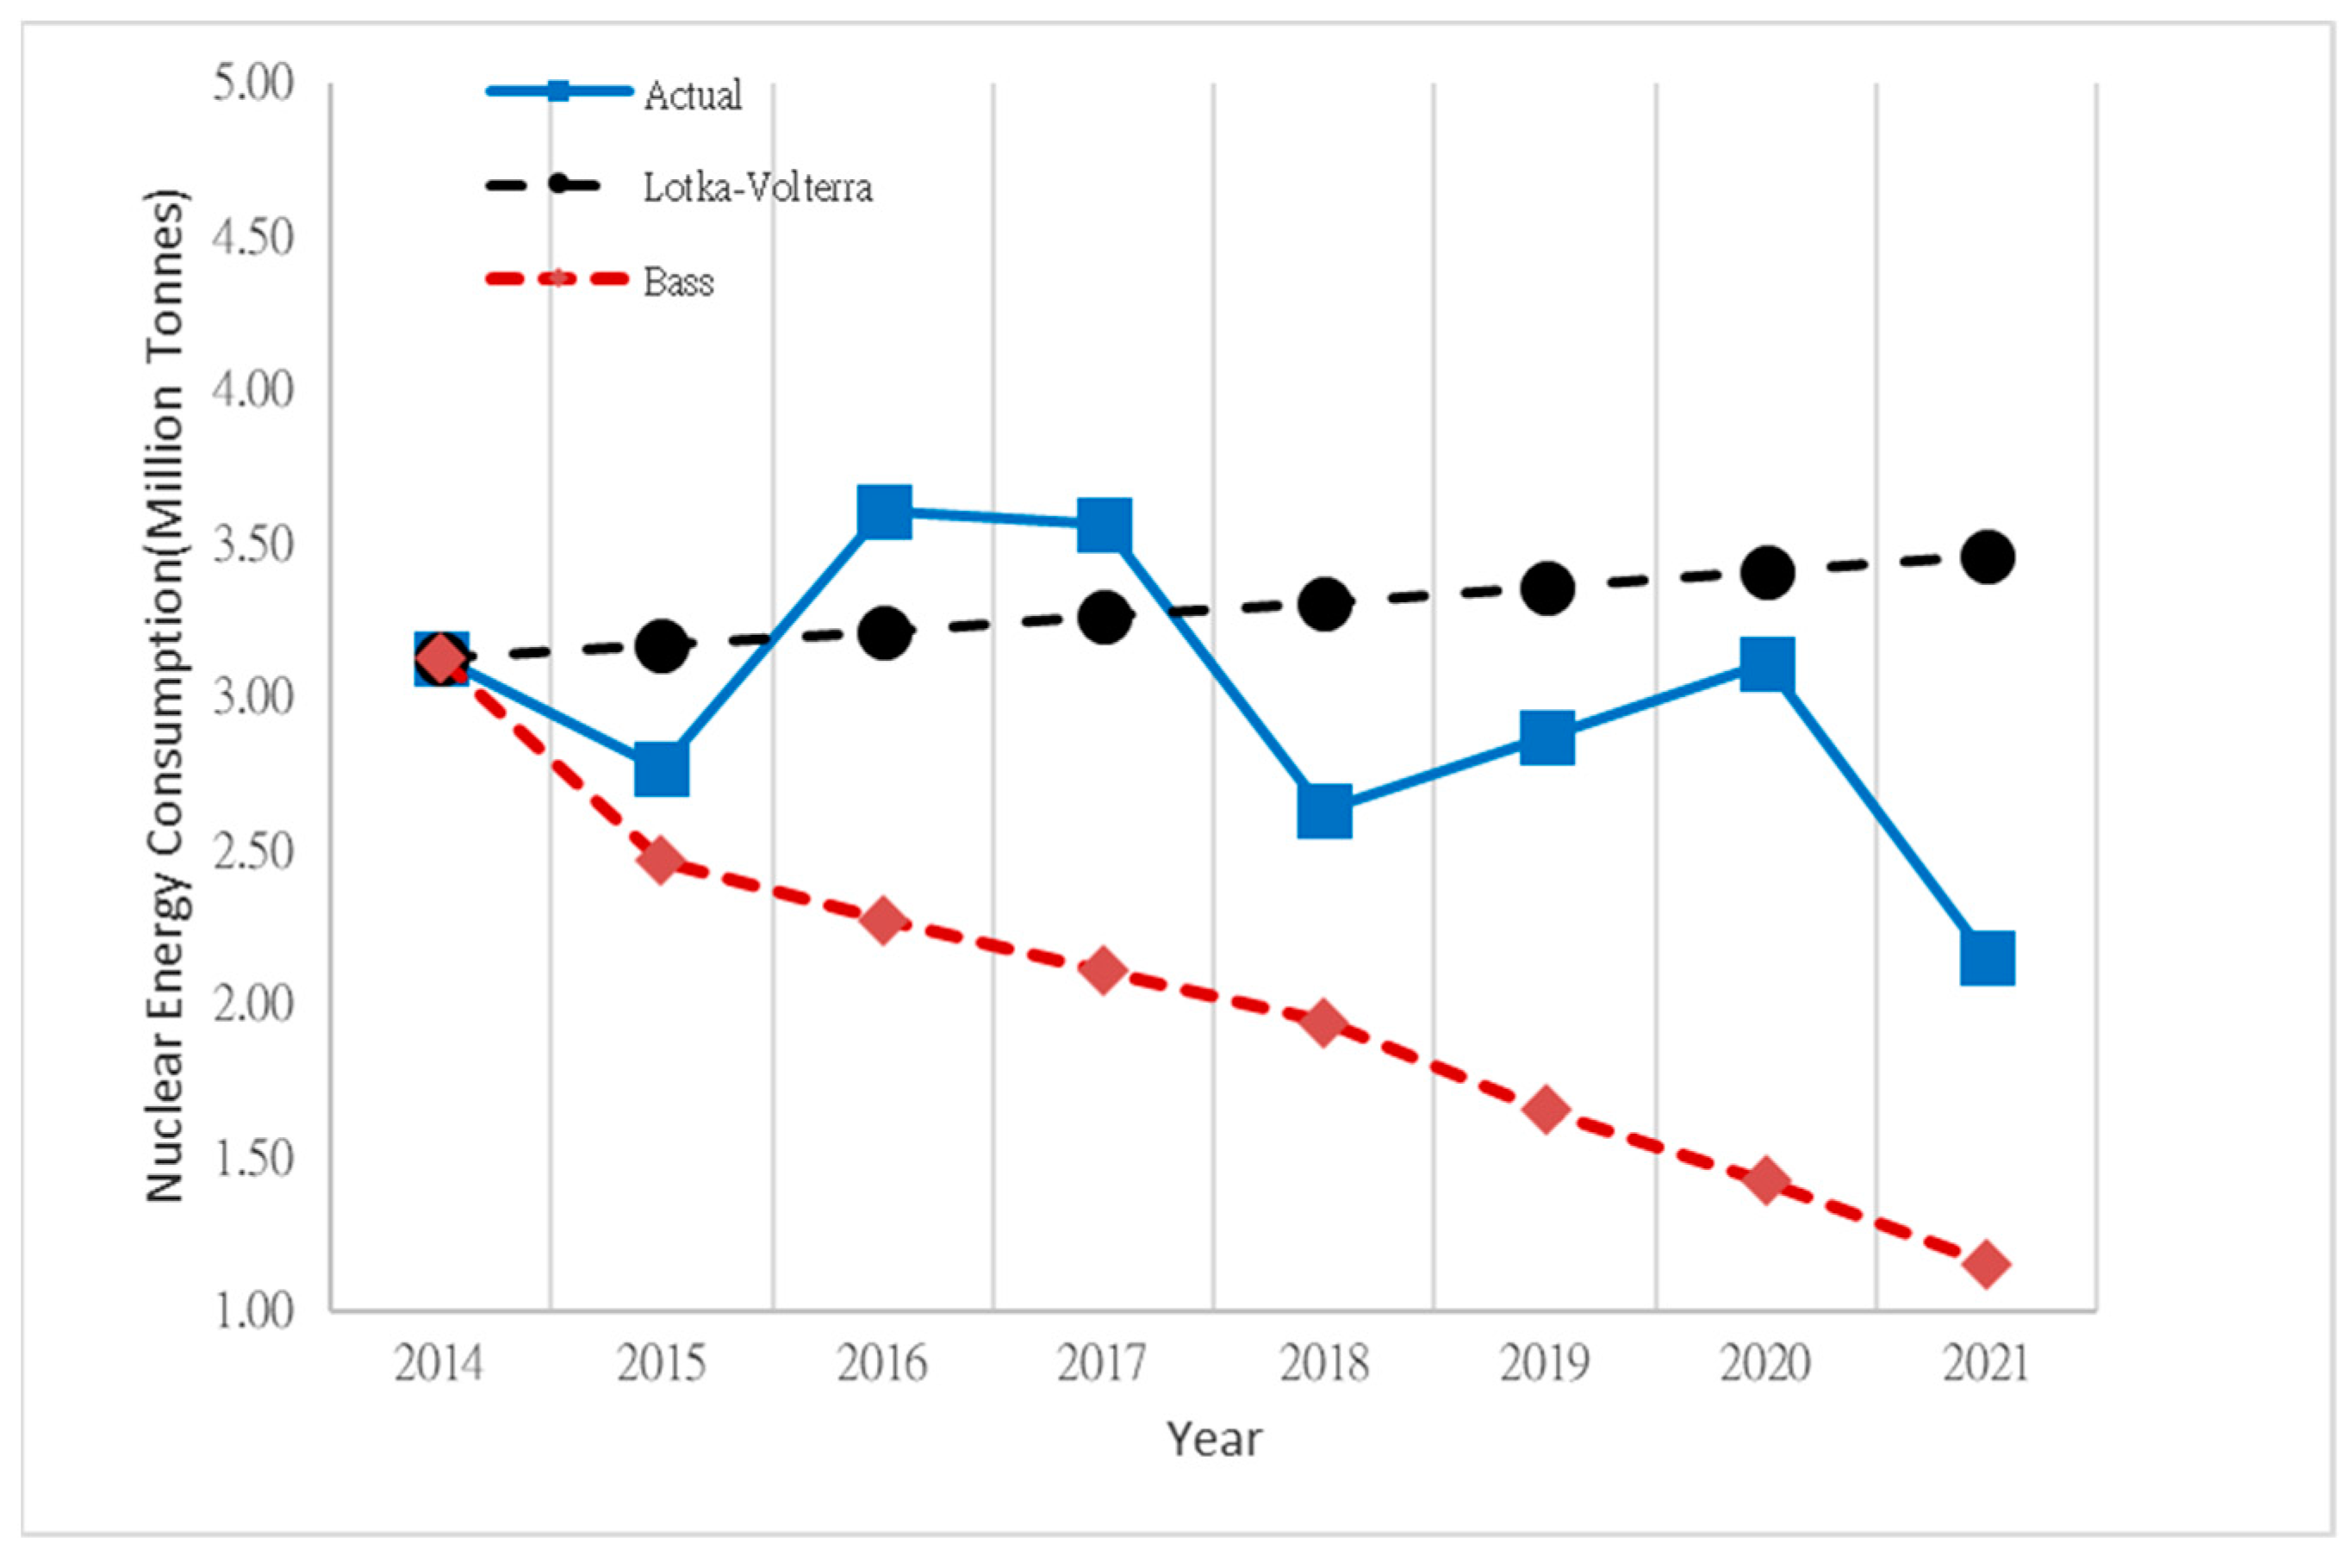
4.3. Forecast Accuracy Analysis Results

This section presents the forecast accuracy analysis results for the test period. Figure 3 and Figure 4 depict the United States’ and Africa’s fossil fuel consumption trajectories for pair one, respectively. Figure 3 and Figure 4 show that the values predicted using the proposed Lotka–Volterra model were closer to the actual values in comparison with the values predicted with the Bass model in the United States and Africa, respectively. This suggests that our proposed Lotka–Volterra model outperforms the traditional Bass model in forecasting the trajectories of fossil fuel consumption because our proposed Lotka–Volterra model takes the interactions between different energy types into account.
Figure 5 and Figure 6 depict the United States’ and Africa’s nuclear consumption trajectories for pair one, respectively. Figure 5 and Figure 6 show that the values predicted using the proposed Lotka–Volterra model were closer to the actual values in comparison with the values predicted with the Bass model in the United States and Africa, respectively. This suggests that our proposed Lotka–Volterra model outperforms the traditional Bass model in forecasting nuclear energy consumption trajectories because our proposed Lotka–Volterra model takes the interactions between different energy types into account.
Figure 7 and Figure 8 depict the United States’ and Africa’s renewable consumption trajectories for pair two, respectively. Figure 7 and Figure 8 show that the values predicted using the proposed Lotka–Volterra model were closer to the actual values in comparison with the values predicted with the Bass model in the United States and Africa, respectively. This suggests that our proposed Lotka–Volterra model outperforms the traditional Bass model in forecasting renewable energy consumption trajectories because our proposed Lotka–Volterra model takes the interactions between different energy types into account.
Table 3 summarizes the MAPE results in the United States and Africa in the test period. The MAPEs of the proposed Lotka–Volterra model for the first pair of fossil fuels and nuclear energy were 5.75% and 3.70%, respectively, in the United States. Both MAPEs were lower than 10%, displaying excellent prediction according to the criteria of Martin and Witt [4]. For both fossil fuel and nuclear consumption in the United States, the nuclear prediction MAPEs of our proposed Lotka–Volterra model were much smaller than the MAPEs of the Bass model because the Lotka–Volterra model considers the consumption correlation between fossil fuels and nuclear energy. The MAPEs of the proposed Lotka–Volterra model for the first pair of fossil fuels and nuclear energy were 4.92% and 21.02%, respectively, in Africa. Our proposed Lotka–Volterra model predicted nuclear energy consumption more accurately than the Bass model because our proposed Lotka–Volterra model takes the relationships between different energy types into account. For the second pair of fossil fuels and renewable energy, the renewable energy MAPEs were 25.73% and 4.04% in the United States and Africa, respectively, in our proposed Lotka–Volterra model, while the renewable energy MAPEs were 27.11% and 16.24% in the United States and Africa, respectively, in the Bass model. In both the United States and Africa, the MAPE of the renewable energy prediction of our proposed Lotka–Volterra model was smaller than the MAPE of the Bass model. Our proposed Lotka–Volterra model was found to predict renewable energy consumption more accurately than the Bass model because our proposed Lotka–Volterra model considers the consumption correlation between fossil fuels and nuclear energy.

5. Conclusions

The purpose of this study was to examine the differences in the relationship between fossil fuels and nuclear energy and the relationship between fossil fuels and renewable energy in developing and developed countries. This study chose fossil fuel, nuclear energy, and renewable energy consumption in the United States and Africa as its research objects. The parameter estimation results show that nuclear energy enhances the consumption of fossil fuels in the United States and that nuclear energy reduces the consumption of fossil fuels in Africa in the short run. In the United States, the whole life cycle of nuclear power plants contains multiple steps from uranium searching to landfill treatment and decommissioning that may increase fossil fuel consumption, coinciding with the viewpoints of previous research [27,28,29].
Regarding long-term energy consumption relations, given the current state of energy consumption, the results of the equilibrium analysis indicated that the United States’ nuclear and fossil fuel consumption will remain at a stable long-term equilibrium; however, Africa will experience significant fluctuations in nuclear and fossil fuel consumption, and both nuclear and fossil fuel consumption will eventually be exhausted. These results suggest that the United States has the knowledge and technology to recycle energy and resources in an environmentally friendly way and to reshape economies to achieve energy sustainability. Under the assumption that there will be no structural changes in electricity generation in the United States, the equilibrium analysis and Lyapunov functions show that United States’ energy types will converge to an equilibrium point in the long run if there are no breakthroughs in energy substitution.
In contrast, the results of Africa show that nuclear energy reduces the consumption of fossil fuels in the short run. African countries, especially South Africa, have provided tax incentives to encourage enterprises to use more green energy and less fossil energy, which has led to the substantial substitution of nuclear power for fossil fuel electricity generation. The current proportion of nuclear energy is much lower than that of fossil energy in Africa, and African nuclear power is at an initial stage of development. Given the current state of energy consumption, the results of the equilibrium analysis indicate that Africa will experience significant fluctuations in future nuclear and fossil fuel consumption. Africa is predicted to ultimately increase fossil fuel and nuclear energy consumption in the long run. The results suggest that developing countries in Africa substantially increase power demand during industrialization evolutions at the cost of environmental damage and uranium overexploitation. Africa’s long-term energy consumption was found to more greatly fluctuate than the United States’, which is possibly caused by the fact that Africa cannot utilize energy as efficiently as the United States, consistent with the implication of the environmental Kuznets curve theory.
This study further found that renewable energy is unable to replace fossil fuels for power generation in both the United States and Africa. Neither Africa with its developing economies nor the United States with its mature industrialization can rely on renewables to replace fossil fuels at the current stage. Finally, accuracy analysis was used to investigate whether our proposed Lotka–Volterra model could outperform the traditional Bass model in predicting energy consumption. We found that the values predicted using the proposed Lotka–Volterra model were closer to the actual values in comparison with the values predicted with the Bass model in the United States and Africa. All of the forecasting error rates of the values predicted with our proposed Lotka–Volterra model for fossil fuels in both regions were much lower than those of the traditional Bass model in the United States. In both the United States and Africa, the forecasting error rates of the nuclear or renewable energy prediction of our proposed Lotka–Volterra model were much smaller than that of the Bass model. The aforementioned parameter estimation results revealed significant relations between fossil fuels and nuclear energy in both the United States and Africa, and fossil fuels were also found to be significantly affected by renewable energy in Africa. As a result, our proposed Lotka–Volterra model, which considers the interactions between different energy types, is more suitable for forecasting than other models without interactive factor consideration. A limitation of this study is our assumption that future electricity technology will remain unchanged. Future research can explore breakthroughs in electricity technology to predict energy consumption trends.

Author Contributions

Conceptualization, B.-H.T.; Methodology, B.-H.T.; Software, B.-H.T. and Y.-M.H.; Data curation, B.-H.T.; Validation, B.-H.T. and Y.-M.H.; Formal analysis, B.-H.T.; Writing—original draft, B.-H.T. and Y.-M.H.; Writing—review & editing, B.-H.T. All authors have read and agreed to the published version of the manuscript.

Funding

This research was funded by National Science and Technology Council of the Republic of China grant number MOST 111-2410-H-A49-061.

Institutional Review Board Statement

Not applicable.

Informed Consent Statement

Not applicable.

Data Availability Statement

The data that support the findings of this study are available on request from the corresponding author.

Acknowledgments

The authors would like to thank the National Science and Technology Council of the Republic of China for partially supporting this research.

Conflicts of Interest

The authors declare no conflict of interest.

References

  1. Mahmood, H.; Furqan, M.; Hassan, M.S.; Rej, S. The environmental Kuznets Curve (EKC) hypothesis in China: A review. Sustainability 2023, 15, 6110. [Google Scholar] [CrossRef]
  2. Halkos, G.; Ekonomou, G. Can business and leisure tourism spending lead to lower environmental degradation levels? Research on the Eurozone economic space. Sustainability 2023, 15, 6063. [Google Scholar] [CrossRef]
  3. Huang, H.; Ali, S.; Solangi, Y.A. Analysis of the Impact of Economic Policy Uncertainty on Environmental Sustainability in Developed and Developing Economies. Sustainability 2023, 15, 5860. [Google Scholar] [CrossRef]
  4. Tsai, B.H.; Chang, C.J.; Chang, C.H. Elucidating the consumption and CO2 emissions of fossil fuels and low-carbon energy in the United States using Lotka–Volterra models. Energy 2016, 100, 416–424. [Google Scholar] [CrossRef]
  5. Friedlingstein, P.; O’sullivan, M.; Jones, M.W.; Andrew, R.M.; Gregor, L.; Hauck, J.; Le Quéré, C.; Luijkx, I.T.; Olsen, A.; Peters, G.P.; et al. Global Carbon Budget 2022. Earth Syst. Sci. Data 2022, 14, 4811–4900. [Google Scholar] [CrossRef]
  6. Yu, B.L.; Fang, D.B.; Kleit, A.N.; Xiao, K. Exploring the driving mechanism and the evolution of the low-carbon economy transition: Lessons from OECD developed countries. World Econ. 2022, 45, 2766–2795. [Google Scholar] [CrossRef]
  7. Dong, F.; Bian, Z.F.; Yu, B.L.; Wang, Y.; Zhang, S.N.; Li, J.Y.; Su, B.; Long, R.Y. Can land urbanization help to achieve CO2 intensity reduction target or hinder it? Evidence from China. Resour. Conserv. Recycl. 2018, 134, 206–215. [Google Scholar] [CrossRef]
  8. Noussan, M.; Roberto, R.; Nastasi, B. Performance Indicators of Electricity Generation at Country Level-The Case of Italy. Energies 2001, 11, 650. [Google Scholar] [CrossRef] [Green Version]
  9. Yan, Q.; Wang, Y.; Baležentis, T.; Sun, Y.; Streimikiene, D. Energy-Related CO2 Emission in China’s Provincial Thermal Electricity Generation: Driving Factors and Possibilities for Abatement. Energies 2018, 11, 1096. [Google Scholar] [CrossRef] [Green Version]
  10. Zhao, H.; Huang, G.; Yan, N. Forecasting Energy-Related CO2 Emissions Employing a Novel SSA-LSSVM Model: Considering Structural Factors in China. Energies 2018, 11, 781. [Google Scholar] [CrossRef] [Green Version]
  11. Dong, Z. A neural-network-based nonlinear adaptive state-observer for pressurized water reactors. Energies 2013, 6, 5382–5401. [Google Scholar] [CrossRef] [Green Version]
  12. Gao, R.; Nam, H.O.; Ko, W.I.; Jang, H. National Options for a Sustainable Nuclear Energy System: MCDM Evaluation Using an Improved Integrated Weighting Approach. Energies 2017, 10, 2017. [Google Scholar] [CrossRef] [Green Version]
  13. Lang, P.A. Nuclear Power Learning and Deployment Rates; Disruption and Global Benefits Forgone. Energies 2017, 10, 2169. [Google Scholar] [CrossRef] [Green Version]
  14. Pan, Y.L.; Dong, F. Factor substitution and development path of the new energy market in the BRICS countries under carbon neutrality: Inspirations from developed European countries. Appl. Energy 2023, 331, 120442. [Google Scholar] [CrossRef]
  15. Chen, C.C.; Pao, H.T. The causal link between circular economy and economic growth in EU-25. Environ. Sci. Pollut. Res. 2022, 29, 76352–76364. [Google Scholar] [CrossRef]
  16. Pao, H.T.; Chen, C.C. The dynamic interaction between circular economy and the environment: Evidence on EU countries. Waste Manag. Res. 2022, 40, 969–979. [Google Scholar] [CrossRef]
  17. Nguyen, X.P.; Le, N.D.; Pham, V.V.; Huynh, T.T.; Dong, V.H.; Hoang, A.T. Mission, challenges, and prospects of renewable energy development in Vietnam. Energy Sources Part A Recov. Util. Environ. Eff. 2021, 1–13. [Google Scholar] [CrossRef]
  18. Hoang, A.T.; Nizetic, S.; Olcer, A.I.; Ong, H.C.; Chen, W.H.; Chong, C.T.; Thomas, S.; Bandh, S.A.; Nguyen, X.P. Impacts of COVID-19 pandemic on the global energy system and the shift progress to renewable energy: Opportunities, challenges, and policy implications. Energy Policy 2021, 154, 112322. [Google Scholar] [CrossRef]
  19. Gao, R.G.; Jiang, J.J. Design and implementation of environmental design based on new energy technology. Energy Rep. 2022, 8, 7600–7611. [Google Scholar] [CrossRef]
  20. Firmansyah, H.; Tan, Y.; Yan, J. Power and methanol production from biomass combined with solar and wind energy: Analysis and comparison. Energy Procedia 2018, 145, 576–581. [Google Scholar] [CrossRef]
  21. Jewell, J. Ready for nuclear energy?: An assessment of capacities and motivations for launching new national nuclear power programs. Energy Policy 2011, 39, 1041–1055. [Google Scholar] [CrossRef]
  22. Pan, Y.L.; Dong, F. Dynamic evolution and driving factors of new energy development: Fresh evidence from China. Technol. Forecast. Soc. Change 2022, 176, 121475. [Google Scholar] [CrossRef]
  23. U.S. EIA. Nuclear Regulatory Commission. 2012. Available online: https://www.eia.gov/energyexplained/nuclear/nuclear-power-and-the-environment.php (accessed on 22 January 2023).
  24. Kieckh Fer, K.; Quante, G.; Müller, C.; Spengler, T.S.; Lossau, M.; Jonas, W. Simulation-Based Analysis of the Potential of Alternative Fuels towards Reducing CO2 Emissions from Aviation. Energies 2018, 11, 186. [Google Scholar] [CrossRef] [Green Version]
  25. Simon, S.; Naegler, T.; Gils, H.C. Transformation towards a Renewable Energy System in Brazil and Mexico—Technological and Structural Options for Latin America. Energies 2018, 11, 907. [Google Scholar] [CrossRef] [Green Version]
  26. Lenzen, M. Life cycle energy and greenhouse gas emissions of nuclear energy: A review. Energy Convers. Manag. 2008, 49, 2178–2199. [Google Scholar] [CrossRef]
  27. Sovacool, B.K. Valuing the greenhouse gas emissions from nuclear power: A critical survey. Energy Policy 2008, 36, 2950–2963. [Google Scholar] [CrossRef]
  28. Van Leeuwen, J.W.S.; Smith, P. Nuclear Power: The Energy Balance; Springer: Cham, Switzerland, 2005; pp. 1–24. [Google Scholar]
  29. Torfs, R.; Huybrechts, D.; Wouters, G. Broeikasgasemissies, Verzurende Emissies en Energiegebruik van Energiedragers Vanaf de Ontginning tot Aan de Eindgebruiker; Flemish Institute for Technological Researc (VITO): Brussels, Belgium, 1998. [Google Scholar]
  30. Chang, H.Y.; Chen, R.H.; Lai, C.M. Numerical simulation of the thermal performance of a dry storage cask for spent nuclear fuel. Energies 2018, 11, 149. [Google Scholar] [CrossRef] [Green Version]
  31. Ligus, M. Evaluation of Economic, Social and Environmental Effects of Low-Emission Energy Technologies Development in Poland: A Multi-Criteria Analysis with Application of a Fuzzy Analytic Hierarchy Process (FAHP). Energies 2017, 10, 1550. [Google Scholar] [CrossRef] [Green Version]
  32. RodriGuez-Penalonga, L.; Soria, B.Y.M. A review of the nuclear fuel cycle strategies and the spent nuclear fuel management technologies. Energies 2017, 10, 1235. [Google Scholar] [CrossRef] [Green Version]
  33. Bowen, R.M.; Castanias, R.P.; Daley, L.A. Intra-industry effects of the accident at Three Mile Island. J. Financ. Quant. Anal. 1983, 18, 87–111. [Google Scholar] [CrossRef]
  34. Fields, M.A.; Janjigian, V. The effect of Chernobyl on electric-utility stock prices. J. Bus. Res. 1989, 18, 81–87. [Google Scholar] [CrossRef]
  35. Betzer, A.; Doumet, M.; Rinne, U. How policy changes affect shareholder wealth: The case of the Fukushima Dai-ichi nuclear disaster. Appl. Econ. Lett. 2013, 20, 799–803. [Google Scholar] [CrossRef] [Green Version]
  36. Ferstl, R.; Utz, S.; Wimmer, M. The effect of the Japan 2011 disaster on nuclear and alternative energy stocks worldwide: An event study. Bus. Res. 2012, 5, 25–41. [Google Scholar] [CrossRef] [Green Version]
  37. Fan, Z.P.; Che, Y.J.; Chen, Z.Y. Product sales forecasting using online reviews and historical sales data: A method combining the Bass model and sentiment analysis. J. Bus. Res. 2017, 74, 90–100. [Google Scholar] [CrossRef]
  38. Lee, C.Y.; Lee, M.K. Demand Forecasting in the Early Stage of the Technology’s Life Cycle Using a Bayesian Update. Sustainability 2017, 9, 1378. [Google Scholar] [CrossRef] [Green Version]
  39. Tsai, B.H. Modeling diffusion of multi-generational LCD TVs while considering generation-specific price effects and consumer behaviors. Technovation 2013, 33, 345–354. [Google Scholar] [CrossRef]
  40. Lin, C.S. Forecasting and analyzing the competitive diffusion of mobile cellular broadband and fixed broadband in Taiwan with limited historical data. Econ. Model. 2013, 35, 207–213. [Google Scholar] [CrossRef] [Green Version]
  41. Tsai, B.H. Modelling Energy Consumption and Carbon Dioxide Emissions of Fossil Fuels and Nuclear Energy using Lotka-Volterra Equations. Appl. Ecol. Environ. Res. 2022, 20, 1435–1455. [Google Scholar] [CrossRef]
  42. Tsai, B.H.; Hsu, C.S.; Balachandran, B.K. Modeling competition between mobile and desktop personal computer LCD panels based on segment reporting sales information. J. Acc. Audit. Finance 2013, 28, 273–291. [Google Scholar] [CrossRef]
  43. Bass, F.M. A new product growth for model consumer durables. Manag. Sci. 1969, 15, 215–227. [Google Scholar] [CrossRef]
  44. Martin, C.A.; Witt, S.F. Accuracy of econometric forecasts of tourism. Ann. Tour. Res. 1989, 16, 407–428. [Google Scholar] [CrossRef]
  45. Hritonenko, N.; Yatsenko, Y. Mathematical Modeling in Economics, Ecology and the Environment; Springer: New York, NY, USA, 1999. [Google Scholar]
Figure 1. Trajectories of energy consumption in the United States.
Sustainability 15 10076 g001
Figure 2. Trajectories of energy consumption in Africa.
Sustainability 15 10076 g002
Figure 3. The United States’ fossil fuel consumption trajectories.
Sustainability 15 10076 g003
Figure 4. Africa’s fossil fuel consumption trajectories.
Sustainability 15 10076 g004
Figure 5. The United States’ nuclear consumption trajectories.
Sustainability 15 10076 g005
Figure 6. Africa’s nuclear consumption trajectories.
Sustainability 15 10076 g006
Figure 7. The United States’ renewable consumption trajectories.
Sustainability 15 10076 g007
Figure 8. Africa’s renewable consumption trajectories.
Sustainability 15 10076 g008
Table 1. Coefficients of fossil fuels versus nuclear energy and fossil fuels versus renewable energy in the United States.
Pair oneFossil Nuclear
Coefficientt-Statistic Coefficientt-Statistic
α11.243940 13.313824 ***α21.105225 8.284798 ***
β10.000154 2.415522 **β20.001030 3.844238 **
γ1−0.000306 −1.696481 *γ2−0.000046 −0.554438 *
Adjusted R20.950505 Adjusted R20.994220
Pair twoFossil Renewable
Coefficientt-Statistic Coefficientt-Statistic
α11.108970 26.972427 ***α20.979189 8.450911 ***
β10.000067 2.389635 **β20.000882 0.948305
γ1−0.000225 −0.654088 γ2−0.000062 −0.837827
Adjusted R20.947048 Adjusted R20.799433
Pair one Pair two
FossilNuclear FossilRenewable
ai0.218284 0.100049 0.103432 −0.021030
bi0.000138 0.000980 0.000064 0.000891
ci−0.000274 −0.000044 −0.000213 −0.000063
Note: *, **, and *** denote the significance of the p-value at the 0.1, 0.05, and 0.01 levels, respectively.
Table 2. Coefficients of fossil fuels versus nuclear energy and fossil fuels versus renewable energy in Africa.
Pair oneFossil Nuclear
Coefficientt-Statistic Coefficientt-Statistic
α11.051173 89.372333 *** α21.630882 6.406432 ***
β1−0.000046 −0.674886 β20.416840 3.213824 ***
γ10.013378 2.246280 ** γ2−0.001775 −2.524072 **
Adjusted R20.997634 Adjusted R20.952987
Pair twoFossil Renewable
Coefficientt-Statistic Coefficientt-Statistic
α11.068860 87.860238 *** α21.023909 51.700878 ***
β10.000725 3.641271 *** β20.000270 0.061292
γ1−0.008547 −3.312911 *** γ2−0.000074 −0.223302
Adjusted R20.997888 Adjusted R20.992614
Pair one Pair two
FossilNuclear FossilRenewable
ai0.049907 0.489121 0.066593 0.023628
bi−0.000045 0.323175 0.000701 0.000266
ci0.013047 −0.001376 −0.008266 −0.000073
Note: **, and *** denote the significance of the p-value at the 0.05, and 0.01 levels, respectively.
Table 3. Forecast accuracy (MAPE) of the Lotka–Volterra model and the Bass model in the test period (2015~2021).
United StatesAfrica
Lotka–VolterraBassLotka–VolterraBass
Pair one
Fossil Fuels5.75%8.33%4.92%4.66%
Nuclear Energy3.70%22.53%21.02%42.27%
Pair two
Fossil Fuels6.95%8.33%12.92%4.66%
Renewable Energy25.73%27.11%4.04%16.24%
Disclaimer/Publisher’s Note: The statements, opinions and data contained in all publications are solely those of the individual author(s) and contributor(s) and not of MDPI and/or the editor(s). MDPI and/or the editor(s) disclaim responsibility for any injury to people or property resulting from any ideas, methods, instructions or products referred to in the content.

