Article

Mapping Groundwater Potential Zones in the Habawnah Basin of Southern Saudi Arabia: An AHP- and GIS-based Approach

by
Abdulnoor A. J. Ghanim
1,
Ahmed M. Al-Areeq
2,*,
Mohammed Benaafi
2,
Mohammed S. Al-Suwaiyan
3,4,
Amran A. Al Aghbari
5 and
Mana Alyami
1
1
Civil Engineering Department, College of Engineering, Najran University, Najran 61441, Saudi Arabia
2
Interdisciplinary Research Center for Membranes and Water Security (IRC-MWS), King Fahd University of Petroleum and Minerals (KFUPM), Dhahran 31261, Saudi Arabia
3
Department of Civil and Environmental Engineering, King Fahd University of Petroleum and Minerals (KFUPM), Dhahran 31261, Saudi Arabia
4
Interdisciplinary Research Center for Construction and Building Materials (IRC-CBM), King Fahd University of Petroleum and Minerals (KFUPM), Dhahran 31261, Saudi Arabia
5
College of Engineering and Physics, King Fahd University of Petroleum and Minerals (KFUPM), Dhahran 31261, Saudi Arabia
*
Author to whom correspondence should be addressed.
Sustainability 2023, 15(13), 10075; https://doi.org/10.3390/su151310075
Submission received: 26 May 2023 / Revised: 18 June 2023 / Accepted: 23 June 2023 / Published: 26 June 2023

Abstract

:
The excessive depletion of groundwater resources and significant climate change have exerted immense pressure on global groundwater reserves. Owing to the rising global demand for drinking water, as well as its use in agriculture and industry, there is an increasing need to evaluate the capacity and effectiveness of underground water reservoirs (aquifers). Recently, GIS has gained significant attention for groundwater exploration because of its ability to provide rapid and comprehensive information about resources for further development. This study aims to assess and map the groundwater potential of a large basin located in the southern region of Saudi Arabia. Techniques such as GIS and AHP were employed in this study. To perform the delineation for the groundwater potential zones (GWPZ), seven thematic layers were prepared and analyzed. These layers include geology, slope, land use, lineament densities, soil characteristics, drainage density, and rainfall. These variables were carefully considered and examined to identify and categorize areas based on their respective groundwater potentials. The assigned weights to each class in the thematic maps were determined using the well-known analytic hierarchy process (AHP) method. This methodology considered the characteristics of each class and their capacity to influence water potential. The results’ precision was verified by cross-referencing it with existing information about the area’s potential for groundwater. The resulting GWPZ map was classified into the following five categories: very low, low, moderate, high, and very high. The study revealed that approximately 42.56% of the basin is classified as having a high GWPZ. The low and moderate potential zones cover 36.12% and 19.55% of the area, respectively. Very low and very high potential zones were found only in a limited number of areas within the basin. This study holds global importance as it addresses the pressing challenge of depleting groundwater resources. With rising demands for drinking water, agriculture, and industry worldwide, the effective evaluation and management of underground water reservoirs are crucial. By utilizing GIS and AHP techniques, this study provides a valuable assessment and the mapping of groundwater potential in a large basin in southern Saudi Arabia. Its findings and methodology can serve as a model for other regions, supporting sustainable water resource management globally.

1. Introduction

Groundwater (GW) is a crucial and precious resource retained within subsurface geological formations in Earth’s crustal zone [1]. Its availability supports domestic, industrial, agricultural, and other forms of development. However, this limited resource is severely strained by the increasing demand for water to meet human needs and technological advancements. Several natural and anthropogenic factors impact the occurrence and distribution of GW. Regions experiencing significant population growth and industrialization, particularly those in the tropics and subtropics, often face GW-related challenges. In arid countries such as Saudi Arabia, surface water may not always be readily available for various uses, leading to a heavy reliance on GW for daily needs [2]. Due to water scarcity, GW resources in Saudi Arabia are being heavily utilized; it is reported that 37% of extracted GW is used for domestic and more than 82% for irrigation purposes [3]. The main deep groundwater aquifer in Saudi Arabia is being depleted at an alarming rate, with studies indicating that approximately 92 to 97% of irrigated land in the eight regions of the country rely on this non-renewable source of water [4].
It is important to note that groundwater exploration techniques in arid and semi-arid regions have benefits and limitations. Traditional methods, such as geophysical surveys, offer non-invasive data collection for groundwater potential but require skilled personnel and may involve high costs and misinterpretations. Drilling provides direct access to the subsurface and reliable data but is invasive, expensive, time-consuming, and may have environmental impacts, with limited spatial coverage. Hydrogeological investigations help assess groundwater resources and hydrogeological processes, but they require extensive fieldwork and may face inaccuracies and challenges in predicting complex processes. In contrast, the integrated approach using remote sensing, GIS, and the analytical hierarchy process (AHP) overcomes some of these limitations, offering a more efficient and accurate assessment of groundwater potential zones [5,6]. Alternatively, geospatial tools offer a swift and cost-efficient approach for generating and modeling crucial data for different geoscience applications [6]. The literature demonstrates that researchers have employed various techniques in GW exploration to map potential zones. These methods include frequency–ratio models [7], decision-making tools [6,8], weights-of-evidence [9], logistic regression [10], evidential belief functions [11], and certainty factors [12]. Furthermore, other advanced techniques, such as machine learning algorithms, including but not limited to decision trees [13], deep learning models [14], and random forest (RF) [15], have been utilized to achieve the exploration and mapping of potential GW zones [16].
Remote sensing and GIS have been recognized as powerful tools for the rapid estimation of natural resources, especially compared to other traditional approaches [17,18]. These techniques can be utilized for the efficient exploration of GW resources before investing in more expensive and time-consuming surveying methods. The scientific literature reveals that remote sensing and GIS tools have been generally utilized for mapping GW potential zones in different regions of the world, and numerous studies have confirmed the efficacy of these approaches. For instance, Derdour et al. [19] mapped the potential zones of GW in the Chott-El-Gharbi watershed (Algerian–Moroccan border) using integrated remote sensing and GIS techniques. They incorporated lineament, geology, precipitation, GW level, drainage density, slope, land use, and elevation data. They found good GW potential in the central part of the investigated region, whereas the bare plains had moderate to poor GW potential. Rather et al. [20] coupled remote sensing techniques with GIS and AHP to map zones of potential GW within the watershed boundaries of the Jhelum Basin, India. The study utilized seven datasets of lineaments, geology, soil, slope, geomorphology, land use, and drainage density to detect potential GW zones. The findings revealed that certain areas within the Pohru watershed exhibit high GW potential, which can be utilized for domestic and irrigation purposes. Petrick et al. [21] assessed GW potential in Penang Island in Malaysia. This study integrates GIS, remote sensing, geology, and hydrological data with AHP to analyze potential GW zones. The study demonstrates that combining remote sensing, GIS, fieldwork, and models can effectively map GW zones. Muniraj et al. [22] used remote sensing, a geographical information system (GIS), and analytic hierarchy process (AHP) techniques to identify groundwater potential zones in the Tirunelveli District, India. They integrated various thematic layers, including geomorphology, geology, lineament density, and drainage density, to create a potential groundwater map. Elewa et al. [23] used Enhanced Thematic Mapper Plus (ETM+) images, a geographic information system (GIS), a watershed modeling system (WMS), and weighted spatial probability modeling (WSPM) to identify the groundwater potential areas in the Sinai Peninsula, Egypt. They found that these techniques effectively delineate groundwater zones with low effort and short time. Abuzied, S. M. [24], utilized an integrated approach of remote sensing, GIS, and machine learning algorithms to map groundwater potential zones in the Wadi Watir watershed, Egypt. He used various thematic layers, including geology, geomorphology, soil, and climate data, as input variables for the models.
Exploring and identifying potential GW resources in regions characterized by complex geological composition and limited porous sedimentary succession, particularly in basement complexes, is challenging [25]. Developing cost-effective techniques for detecting and mapping these potential GW zones strongly motivates research and development. With the increasing demand for freshwater resources, the accurate and efficient delineation of the potential zones of GW in such regions can play a vital role in addressing water scarcity and meeting the growing water demands of society. Moreover, it can help support achieving sustainability development goals worldwide. The current study aims to explore the occurrence of GW in the Habawnah basin basement complex situated in the southern region of Saudi Arabia using remote sensing, GIS, and analytical hierarchy process (AHP) techniques. Overall, incorporating AHP into this study enhanced the accuracy and reliability of assessing groundwater potential in the large basin. By combining GIS and AHP techniques, the study introduced an innovative approach to sustainable water resource management and decision-making in the face of the rising demand for water for drinking, agriculture, and industry in the region.

2. Area of Study and Methods
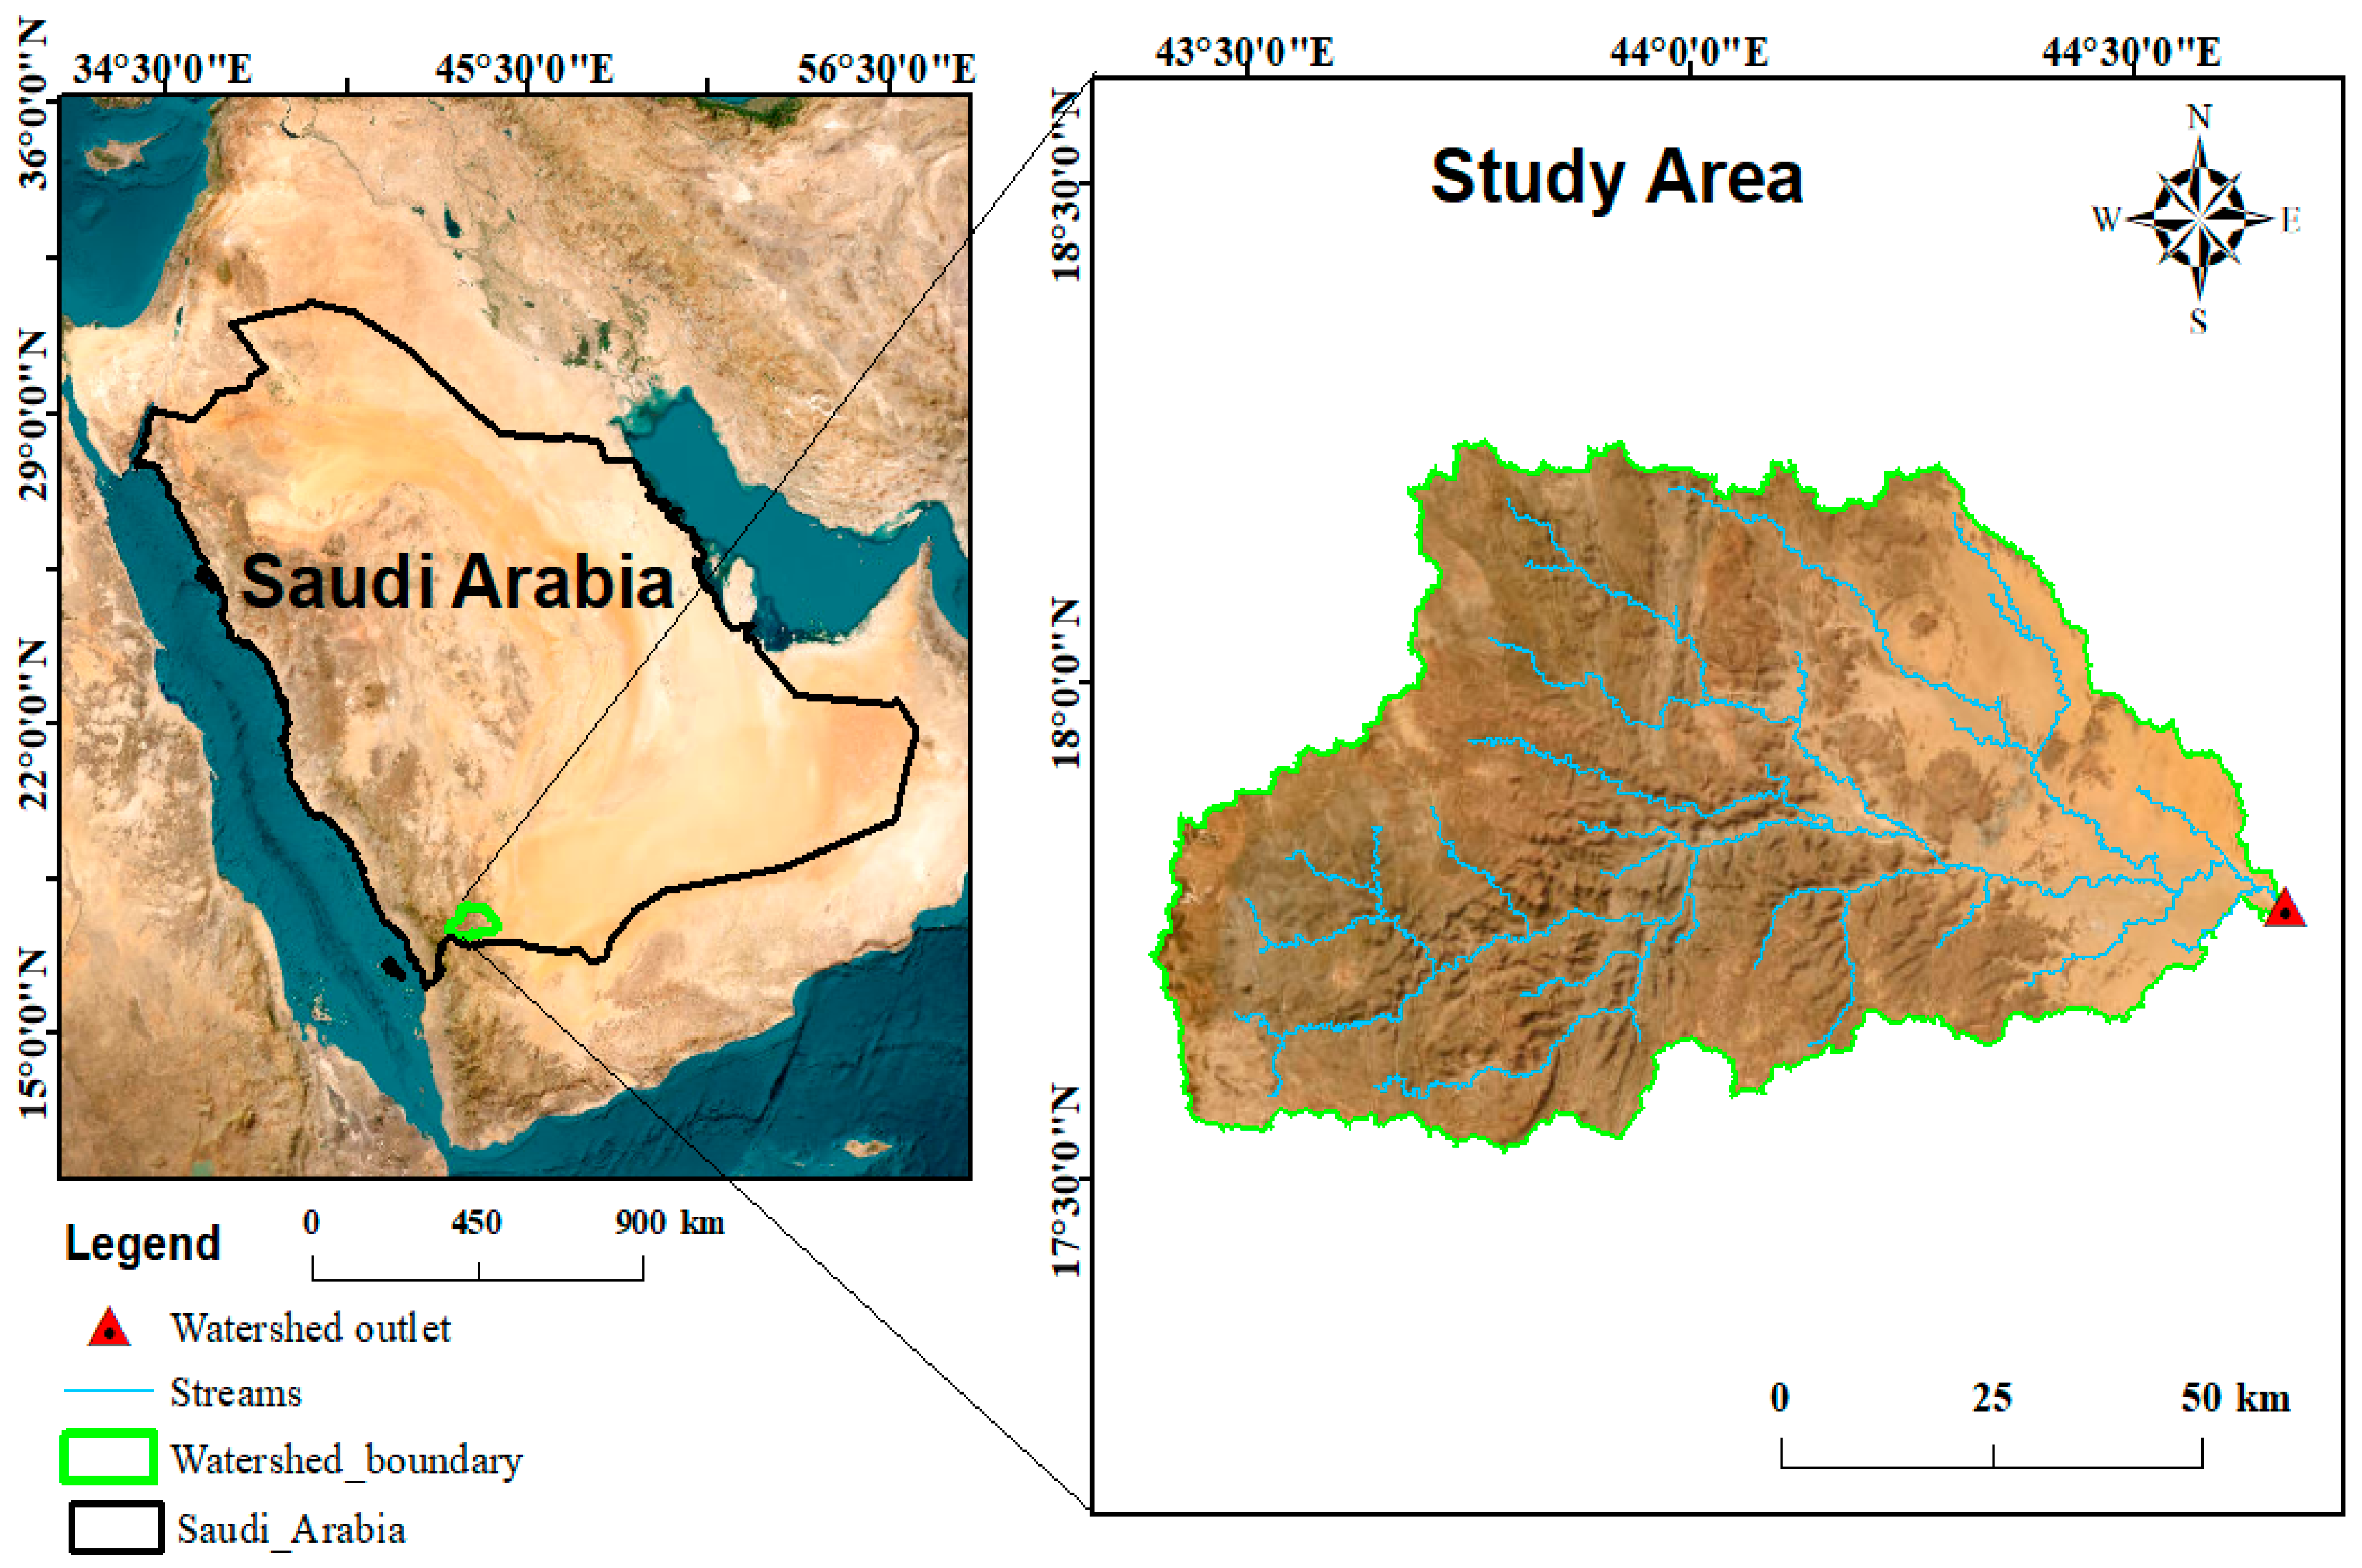
2.1. Study Area

The study area is located in the southern part of Saudi Arabia’s Najran region, covering longitudes 43°20′ to 44°40′ and latitudes 17°30″ to 18°20′ (Figure 1). The Habawnah Basin, located in the Najran region of southern Saudi Arabia, is a relatively small basin with an area of approximately 4930 square kilometers. The basin is characterized by a complex geological structure, with sedimentary and metamorphic rocks overlying a basement of crystalline rocks. The basin is also home to the Habawnah Mountain, a prominent feature in the region. The Habawnah Basin is an important source of groundwater for the surrounding communities, which rely on it for agricultural and domestic purposes. However, the basin is facing challenges related to groundwater depletion, overuse, and contamination, which could have significant consequences for agriculture, public health, and economic activity in the region. The geology of the Habawnah Basin is characterized by complex geological structures [26]. The Najran region is distinguished by a notable drainage system, including Wadi Najran and Wadi Habawnah, which run towards the east and empty into the desert of Ar Rub Al Khali [27].
Wadi Habawnah is a prominent wadi or dry riverbed located in the southern part of Saudi Arabia. The wadi runs for approximately 150 km, from the Asir Mountains in the west to the desert of Ar Rub’ al-Khali in the east. The wadi is also home to several natural springs, which provide a source of fresh water in an otherwise arid region.
The city of Najran, located along Wadi Najran, serves as the region’s primary administrative and commercial hub. The city of Najran, located along Wadi Najran, acts as the region’s main administrative and commercial hub. In the eastern part of the Najran region, wind-borne deposits exist, which originate from the Ar Rub’ al-Khali desert and enclose the area [28]. The elevation in the Najran region varies between approximately 1089.3 m to 2747.62 m above the mean sea level. The region’s rugged topography features a deeply dissected plateau (Figure 2).

2.2. Methodology

Geospatial methods were employed in this study to determine the potential zones for groundwater in the Habawnah Basin. A knowledge-based factor analysis approach was utilized to analyze seven information layers: geology, slope, land use, lineament density, soil characteristics, drainage density, and rainfall. The remote sensing data of the Najran basin were processed and analyzed using ArcGIS 10.7 software for pre-processing. The basin boundary was delineated using the Shuttle Radar Topographic Mission (30 m resolution SRTM) data supported by the WMS software.
Initially, the land use (LU) types were acquired from the Global Land Cover dataset (https://lcviewer.vito.be/, accessed on 1 April 2023) with a resolution of 100 m. These initial classifications were then refined via comparison with aerial photographs to ensure accuracy and improve quality. Soil type information was sourced from (www.openlandmap.org, accessed on 1 April 2023) at a spatial resolution of 250 m. The geology map was obtained from the Saudi Geological Survey. The remaining thematic layers were extracted from DEM. The observed well information was obtained from the Ministry of Environment, Water, and Agriculture (MEWA). All layers were projected based on the UTM-WGS 84, Zone 38 North coordinate system.
Thematic maps were rasterized and recategorized on a scale of 1 to 5. Theme classes were divided depending on the aquifer’s potential, which ranged from very low to very high. We used weighted overlay analysis to integrate the resulting raster maps, creating the GWPZ map. The resulting GWPZ map was categorized into five classes that range from very low to very high. Figure 3 shows the approach utilized in this study. Thematic layers were constructed using spatial analysis tools in ArcGIS software, specifically the interpolation method and weighted overlay analysis. The inverse distance weighted (IDW) procedure was used for interpolation. These layers were used to assess the aquifer potential. The following shows the step-by-step clarification of the methodology used in the study:
  • Data Preparation: Seven thematic layers were prepared for analysis. These layers included geology, slope, land use, lineament densities, soil characteristics, drainage density, and rainfall. Each layer provides information relevant to groundwater potential assessment.
  • Variable Examination: The variables in each thematic layer were carefully considered and examined. This step involved analyzing the characteristics and attributes of each variable to understand their influence on groundwater potential.
  • Weight Assignment: The analytic hierarchy process (AHP) method was employed to assign weights to each class within the thematic maps. The AHP method is a well-known decision-making technique that helps determine the relative importance or influence of different factors. In this study, the characteristics of each class and its capacity to influence water potential were taken into account when assigning weights.
  • Delineation of groundwater potential zones (GWPZ): Using the assigned weights, the study performed the delineation of groundwater potential zones. This step involved classifying and categorizing areas within the study basin based on their respective groundwater potentials. The precise delineation aimed to provide a comprehensive understanding of the distribution and extent of groundwater potential.
  • Result Validation: To ensure the precision of the results, the generated GWPZ map was cross-referenced with existing information about the area’s potential for groundwater. This validation process helped verify the accuracy of the delineated zones.

2.3. Analytical Hierarchical Process (AHP)

AHP is a generally recognized and commonly utilized GIS-based method for delineating GWPZ by considering multiple criteria [29,30,31]. This method facilitated the integration of various thematic layers, with seven distinct layers considered in this study. These layers are essential to understanding the storage and flow of water in an area. The relationships between these influencing factors were assigned to weights based on their impact on the occurrence of groundwater and expert opinions [32]. Parameters with higher weights indicated a greater influence, whereas those with lower weights had a lesser impact on the groundwater potential. The assignment of weights was accomplished by utilizing a pairwise comparison matrix within the analytic hierarchy process (AHP) framework, as shown in Table 1.
The parameters were assigned ranks based on a combination of field survey experiences, stakeholder consultations, expert opinion surveys, and references to the existing literature [33,34]. Because mountains dominate the study area, geology was assigned the highest weight. On the other hand, rainfall was assigned a relatively low weight owing to variations between the western mountainous region, which receives ample rainfall, and the eastern desert area, resulting in a flow of rainfall from west to east due to the steep slope’s effect. Accordingly, assigning a high weight to rainfall would negatively impact the results.
Following the assigned weights to the respective parameters, the sub-variables were ranked individually, following the approach described by Yammani [35] and Asadi et al. [36]. The maximum value characterized the highest potential for groundwater, whereas the lowest potential was indicated by the minimum value. The subclasses within each thematic layer underwent reclassification using a GIS platform’s natural break classification method to allocate suitable weights. The subcategories were assessed and assigned ranks ranging from 0 to 5, denoting their respective levels of influence on groundwater development. Table 2 provides an overview of the assigned ranks and weights for the thematic layers.

3. Results and Discussion

3.1. Thematic Layers

3.1.1. Geology

The existence and distribution of groundwater are highly impacted by local geology (surface and subsurface geology). The geology map provided information about the subsurface geological formations in the study area. The geology map helped us to identify the presence of igneous rocks, which can limit groundwater availability, as well as other geological characteristics that influence groundwater storage and recharge. The complex and heterogeneous geology of the Habawnah Basin presented challenges in identifying consistent patterns in groundwater potential across the region. Different geological units of the research region were delineated using the Saudi Geological Survey’s published geological map [37] (Figure 4). The study area is located along the southern contact between the Arabian Shield and the Arabian Platform. It is within the Asir basement terrane, east of the Nabtah fault zone, in the western part of the Ar Rub’ al-Khali basin [38]. The Wajid sandstone sequence, a Paleozoic sandstone, overlies the basement terrane in the study area. The geological map of the study area, as depicted in Figure 4, was created using three quadrangles’ maps: Najran, Wadi Baysh, and Bi’r Idamah. The geology of the study area is classified into five major lithological families: igneous extrusive and intrusive rock, metamorphic rocks, polylithological rocks, sedimentary rocks, and surficial deposits. The intrusive rock complex consists of pyroclastic and volcaniclastic rocks, including crystal-lithic tuff and epiclastic sedimentary rocks. The intrusive igneous rock consists mainly of diorite, granite, gabbro, and granite-syenite suites. The main lithology of the metamorphic complex is gneiss suite, tonalite, and granodiorite gneiss. The metasedimentary and metavolcanic rocks formed the polylithological unit in the study area. The sedimentary rock is represented by Wajid sandstone layers in the eastern sector of the investigated region. The surficial deposits group consists of alluvium, colluvium, terrace gravel, gravel-plain deposits, and eolian sand. The extrusive igneous rock occupies the southwestern part of the study area, with small batches in the eastern part. The intrusive facies of the complex igneous crop are in the middle part of the study area, east of the extrusive rocks. The metamorphic rock facies cover a lower percentage of the study area than igneous or sedimentary rocks. The metasedimentary and metavolcanic rocks of the polylithological group formed two NEE–SWW belts in the western part of the study area. The sedimentary rock (mainly sandstone) and sedimentary surficial deposits covered the eastern half of the study area. However, sedimentary rock filled certain subbasins and topographic depressions in the western part of the study area.

3.1.2. Lineament Density

Lineament analysis provides an insight into the presence of water leakage through faults, fractures, and joints. The presence of joints, fractures, fault systems, and rock weathering was observed in the study area, which primarily consists of hard rocks. The clustering of lineaments is significant because it can indicate areas with a greater quantities, longer lengths, and wider widths of fractures. These lineaments serve as conduits and promote more effective fracture connectivity, which can lead to increased aquifer replenishment [39].
Geological maps and satellite images were used to identify and analyze the lineaments. The information obtained from these sources is critical for understanding fracture systems at both the surface and subsurface levels, which directly affects the aquifer’s storage capacity [40]. A classification system was used to divide the lineament density into five classes, ranging from very low to very high (Figure 5). Regions with lineament densities varying from high to very high have a great potential for aquifer replenishment, storage, and leakage. The lineament density map was reclassified into five classes representing different potentials, from very low to very high lineament density, as illustrated in Table 2 and Figure 5.

3.1.3. Slope

The slope of the terrain is a crucial characteristic that indicates the degree of inclination of the land surface. It provides important information about regional geological and geodynamic processes. Additionally, the slope affects the infiltration rate and surface runoff [41]. Areas with larger slopes tend to have a smaller recharge, due to the quick water flow during rainfall, resulting in decreased infiltration. As a result, water does not remain in the area long enough to replenish the saturated zone [42]. A slope map was created from the 30 m DEM, using the spatial analysis tool in the ArcGIS10.7 environment. The slope map of the Habawnah Basin is depicted in Figure 6, where high weights are assigned to smooth and gentle slopes, and low weights are assigned to steep and very steep slopes.

3.1.4. Land Use (LU)

Land use (LU) classification provides crucial information about infiltration, soil moisture, surface water, groundwater, and groundwater requirements [43,44]. In the Habawnah Basin, various land use categories exist, such as rangeland, flooded vegetation, built-up areas, agricultural land, and bare land. The LU types were downloaded from the Global Land Cover (https://lcviewer.vito.be/, accessed on 1 April 2023) at a 100 m resolution, then adjusted after comparing the field information and aerial photographs using ArcGIS10.7. The predominant land use class in the area is rangeland, followed by bare land and built-up areas. Some land use classes, such as agricultural lands, contain a significantly higher amounts of water than built areas and bare land [45,46]. The LU agricultural land classes were given a high weight owing to their high water content. In contrast, built areas, bare land, and rangeland were assigned a low weight owing to their low water content. Figure 7 illustrates the LU map of the Habawnah Basin. Rangeland enclosed 79.9% of the basin, followed by bare land (15.4%), built area (4.4%), flooded vegetation (0.17%), crops (0.14%), and water (0.01%). The LULC map provided information about the different types of land uses and land covers in the study area. By analyzing this map, the areas where specific land uses might influence groundwater availability and recharge can be identified. For example, agricultural areas with high water consumption crops or urban areas with extensive impervious surfaces could affect groundwater infiltration and recharge rates. The LULC map helped in understanding the relationship between land use practices and groundwater potential.

3.1.5. Soil Type

Soil type is important in determining the quantity of water that can penetrate underground formations, ultimately affecting groundwater replenishment [41,44]. Estimating the infiltration rate largely takes into account the soil’s texture and hydraulic characteristics. Soil type was downloaded from (www.openlandmap.org, accessed on 1 April 2023) at a spatial resolution of 250 m. The final soil type map was developed for the Makkah watershed using ArcGIS10.7. Figure 8 shows a soil map of the Habawnah Basin. Sandy loam covers 44.9% of the basin, followed by loamy sand (26.7%), sand (21.3%), sandy clay loam (6.2%), loam (0.87%), and clay loam (0.01%) (Table 3).

3.1.6. Drainage Density

The density of a drainage network is a critical factor in determining the availability and contamination of groundwater [47]. The lithology of an area affects the drainage network and provides valuable information on the infiltration rate. Identifying potential groundwater zones relies significantly on drainage density, as it is inversely related to permeability. The total length of rivers within a drainage basin is divided by the total basin area to determine drainage density [43]. Groundwater resources have less potential when there is minimal water infiltration into the earth due to excessive drainage density. A low drainage density implies lower runoff and a greater potential for infiltration, affecting groundwater potential. The drainage density map was extracted from the 30 m DEM using the spatial analysis tool in the ArcGIS10.7 environment. A significant weight was assigned to a low drainage density to classify an area based on its groundwater potential, whereas a lower weight was allocated to a high drainage density. A map of drainage density for the Habawnah Basin is shown in Figure 9.

3.1.7. Rainfall

Rainfall is essential to the hydrological cycle as the primary water supply and greatly impacts groundwater in a specific area. When compared to other products in Saudi Arabia, the IMERG product demonstrated excellent performance [48]. The IMERG dataset was obtained from the Precipitation Measurement Missions (PMM) website (http://pmm.nasa.gov/data-access/downloads/gpm, accessed on 1 April 2023) for this study. The IMERG dataset has a spatial resolution of 0.1° × 0.1° and a temporal resolution of 30 min. Rainfall data were imported into ArcGIS as point data and used to generate a rainfall map. Annual rainfall varied between 39.8 mm and 107.1 mm. The inverse distance weighted (IDW) technique was applied for mapping as it has been found to yield satisfactory outcomes [49,50]. Figure 10 shows the categorization of the rainfall map, which was rescaled to a spatial resolution of 10 square meters and classified using the natural break classification approach into five subclasses (Jenks).

3.2. Groundwater Potential Zone (GWPZ)

Groundwater availability, as a renewable resource, has been greatly reduced over the last few decades due to unbalanced development and human activities. A comprehensive understanding of the potential of groundwater is essential to ensure sustainable planning and development in any area. This information is crucial for implementing actions to enhance groundwater recharge. In the Habawnah Basin, groundwater is found in both unconfined and confined aquifers, primarily in sedimentary surficial deposits, sedimentary rocks, and metamorphic rocks. Groundwater availability varies both spatially and temporally, necessitating detailed and accurate resource assessment. Various factors, including geology, slope, land use (LU), lineament density, soil characteristics, drainage density, and rainfall, were considered in the assessment. The weighted overlay technique was used to generate a groundwater potential zones map in the Habawnah Basin, categorized as having very low (3.64 km2), low (2750.1 km2), moderate (1488.44 km2), high (3240.17 km2), and very high (130.72 km2) potential (Figure 11). These zones are dispersed throughout the basin, where the highland regions have a higher concentration of extremely low and low groundwater potential zones. Moderate potential zones are generally found in the midlands and lowlands with a high drainage density. High potential zones are located in the midland and lowland areas and are characterized by high infiltration potential. Lowland areas are primarily characterized by the presence of very high potential groundwater zones. The presence of low- and very low-potential zones can be attributed to factors such as the presence of igneous rocks, steep slopes, and high drainage density.
Figure 11 shows that groundwater buildup is concentrated in fault-bounded depressions and wadis in different locations within the study area, primarily in the eastern area. The presence of inferred faults contributes to groundwater accumulation, leading to an increased water table and significant potential for groundwater resources. Similar findings have been reported for the Arabian–Nubian Shield region [51,52,53].
The findings of this study align with previous investigations on groundwater flow in the Habawnah Basin, indicating flow routes typically in the eastern direction towards the desert. The study also validated potential groundwater zones by comparing them with data from observational wells. Of the 28 wells analyzed, one fell within a low potential zone, seven within moderate potential zones, and two within very high potential zones, while the majority of the wells (18) were located in high potential zones. Among these wells, 27 align with the Habawnah Basin’s categories for groundwater potential zone alignment, except for one that does not fully match due to its proximity to densely populated areas or intensive agricultural activity. This well is situated on mountainous terrain. Although the data of the observation wells include the water elevation depth for each, it cannot be used for validation because it is not located in the same aquifer. This was because the study area had several aquifers (confined and unconfined). The study concludes that AHP techniques and GIS used to delineate groundwater potential zones are valuable tools for basin-level planning and development in arid and semiarid regions.
The present study successfully employed a combination of the analytic hierarchy process (AHP) and geographic information system (GIS) techniques to identify and classify potential groundwater zones within the Habawnah Basin in southern Saudi Arabia. This approach is consistent with previous studies that have utilized remote sensing, GIS, and AHP techniques to map groundwater potential zones in arid regions [54]. Similar to the current study, these previous studies have also integrated various thematic layers, such as geology, geomorphology, soil characteristics, drainage density, and rainfall data, to develop groundwater potential maps [55].
The distribution of groundwater potential zones in the Habawnah Basin, with very low to very high zones covering different percentages of the area, aligns with the spatial variability observed in other studies [23,55]. The accuracy of the groundwater potential map was validated by comparing it with the locations of existing wells in the study area, which is a common approach used in previous research [56].
This study shares several limitations with previous research, including the exclusion of additional thematic layers that could have improved the accuracy of the results [22,55]. The limited availability of data at the geographic scale and the complexity and heterogeneity of the Habawnah Basin’s geology make it difficult to identify consistent patterns in groundwater potential, similar to the challenges faced in other regions.
Despite these limitations, this study provides valuable insights for decision makers involved in the planning and management of groundwater resources, particularly for urban and agricultural purposes. The practical significance of this research is highlighted by its potential applications in improving irrigation systems, increasing agricultural productivity, and facilitating sustainable water management in urban areas. These findings align with the goals of previous studies, such as optimizing groundwater resource allocation and addressing water supply challenges in arid regions [54,55].

4. Conclusions and Recommendations

The primary objective of this study was to identify and classify potential groundwater zones within the Habawnah Basin, a large mountainous region in southern Saudi Arabia. A combination of analytic hierarchy process (AHP) and geographic information system (GIS) techniques was employed to achieve this. This study incorporated seven thematic layers to assess and define possible groundwater zones, namely geology, slope, land use (LU), lineament density, soil characteristics, drainage density, and rainfall.
The resulting map divides the Habawnah Basin into five distinct groundwater potential zones: very high, high, moderate, low, and very low. Zones with very low and low groundwater potential were more common in highland areas. In contrast, regions with a high drainage density in the midlands and lowlands frequently have moderate potential zones. Typically, places with significant groundwater potential are found in midland and lowland regions with good infiltration capacity. In contrast, the majority of very high-potential zones are primarily located in low-lying areas. The occurrence of low- and very low-potential zones can be attributed to several factors. These include the presence of igneous rocks, which may limit groundwater availability, as well as high drainage density and steep slopes, which can affect the ability of groundwater to recharge and be stored in the area.
The distribution of potential zones of groundwater in the study area is as follows:
  • Very low zone: 0.05% of the area;
  • Low zone: 36.12% of the area;
  • Moderate zone: 19.55% of the area;
  • High zone: 42.56% of the area;
  • Very high zone: 1.72% of the area.
The groundwater potential zone map’s accuracy was validated by considering the locations of the existing wells in the study area.
One limitation of the study is that the inclusion of additional thematic layers, such as aquifer thickness, pre- and post-monsoon groundwater depth, recharge rate, distance to rivers, and the amount of water utilized for agricultural and household purposes, could have improved the accuracy of the results. Unfortunately, due to the limited availability of data at the geographic scale, only a limited number of thematic layers could be considered in this study. Additionally, anthropogenic activities, such as pumping groundwater for domestic or agricultural use, might significantly impact groundwater availability and recharge rates and were not taken into account in this study. These activities may also alter the subsurface geology, making mapping more challenging. Additionally, the geology of the Habawnah Basin is complex and heterogeneous, which can lead to significant variations in groundwater availability across the region. This can make it challenging to identify consistent patterns in groundwater potential.
Despite these limitations, the application of research findings in improving irrigation systems, increasing agricultural productivity, and facilitating sustainable water management for urban areas underscores the practical significance of this study. Decision makers can leverage these insights to optimize groundwater resource allocation, enhance agricultural practices, and address water supply challenges in urban settings. Overall, the research provides valuable guidance to decision makers involved in managing groundwater resources for urban and agricultural purposes, enabling sustainable water management and supporting regional development.
In summary, this study successfully employed GIS and AHP techniques to assess and map the groundwater potential of a large basin in southern Saudi Arabia. The results identified the basin’s high, low, and moderate potential zones. This study highlights the need for future research to expand the study to other regions, conduct long-term monitoring, validate the results through field investigations, and integrate socio-economic factors. These future endeavors would enhance the global understanding of groundwater potential, support sustainable water resource management, and address the increasing demand for water in various sectors.

Author Contributions

A.A.J.G. and A.M.A.-A., conceptualization; A.M.A.-A., data curation; A.A.J.G., A.M.A.-A., M.B., A.A.A.A. and M.S.A.-S., formal analysis; A.A.J.G., A.M.A.-A., M.B., M.S.A.-S., A.A.A.A. and M.A., Investigation; A.A.J.G., A.M.A.-A. and M.S.A.-S., methodology; A.A.J.G., A.M.A.-A., M.B., M.S.A.-S., A.A.A.A. and M.A., resources; A.A.J.G., A.M.A.-A. and A.A.A.A., software; A.A.J.G. and A.M.A.-A., validation; A.M.A.-A., visualization; A.A.J.G., A.M.A.-A., M.B., M.S.A.-S., A.A.A.A. and M.A., writing—original draft; A.A.J.G., A.M.A.-A., M.B., M.S.A.-S., A.A.A.A. and M.A., writing—review and editing. All authors have read and agreed to the published version of the manuscript.

Funding

This research was funded by the Deanship of Scientific Research at Najran University—Kingdom of Saudi Arabia under code number (NU/NRP/SERC/12/3).

Institutional Review Board Statement

Not applicable.

Informed Consent Statement

The publication of this research has scientific consent.

Data Availability Statement

Data will be supplied upon request from corresponding author.

Acknowledgments

The authors are thankful to the Deanship of Scientific Research at Najran University for funding this work under the Research Priorities program (NU/NRP/SERC/12/3). The authors would also like to acknowledge the support provided by the Interdisciplinary Research Center for Membranes and Water Security at KFUPM in completing this study.

Conflicts of Interest

The authors declare no conflict of interest.

References

  1. Awadh, S.M.; Al-Mimar, H.; Yaseen, Z.M. Groundwater Availability and Water Demand Sustainability over the Upper Mega Aquifers of Arabian Peninsula and West Region of Iraq. Environ. Dev. Sustain. 2021, 23, 1–21. [Google Scholar] [CrossRef]
  2. Enssle, C.; Freedman, J. Addressing Water Scarcity in Saudi Arabia: Policy Options for Continued Success; FAO: Rome, Italy, 2017. [Google Scholar]
  3. Statistical Yearbook of 2017|Issue Number: 53|General Authority for Statistics. Available online: https://www.stats.gov.sa/en/929-0 (accessed on 26 May 2023).
  4. Ghanim, A.A. Water resources crisis in Saudi Arabia, challenges and possible management options: An analytic review. Int. J. Environ. Ecol. Eng. 2019, 13, 51–56. [Google Scholar] [CrossRef]
  5. Mallick, J.; Singh, C.K.; Al-Wadi, H.; Ahmed, M.; Rahman, A.; Shashtri, S.; Mukherjee, S. Geospatial and Geostatistical Approach for Groundwater Potential Zone Delineation. Hydrol. Process. 2015, 29, 395–418. [Google Scholar] [CrossRef]
  6. Kpiebaya, P.; Amuah, E.E.Y.; Shaibu, A.-G.; Baatuuwie, B.N.; Avornyo, V.K.; Dekongmen, B.W. Spatial Assessment of Groundwater Potential Using Quantum GIS and Multi-Criteria Decision Analysis (QGIS-AHP) in the Sawla-Tuna-Kalba District of Ghana. J. Hydrol. Reg. Stud. 2022, 43, 101197. [Google Scholar] [CrossRef]
  7. Rahmati, O.; Pourghasemi, H.R.; Zeinivand, H. Flood Susceptibility Mapping Using Frequency Ratio and Weights-of-Evidence Models in the Golastan Province, Iran. Geocarto Int. 2016, 31, 42–70. [Google Scholar] [CrossRef]
  8. Arulbalaji, P.; Padmalal, D.; Sreelash, K. GIS and AHP Techniques Based Delineation of Groundwater Potential Zones: A Case Study from Southern Western Ghats, India. Sci. Rep. 2019, 9, 2082. [Google Scholar] [CrossRef] [PubMed] [Green Version]
  9. Maity, B.; Mallick, S.K.; Das, P.; Rudra, S. Comparative Analysis of Groundwater Potentiality Zone Using Fuzzy AHP, Frequency Ratio and Bayesian Weights of Evidence Methods. Appl. Water Sci. 2022, 12, 63. [Google Scholar] [CrossRef]
  10. Chen, W.; Li, Y.; Tsangaratos, P.; Shahabi, H.; Ilia, I.; Xue, W.; Bian, H. Groundwater Spring Potential Mapping Using Artificial Intelligence Approach Based on Kernel Logistic Regression, Random Forest, and Alternating Decision Tree Models. Appl. Sci. 2020, 10, 425. [Google Scholar] [CrossRef] [Green Version]
  11. Thanh, N.N.; Thunyawatcharakul, P.; Ngu, N.H.; Chotpantarat, S. Global Review of Groundwater Potential Models in the Last Decade: Parameters, Model Techniques, and Validation. J. Hydrol. 2022, 614, 128501. [Google Scholar] [CrossRef]
  12. Razandi, Y.; Pourghasemi, H.R.; Neisani, N.S.; Rahmati, O. Application of Analytical Hierarchy Process, Frequency Ratio, and Certainty Factor Models for Groundwater Potential Mapping Using GIS. Earth Sci. Inf. 2015, 8, 867–883. [Google Scholar] [CrossRef]
  13. Chen, Y.; Chen, W.; Chandra Pal, S.; Saha, A.; Chowdhuri, I.; Adeli, B.; Janizadeh, S.; Dineva, A.A.; Wang, X.; Mosavi, A. Evaluation Efficiency of Hybrid Deep Learning Algorithms with Neural Network Decision Tree and Boosting Methods for Predicting Groundwater Potential. Geocarto Int. 2022, 37, 5564–5584. [Google Scholar] [CrossRef]
  14. Bai, Z.; Liu, Q.; Liu, Y. Groundwater Potential Mapping in Hubei Region of China Using Machine Learning, Ensemble Learning, Deep Learning and Automl Methods. Nat. Resour. Res. 2022, 31, 2549–2569. [Google Scholar] [CrossRef]
  15. Thanh, N.N.; Chotpantarat, S.; Trung, N.H.; Ngu, N.H. Mapping Groundwater Potential Zones in Kanchanaburi Province, Thailand by Integrating of Analytic Hierarchy Process, Frequency Ratio, and Random Forest. Ecol. Indic. 2022, 145, 109591. [Google Scholar] [CrossRef]
  16. Tamiru, H.; Wagari, M. Comparison of ANN Model and GIS Tools for Delineation of Groundwater Potential Zones, Fincha Catchment, Abay Basin, Ethiopia. Geocarto Int. 2022, 37, 6736–6754. [Google Scholar] [CrossRef]
  17. Bandyopadhyay, J.; Rahaman, S.H.; Karan, C. Agricultural Potential Zone Mapping with Surface Water Resource Management Using Geo-Spatial Tools for Jhargram District, West Bengal, India. Knowl.-Based Eng. Sci. 2023, 4, 1–18. [Google Scholar] [CrossRef]
  18. Halder, B.; Haghbin, M.; Farooque, A.A. An Assessment of Urban Expansion Impacts on Land Transformation of Rajpur-Sonarpur Municipality. Knowl.-Based Eng. Sci. 2021, 2, 34–53. [Google Scholar] [CrossRef]
  19. Derdour, A.; Benkaddour, Y.; Bendahou, B. Application of Remote Sensing and GIS to Assess Groundwater Potential in the Transboundary Watershed of the Chott-El-Gharbi (Algerian–Moroccan Border). Appl. Water Sci. 2022, 12, 136. [Google Scholar] [CrossRef]
  20. Rather, A.F.; Ahmed, R.; Wani, G.F.; Ahmad, S.T.; Dar, T.; Javaid, S.; Ahmed, P. Mapping of Groundwater Potential Zones in Pohru Watershed of Jhelum Basin-Western Himalaya, India Using Integrated Approach of Remote Sensing, GIS and AHP. Earth Sci. Inf. 2022, 15, 2091–2107. [Google Scholar] [CrossRef]
  21. Petrick, N.; bin Jubidi, M.F.; Ahmad Abir, I. Groundwater Potential Assessment of Penang Island, Malaysia, through Integration of Remote Sensing and GIS with Validation by 2D ERT. Nat. Resour. Res. 2023, 32, 523–541. [Google Scholar] [CrossRef]
  22. Muniraj, K.; Jesudhas, C.J.; Chinnasamy, A. Delineating the Groundwater Potential Zone in Tirunelveli Taluk, South Tamil Nadu, India, Using Remote Sensing, Geographical Information System (GIS) and Analytic Hierarchy Process (AHP) Techniques. Proc. Natl. Acad. Sci. USA India Sect. A—Phys. Sci. 2020, 90, 661–676. [Google Scholar] [CrossRef]
  23. Elewa, H.H.; Qaddah, A.A. Groundwater Potentiality Mapping in the Sinai Peninsula, Egypt, Using Remote Sensing and GIS-Watershed-Based Modeling. Hydrogeol. J. 2011, 19, 613–628. [Google Scholar] [CrossRef] [Green Version]
  24. Abuzied, S.M. Groundwater Potential Zone Assessment in Wadi Watir Area, Egypt Using Radar Data and GIS. Arab. J. Geosci. 2016, 9, 501. [Google Scholar] [CrossRef]
  25. Armanuos, A.M.; Moghazy, H.E.; Zeleňáková, M.; Yaseen, Z.M. Assessing the Impact of Groundwater Extraction on the Performance of Fractured Concrete Subsurface Dam in Controlling Seawater Intrusion in Coastal Aquifers. Water 2022, 14, 2139. [Google Scholar] [CrossRef]
  26. Abd El-Aal, A.K.; El Kharashy, I.A. Engineering and Geological Aspects of the Wajid Sandstone, Najran-Khamis Mushayt Area, Southwestern Saudi Arabia, K.S.A. Int. J. Res. Stud. Sci. Eng. Technol. 2014, 1, 10–21. [Google Scholar]
  27. Farran, M.M.; Al-Amri, N.; Elfeki, A.M. Aquifer Recharge from Flash Floods in the Arid Environment: A Mass Balance Approach at the Catchment Scale. Hydrol. Process. 2021, 35, e14318. [Google Scholar] [CrossRef]
  28. Alfaifi, H.J.; Kahal, A.Y.; Abdelrahman, K.; Zaidi, F.K.; Albassam, A.; Lashin, A. Assessment of Groundwater Quality in Southern Saudi Arabia: Case Study of Najran Area. Arab. J. Geosci. 2020, 13, 101. [Google Scholar] [CrossRef]
  29. Owolabi, S.T.; Madi, K.; Kalumba, A.M.; Orimoloye, I.R. A Groundwater Potential Zone Mapping Approach for Semi-Arid Environments Using Remote Sensing (RS), Geographic Information System (GIS), and Analytical Hierarchical Process (AHP) Techniques: A Case Study of Buffalo Catchment, Eastern Cape, South Africa. Arab. J. Geosci. 2020, 13, 1184. [Google Scholar] [CrossRef]
  30. Bhadran, A.; Girishbai, D.; Jesiya, N.P.; Gopinath, G.; Krishnan, R.G.; Vijesh, V.K. A GIS Based Fuzzy-AHP for Delineating Groundwater Potential Zones in Tropical River Basin, Southern Part of India. Geosyst. Geoenviron. 2022, 1, 100093. [Google Scholar] [CrossRef]
  31. Moharir, K.N.; Pande, C.B.; Gautam, V.K.; Singh, S.K.; Rane, N.L. Integration of Hydrogeological Data, GIS and AHP Techniques Applied to Delineate Groundwater Potential Zones in Sandstone, Limestone and Shales Rocks of the Damoh District, (MP) Central India. Environ. Res. 2023, 228, 115832. [Google Scholar] [CrossRef] [PubMed]
  32. AL-Shammari, M.M.A.; AL-Shamma’a, A.M.; Al Maliki, A.; Hussain, H.M.; Yaseen, Z.M.; Armanuos, A.M. Integrated Water Harvesting and Aquifer Recharge Evaluation Methodology Based on Remote Sensing and Geographical Information System: Case Study in Iraq. Nat. Resour. Res. 2021, 30, 2119–2143. [Google Scholar] [CrossRef]
  33. Roy, S.; Hazra, S.; Chanda, A.; Das, S. Assessment of Groundwater Potential Zones Using Multi-Criteria Decision-Making Technique: A Micro-Level Case Study from Red and Lateritic Zone (RLZ) of West Bengal, India. Sustain. Water Resour. Manag. 2020, 6, 4. [Google Scholar] [CrossRef]
  34. Waikar, M.; Nilawar, A. Identification of Groundwater Potential Zone Using Remote Sensing and GIS Technique—Search. Available online: https://www.bing.com/search?q=Identification+of+groundwater+potential+zone+using+remote+sensing+and+GIS+technique&aqs=edge..69i57j69i11004&FORM=ANCMS9&PC=ASTS (accessed on 11 May 2023).
  35. Yammani, S. Groundwater Quality Suitable Zones Identification: Application of GIS, Chittoor Area, Andhra Pradesh, India. Environ. Geol. 2007, 53, 201–210. [Google Scholar] [CrossRef]
  36. Asadi, S.S.; Vuppala, P.; Reddy, M.A. Remote Sensing and GIS Techniques for Evaluation of Groundwater Quality in Municipal Corporation of Hyderabad (Zone-V), India. Int. J. Environ. Res. Public Health 2007, 4, 45–52. [Google Scholar] [CrossRef] [PubMed] [Green Version]
  37. Sable, E.G. Geologic Map of the Najrān Quadrangle, Sheet 17G, Kingdom of Saudi Arabia|WorldCat. Available online: https://www.worldcat.org/title/geologic-map-of-the-najran-quadrangle-sheet-17g-kingdom-of-saudi-arabia/oclc/430944758 (accessed on 26 May 2023).
  38. PetroLink, G.; Nehlig, P.; Genna, A.; Asfirane, F.; Guerrot, C.; Eberlé, J.; Kluyver, H.; Lasserre, J.; Le Goff, E.; Nicol, N.; et al. A Review of the Pan-African Evolution of the Arabian Shield; Gulf PetroLink: Manama, Bahrain, 2002; Volume 7. [Google Scholar]
  39. Edet, A.E.; Okereke, C.S.; Teme, S.C.; Esu, E.O. Application of Remote-Sensing Data to Groundwater Exploration: A Case Study of the Cross River State, Southeastern Nigeria. Hydrogeol. J. 1998, 6, 394–404. [Google Scholar] [CrossRef]
  40. Algaydi, B.A.M.; Subyani, A.M.; Hamza, M.H.M.M. Investigation of Groundwater Potential Zones in Hard Rock Terrain, Wadi Na’man, Saudi Arabia. Groundwater 2019, 57, 940–950. [Google Scholar] [CrossRef]
  41. Singh, P.; Thakur, J.K.; Kumar, S. Delineating Groundwater Potential Zones in a Hard-Rock Terrain Using Geospatial Tool. Hydrol. Sci. J. 2013, 58, 213–223. [Google Scholar] [CrossRef] [Green Version]
  42. De Reu, J.; Bourgeois, J.; Bats, M.; Zwertvaegher, A.; Gelorini, V.; De Smedt, P.; Chu, W.; Antrop, M.; De Maeyer, P.; Finke, P.; et al. Application of the Topographic Position Index to Heterogeneous Landscapes. Geomorphology 2013, 186, 39–49. [Google Scholar] [CrossRef]
  43. Yeh, H.F.; Cheng, Y.S.; Lin, H.I.; Lee, C.H. Mapping Groundwater Recharge Potential Zone Using a GIS Approach in Hualian River, Taiwan. Sustain. Environ. Res. 2016, 26, 33–43. [Google Scholar] [CrossRef] [Green Version]
  44. Ibrahim-Bathis, K.; Ahmed, S.A. Geospatial Technology for Delineating Groundwater Potential Zones in Doddahalla Watershed of Chitradurga District, India. Egypt. J. Remote Sens. Space Sci. 2016, 19, 223–234. [Google Scholar] [CrossRef] [Green Version]
  45. Al-Areeq, A.M.; Al-Zahrani, M.A.; Sharif, H.O. Physically-Based, Distributed Hydrologic Model for Makkah Watershed Using GPM Satellite Rainfall and Ground Rainfall Stations. Nat. Hazards Risk 2021, 12, 1234–1257. [Google Scholar] [CrossRef]
  46. Rajaveni, S.P.; Brindha, K.; Elango, L. Geological and Geomorphological Controls on Groundwater Occurrence in a Hard Rock Region. Appl. Water Sci. 2017, 7, 1377–1389. [Google Scholar] [CrossRef] [Green Version]
  47. Ganapuram, S.; Kumar, G.T.V.; Krishna, I.V.M.; Kahya, E.; Demirel, M.C. Mapping of Groundwater Potential Zones in the Musi Basin Using Remote Sensing Data and GIS. Adv. Eng. Softw. 2009, 40, 506–518. [Google Scholar] [CrossRef]
  48. Al-Areeq, A.M.; Al-Zahrani, M.A.; Sharif, H.O. Assessment of the Performance of Satellite Rainfall Products over Makkah Watershed Using a Physically Based Hydrologic Model. Appl. Water Sci. 2022, 12, 246. [Google Scholar] [CrossRef]
  49. Achilleos, G.A. The Inverse Distance Weighted Interpolation Method and Error Propagation Mechanism—Creating a DEM from an Analogue Topographical Map. J. Spat. Sci. 2011, 56, 283–304. [Google Scholar] [CrossRef]
  50. Al-Areeq, A.M.; Al-Zahrani, M.A.; Sharif, H.O. The Performance of Physically Based and Conceptual Hydrologic Models: A Case Study for Makkah Watershed, Saudi Arabia. Water 2021, 13, 1098. [Google Scholar] [CrossRef]
  51. Hussien, H.M.; Kehew, A.E.; Aggour, T.; Korany, E.; Abotalib, A.Z.; Hassanein, A.; Morsy, S. An Integrated Approach for Identification of Potential Aquifer Zones in Structurally Controlled Terrain: Wadi Qena Basin, Egypt. Catena 2017, 149, 73–85. [Google Scholar] [CrossRef]
  52. Morsy, E.A.; Othman, A. Delineation of Shallow Groundwater Potential Zones Using Integrated Hydrogeophysical and Topographic Analyses, Western Saudi Arabia. J. King Saud Univ. Sci. 2021, 33, 101559. [Google Scholar] [CrossRef]
  53. Yousif, M.; Hussien, H.M.; Abotalib, A.Z. The Respective Roles of Modern and Paleo Recharge to Alluvium Aquifers in Continental Rift Basins: A Case Study from El Qaa Plain, Sinai, Egypt. Sci. Total Environ. 2020, 739, 139927. [Google Scholar] [CrossRef] [PubMed]
  54. Rahmati, O.; Nazari Samani, A.; Mahdavi, M.; Pourghasemi, H.R.; Zeinivand, H. Groundwater Potential Mapping at Kurdistan Region of Iran Using Analytic Hierarchy Process and GIS. Arab. J. Geosci. 2015, 8, 7059–7071. [Google Scholar] [CrossRef]
  55. Shebl, A.; Abdelaziz, M.I.; Ghazala, H.; Araffa, S.A.S.; Abdellatif, M.; Csámer, Á. Multi-Criteria Ground Water Potentiality Mapping Utilizing Remote Sensing and Geophysical Data: A Case Study within Sinai Peninsula, Egypt. Egypt. J. Remote Sens. Space Sci. 2022, 25, 765–778. [Google Scholar] [CrossRef]
  56. Naghibi, S.A.; Pourghasemi, H.R.; Dixon, B. GIS-Based Groundwater Potential Mapping Using Boosted Regression Tree, Classification and Regression Tree, and Random Forest Machine Learning Models in Iran. Environ. Monit. Assess. 2016, 188, 44. [Google Scholar] [CrossRef] [PubMed]
Figure 1. Location and map of Habawnah Basin.
Sustainability 15 10075 g001
Figure 2. Elevation map (DEM) of the studied basin.
Sustainability 15 10075 g002
Figure 3. Flowchart of the used methodology.
Sustainability 15 10075 g003
Figure 4. Geological map of the Habawnah Basin.
Sustainability 15 10075 g004
Figure 5. Lineament density map of the Habawnah Basin.
Sustainability 15 10075 g005
Figure 6. Slope map of the Habawnah Basin.
Sustainability 15 10075 g006
Figure 7. Map displaying land use patterns in the study area.
Sustainability 15 10075 g007
Figure 8. Soil type map of Habawnah Basin.
Sustainability 15 10075 g008
Figure 9. Map of drainage density in the Habawnah Basin.
Sustainability 15 10075 g009
Figure 10. Rainfall map of the Habawnah Basin.
Sustainability 15 10075 g010
Figure 11. Study area zones with potential for groundwater resources.
Sustainability 15 10075 g011
Table 1. Construction of a normalized pairwise comparison matrix with seven layers for the zoning of groundwater potential using AHP.
Thematic LayerGeologyLineament DensitySlopeLULCSoil TypeDrainage DensityRainfallWeight
Geology76543210.3857
Lineament density7/26/25/24/23/22/21/20.19
Slope7/36/35/34/63/32/31/30.12
LULC7/46/45/44/43/42/41/40.1
Soil type7/56/55/54/53/52/51/50.08
Drainage density7/66/65/64/63/62/61/60.066
Rainfall7/76/75/74/73/72/71/70.064
Table 2. Weights assigned to groundwater control parameters in the Habawnah Basin.
Thematic Layer Factors Weight (%) Rank
GeologyIgneous extrusive rocks391
Sedimentary surficial deposits5
Sedimentary rocks5
Igneous intrusive rocks1
Metamorphic rocks4
Polylithologic rocks4
Igneous rocks (plugs)1
Lineament density1195
24
33
42
51
Slope0–5.49125
5.5–14.84
14.9–26.13
26.2–39.42
39.5–82.31
LULCWater103
Rangeland2
Flooded vegetation2
Crops4
Built area1
Bare land1
Soil typeClay loam81
Loam1
Loamy sand3
Sand3
Sandy clay loam5
Sandy loam5
Drainage density171
22
33
44
55
Rainfall52–6351
64–742
75–853
86–964
97–1105
Table 3. The soil classification and the corresponding area coverage percentages.
TextureCovered Area (%)
Sandy loam44.9
Loamy sand26.7
Sand21.3
Sandy clay loam6.2
Loam0.87
Clay loam0.01
Disclaimer/Publisher’s Note: The statements, opinions and data contained in all publications are solely those of the individual author(s) and contributor(s) and not of MDPI and/or the editor(s). MDPI and/or the editor(s) disclaim responsibility for any injury to people or property resulting from any ideas, methods, instructions or products referred to in the content.

