Article

Assessment of Machining of Hastelloy Using WEDM by a Multi-Objective Approach

1
Department of Mechanical Engineering, School of Engineering and Technology, Mohan Babu University, Tirupati 517102, India
2
Department of Chemistry, College of Science, King Saud University, P.O. Box 2455, Riyadh 11451, Saudi Arabia
3
Department of Mechanical Engineering, Yeshwantrao Chavan College of Engineering, Nagpur 441110, India
4
Laxminarayan Institute of Technology, Nagpur 440033, India
5
Department of Chemistry, College of Science, Southern University and A&M College, Baton Rouge, LA 70813, USA
*
Author to whom correspondence should be addressed.
Sustainability 2023, 15(13), 10105; https://doi.org/10.3390/su151310105
Submission received: 26 May 2023 / Revised: 22 June 2023 / Accepted: 23 June 2023 / Published: 26 June 2023

Abstract

:
Superalloys are a much-needed material for abundant engineering fields, such as nuclear-powered reactor components and aeronautics. Owing to their exceptional characteristics, such as higher thermal conductivity, they can be difficult to machine using conventional processes. Modern approaches to machining have evolved to utilize these materials. One of the techniques studied in this project is electrical discharge in a wire machine. This process can help to reduce the energy consumption during machining and negative impact on the environment. In addition, shortening the operation time of the machine can help to minimize its impact on the environment. The duration of the pulse and applied current are independent factors considered in this study. Material removal rate, surface roughness, dimensional deviation, and form/orientation tolerance errors are deemed as performance measures. The goal of this investigation is to reduce the time required to machine and improve the surface finish of components by implementing a Grey-based artificial neural network model. This method is useful in foretelling the conditions of the Wire Electro Discharge Machining (WEDM) process. This paper uses the Taguchi design and Analysis of Variance (ANOVA) framework to analyze the model’s variable inputs. The overall best coefficient of correlation (R = 0.9981) is fetched with an RMSE value of 0.0086. The material removal rate has been increased by decreasing the time taken for removal, which gives the possibility of consuming minimum energy. The finishing of the machined surface also improved. Moreover, this paper shows how to use an Artificial Neural Network (ANN) model with Grey Analysis. The results of the comparative analysis show that the values envisaged are closer with the actual values. The foretelling capacity of the evolved model is confirmed with the performance analysis of the developed model.

1. Introduction

In the nuclear and aeronautical industries, superalloys are generally used for various parts due to their characteristics. These materials are incredibly hard to machine due to how strong and hard they are. They also have lower thermal conductivity. Due to their exceptional properties, the machining of these materials has become more difficult and complex, especially when making intricate components [1,2,3,4]. It is therefore imperative to evolve processes that can efficiently and effectively machine these materials. One of these is Wire Electrical Discharge Machining (WEDM). It is a noncontact machining process which operates by moving the wire electrode continuously. During the process, the work piece carries the opposite side of an electrical charge, and the wire carries one side of the charge. When the wire is brought into close proximity to the component, the attraction of electrical charge causes a controlled spark to occur. This spark causes material particles to melt and vaporize [5,6]. The outline of WEDM is represented in Figure 1.
The process of WEDM involves creating intricate components for aerospace and automotive industries. When sparks are discharged from the sources, dielectric medium can enter the work surface and remove materials [7,8]. The wire electrode is moved from the far end of the space among the work material and the tool to the far end. The dielectric fluid then ionizes and separates the two components. The action of the ionization allows the material to be easily removed. This process, which is also called spark erosion, can be used to remove various materials, such as those used in the production of complex components [9,10,11,12,13,14]. For making the process sustainable, an uninterrupted machining is needed to reduce the time and energy consumed during the machining. Understanding the parameters and methods which contribute to make WEDM sustainable is much-needed. Various researchers have analyzed the need for and importance of sustainable WEDM for various hard materials. Improved machining rates will be helpful for reducing time consumption for machining, which results in reduced power consumption. The reduced consumption of power utilization is deemed to decrease the negative impact on the environment and the machine setup, too. The functionality of mechanical parts can be affected by the surface roughness of those parts, which is an important indicator of product quality. In addition, it has an interlink on thermal properties, electrical properties, geometric tolerance, ease of holding lubricants, and many other aspects of mechanical parts that are not listed here. During the manufacturing process, the surface roughness is established by a variety of distinct machining parameters. These parameters can be found in the Table 1. For instance, during the turning operation, the surface roughness is largely determined not only by the factors that are used for machining but also by the mechanical properties of the material that is being matched. The surface that is being produced is very sensitive to even the smallest shift in parameters or factors that have been stated. In addition, it should be pointed out that the surface roughness is the machining parameter that is given the utmost attention, followed closely by the rate at which material is removed [15,16,17,18].
Previous researchers proposed the Grey system theory to deal with ambiguity and incomplete data in a process. The problems that can arise with MCDM are solved by GRA by condensing the wide variety of performance attribute values that are considered for each alternative into a single, unified value. This results in the original problem becoming a problem involving the decision of a single attribute. After going through the GRA process, it will be much simpler to compare different options that have multiple attributes. The method utilized by the remaining MCDM approaches is very much like the method utilized in the process of combining attribute values into a single value [19]. It has been shown to be a successful method for determining the various performance characteristics of various types of machining. This process incorporates many Multi-Criteria Decision Making (MCDM) methods such as the Grey system approach [20,21]. Despite its numerous benefits, the Grey Relational Analysis (GRA) approach has restrictions when it comes to analyzing the output variables. Researchers can improve the yield of the machining process by using the Grey fuzzy method, which is very useful in developing accurate and efficient machining techniques. Optimization plays a major role in any kind of manufacturing processes, and further development of these techniques may lead to advanced manufacturing methods, such as additive manufacturing and processing techniques [22,23,24,25,26]. The Grey theory can be used to improve the performance of various decision-making tools. The use of intelligent tools for forecasting performance attributes can help improve the efficiency of the manufacturing process [27]. The manufacturers can now forecast necessary output parameters of their products thanks to the usage of Artificial Neural Network (ANN) in modeling [28,29]. A few researchers used various neural network techniques to develop competent models for the prophecy of process parameter errors in the machining process. The outcomes of these models were then compared with the previous literature. Previous research has revealed that Artificial Neural Network (ANN) can be engaged to foretell the chosen output variables. The convergence of multiple algorithms was observed [30,31,32,33,34,35]. The Multi-Response Grey Relation Analysis approach may be used to improve the process parameters [36]. The findings of this study may be used to manufacture hard materials in a high-precision WEDM for a variety of needs [37]. The form/orientation and shape of a machined surface are two factors that influence a product’s quality and mechanical design. The efficiency and effectiveness of measuring various process variables related to the manufacture of electronic components are frequently overlooked.
According to the literature, there has been little research into the optimization of these factors using a Grey-based ANN method, particularly in the context of sustainable machining. This research article aims to provide a comprehensive analysis of multiple performance measures for the WEDM process, including Material Removal Rate (MRR), Surface Roughness (SR), Dimensional Deviation (DD), and circularity and perpendicularity error. The Grey system theory is adopted to estimate the Grey Relational Coefficient (GRC) values. The data were then engaged to train the ANN model, which is a multi-aspects optimization model. In this article, an endeavor is made to evolve the model by incorporating the ANN model to consider multiple aspects.

2. Materials and Methods

The experimental runs were carried out on a WEDM machine, which is known as the Concord-made Model DK 7732. The tool was made using a reusable wire and a dielectric liquid, which was deionized water. The Hastelloy C-276 was utilized as the work material. With the help of clamps, the specimens were held inside a machine chamber. The number of experiments executed was increased by opting for various process parameters and levels.
For making a better design layout, Taguchi proposed the use of an experimental design known as the Orthogonal Array (OA). This method involved running experiments on a limited number of parameters in order to analyze them in a more efficient manner. The three input factors that were adopted in the design were the period of pulse on/off and the current. The various output parameters used in the process of machining are analyzed in order to ascertain the optimal approach for extracting Hastelloy. The levels and parameters that were selected were then compared with those specified by the L27 OA.
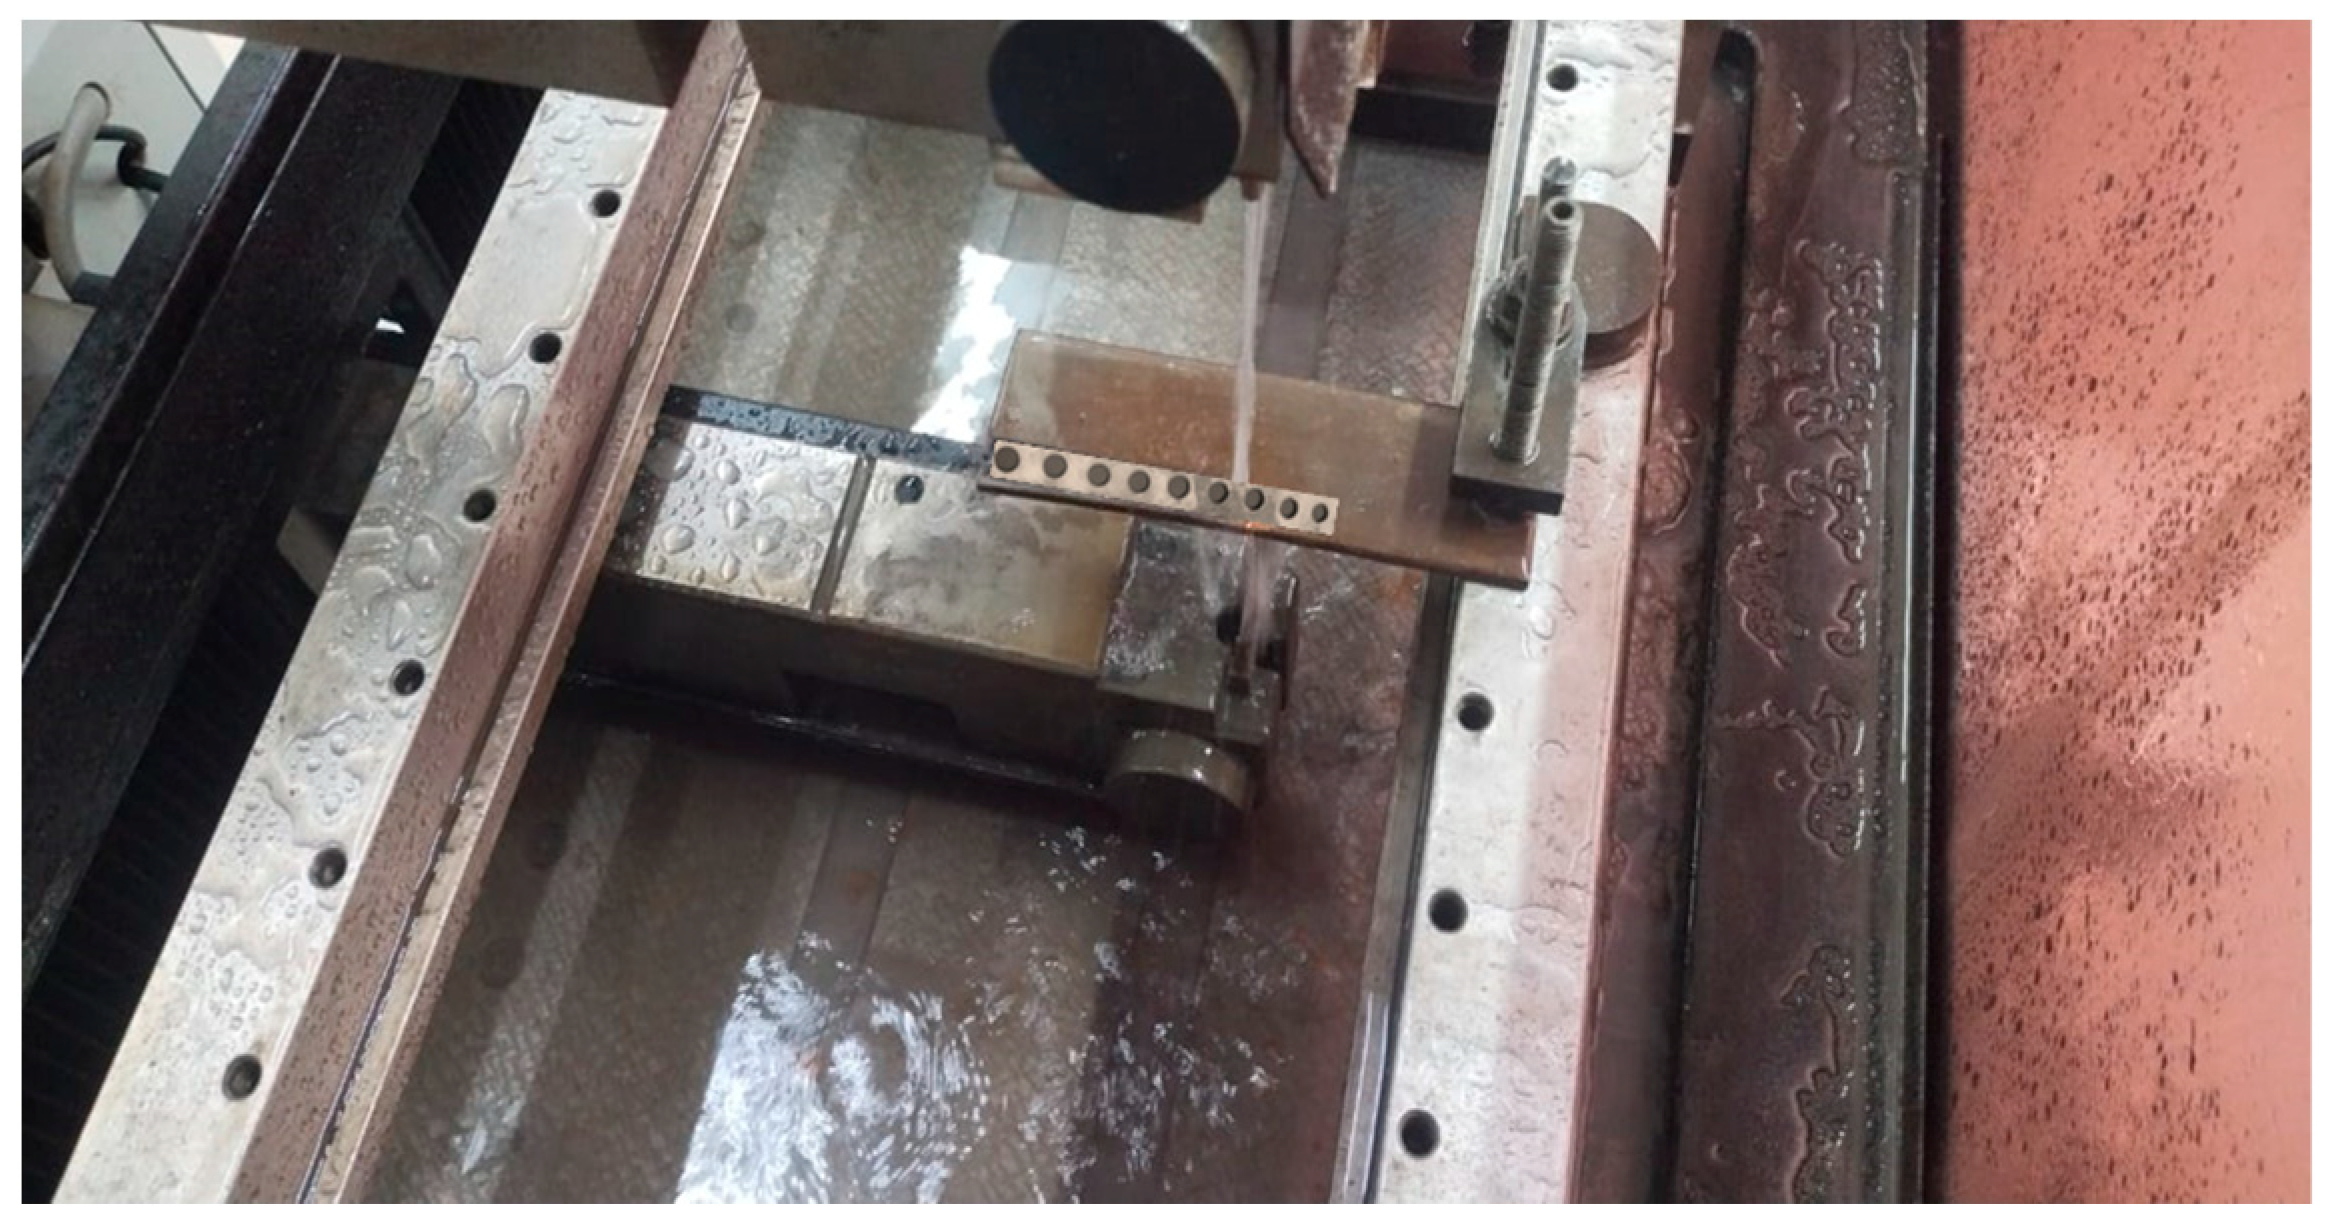
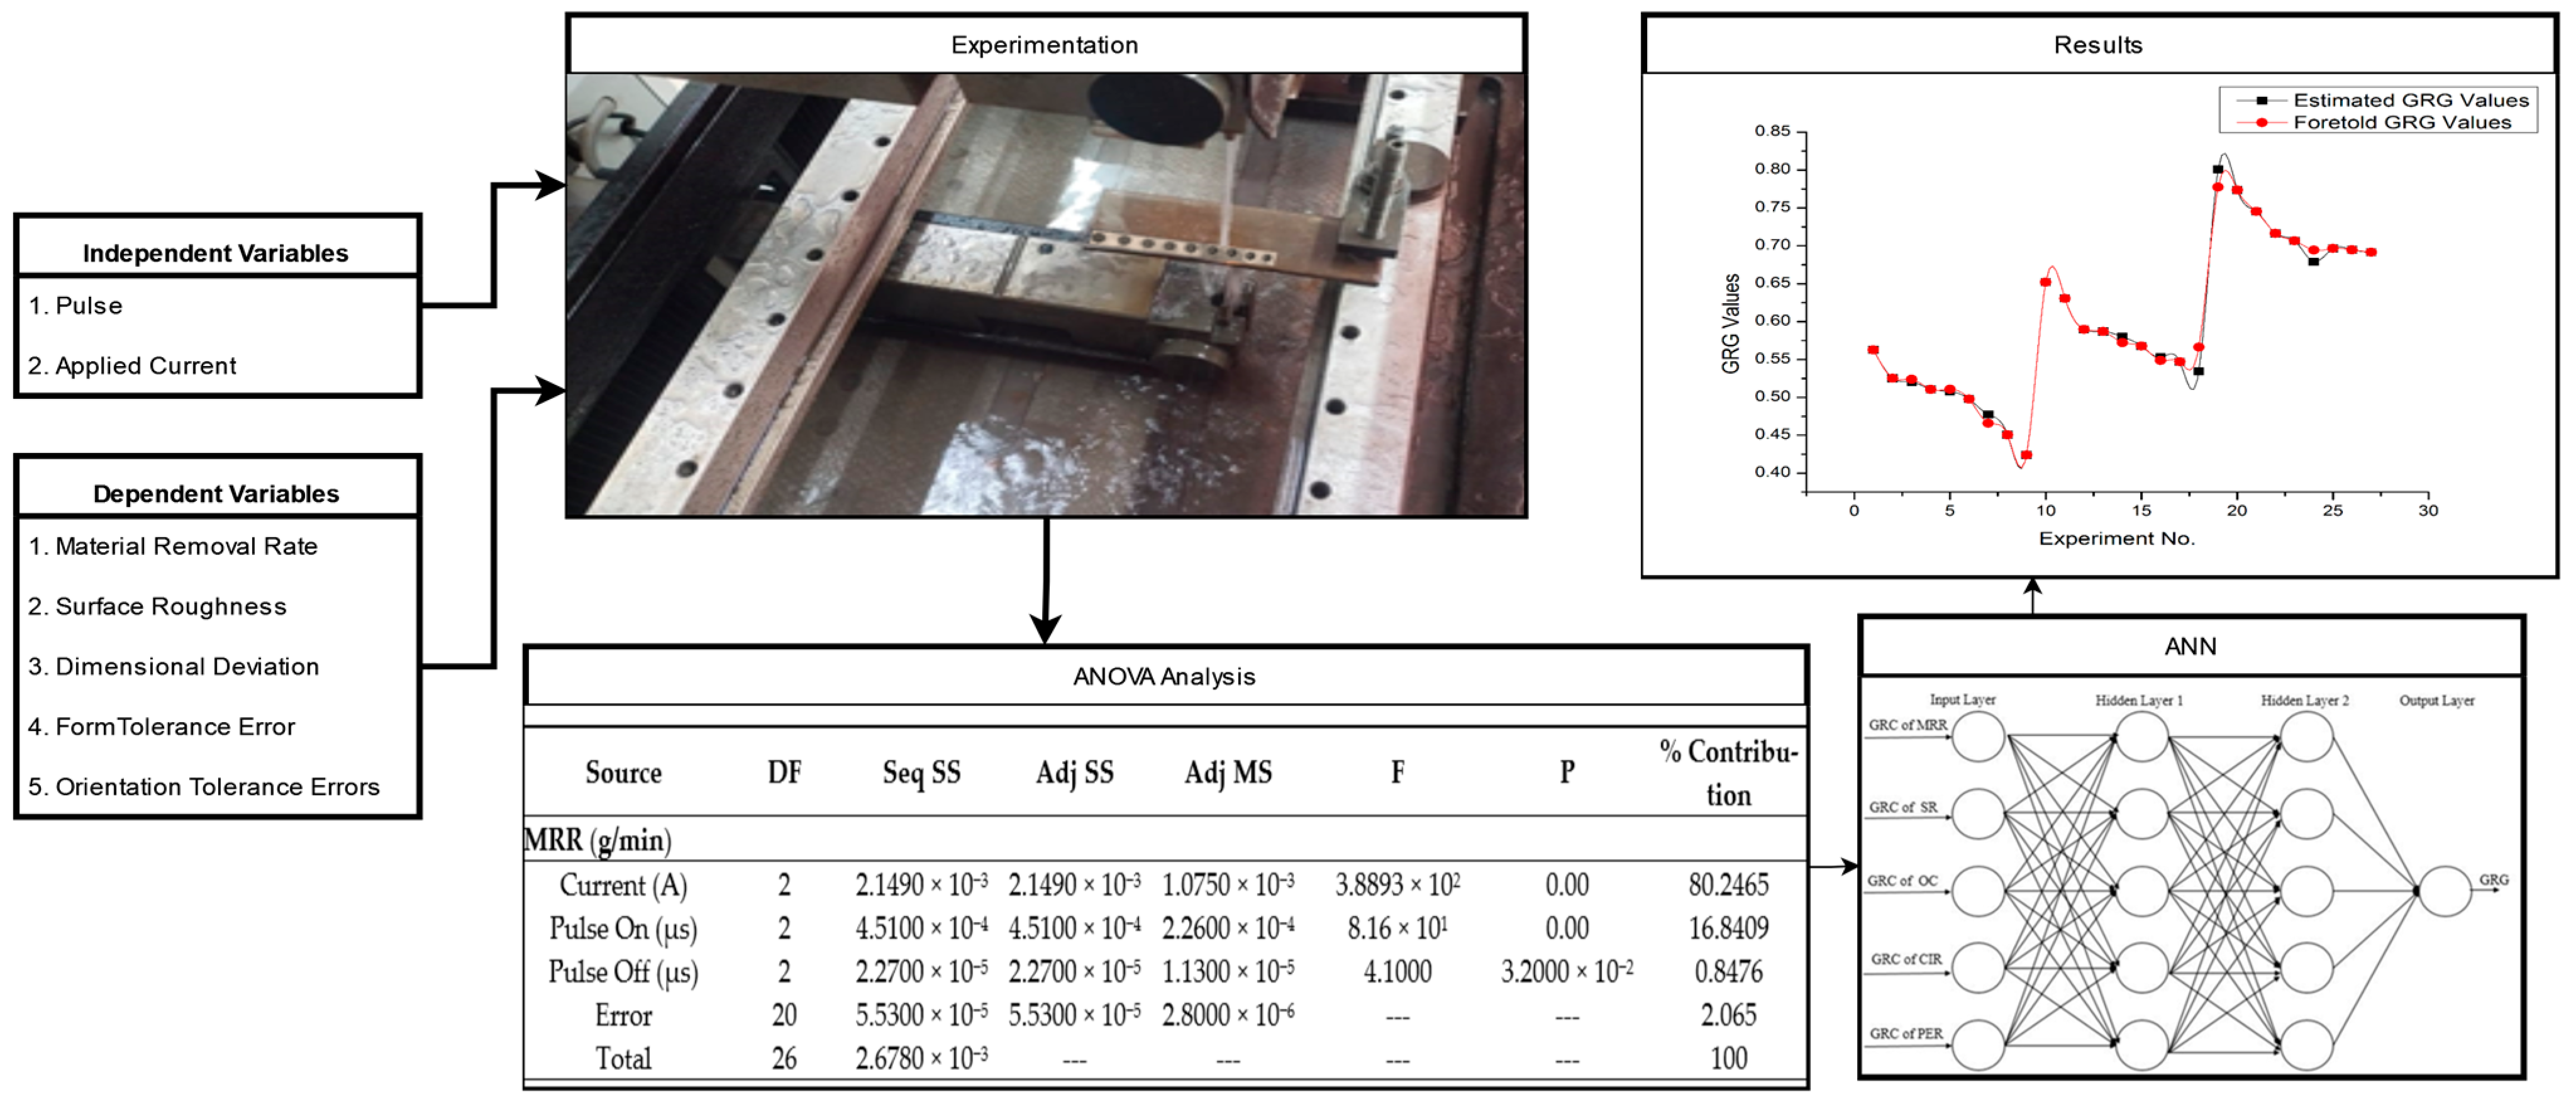
The weight loss approach is utilized during the process of cutting to estimate the removal rate of certain materials. After the operation, the Mitutoyo SJ-411 Surface Roughness Tester is adopted to calculate the surface roughness. The orientation, form, and overcut tolerance are also taken into account using a Helmel-made Coordinate Measuring Machine (CMM). The arrangement shown in Figure 2 is an experimental setup for machine tools. Experiments were performed according to L27 OA, with the outcomes recorded to carry out further analysis. Figure 3 depicts the process flow of present study.
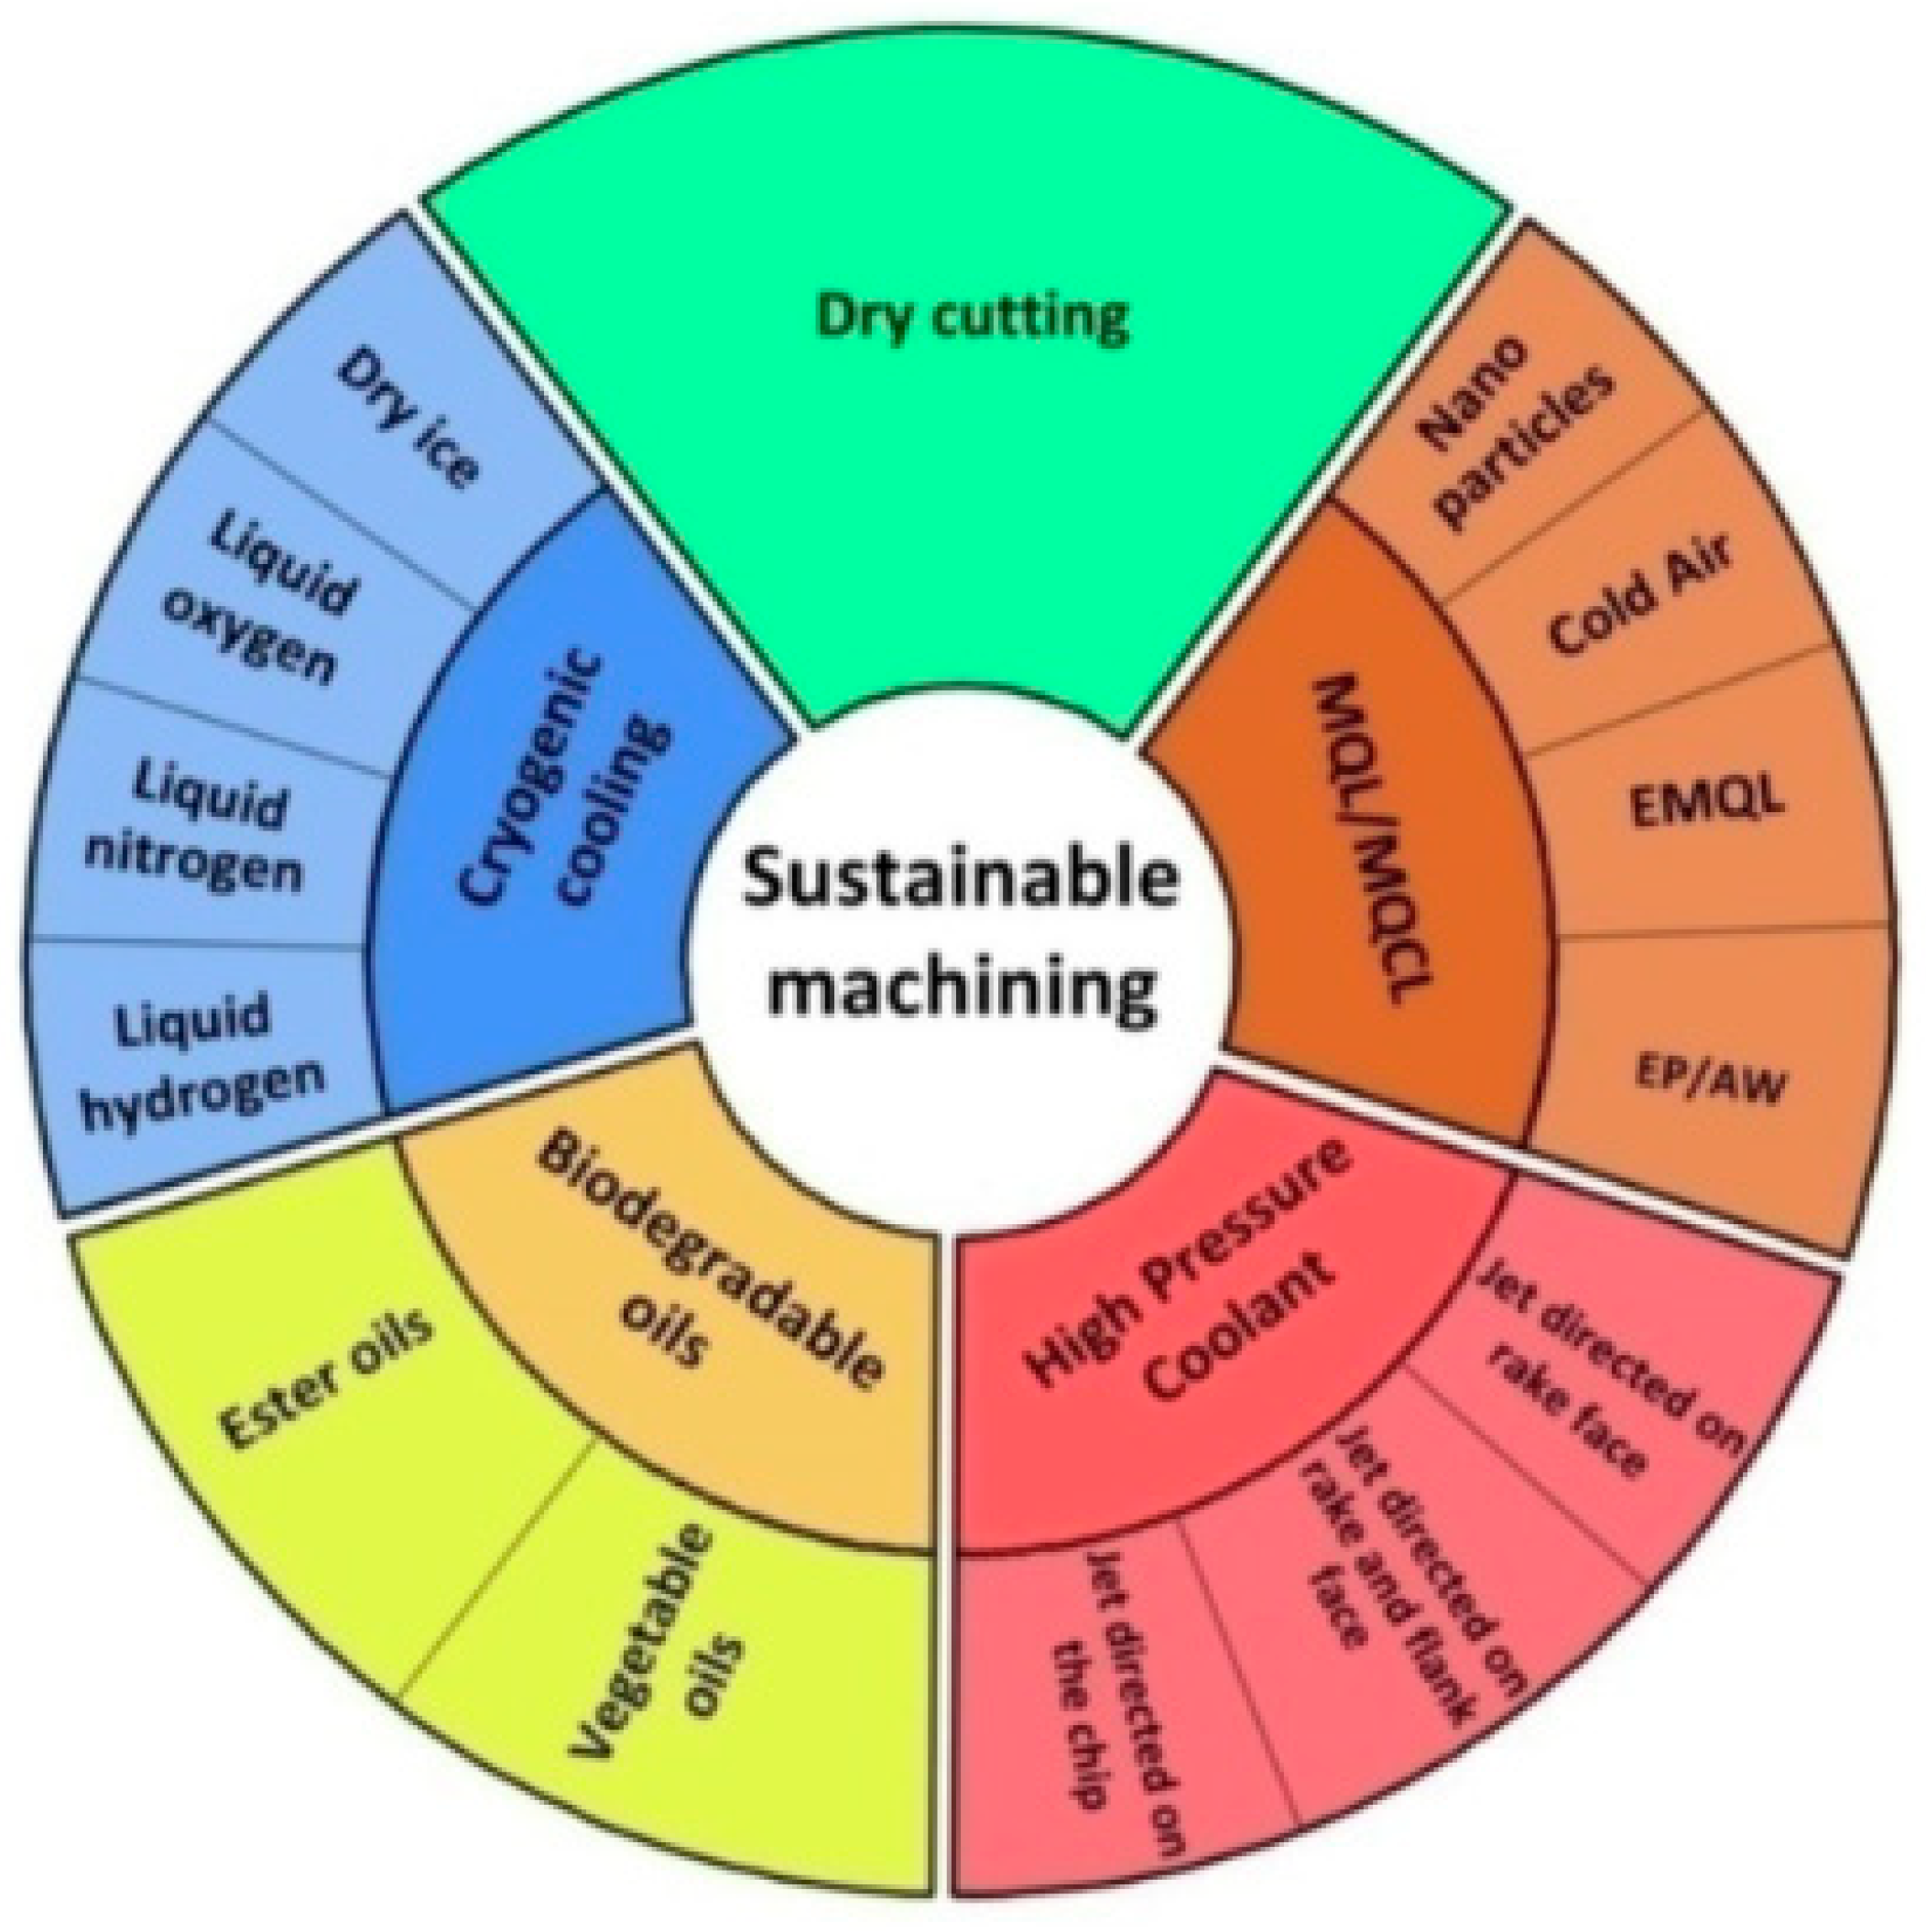
Sustainability-related manufacturing concepts emerged around 2010 and have diverse levels of promise. Waste reduction is a fundamental tenet of lean manufacturing, the 3 Rs of green manufacturing and the 6 Rs of sustainable manufacturing being the most forward-thinking of these ideas. The 3 R idea, which stands for “reduce, reuse, and recycle”, and the 6 R concept, which stands for “reduce, reuse, recover, redesign, remanufacture, and recycle”, are two of the most often utilized concepts in the effort to build a greener approach to manufacturing [38]. However, a new component that might be otherwise termed as “ecological elements”, calls for special attention in the form of natural interventions, human workers’ welfare, and financial stability of manufacturing [39]. Sustainable production relies heavily on high-efficiency processes that use less energy [40]. The ring of sustainable machining (Figure 4) characterizes highly efficient manufacturing solutions, while simultaneously minimizing their influence on the ecosystem [39].

Development of Anticipated Grey ANN Model

Artificial intelligence has greatly impacted the field of engineering, allowing scientists to create efficient and effective procedures and models for governing various processes. One of the most critical variables that can be deemed while optimizing a process is its accurateness. Various researchers developed statistical models with the help of ANNs, which can be utilized to study various nonlinear and linear problems in engineering disciplines. One of the benefits of adopting ANNs is their comfort in generating NN models using the tools in the MATLAB 2023a software.
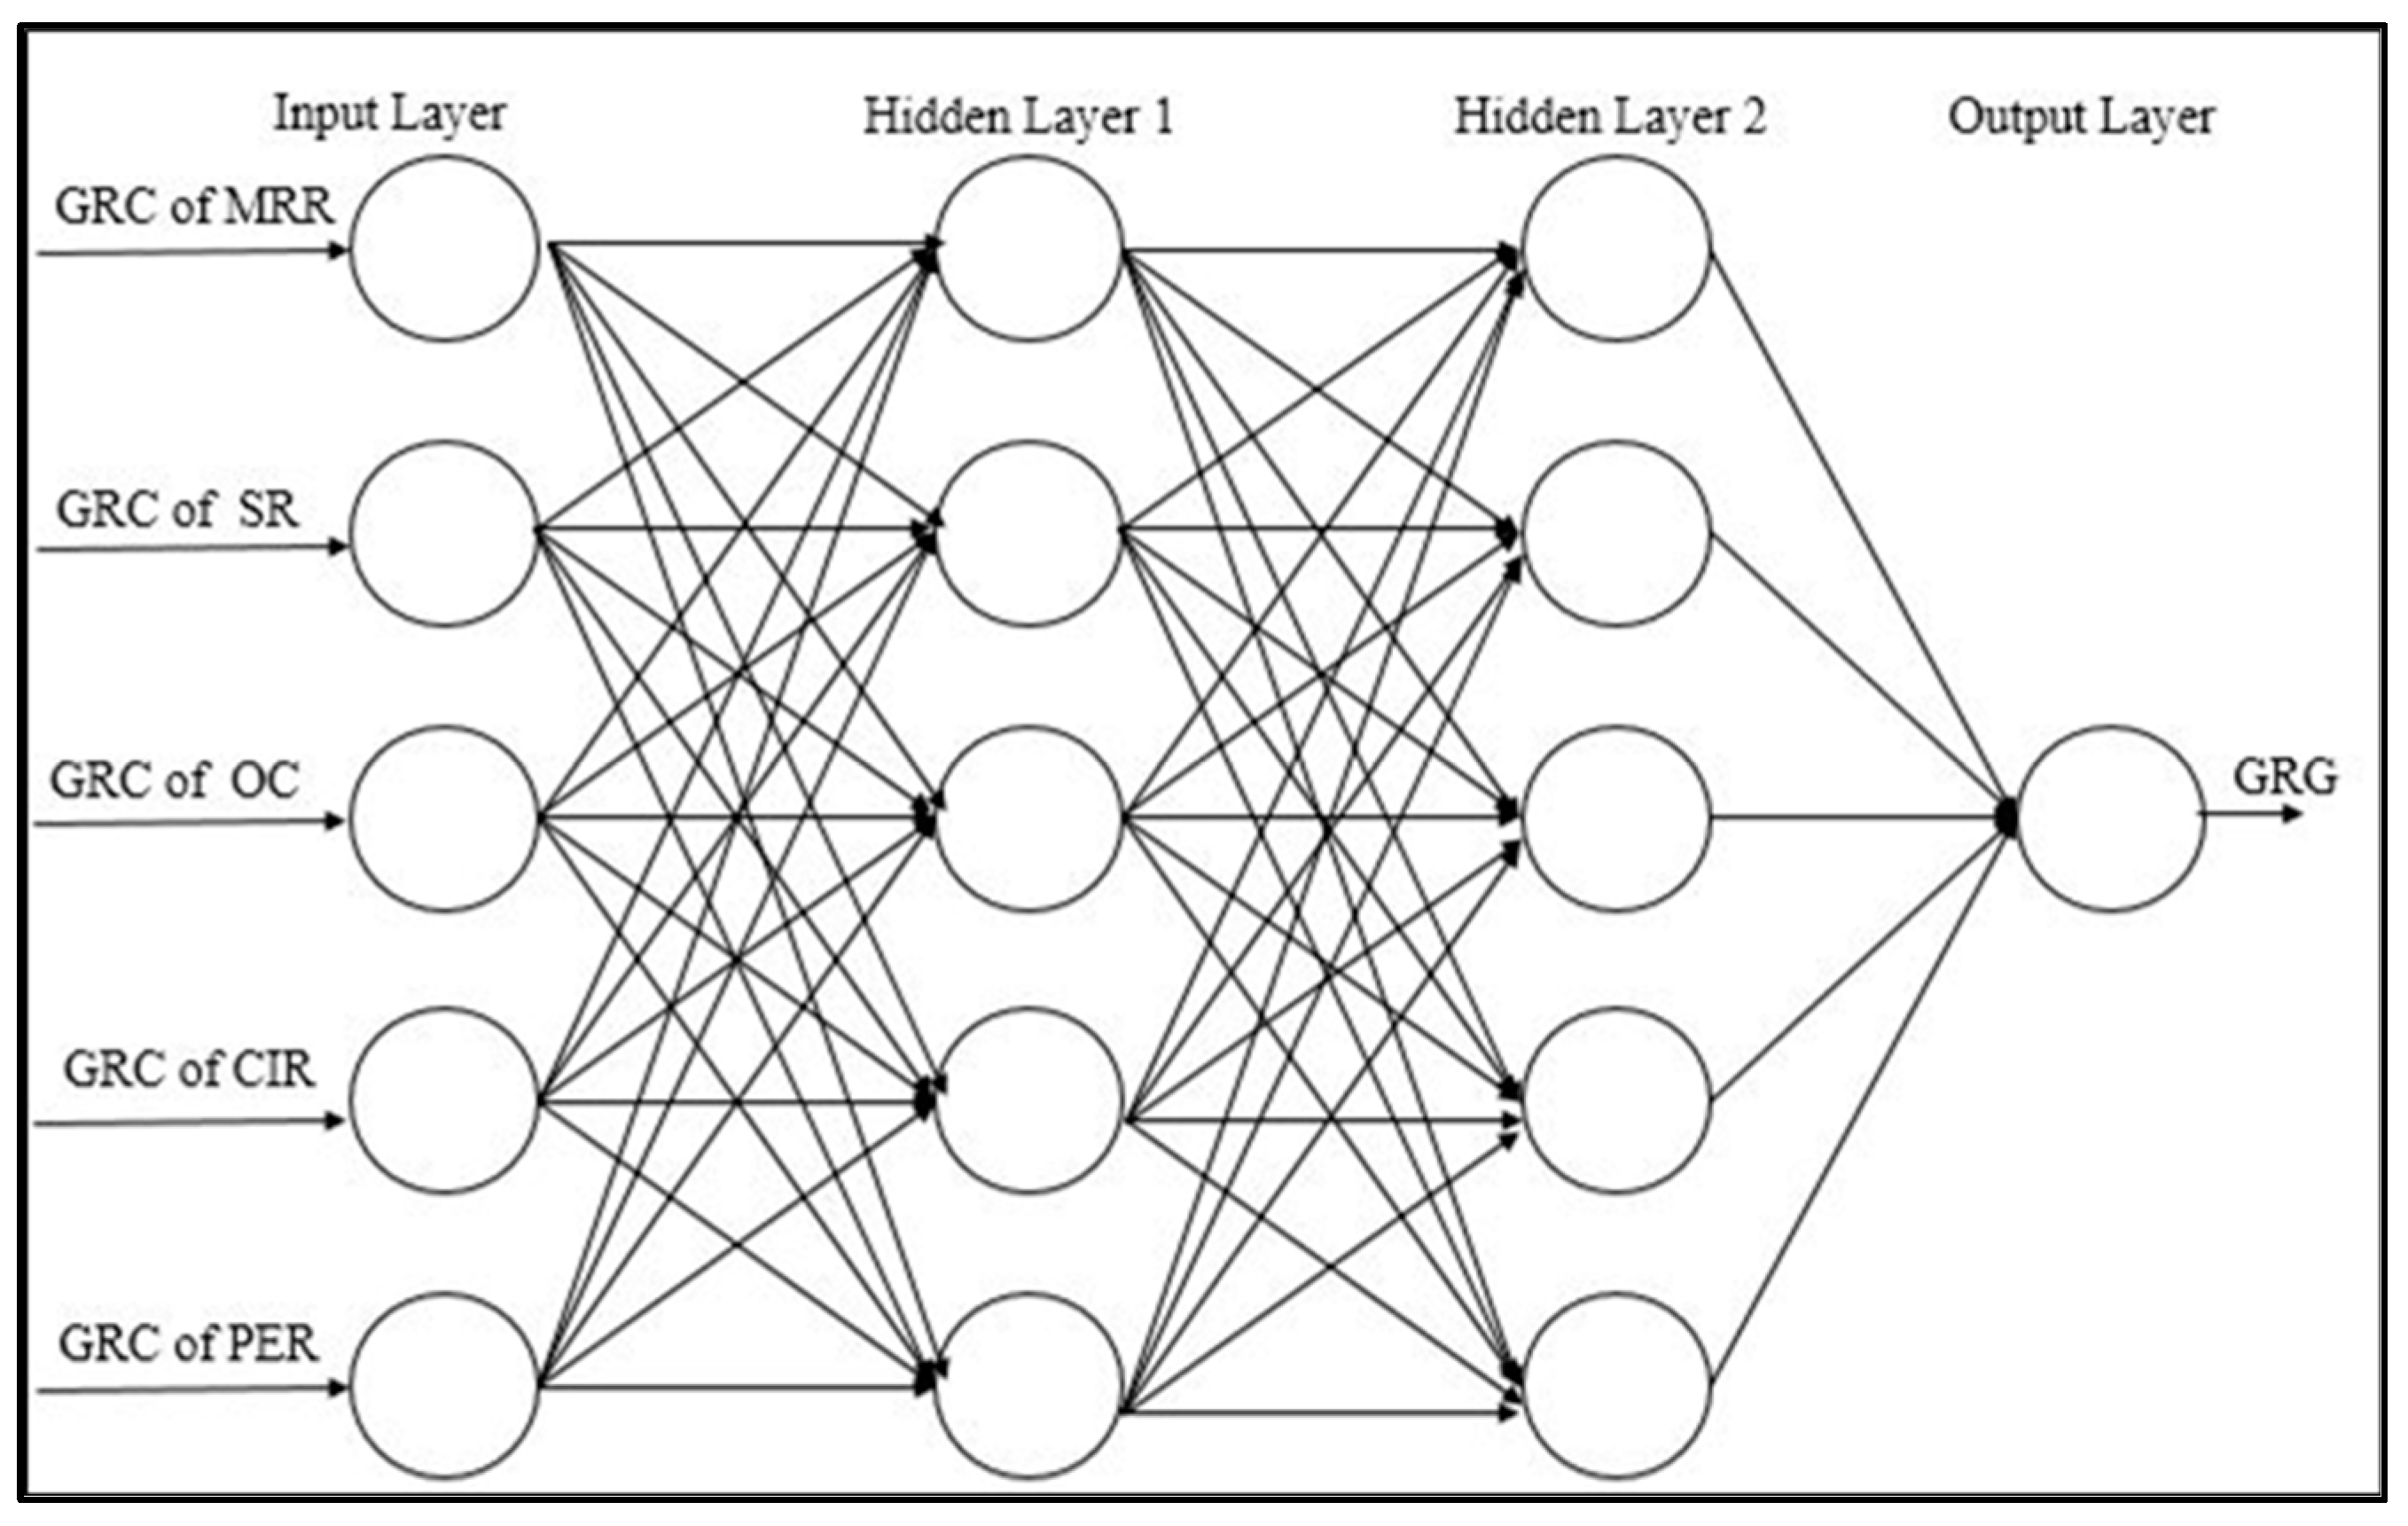
The model has five input layers and a single output neuron. The quantity of concealed neurons and layers in the network was ascertained by performing a trial-based procedure. Figure 5 displays the evolution of the ANN structure for predicting the Grey Relational Grade (GRG).
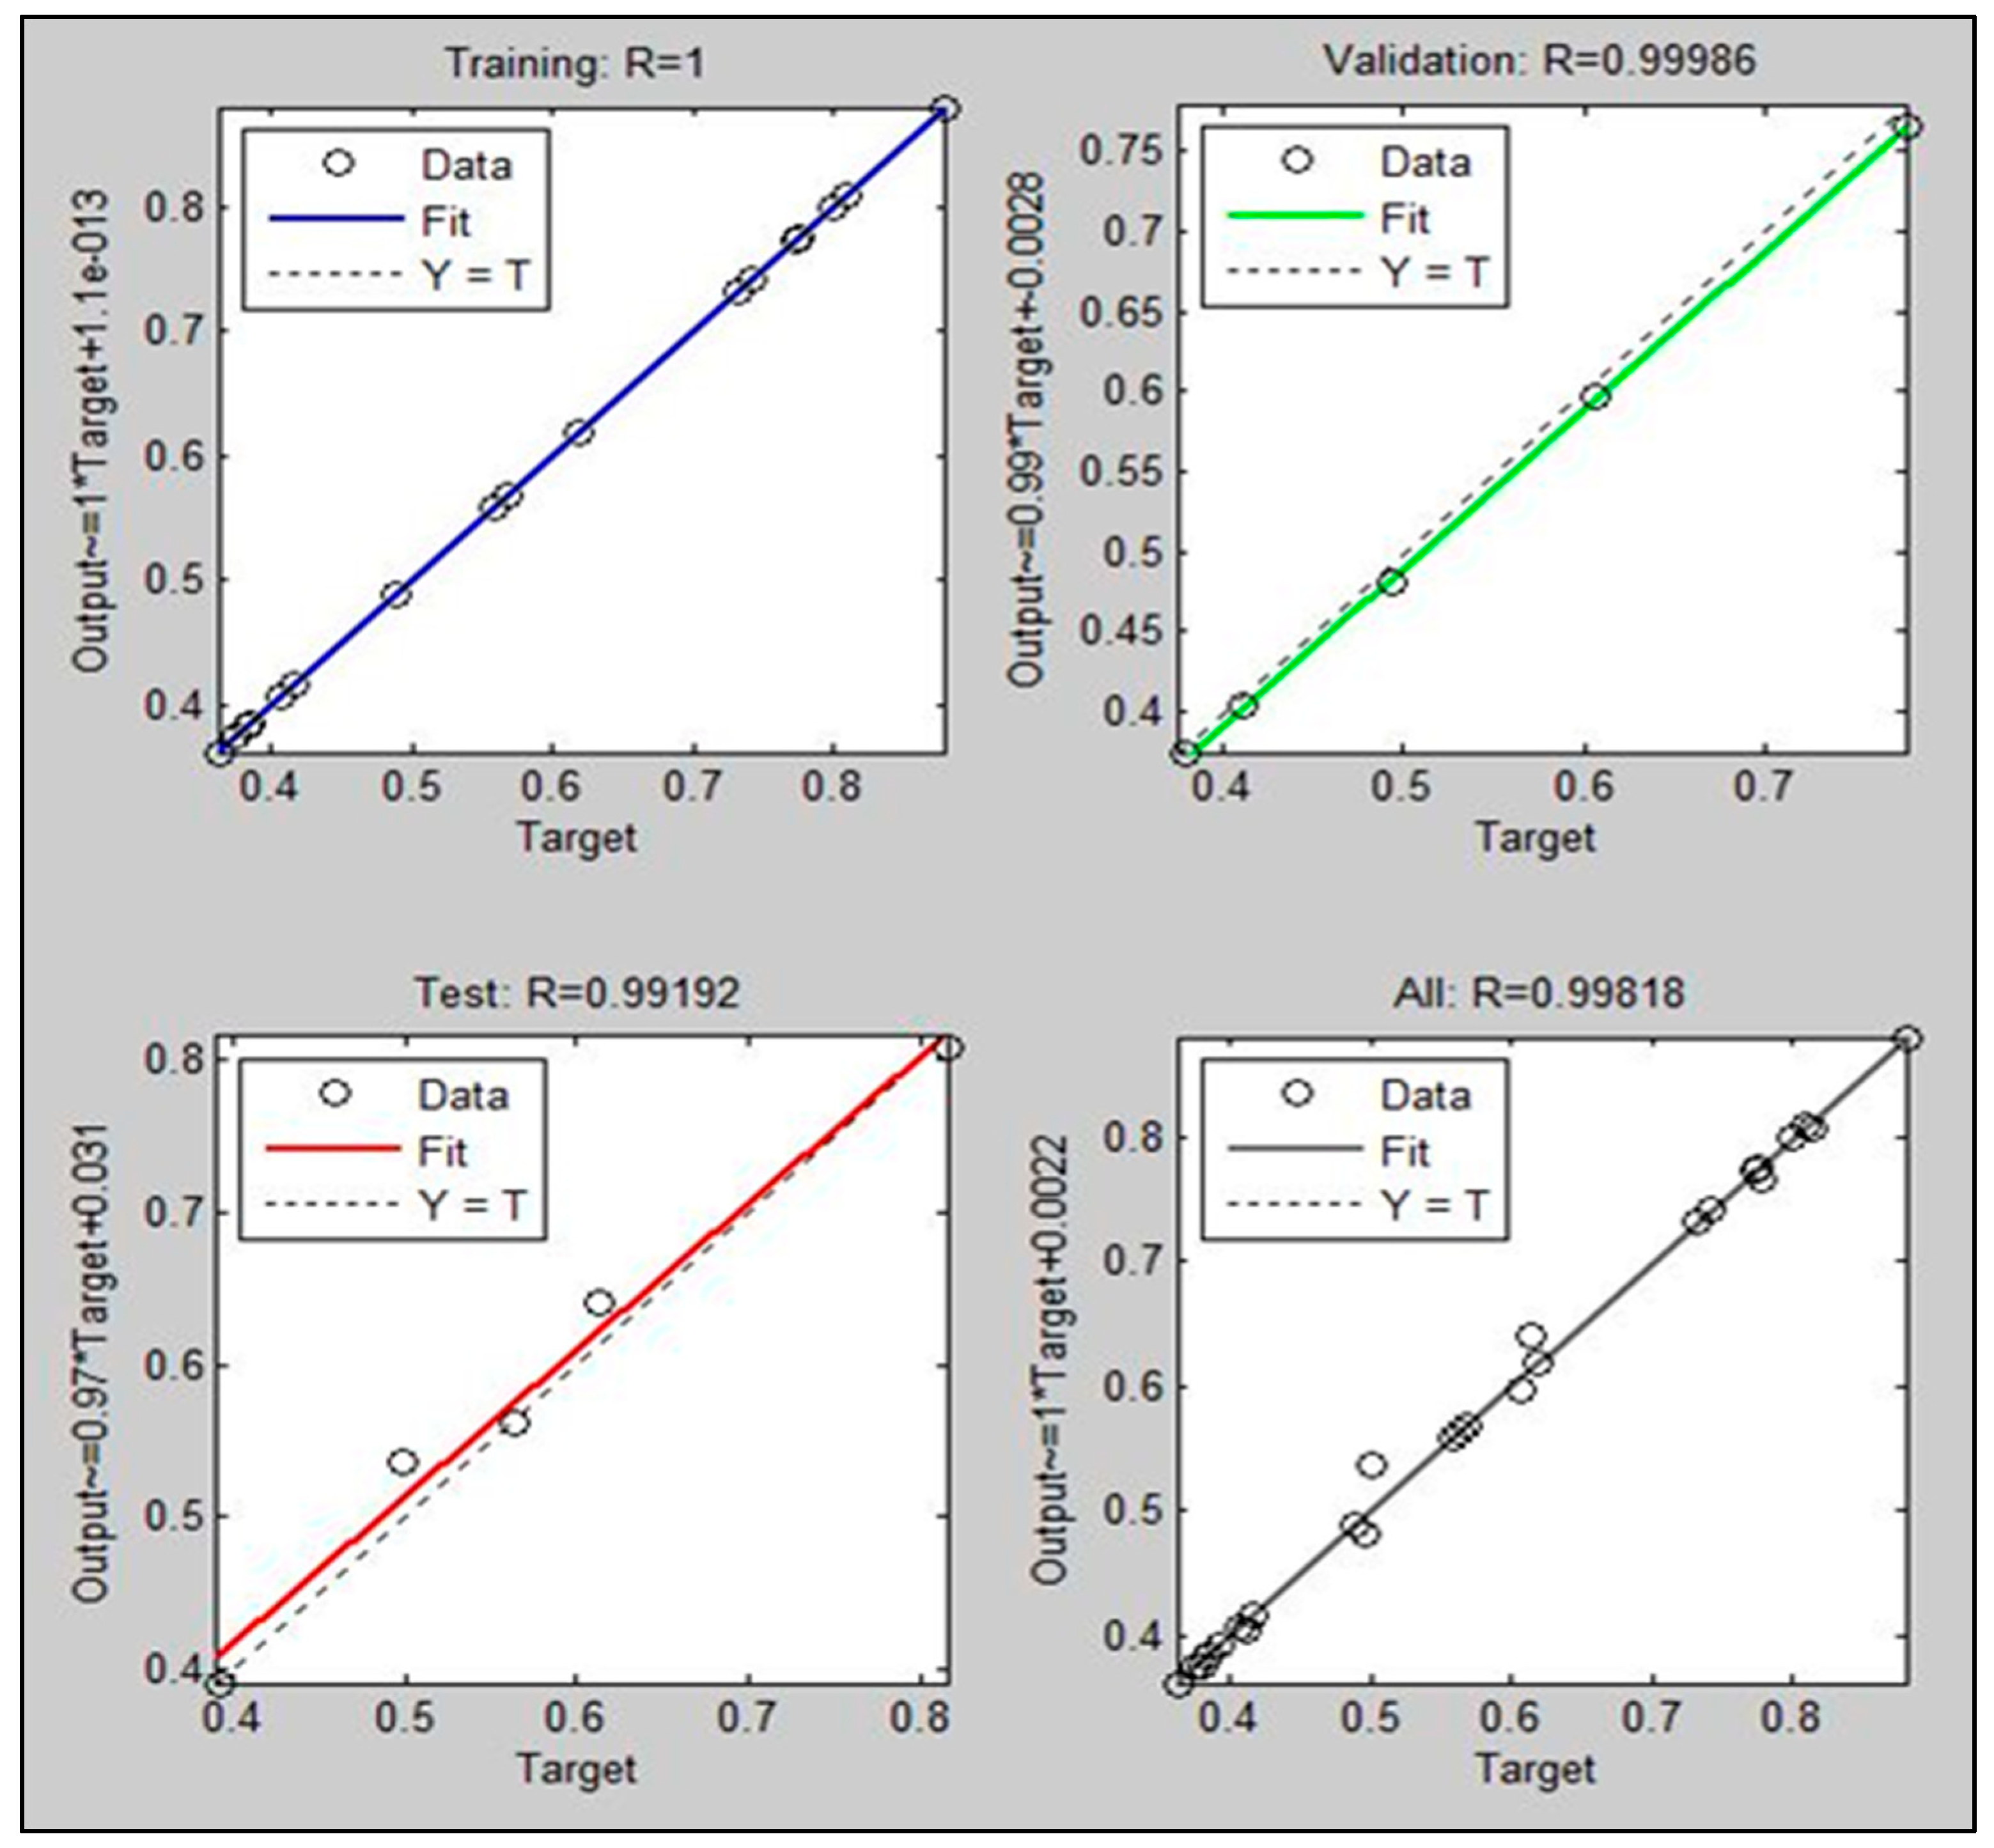
One of the most crucial variables that can be identified when it comes to predicting a process’ accuracy is training performance characteristics. This paper provides a framework that enables the training of a feed-forward backpropagation model using an algorithm-based network. The goal of this study is to perform a series of tests to find the best correlation coefficients for various network architectures. The outcomes of these are portrayed in Table 2. For the multiple-layer structure (5-20-18-1), the mean correlation coefficient is 0.9981, as represented in Figure 6.

3. Results and Discussions

This section explores the idea of variance analysis for the sustainable WEDM process for Hastelloy C276 with the aid ANOVA and the Taguchi Grey method. It also discusses the variables that can influence the multiple attributes of the process.

3.1. Optimization of Material Removal Rate (MRR)

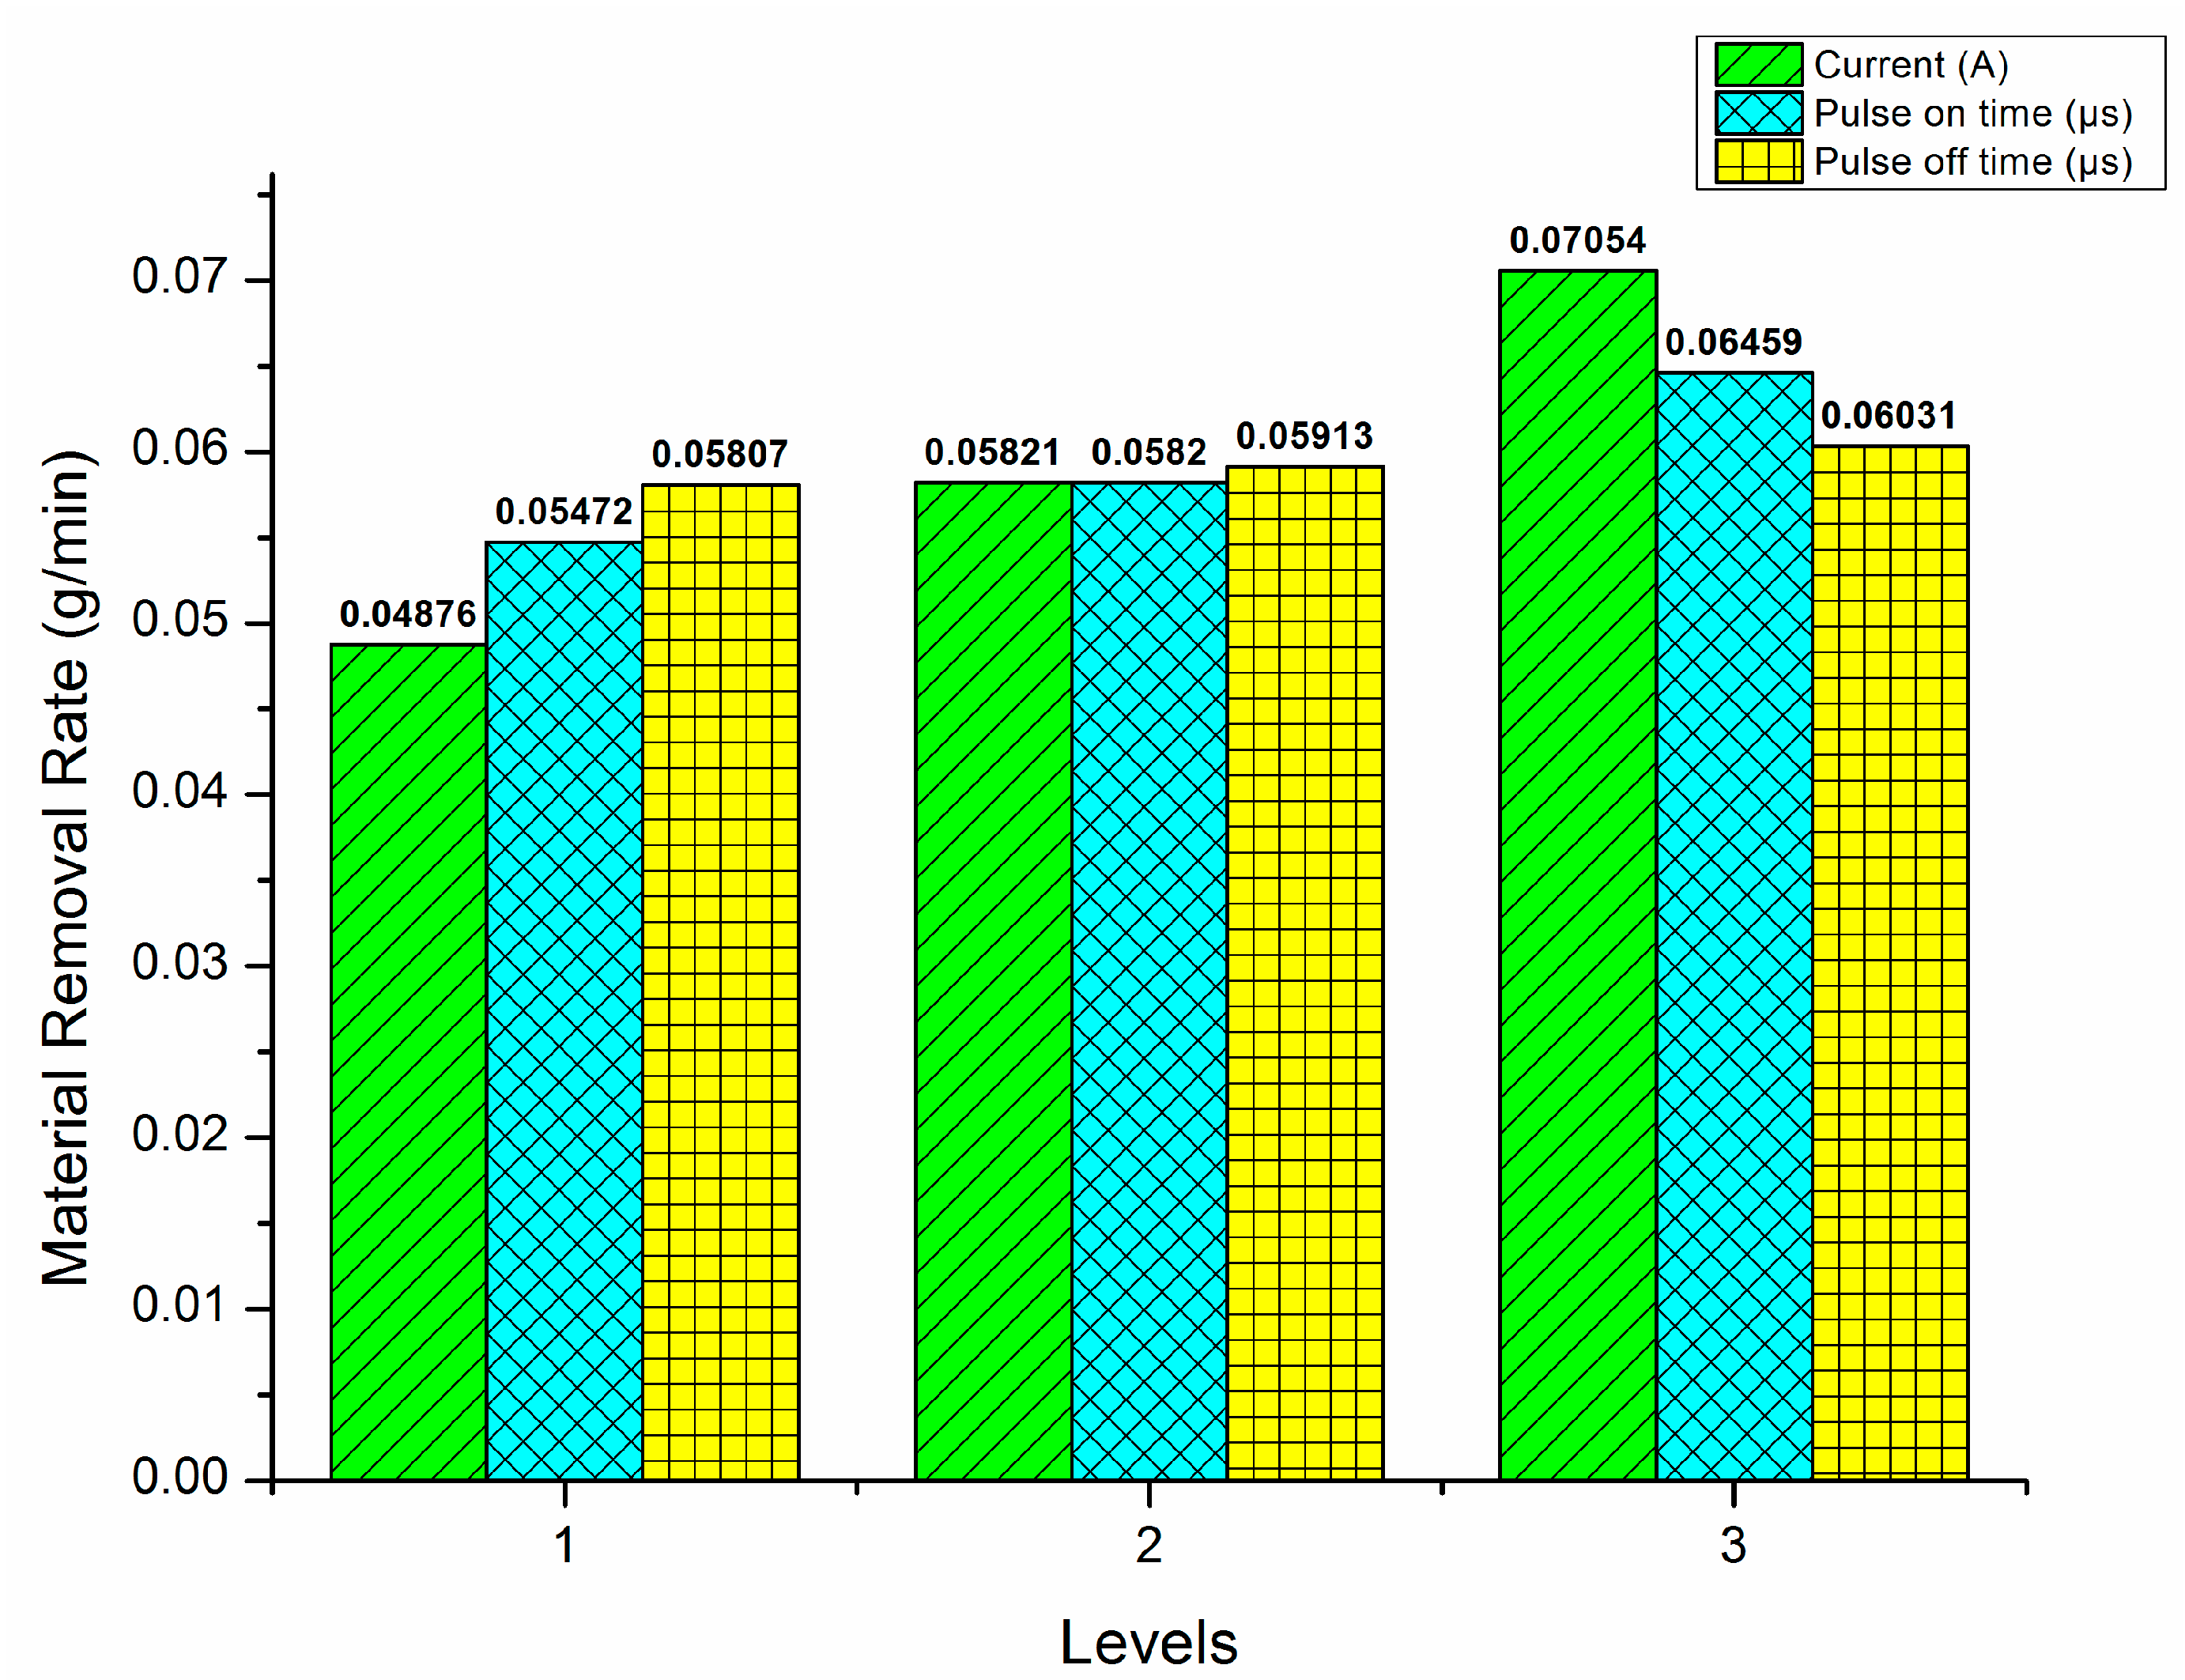
When it comes to the MRR, the larger the criterion, the better it is deemed, which contributes to the reduction in negative environmental impact. Figure 7 depicts the response plot, which shows that increasing the applied current, “Ton” and “Toff”, causes the material removal rate to increase.
An increase in the amount of current that is being applied can lead to an increase in the discharging energy pulse, which in turn results in a faster MRR. The consistent augmentation in the “Ton” sequels in an intensification in the flow of heat, which in turn causes the temperature of the work specimen to increase. This happens due to the plasma channel encircling the work material growing larger, thereby allowing more heat to penetrate it.
Increases in applied current can result in the discharging energy to intensify, resulting in a quicker MRR. The continual rise in the “Ton” enhances the heat flow, which raises the temperature of the specimen. This occurs when the plasma channel grows, enabling additional heat to reach the working material.
Taguchi conducted a study to ascertain the best plausible machining condition to accomplish an enhanced MRR, and the outcomes are shown in Figure 7. A3B3C3 is the most possible amalgamation of factors for achieving an increased material removal rate. The investigation exposed that the current is the greatest imperative variable influencing MRR.

3.2. Optimization of Surface Roughness (SR)

The SR criterion is used in sustainable WEDM to evaluate the efficiency of the system. In Figure 8, the effect plot shows that increasing the “Ton”, “Toff”, and “Ton” values can increase the values of SR. It also shows that the increment in heat energy from the machining zone can cause a decrease in the overall surface temperature. The continuous flow of hot gases and the formation of molten metal pools can reduce the surface temperature of the work zone. This phenomenon also results in crater formation. The crater size can influence the quality of the feature made. The surface temperature can be controlled by the energy that the work zone eruptions generate. The electric discharge’s surface becomes rougher due to the increased pulse of energy.
Figure 8 depicts the optimal machining combinations for minimizing “SR”. The best possible combinations for minimizing “SR” are determined to be A1B1C1. The influence of current on temperature of the machined surface and its conditions are investigated. It is demonstrated that the current is the most important feature that can influence the overall surface temperature of the surface.

3.3. Optimization of Dimensional Deviation

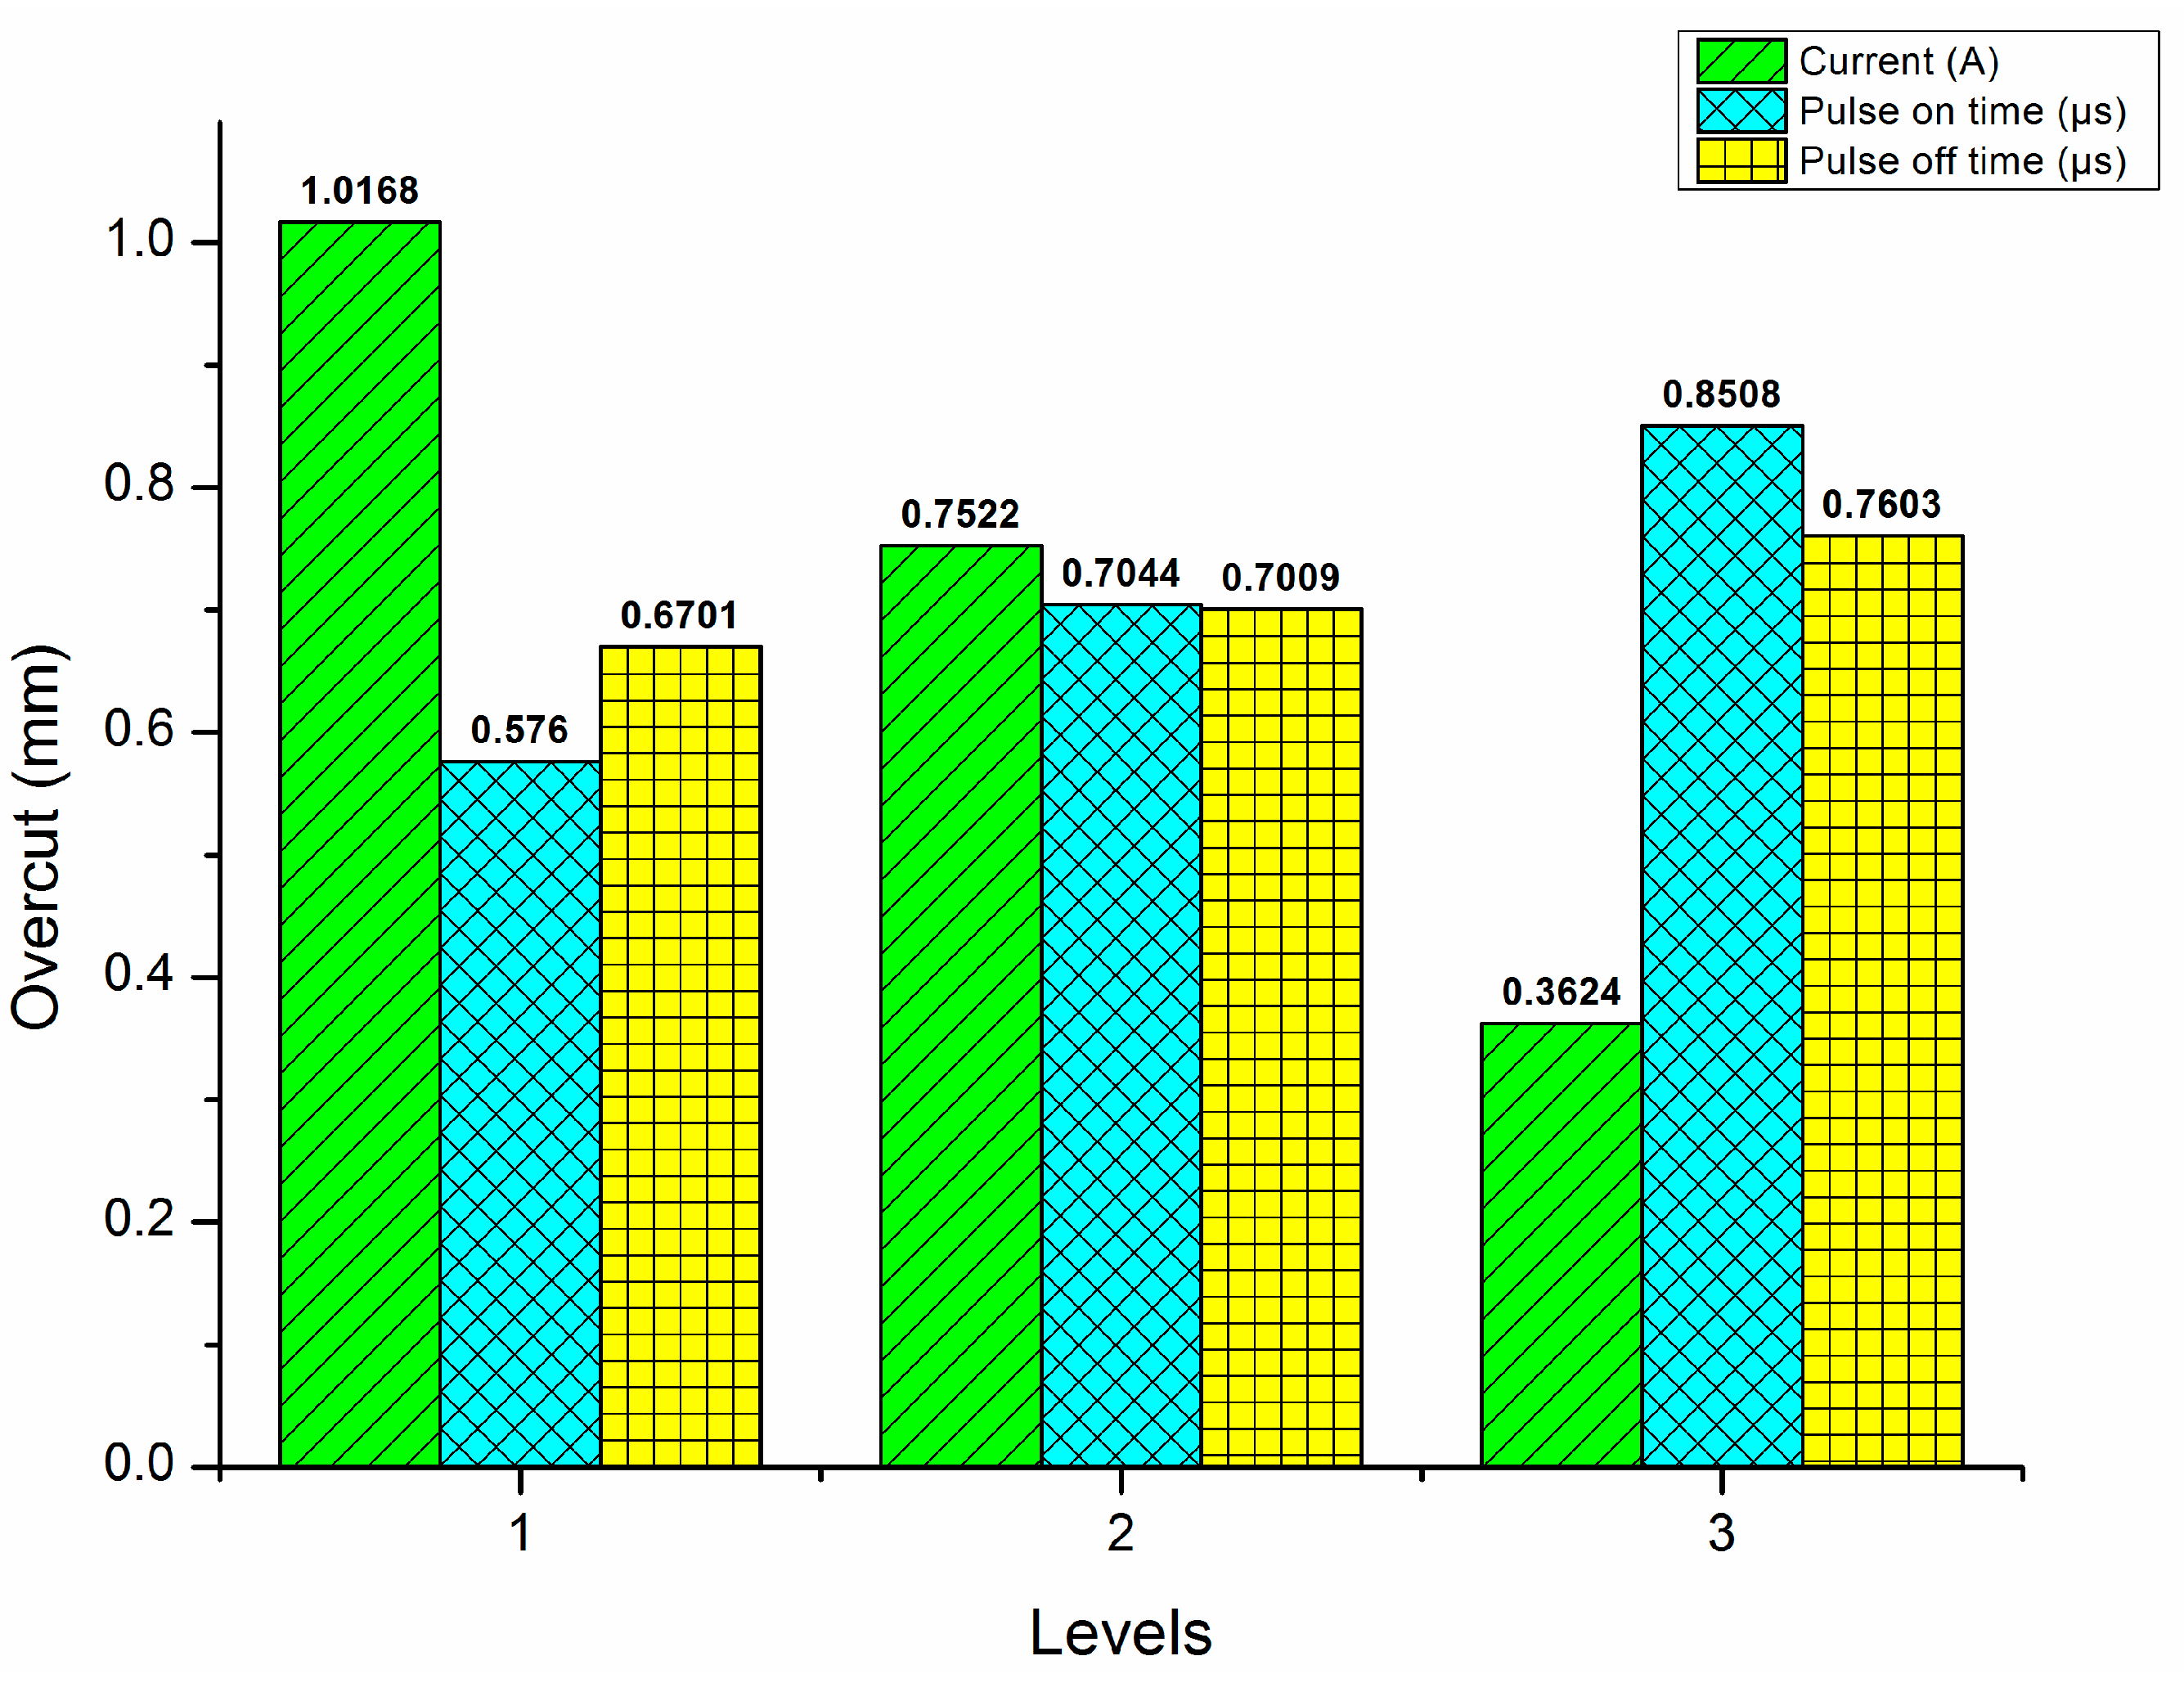
In WEDM, the deviation in dimension is defined by the smallest deviation being the best criterion. Figure 9 portrays the main effect plot for dimensional deviation. It demonstrates that increasing the current decreases the overcut value, while increasing “Ton” and “Toff” increases it. If the debris has been removed appropriately, it may result in secondary sparks in the cutting region and on the side walls of the made feature. Due to the pulse duration, the discharge energy intensification can result in deep crater formation. When the duration of the pulse increases, debris can become trapped in the interelectrode gap, reducing the device’s dimensional accuracy.
A3B1C1 determines the best machining combinations for obtaining the minimized deviation in dimension during the WEDM of Hastelloy C276. Figure 9 depicts the results of Taguchi’s analysis. During the WEDM process, the applied current is critical in the overcut.

3.4. Optimization of Circularity and Perpendicularity Errors

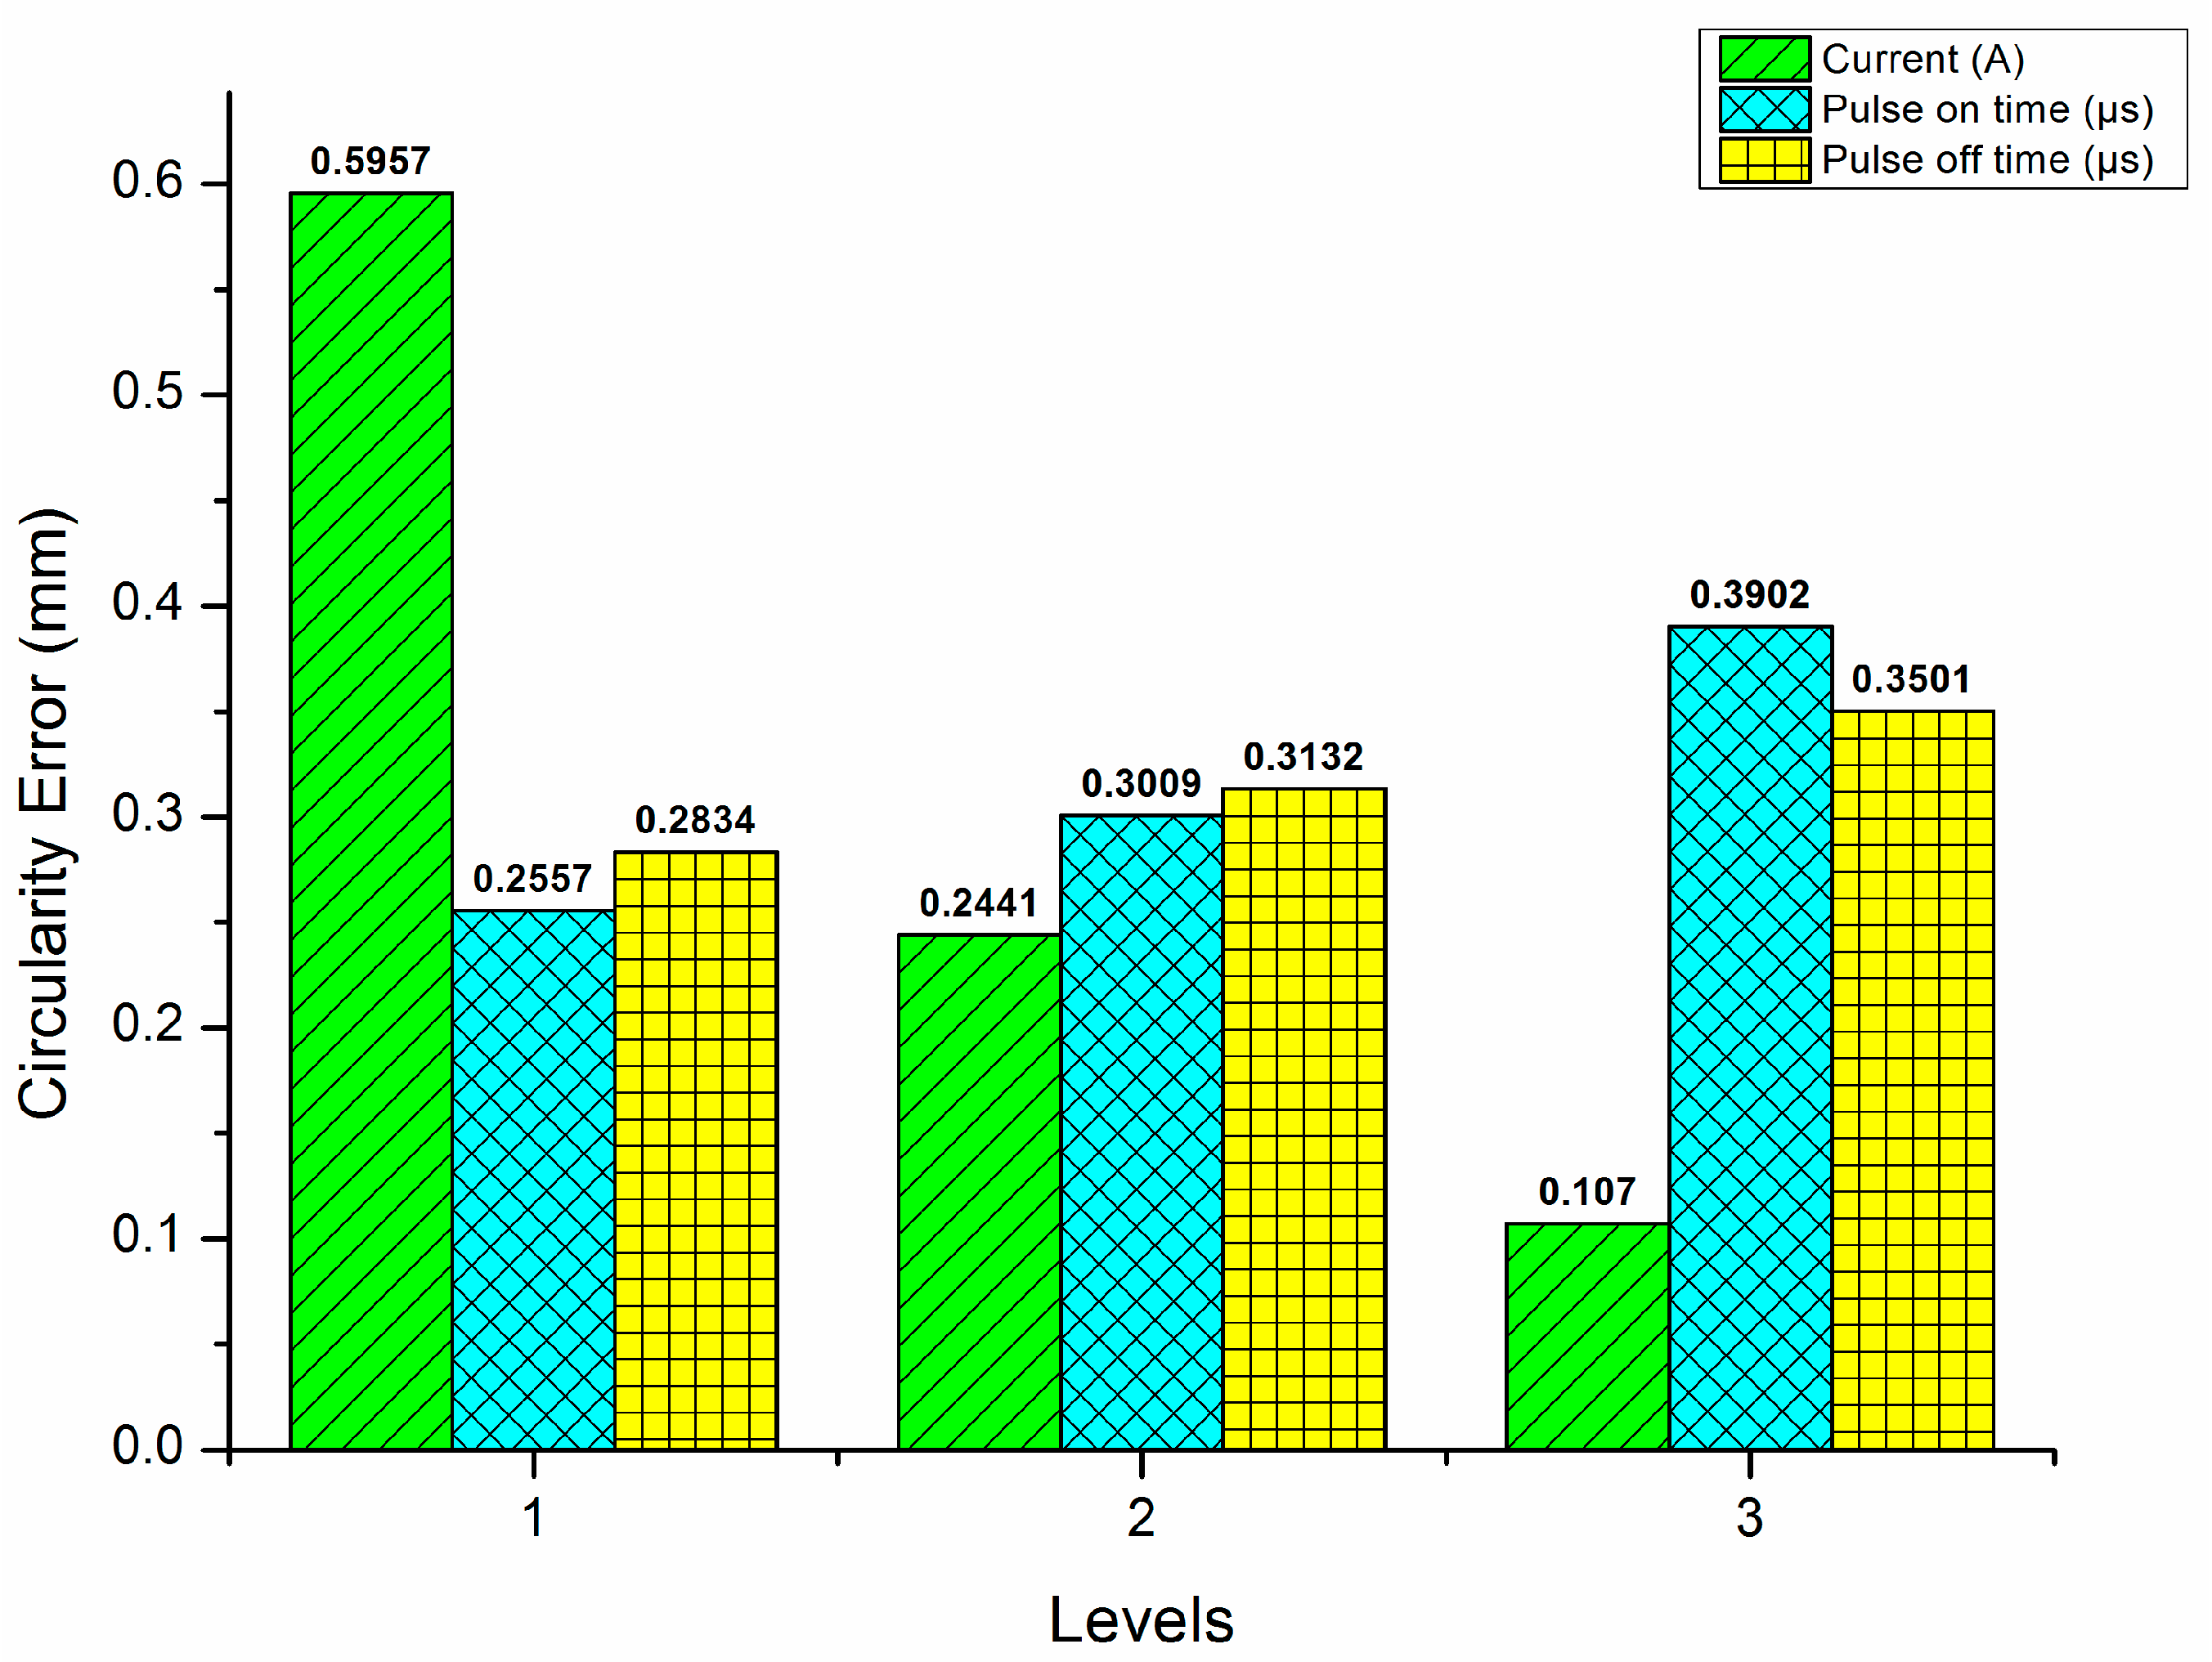
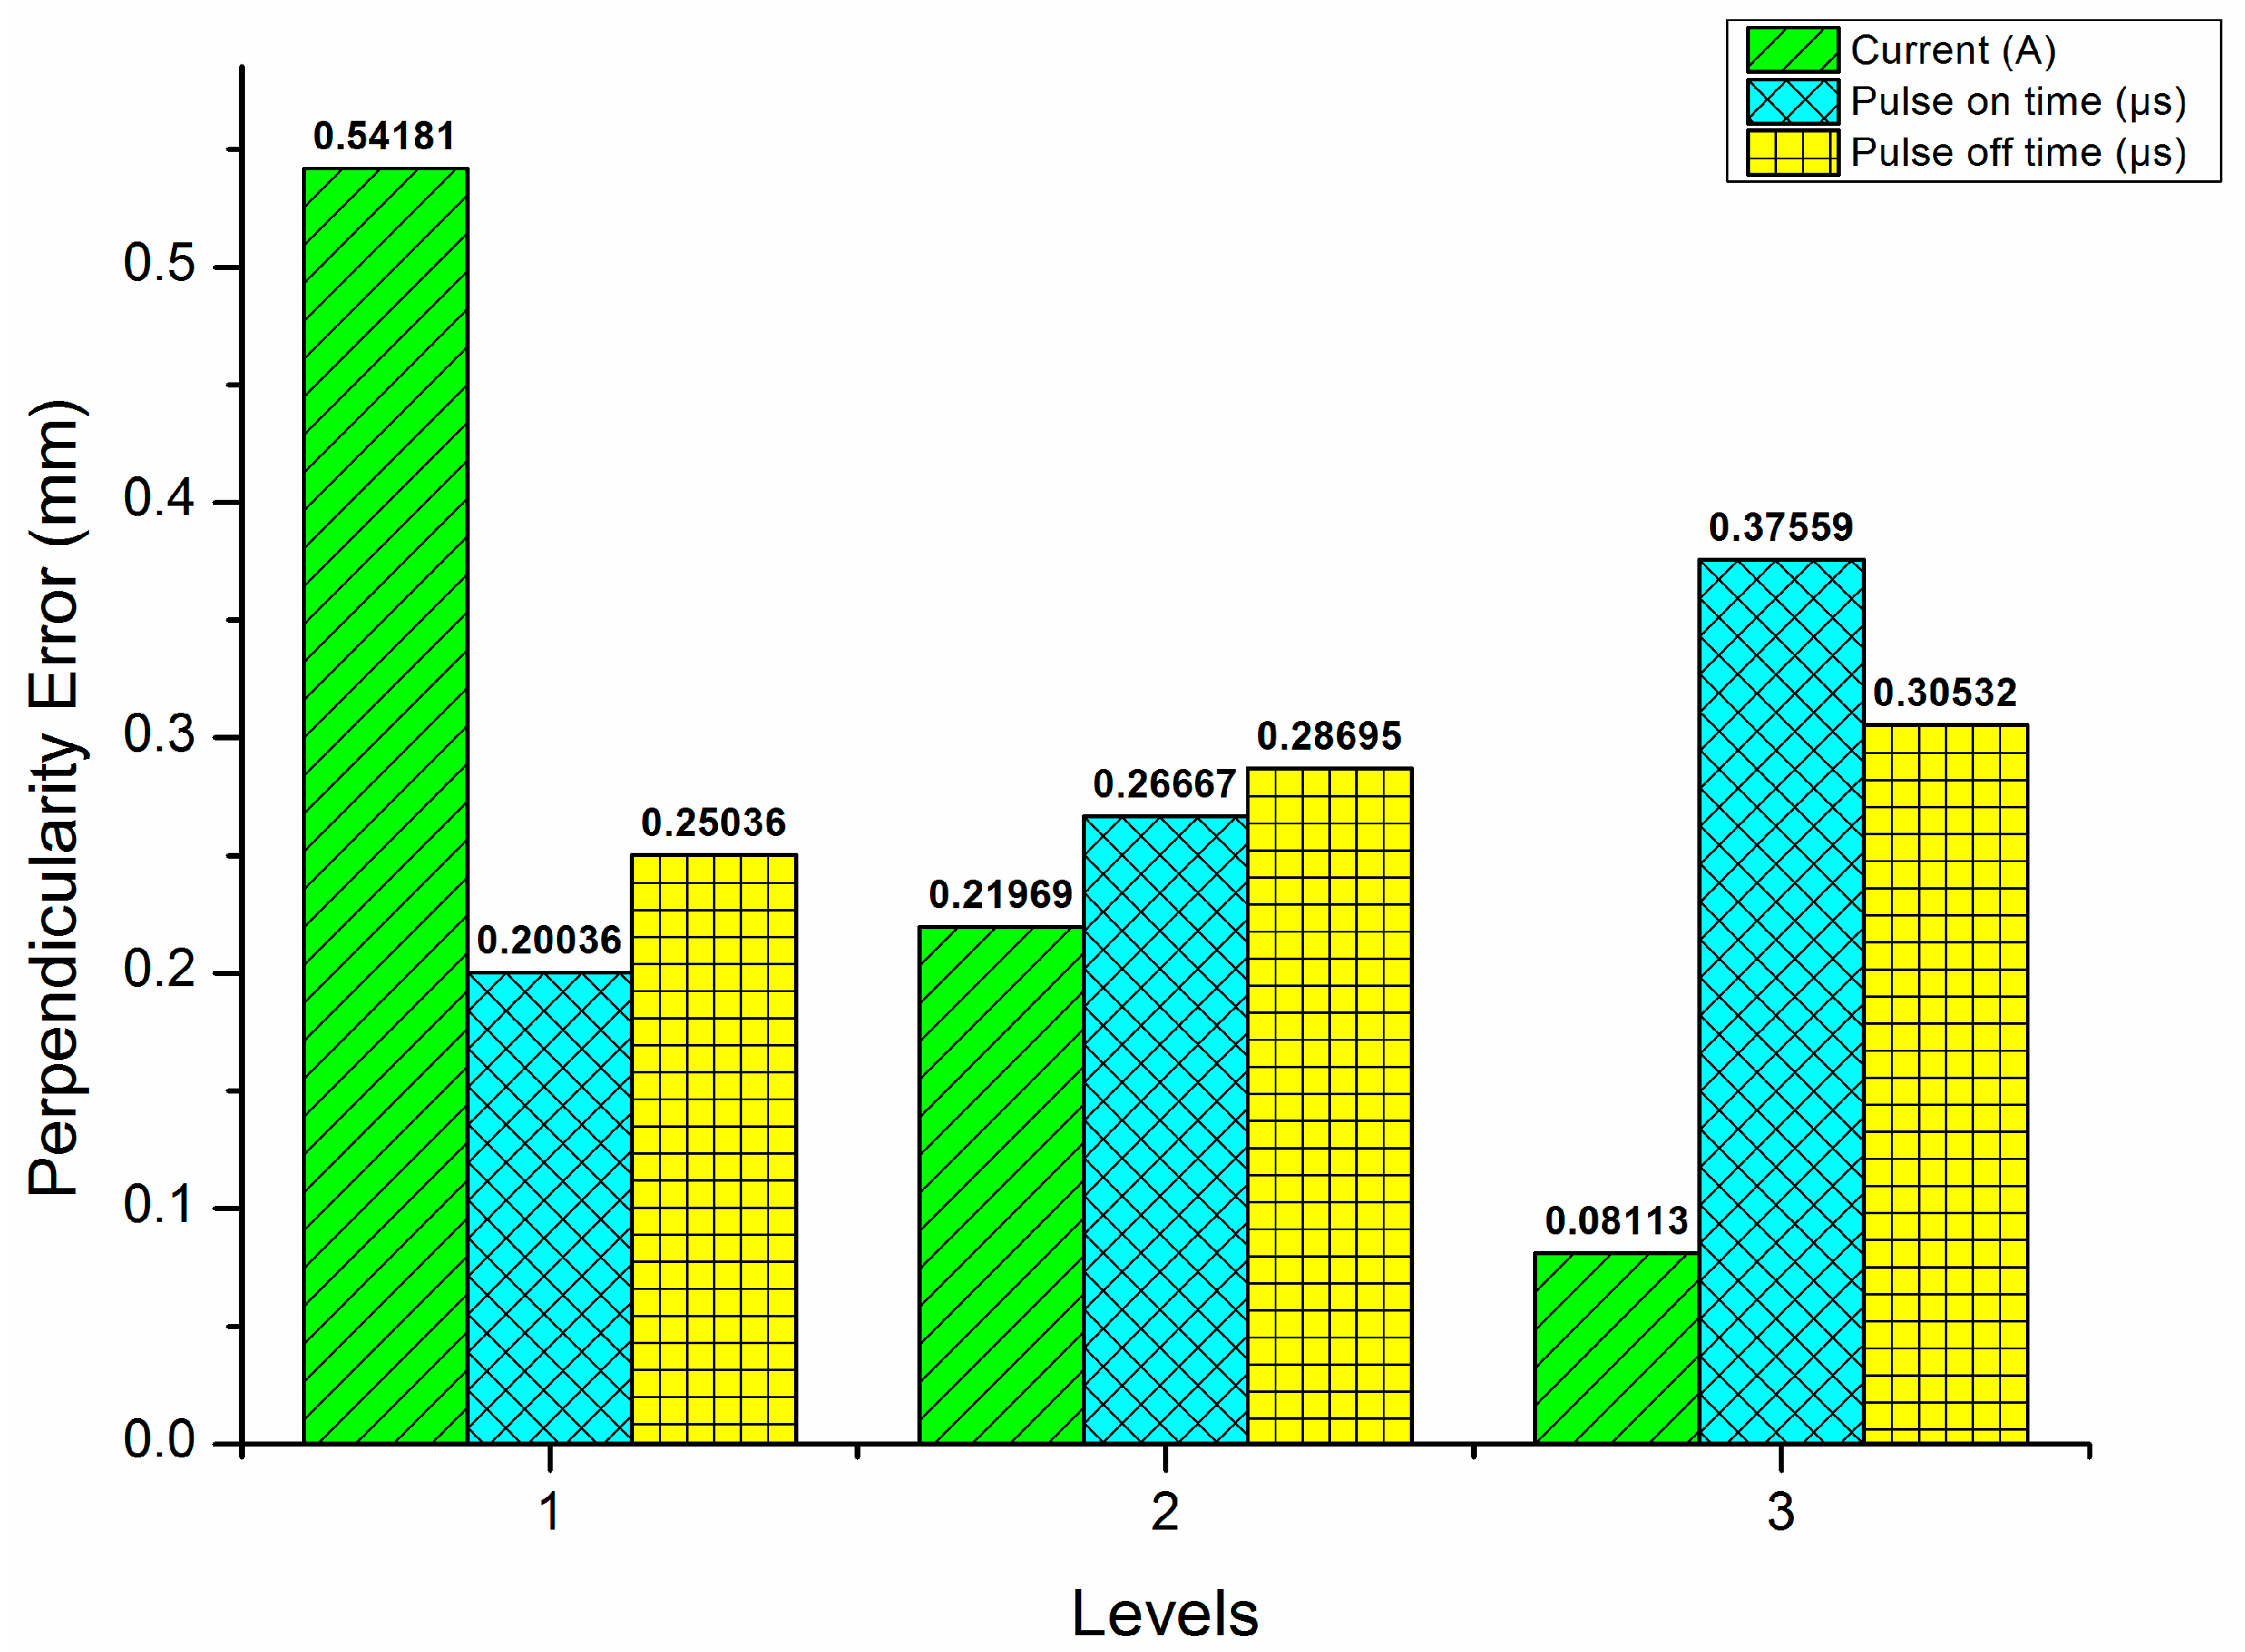
In advanced processes, circularity and orientation tolerances are important performance indicators. Figure 10 and Figure 11 highlight the errors in circularity and perpendicularity errors in WEDM of C-276. The graphical representation shows the influence of the current on these parameters.
The increment in the pulse duration and the pulse rate can lead to a reduction in the accuracy of the circular hole. In addition, it can result in the removal of material to take place in a shorter timeframe. This can cause the development of tolerance and form errors.
This study found that the optimal conditions for the production of a particular type of metal can be achieved by optimizing the A3B1C1 conditions. For minimizing the errors in orientation and form tolerance, a comprehensive analysis has been performed. The current, which is the predominant variable which affects these output measures, was also studied.

3.5. Significance Analysis for Chosen Output Measures

ANOVA is a tool that can be used to examine the numerous variables of this investigational analysis statistically, and it can be performed with the Minitab 20.2.0 software. ANOVA was used to analyze the various parameters of the process involved in the machining of C-276 Hastelloy. The “F” value and the ‘p’ value are two statistical measures that are utilized in the testing of hypotheses. The “F” value is a comparison of the combined effects of all of the variables, and a higher “F” value indicates a greater likelihood that the variation caused by the independent variable is due to a genuine factor rather than being the result of random chance. Given that the alternative hypothesis is false, the ‘p’ value indicates the likelihood of obtaining a result at least as extreme as the one that was actually observed, given that the null hypothesis is accepted. A low ‘p’ value indicates that all of the results obtained are statistically significant. The “F” value is a statistical test that is used in ANOVA to determine if there is a significant difference between two or more groups. To determine it, divide the variance between the groups by the variance within the groups. This will give you the answer. The higher the “F” value, the greater the likelihood that there is a statistically significant disparity between the groups being compared.
Table 3 shows the outcomes from the ANOVA analysis, and it is perceived from the “F” value and % contribution that all the performance measures considered in this investigation are influenced by supplied current. “Ton” is the next momentous parameter for the opted for output characteristics.

Prediction of Performance Measure by Neural Network Model

The GRA concept was opted for to derive the GRC and GRG values, as shown in Table 4. GRG is called a multi-performance index, which has an objective function of maximization. Based on the GRC value arrived, the model was developed by feeding GRC as input to the predictive model for foretelling the necessary performance measure. A multi-layer network is the structure that is used to compute this value. This method could be used to forecast the GRG values with the help of GRC.

3.6. Analysis on the Evolved Neural Network Model

The prediction error is a type of numerical measure that occurs when the values from the evolved model are different from the experimentation values. This is verified by estimating the error using the subsequent Equation (1) and is represented in Table 5.
M e a n   a b s o l u t e   p e r c e n t a g e   e r r o r   ( M A P E ) ( % ) = 1 n i = 1 n E V P V E V × 100
The correlation coefficient and the Root Mean Square Error (RMSE) are used to evaluate the prediction model, which can be derived from Equations (2) and (3).
R M S E = 1 n i = 1 n E V P V 2
R 2 = 1 m = 1 n P V E V 2 m = 1 n E V 2
where “EV” and “PV” are the actual and foretold values, respectively, for total “n” number of observations in the model.
The difference between the values that were predicted by a model and the values that occurred is referred to as the prediction error in the field of statistics. The evaluation of the accuracy of predictive models can be done using a variety of errors, each of which can be used in their own unique way. These errors serve as a measurement tool that determines how accurately a model can forecast outcomes based on the data that it is fed. They can be used to evaluate various models and determine which one is superior to others in terms of accurately predicting the outcomes of events.

3.7. Comparison on Actual and Prophesied GRG

The aspiration of this exploration was to evolve an NN model capable of predicting the Grey relational grade using the correlation coefficient. The error convergence procedure was also performed to ascertain the optimum configuration of the network. The outcomes of the investigational analysis revealed that the network that has two hidden layers and 18 neurons has the best suitable parameters.
The NN model was evolved using the algorithm known as the Levenberg–Marquardt method. The average correlation coefficient of the network is 0.9981. It was suggested that two layers with 18 neurons each be placed in the prediction task to execute it well. The values of the network model and those of the experiment setups are compared in Table 6. The outcomes of the analysis revealed that the foretold data were associated with the calculated ones. It also showed that the ANN model had a strong connection with the experiment’s data.

4. Conclusions

The exploration was conducted on the WEDM of C-276. The aspiration of this investigation was to evolve an NN model that can predict its GRG. It was then improved and applied to the ANN-GRG.
  • The WEDM trials utilized the L27 orthogonal array of Taguchi as the basis for their performance characteristics.
  • The approach utilized by Taguchi determines the optimal set of variables for each output.
  • The aspiration of the analysis was to determine the various parameters that impact the performance of Hastelloy during the WEDM procedure. It was revealed that the current was the important factor that affected the alloy’s performance.
  • The data collected from the relational coefficient are then fed into the WEDM process model. It predicts the ANN-GRG values.
  • The outcome of the exploratory investigation suggested that the Grey-ANN model can predict Hastelloy’s performance during WEDM. It also noted that the anticipated ANN-GRG model could enhance the prediction competence of the model.
  • The findings of the study indicated that the ANN method can be exploited for various advanced machining processes.

Author Contributions

Conceptualization, M.N. and T.P.; Methodology, M.N., T.P. and J.G.; Software, M.N., T.P., J.G. and C.M.; Validation, T.P., M.M.S.A., F.M. and P.G.; Formal analysis, R.C., C.M. and P.G.; Investigation, M.M.S.A., F.M., C.M. and A.A.S.; Resources, F.M., J.G., R.C., P.G. and A.A.S.; Data curation, N.S.; Writing—original draft, M.N. and N.S.; Writing—review & editing, M.M.S.A., R.C. and N.S.; Visualization, N.S. and C.M.; Supervision, J.G. and R.C.; Project administration, A.A.S.; Funding acquisition, M.M.S.A., F.M. and A.A.S. All authors have read and agreed to the published version of the manuscript.

Funding

This research was funded by Researchers Supporting Project number (RSPD2023R688), King Saud University, Riyadh, Saudi Arabia.

Institutional Review Board Statement

Not applicable.

Informed Consent Statement

Not applicable.

Data Availability Statement

The datasets used during the current study are available from the corresponding author on reasonable request.

Acknowledgments

The authors acknowledge financial support through Researchers Supporting Project number (RSPD2023R688), King Saud University, Riyadh, Saudi Arabia.

Conflicts of Interest

The authors declare no conflict of interest.

References

  1. Everhart, J. Engineering Properties of Nickel and Nickel Alloys; Springer Science & Business Media: Berlin/Heidelberg, Germany, 2012. [Google Scholar]
  2. Thejasree, P.; Manikandan, N.; Binoj, J.S.; Varaprasad, K.C.; Palanisamy, D.; Ramesh, R. Numerical Simulation and Experimental Investigation on Laser Beam Welding of Inconel 625. Mater. Today Proc. 2021, 39, 268–273. [Google Scholar] [CrossRef]
  3. Sharma, P.; Chakradhar, D.; Narendranath, S. Evaluation of WEDM performance characteristics of Inconel 706 for turbine disk application. Mater. Des. 2015, 88, 558–566. [Google Scholar] [CrossRef]
  4. Jadam, T.; Sahu, S.K.; Datta, S.; Masanta, M. EDM performance of Inconel 718 superalloy: Application of multi-walled carbon nanotube (MWCNT) added dielectric media. J. Braz. Soc. Mech. Sci. Eng. 2019, 41, 305. [Google Scholar] [CrossRef]
  5. Sharma, P.; Chakradhar, D.S.N. Analysis and Optimization of WEDM Performance Characteristics of Inconel 706 for Aerospace Application. Silicon 2018, 10, 921–930. [Google Scholar] [CrossRef]
  6. Ho, K.H.; Newman, S.T. State of the art electrical discharge machining (EDM). Int. J. Mach. Tools Manuf. 2003, 43, 1287–1300. [Google Scholar] [CrossRef]
  7. Manikandan, N.; Binoj, J.; Thejasree, P.; Sasikala, P.; Anusha, P. Application of Taguchi method on Wire Electrical Discharge Machining of Inconel 625. Mater. Today Proc. 2021, 39, 121–125. [Google Scholar] [CrossRef]
  8. Kliuev, M.; Florio, K.; Akbari, M.; Wegener, K. Influence of energy fraction in EDM drilling of Inconel 718 by statistical analysis and finite element crater-modelling. J. Manuf. Process. 2019, 40, 84–93. [Google Scholar] [CrossRef]
  9. El-Hofy, H. Advanced Machining Processes; McGraw-Hill: New York, NY, USA, 2005. [Google Scholar]
  10. Li, X.; Yan, F.; Ma, J.; Chen, Z.; Wen, X.; Cao, Y. RBF and NSGA-II based EDM process parameters optimization with multiple constraints. Math. Biosci. Eng. 2019, 16, 5788–5803. [Google Scholar]
  11. Buschaiah, K.; JagadeeswaraRao, M.; Krishnaiah, A. Investigation on the Influence of Edm Parameters on Machining Characteristics for Aisi 304. Mater. Today Proc. 2018, 5, 3648–3656. [Google Scholar] [CrossRef]
  12. Palanisamy, D.; Devaraju, A.; Manikandan, N.; Balasubramanian, K.; Arulkirubakaran, D. Experimental investigation and optimization of process parameters in EDM of aluminium metal matrix composites. Mater. Today Proc. 2020, 22, 525–530. [Google Scholar] [CrossRef]
  13. Thejasree, P.; Binoj, J.S.; Krishnamachary, P.C.; Manikandan, N.; Palanisamy, D. Experimental Analysis on Wire Electrical Discharge Machining of Inconel 718 Using Taguchi’s Method. Adv. Ind. Autom. Smart Manuf. Lect. Notes Mech. Eng. 2020, 497–504. [Google Scholar] [CrossRef]
  14. Manikandan, N.; Thejasree, P.; Raju, R.; Palanisamy, D.; Varaprasad, K.C.; Britto, A.S.F.; Sai, A.D.C. Investigations on Wire Electrical Discharge Machining of Titanium Alloys by Taguchi—Grey Approach; Springer: Singapore, 2022. [Google Scholar] [CrossRef]
  15. Boopathi, S. Cryogenically treated and untreated stainless steel grade 317 in sustainable wire electrical discharge machining process: A comparative study. Environ. Sci. Pollut. Res. 2022, 56, 1–10. [Google Scholar] [CrossRef]
  16. Pramanik, A.; Basak, A. Sustainability in wire electrical discharge machining of titanium alloy: Understanding wire rupture. J. Clean. Prod. 2018, 198, 472–479. [Google Scholar] [CrossRef]
  17. Camposeco-Negrete, C. Analysis and optimization of sustainable machining of AISI O1 tool steel by the wire-EDM process. Adv. Manuf. 2021, 9, 304–317. [Google Scholar] [CrossRef]
  18. Yan, H.; Djo Bakadiasa, K.; Yan, Z.; Han, F.; Chen, Z. Sustainable production of high-uniformity workpiece surface quality in wire electrical discharge machining by fabricating surface microstructure on wire electrode. J. Clean. Prod. 2020, 259, 120881. [Google Scholar] [CrossRef]
  19. Deng, J. Introduction to grey system. J. Grey Syst. 1989, 1, 1–24. [Google Scholar]
  20. Manikandan, N.; Varaprasad, K.C.; Thejasree, P.; Palanisamy, D.; Arulkirubakaran, D.; Raju, R.; Badrinath, K. Prediction of Performance Measures Using Multiple Regression Analysis for Wire Electrical Discharge Machining of Titanium Alloy; Springer: Singapore, 2022. [Google Scholar] [CrossRef]
  21. Palanisamy, D.; Senthil, P. Optimization on turning parameters of 15-5PH stainless steel using Taguchi based grey approach and TOPSIS. Arch. Mech. Eng. 2016, 63, 397–412. [Google Scholar] [CrossRef] [Green Version]
  22. Bhuyan, R.K.; Shalini, M.; Routara, B.C. RSM and Fuzzy logic approaches for predicting the surface roughness during EDM of Al-SiCp MMC. Mater. Today Proc. 2017, 4, 1947–1956. [Google Scholar] [CrossRef]
  23. Patel Gowdru Chandrashekarappa, M.; Kumar, S.; Pimenov, D.Y.; Giasin, K. Experimental analysis and optimization of EDM parameters on HcHcr steel in context with different electrodes and dielectric fluids using hybrid taguchi-based PCA-utility and CRITIC-utility approaches. Metals 2021, 11, 419. [Google Scholar] [CrossRef]
  24. Rupesh, K.P.; Panda, S.S. Optimization of bone drilling parameters using grey-based fuzzy algorithm. Measurement 2014, 47, 386–392. [Google Scholar]
  25. Mithal, A.; Maharjan, N.; Idapalapati, S. Enhanced cooling rates in laser directed energy deposition with interlayer peening. Rapid Prototyp. J. 2023, 29, 1289–1298. [Google Scholar] [CrossRef]
  26. Khorasani, M.; Ghasemi, A.H.; Farabi, E.; Leary, M.; Gibson, I.; Rolfe, B. A comprehensive investigation of abrasive barrel finishing on hardness and manufacturability of laser-based powder bed fusion hollow components. Int. J. Adv. Manuf. Technol. 2022, 120, 3471–3490. [Google Scholar] [CrossRef]
  27. Pradhan, M.K.; Biswas, C.K. Neuro-fuzzy and neural network-based prediction of various responses in electrical discharge machining of AISID2 steel: NF and NN based prediction of responses in EDM of D2 steel. Int. J. Adv. Manuf. Technol. 2010, 50, 591–610. [Google Scholar] [CrossRef]
  28. Dimla, D.E., Jr.; Lister, P.M.; Leighton, N.J. Neural network solutions to the tool condition monitoring problem in metal cutting —Acritical reviewof methods. Int. J. Mach. Tools Manuf. 1997, 37, 1219–1241. [Google Scholar] [CrossRef]
  29. Dini, G. Literature database on applications of artificial intelligence methods in manufacturing engineering. Ann. CIRP 1997, 46, 681–690. [Google Scholar]
  30. Manikandan, N.; Ramesh Raju, D.; Palanisamy, J.S.B. Optimization of Spark Erosion Machining Process Parameters using Hybrid Grey Relational Analysis and Artificial Neural Network Model. Int. J. Mach. Mach. Mater. 2020, 22, 1–23. [Google Scholar]
  31. Kao, J.Y.; Tarng, Y.S. A neural network approach for the on-line monitoring of the electrical discharge machining process. J. Mater. Process. Technol. 1997, 69, 112–119. [Google Scholar] [CrossRef]
  32. Quarto, M.; D’Urso, G.; Giardini, C. Micro-EDM optimization through particle swarm algorithm and artificial neural network. Precis. Eng. 2022, 73, 63–70. [Google Scholar] [CrossRef]
  33. Saffaran, A.; Moghaddam, M.A.; Kolahan, F. Optimization of backpropagation neural network-based models in EDM process using particle swarm optimization and simulated annealing algorithms. J. Braz. Soc. Mech. Sci. Eng. 2020, 42, 1–14. [Google Scholar] [CrossRef]
  34. Demuth, H.; Beale, M. Neural Network Toolbox User’s Guide, Version 8.2 (Release 2014a); The Mathworks, Inc.: Natick, MA, USA, 2000. [Google Scholar]
  35. Alduroobi, A.A.A.; Alaa, M.; Ubaid, M.A.T.; Elias, R.R. Wire EDM process optimization for machining AISI 1045 steel by use of Taguchi method, artificial neural network and analysis of variances. Int. J. Syst. Assur. Eng. Manag. 2020, 11, 1314–1338. [Google Scholar] [CrossRef]
  36. Nichols, G.P.; Fontenot, J.D.; Gibbons, J.P.; Sanders, M. Multi-response optimization of machining parameters of Ti-6Al-2Sn-4Zr-2Mo alloy using EDM process through grey relational analysis. Eng. Res. Express 2023, 5, 025005. [Google Scholar] [CrossRef]
  37. Santosh, P.; Narendranath, V.; Balaji, I.V.; Manoj, V.; Keshav, H.J. Prediction of Machining Characteristics of Wire Electrical Discharge Machined Hastelloy-X using Artificial Neural Network. IOP Conf. Ser. Mater. Sci. Eng. 2022, 1248, 012049. [Google Scholar] [CrossRef]
  38. Karkalos, N.E.; Karmiris-Obratański, P.; Kudelski, R.; Markopoulos, A.P. Experimental Study on the Sustainability Assessment of AWJ Machining of Ti-6Al-4V Using Glass Beads Abrasive Particles. Sustainability 2021, 13, 8917. [Google Scholar] [CrossRef]
  39. Krolczyk, G.M.; Maruda, R.W.; Krolczyk, J.B.; Wojciechowski, S.; Mia, M.; Nieslony, P.; Budzik, G. Ecological trends in machining as a key factor in sustainable production—A review. J. Clean. Prod. 2019, 218, 601–615. [Google Scholar] [CrossRef]
  40. Nieslony, P.; Wojciechowski, S.; Gupta, M.; Chudy, R.; Krolczyk, J.; Maruda, R.; Krolczyk, G. Relationship between energy consumption and surface integrity aspects in electrical discharge machining of hot work die steel. Sustain. Mater. Technol. 2023, 36, e00623. [Google Scholar] [CrossRef]
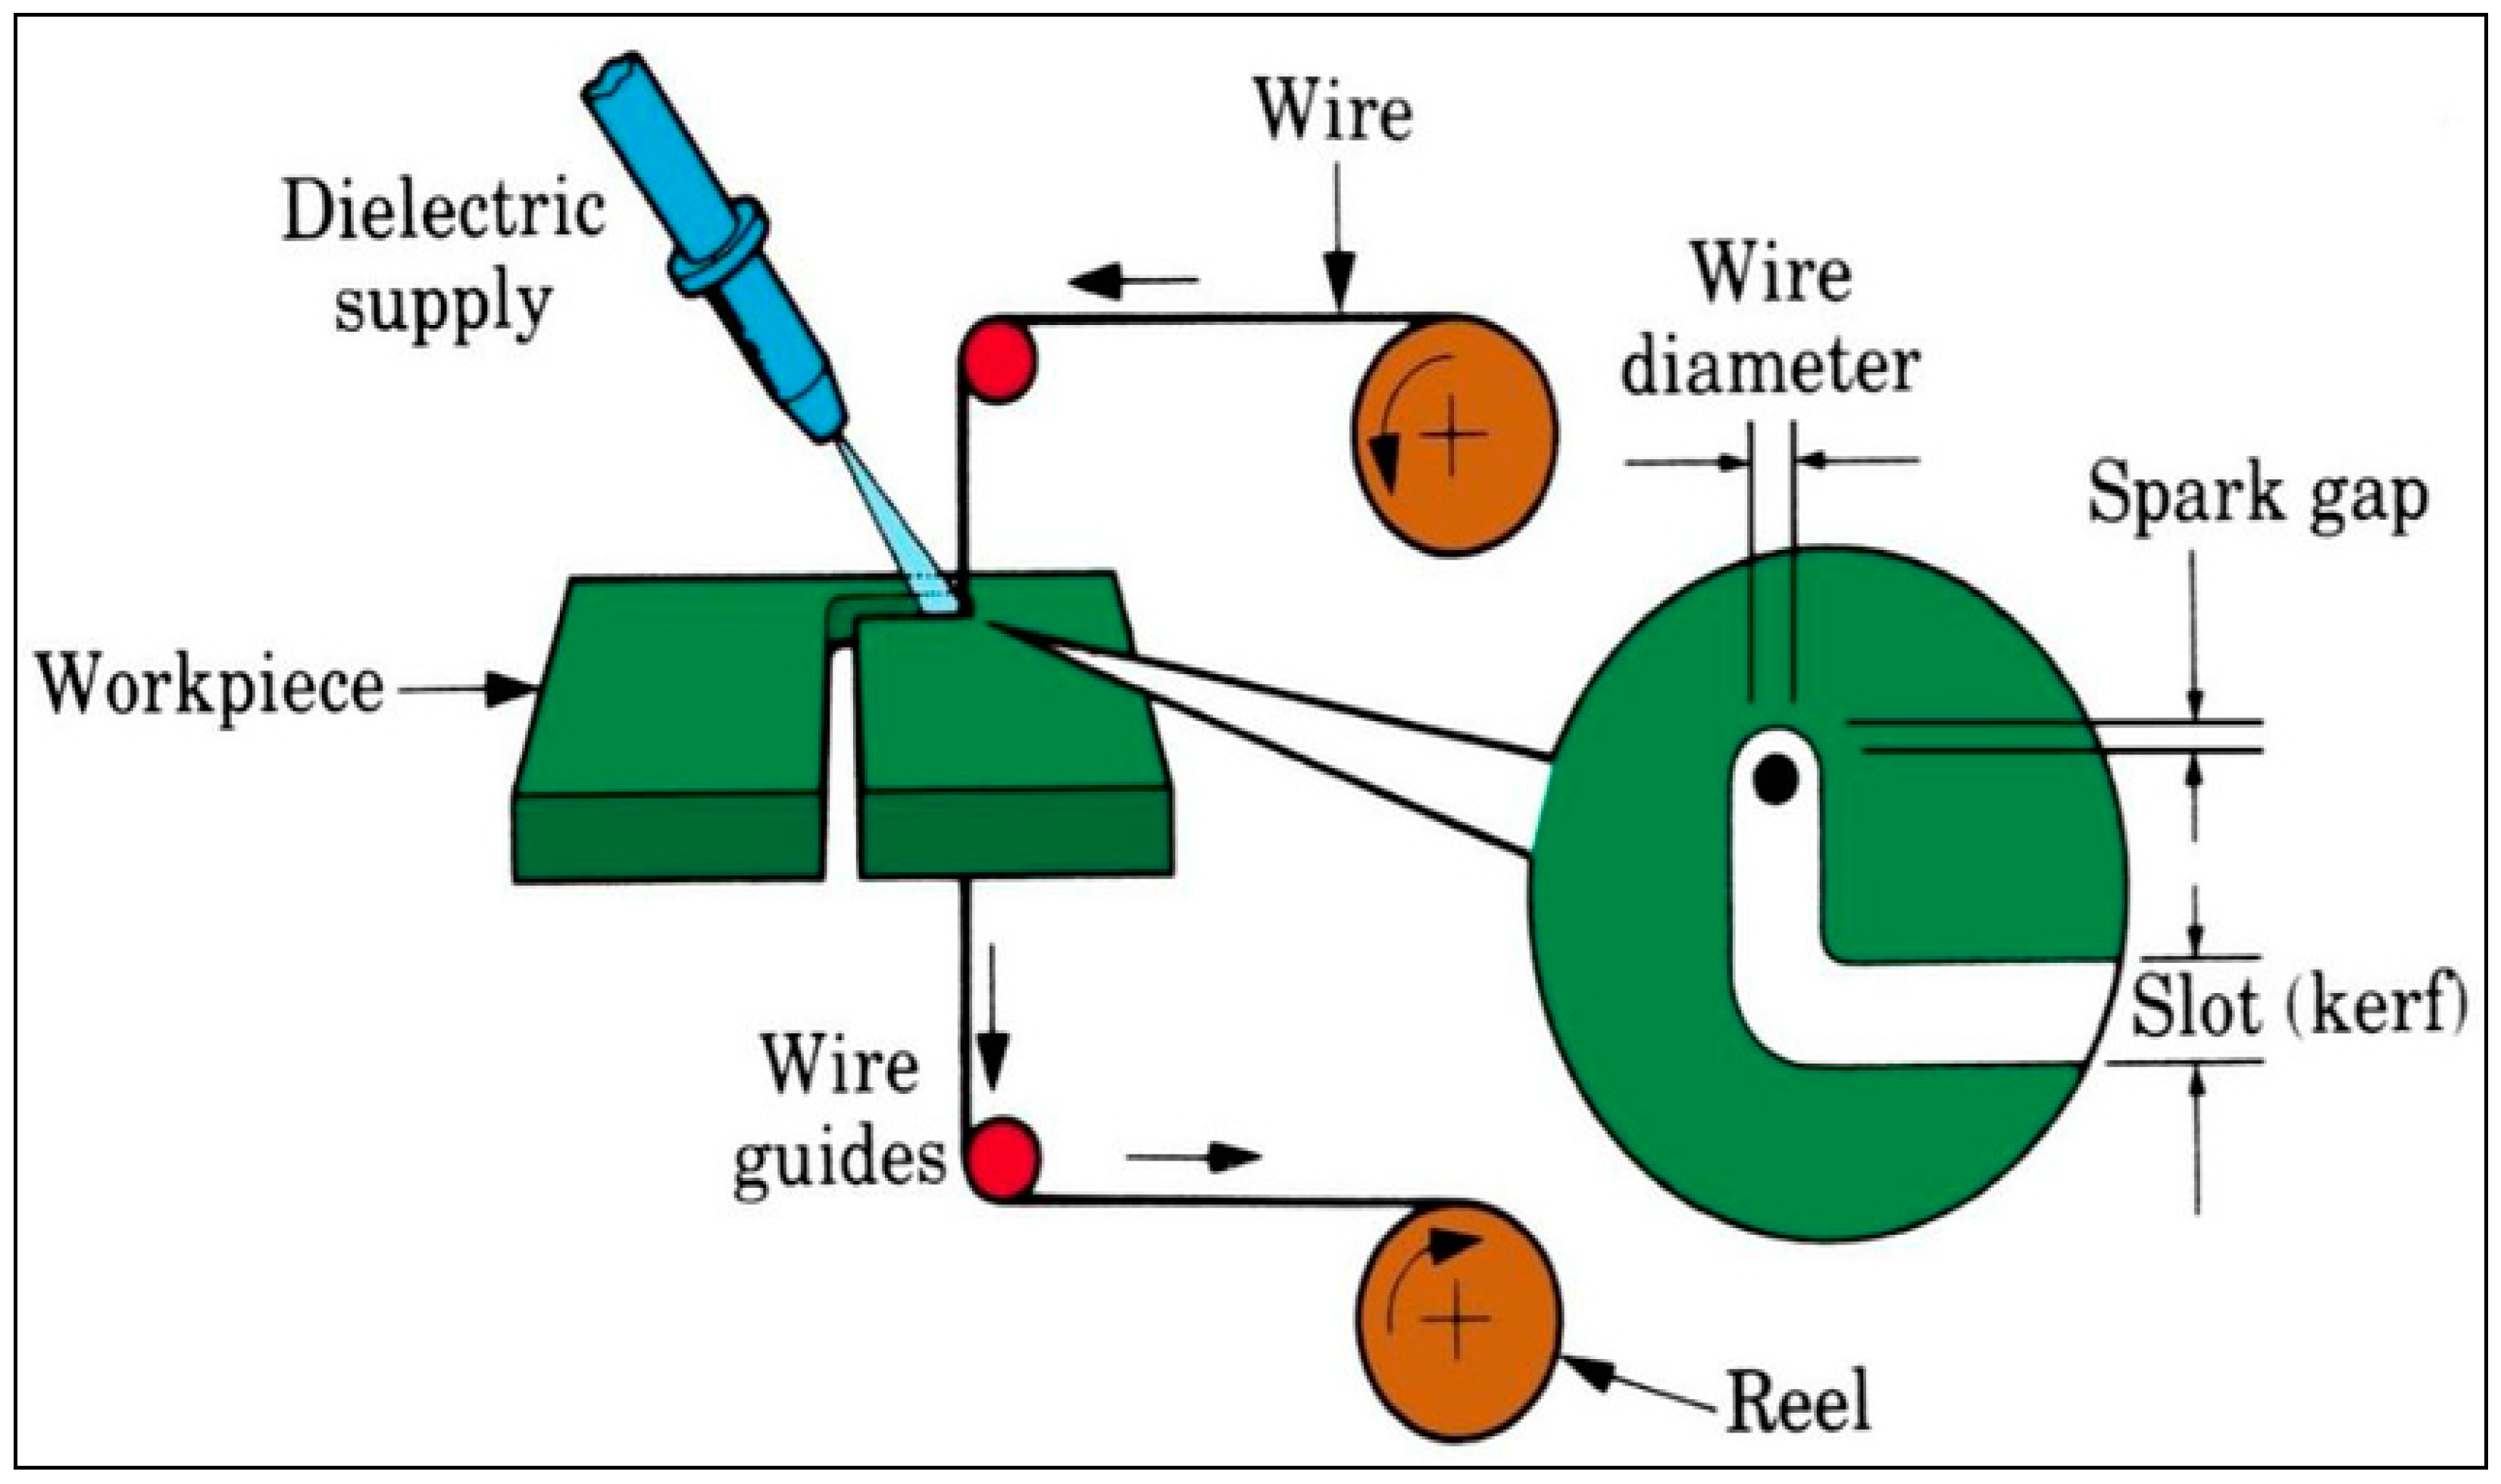
Figure 1. Schematic of Wire EDM.
Sustainability 15 10105 g001
Figure 2. Experimental setup for WEDM of Hastelloy C-276.
Sustainability 15 10105 g002
Figure 3. Process flow of the present study.
Sustainability 15 10105 g003
Figure 4. Sustainable manufacturing ring [39].
Sustainability 15 10105 g004
Figure 5. Structure of evolved neural network model.
Sustainability 15 10105 g005
Figure 6. Regression coefficient for the NN model.
Sustainability 15 10105 g006
Figure 7. Response analysis plot for MRR.
Sustainability 15 10105 g007
Figure 8. Response analysis plot for SR.
Sustainability 15 10105 g008
Figure 9. Response analysis plot for dimensional deviation.
Sustainability 15 10105 g009
Figure 10. Response plot for form tolerance error.
Sustainability 15 10105 g010
Figure 11. Response plot for orientation tolerance error.
Sustainability 15 10105 g011
Table 1. Process variables and levels.
SymbolsProcess VariablesLevels
123
AApplied Current (A)51015
BTon (µs)306090
CToff (µs)369
Table 2. ANN Network Structure Trails.
Trial NoStructureR Values
Training SetValidation SetTesting SetOverall
15-16-16-110.83980.90510.9715
25-16-20-119.98190.97390.9724
35-18-12-110.98890.99800.9979
45-18-14-110.99590.99800.9985
55-18-16-110.69580.95490.9264
65-18-18-110.99720.99520.9986
75-18-20-110.99510.92350.9804
85-20-12-110.99630.99520.9989
95-20-14-110.49500.929970.8562
105-20-16-110.99530.99790.9972
115-20-18-110.99980.99190.9981
125-20-20-110.98580.99560.9980
Table 3. ANOVA outcomes for chosen performance characteristics.
SourceDFSeq SSAdj SSAdj MSFP% Contribution
MRR (g/min)
Current (A)22.1490 × 10−32.1490 × 10−31.0750 × 10−33.8893 × 1020.0080.2465
Pulse On (µs)24.5100 × 10−44.5100 × 10−42.2600 × 10−48.16 × 1010.0016.8409
Pulse Off (µs)22.2700 × 10−52.2700 × 10−51.1300 × 10−54.10003.2000 × 10−20.8476
Error205.5300 × 10−55.5300 × 10−52.8000 × 10−6------2.065
Total262.6780 × 10−3------------100
SR (Ra) (microns)
Current (A)21.4876 × 10−11.4876 × 10−17.4381 × 10−24.8045 × 1020.0091.3862
Pulse On (µs)28.9190 × 10−38.9190 × 10−34.4590 × 10−32.8800 × 1010.005.479
Pulse Off (µs)22.0070 × 10−32.0070 × 10−31.0040 × 10−36.487.00 × 10−31.2329
Error203.0960 × 10−33.0960 × 10−31.5500 × 10−4------1.9019
Total260.162785------------100
DD (mm)
Current (A)21.95071.95079.7533 × 10−13.3418 × 1020.0081.7163
Pulse On (µs)23.4025 × 10−13.4025 × 10−11.7012 × 10−15.8290 × 1010.0014.2537
Pulse Off (µs)23.7830 × 10−23.7830 × 10−21.8920 × 10−26.4807.00 × 10−31.5848
Error205.8370 × 10−25.8370 × 10−22.9200 × 10−3------2.4452
Total262.3871------------100
Circularity error (mm)
Current (A)21.14341.14345.7170 × 10−11.9537 × 1020.0087.5297
Pulse On (µs)28.4200 × 10−28.4200 × 10−24.2100 × 10−21.4390 × 1010.006.4457
Pulse Off (µs)22.0100 × 10−22.0100 × 10−21.0100 × 10−23.44005.2000 × 10−21.5387
Error205.8500 × 10−25.8500 × 10−22.9000 × 10−3------4.5783
Total261.3063------------100
Perpendicularity error (mm)
Current (A)21.00561.00565.0280 × 10−11.5959 × 1020.0082.1837
Pulse On (µs)21.4090 × 10−11.4090 × 10−17.0500 × 10−22.2360 × 1010.0011.5152
Pulse Off (µs)21.4100 × 10−21.4100 × 10−27.1000 × 10−32.24001.33 × 10−11.1523
Error206.3000 × 10−26.3000 × 10−23.2000 × 10−3------5.1487
Total261.2236------------100
Table 4. Appraised GRC and GRG data.
GRG and GRG Values
MRRSRDDCircularity ErrorPerpendicularity ErrorGRGRank
0.33331.00000.44230.53790.50050.562816
0.33810.86670.43600.48570.50000.525320
0.34810.86670.42780.46060.49850.520321
0.36280.86670.42390.45960.44020.510622
0.36920.86670.42320.44430.43660.508023
0.38590.81250.42250.43430.43330.497724
0.39150.76470.37810.42050.43260.477525
0.39480.76470.35660.39230.34430.450626
0.39730.72220.33330.33330.33330.423927
0.40410.72220.60280.74400.78710.652010
0.40930.68420.57340.73720.74830.630511
0.41470.56520.50050.72250.74560.589712
0.43090.56520.48520.72050.73250.586913
0.44200.56520.47980.71550.69740.580014
0.44930.56520.46960.67750.67710.567715
0.49540.54170.45800.65920.60970.552817
0.51710.54170.45780.63790.58030.547018
0.53020.52000.44790.63650.53790.534519
0.53930.46431.00001.00001.00000.80071
0.54560.40630.95460.96730.99420.77362
0.55690.39390.85330.95200.97110.74543
0.57730.39390.77130.92700.91270.71644
0.58450.39390.73800.92610.89040.70665
0.59750.39390.66120.90660.83560.67909
0.74950.37140.65610.88710.81870.69666
0.86670.35140.62660.81250.81620.69477
1.00000.33330.54920.78170.79320.69158
Table 5. Performance analysis on evolved models.
Performance MeasuresValues
MAPE0.6263
RMSE0.0086
MAE6.263 × 10−3
Correlation Coefficient0.9981
Table 6. Comparison of appraised and predicted GRG values.
S. NoGRG Values
EstimatedForetold
10.56280.5628
20.52530.5253
30.52030.5240
40.51060.5106
50.50800.5108
60.49770.4977
70.47750.4660
80.45060.4506
90.42390.4239
100.65200.652
110.63050.6305
120.58970.5897
130.58690.5869
140.58000.5723
150.56770.5677
160.55280.5487
170.54700.5470
180.53450.5662
190.80070.7775
200.77360.7736
210.74540.7454
220.71640.7164
230.70660.7066
240.67900.6943
250.69660.6966
260.69470.6947
270.69150.6915
Disclaimer/Publisher’s Note: The statements, opinions and data contained in all publications are solely those of the individual author(s) and contributor(s) and not of MDPI and/or the editor(s). MDPI and/or the editor(s) disclaim responsibility for any injury to people or property resulting from any ideas, methods, instructions or products referred to in the content.