1. Introduction
In the nuclear and aeronautical industries, superalloys are generally used for various parts due to their characteristics. These materials are incredibly hard to machine due to how strong and hard they are. They also have lower thermal conductivity. Due to their exceptional properties, the machining of these materials has become more difficult and complex, especially when making intricate components [
1,
2,
3,
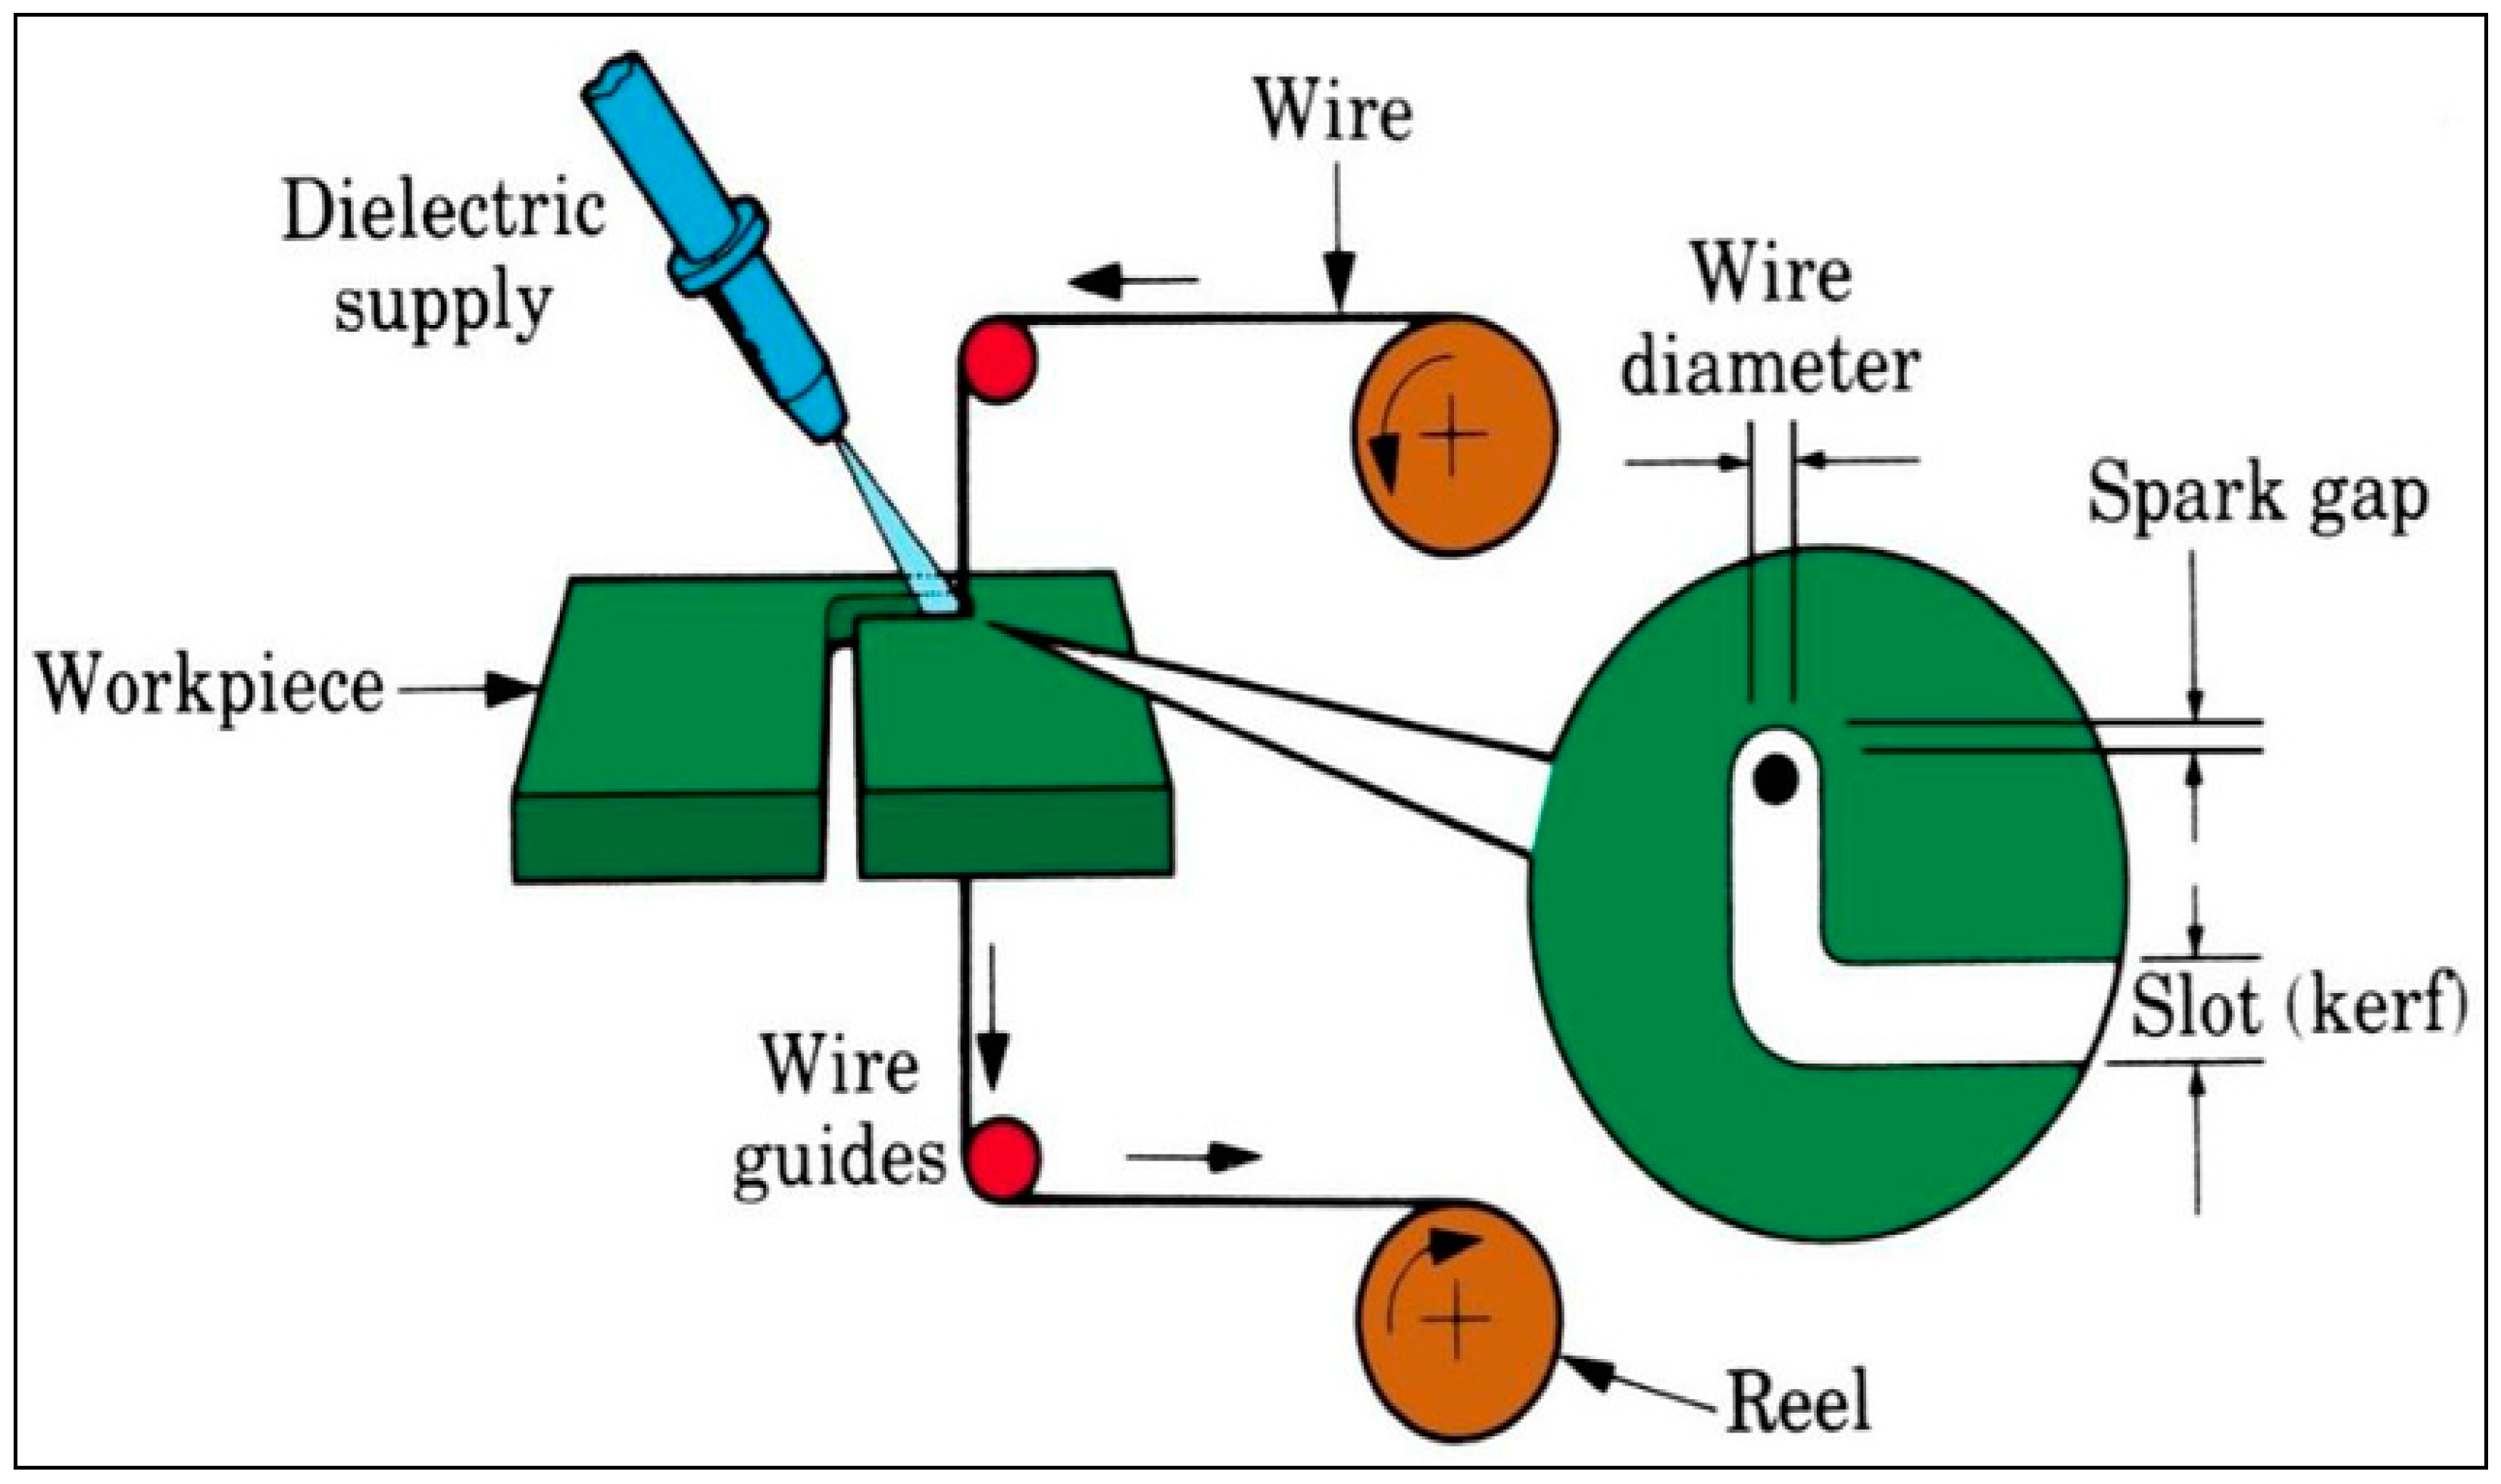
4]. It is therefore imperative to evolve processes that can efficiently and effectively machine these materials. One of these is Wire Electrical Discharge Machining (WEDM). It is a noncontact machining process which operates by moving the wire electrode continuously. During the process, the work piece carries the opposite side of an electrical charge, and the wire carries one side of the charge. When the wire is brought into close proximity to the component, the attraction of electrical charge causes a controlled spark to occur. This spark causes material particles to melt and vaporize [
5,
6]. The outline of WEDM is represented in
Figure 1.
The process of WEDM involves creating intricate components for aerospace and automotive industries. When sparks are discharged from the sources, dielectric medium can enter the work surface and remove materials [
7,
8]. The wire electrode is moved from the far end of the space among the work material and the tool to the far end. The dielectric fluid then ionizes and separates the two components. The action of the ionization allows the material to be easily removed. This process, which is also called spark erosion, can be used to remove various materials, such as those used in the production of complex components [
9,
10,
11,
12,
13,
14]. For making the process sustainable, an uninterrupted machining is needed to reduce the time and energy consumed during the machining. Understanding the parameters and methods which contribute to make WEDM sustainable is much-needed. Various researchers have analyzed the need for and importance of sustainable WEDM for various hard materials. Improved machining rates will be helpful for reducing time consumption for machining, which results in reduced power consumption. The reduced consumption of power utilization is deemed to decrease the negative impact on the environment and the machine setup, too. The functionality of mechanical parts can be affected by the surface roughness of those parts, which is an important indicator of product quality. In addition, it has an interlink on thermal properties, electrical properties, geometric tolerance, ease of holding lubricants, and many other aspects of mechanical parts that are not listed here. During the manufacturing process, the surface roughness is established by a variety of distinct machining parameters. These parameters can be found in the
Table 1. For instance, during the turning operation, the surface roughness is largely determined not only by the factors that are used for machining but also by the mechanical properties of the material that is being matched. The surface that is being produced is very sensitive to even the smallest shift in parameters or factors that have been stated. In addition, it should be pointed out that the surface roughness is the machining parameter that is given the utmost attention, followed closely by the rate at which material is removed [
15,
16,
17,
18].
Previous researchers proposed the Grey system theory to deal with ambiguity and incomplete data in a process. The problems that can arise with MCDM are solved by GRA by condensing the wide variety of performance attribute values that are considered for each alternative into a single, unified value. This results in the original problem becoming a problem involving the decision of a single attribute. After going through the GRA process, it will be much simpler to compare different options that have multiple attributes. The method utilized by the remaining MCDM approaches is very much like the method utilized in the process of combining attribute values into a single value [
19]. It has been shown to be a successful method for determining the various performance characteristics of various types of machining. This process incorporates many Multi-Criteria Decision Making (MCDM) methods such as the Grey system approach [
20,
21]. Despite its numerous benefits, the Grey Relational Analysis (GRA) approach has restrictions when it comes to analyzing the output variables. Researchers can improve the yield of the machining process by using the Grey fuzzy method, which is very useful in developing accurate and efficient machining techniques. Optimization plays a major role in any kind of manufacturing processes, and further development of these techniques may lead to advanced manufacturing methods, such as additive manufacturing and processing techniques [
22,
23,
24,
25,
26]. The Grey theory can be used to improve the performance of various decision-making tools. The use of intelligent tools for forecasting performance attributes can help improve the efficiency of the manufacturing process [
27]. The manufacturers can now forecast necessary output parameters of their products thanks to the usage of Artificial Neural Network (ANN) in modeling [
28,
29]. A few researchers used various neural network techniques to develop competent models for the prophecy of process parameter errors in the machining process. The outcomes of these models were then compared with the previous literature. Previous research has revealed that Artificial Neural Network (ANN) can be engaged to foretell the chosen output variables. The convergence of multiple algorithms was observed [
30,
31,
32,
33,
34,
35]. The Multi-Response Grey Relation Analysis approach may be used to improve the process parameters [
36]. The findings of this study may be used to manufacture hard materials in a high-precision WEDM for a variety of needs [
37]. The form/orientation and shape of a machined surface are two factors that influence a product’s quality and mechanical design. The efficiency and effectiveness of measuring various process variables related to the manufacture of electronic components are frequently overlooked.
According to the literature, there has been little research into the optimization of these factors using a Grey-based ANN method, particularly in the context of sustainable machining. This research article aims to provide a comprehensive analysis of multiple performance measures for the WEDM process, including Material Removal Rate (MRR), Surface Roughness (SR), Dimensional Deviation (DD), and circularity and perpendicularity error. The Grey system theory is adopted to estimate the Grey Relational Coefficient (GRC) values. The data were then engaged to train the ANN model, which is a multi-aspects optimization model. In this article, an endeavor is made to evolve the model by incorporating the ANN model to consider multiple aspects.
2. Materials and Methods
The experimental runs were carried out on a WEDM machine, which is known as the Concord-made Model DK 7732. The tool was made using a reusable wire and a dielectric liquid, which was deionized water. The Hastelloy C-276 was utilized as the work material. With the help of clamps, the specimens were held inside a machine chamber. The number of experiments executed was increased by opting for various process parameters and levels.
For making a better design layout, Taguchi proposed the use of an experimental design known as the Orthogonal Array (OA). This method involved running experiments on a limited number of parameters in order to analyze them in a more efficient manner. The three input factors that were adopted in the design were the period of pulse on/off and the current. The various output parameters used in the process of machining are analyzed in order to ascertain the optimal approach for extracting Hastelloy. The levels and parameters that were selected were then compared with those specified by the L27 OA.
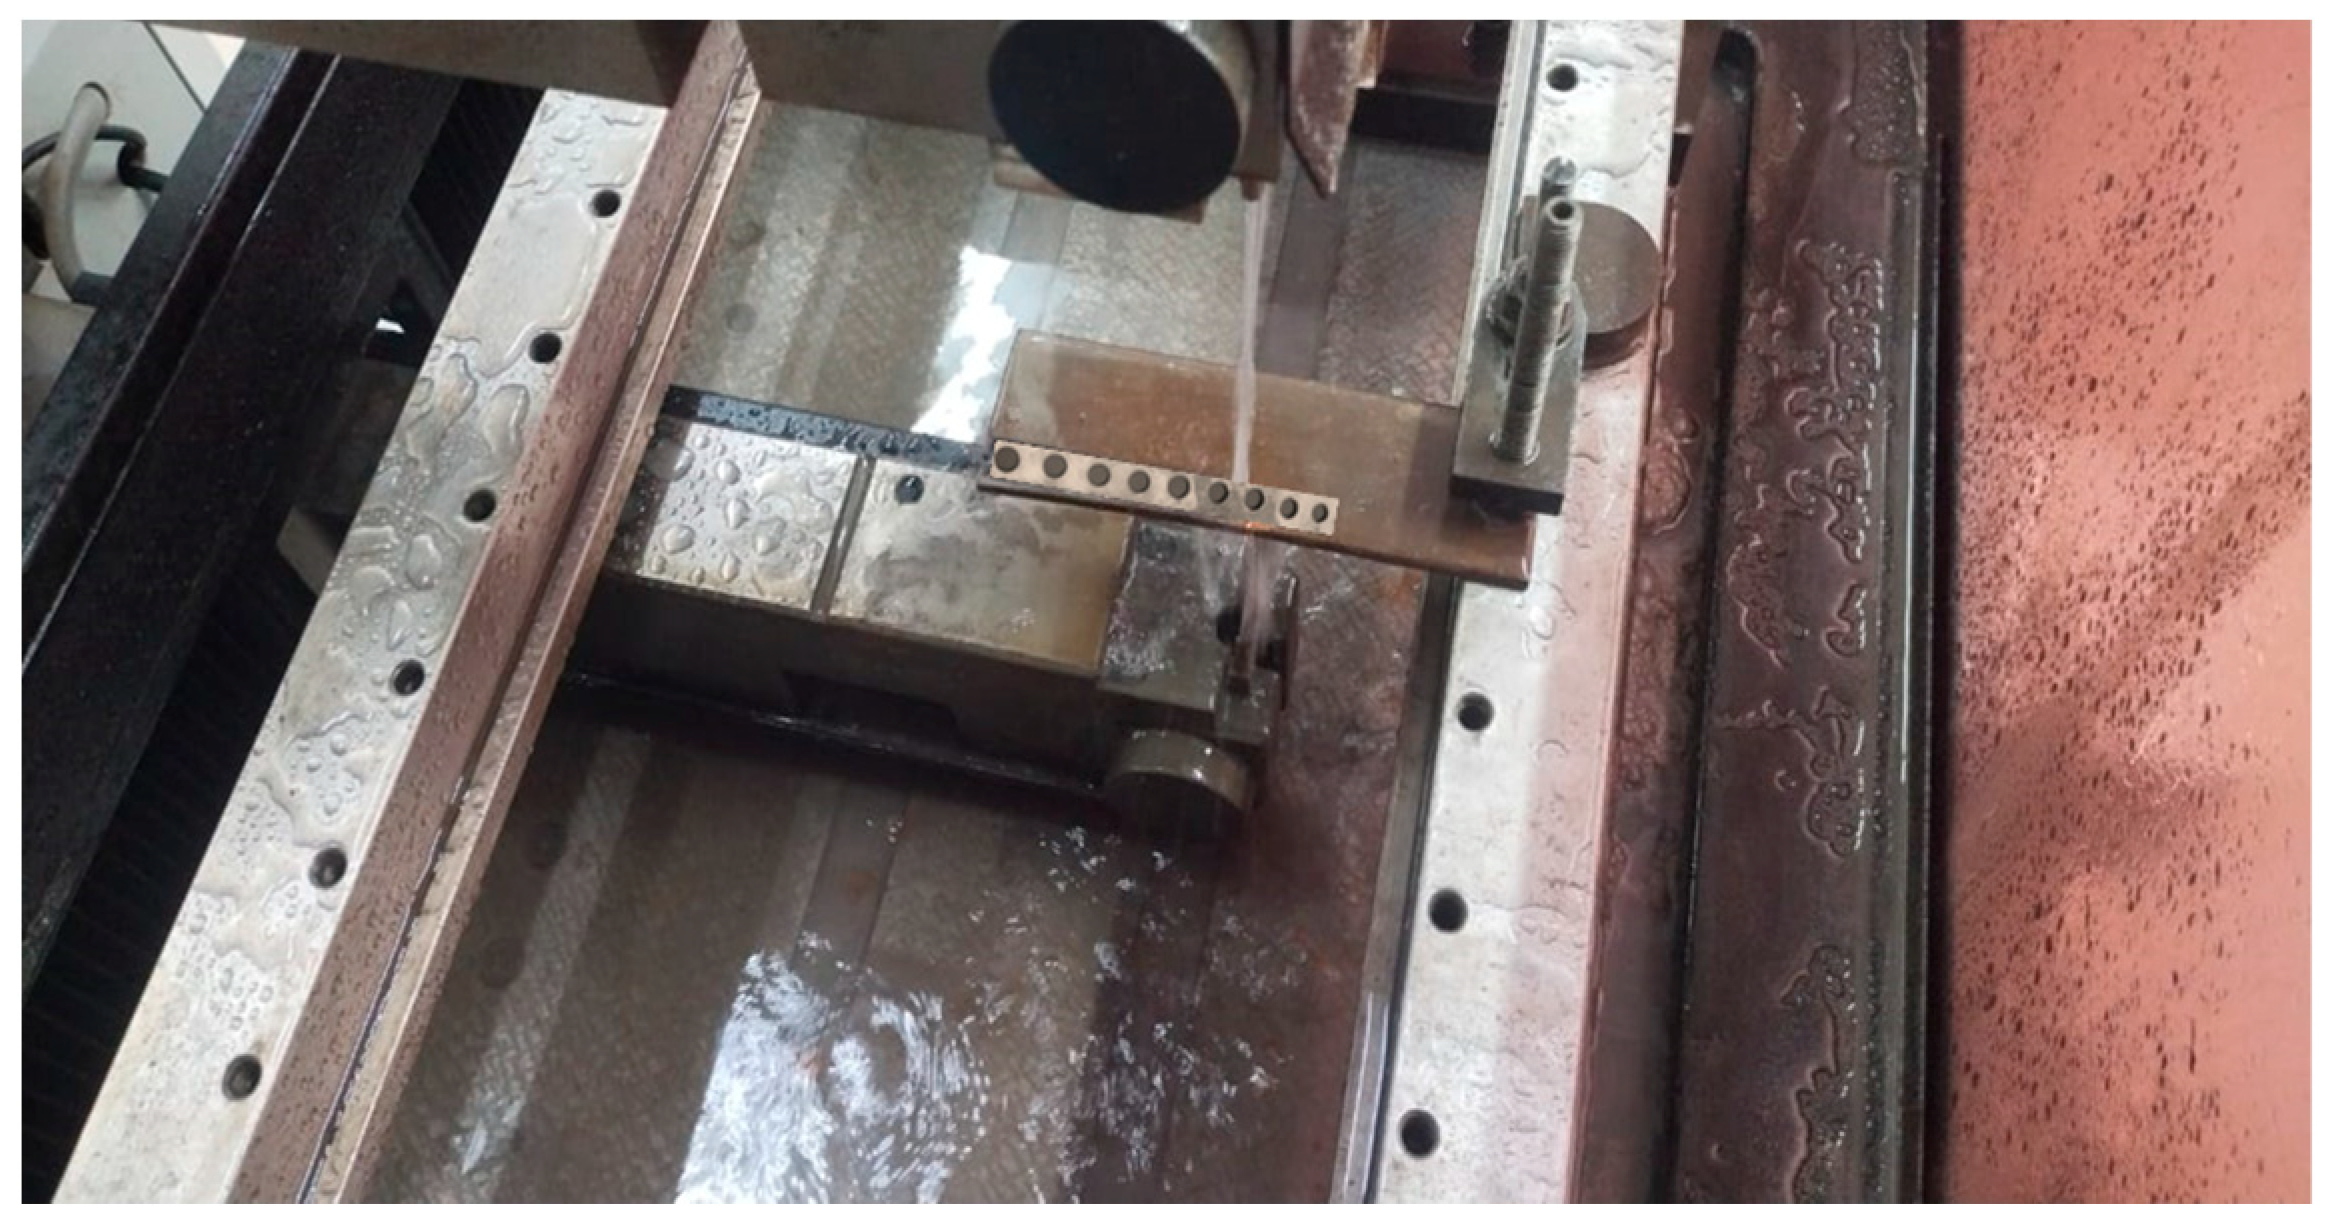
The weight loss approach is utilized during the process of cutting to estimate the removal rate of certain materials. After the operation, the Mitutoyo SJ-411 Surface Roughness Tester is adopted to calculate the surface roughness. The orientation, form, and overcut tolerance are also taken into account using a Helmel-made Coordinate Measuring Machine (CMM). The arrangement shown in
Figure 2 is an experimental setup for machine tools. Experiments were performed according to L27 OA, with the outcomes recorded to carry out further analysis.
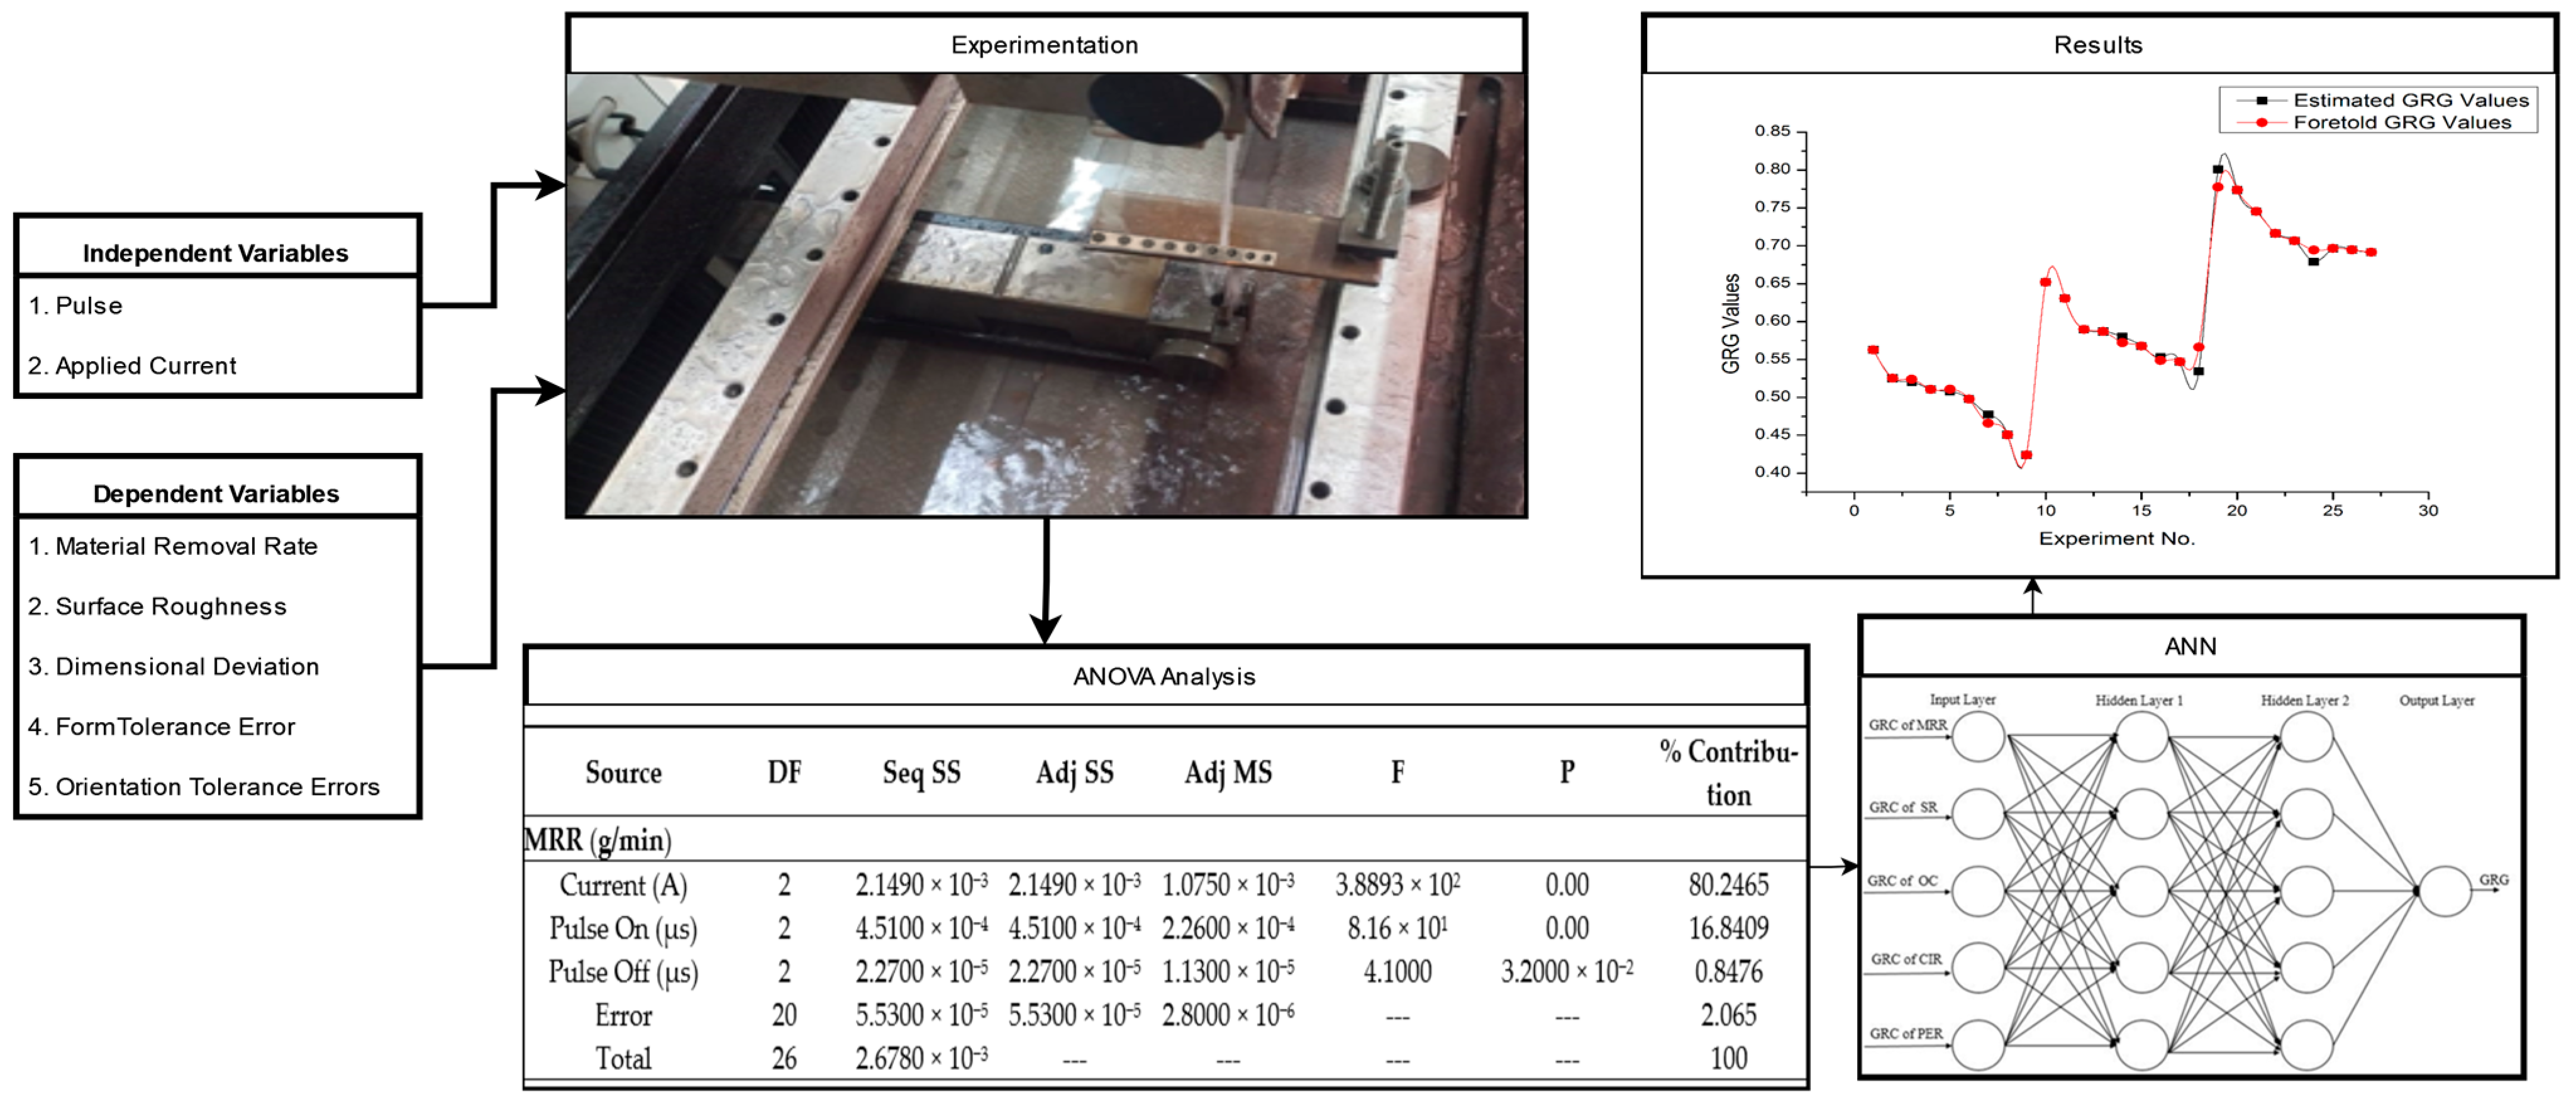
Figure 3 depicts the process flow of present study.
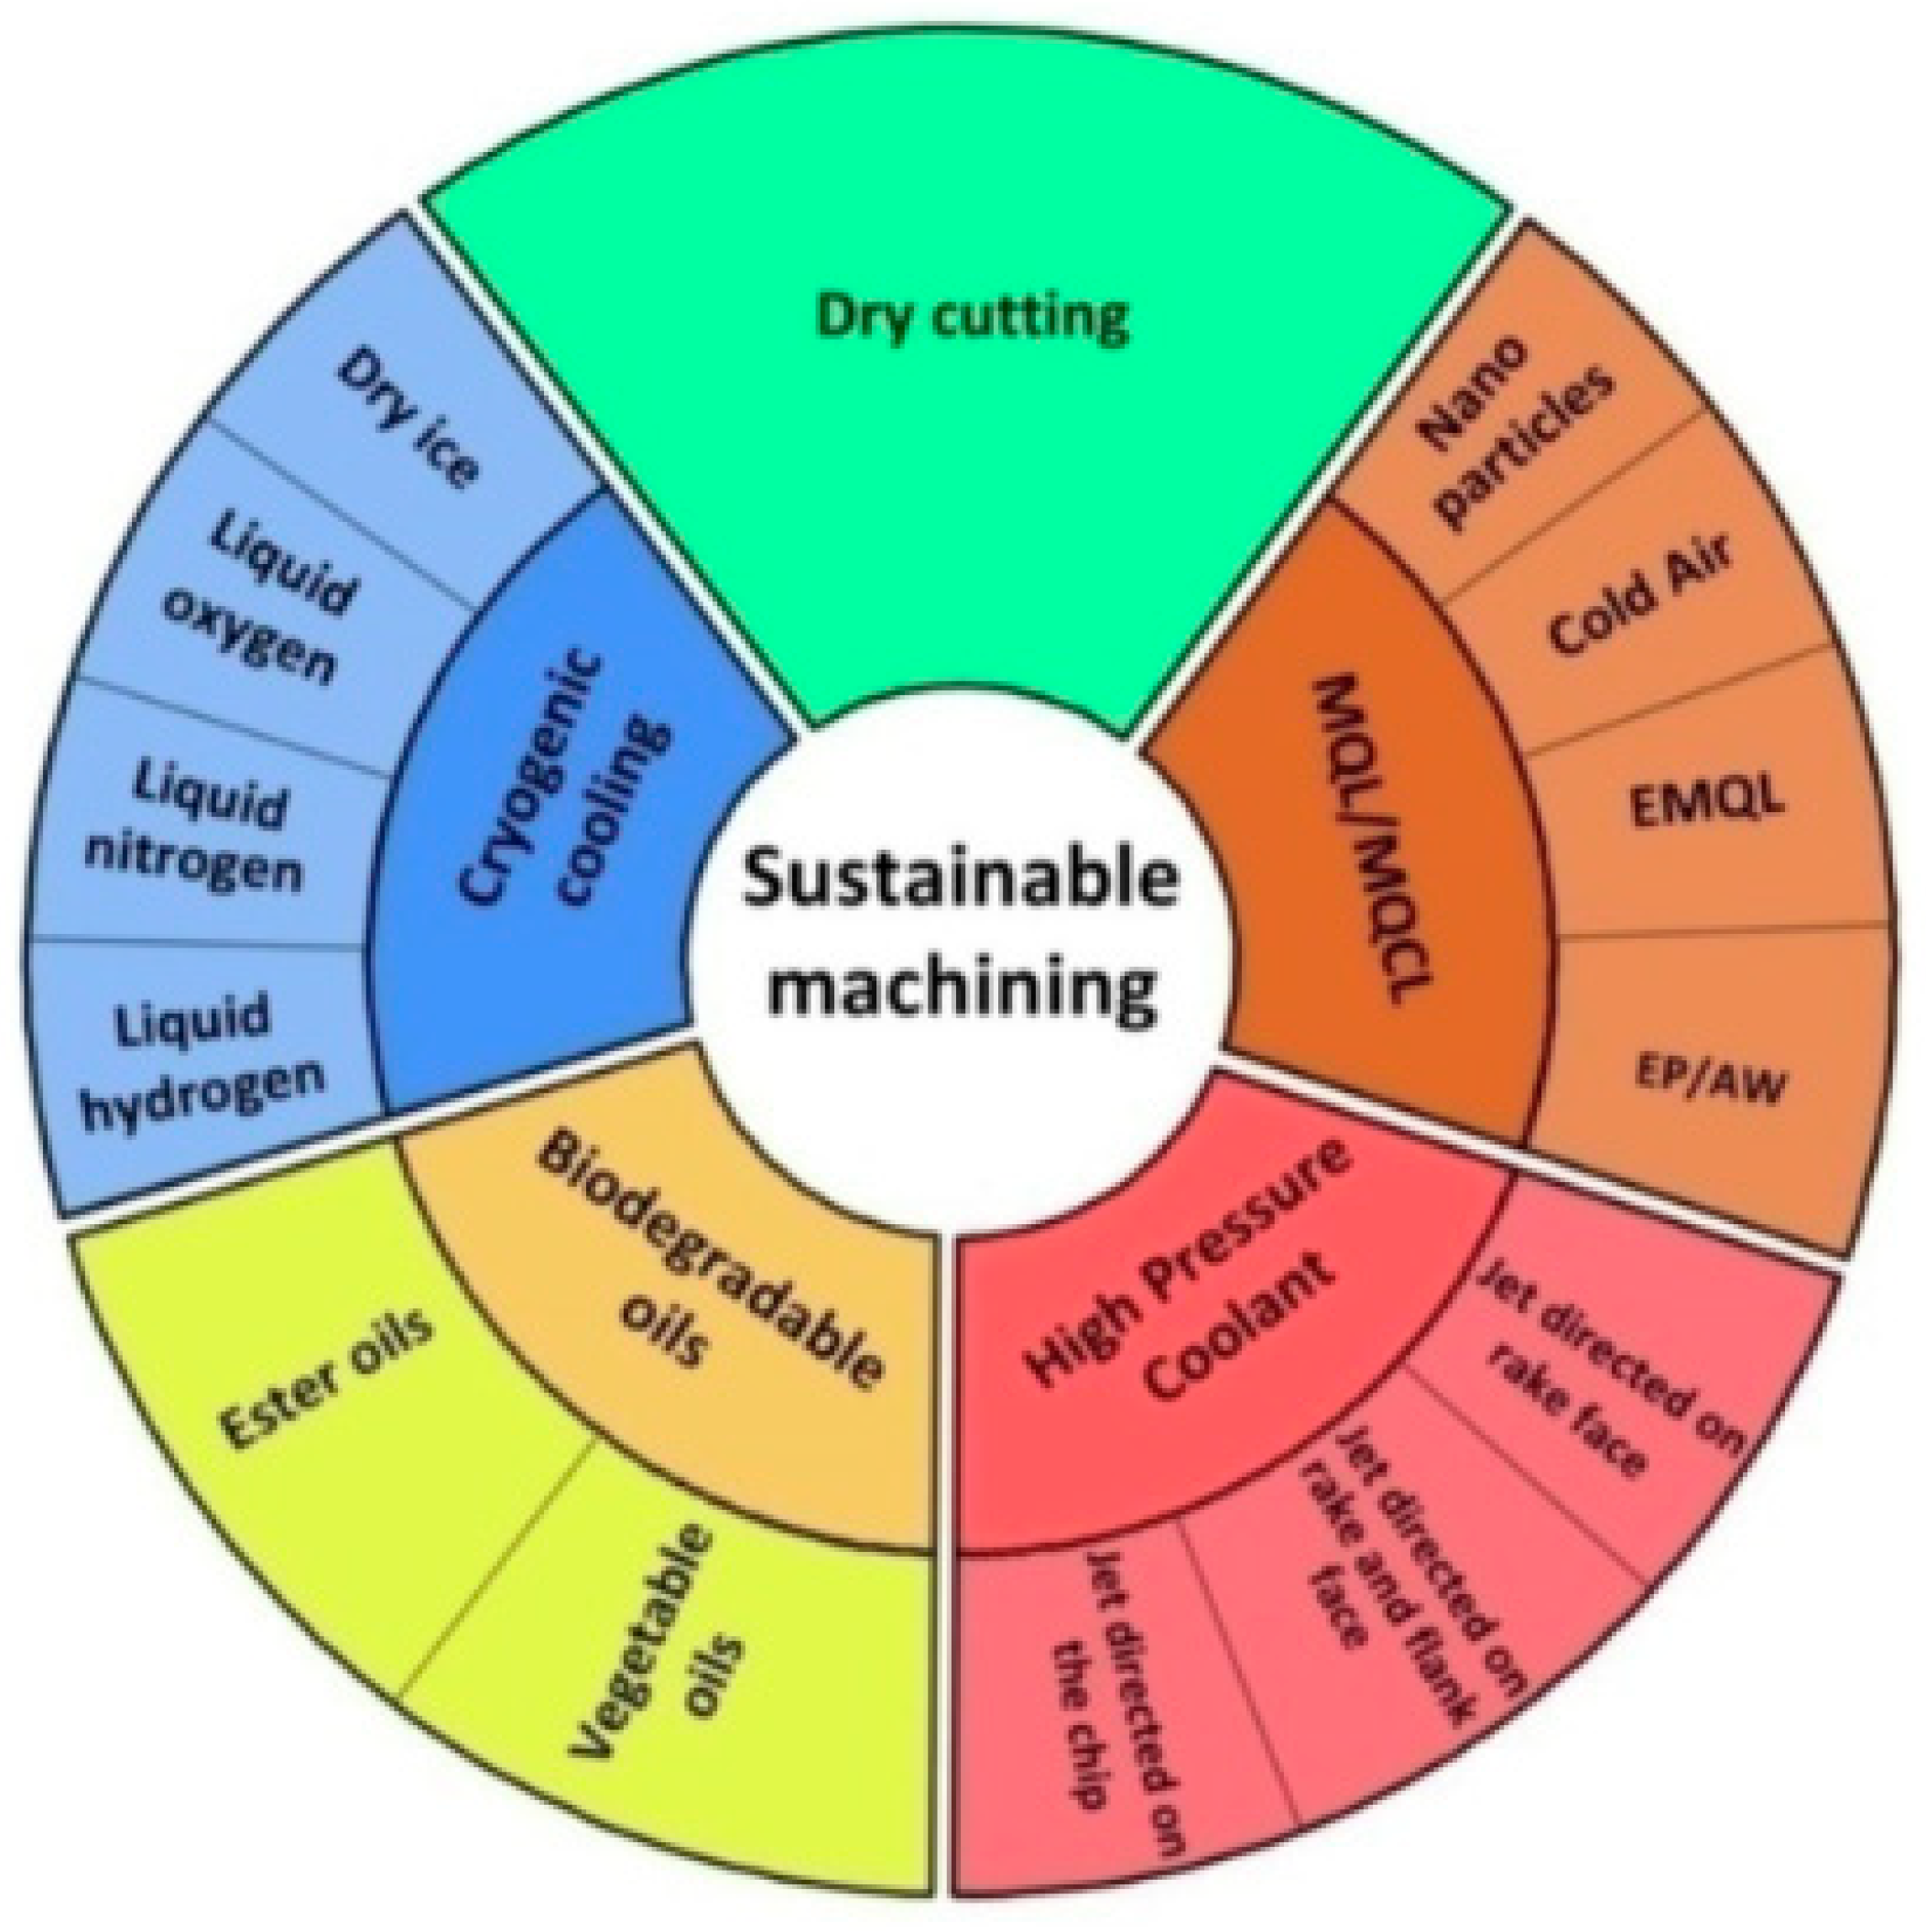
Sustainability-related manufacturing concepts emerged around 2010 and have diverse levels of promise. Waste reduction is a fundamental tenet of lean manufacturing, the 3 Rs of green manufacturing and the 6 Rs of sustainable manufacturing being the most forward-thinking of these ideas. The 3 R idea, which stands for “reduce, reuse, and recycle”, and the 6 R concept, which stands for “reduce, reuse, recover, redesign, remanufacture, and recycle”, are two of the most often utilized concepts in the effort to build a greener approach to manufacturing [
38]. However, a new component that might be otherwise termed as “ecological elements”, calls for special attention in the form of natural interventions, human workers’ welfare, and financial stability of manufacturing [
39]. Sustainable production relies heavily on high-efficiency processes that use less energy [
40]. The ring of sustainable machining (
Figure 4) characterizes highly efficient manufacturing solutions, while simultaneously minimizing their influence on the ecosystem [
39].
Development of Anticipated Grey ANN Model
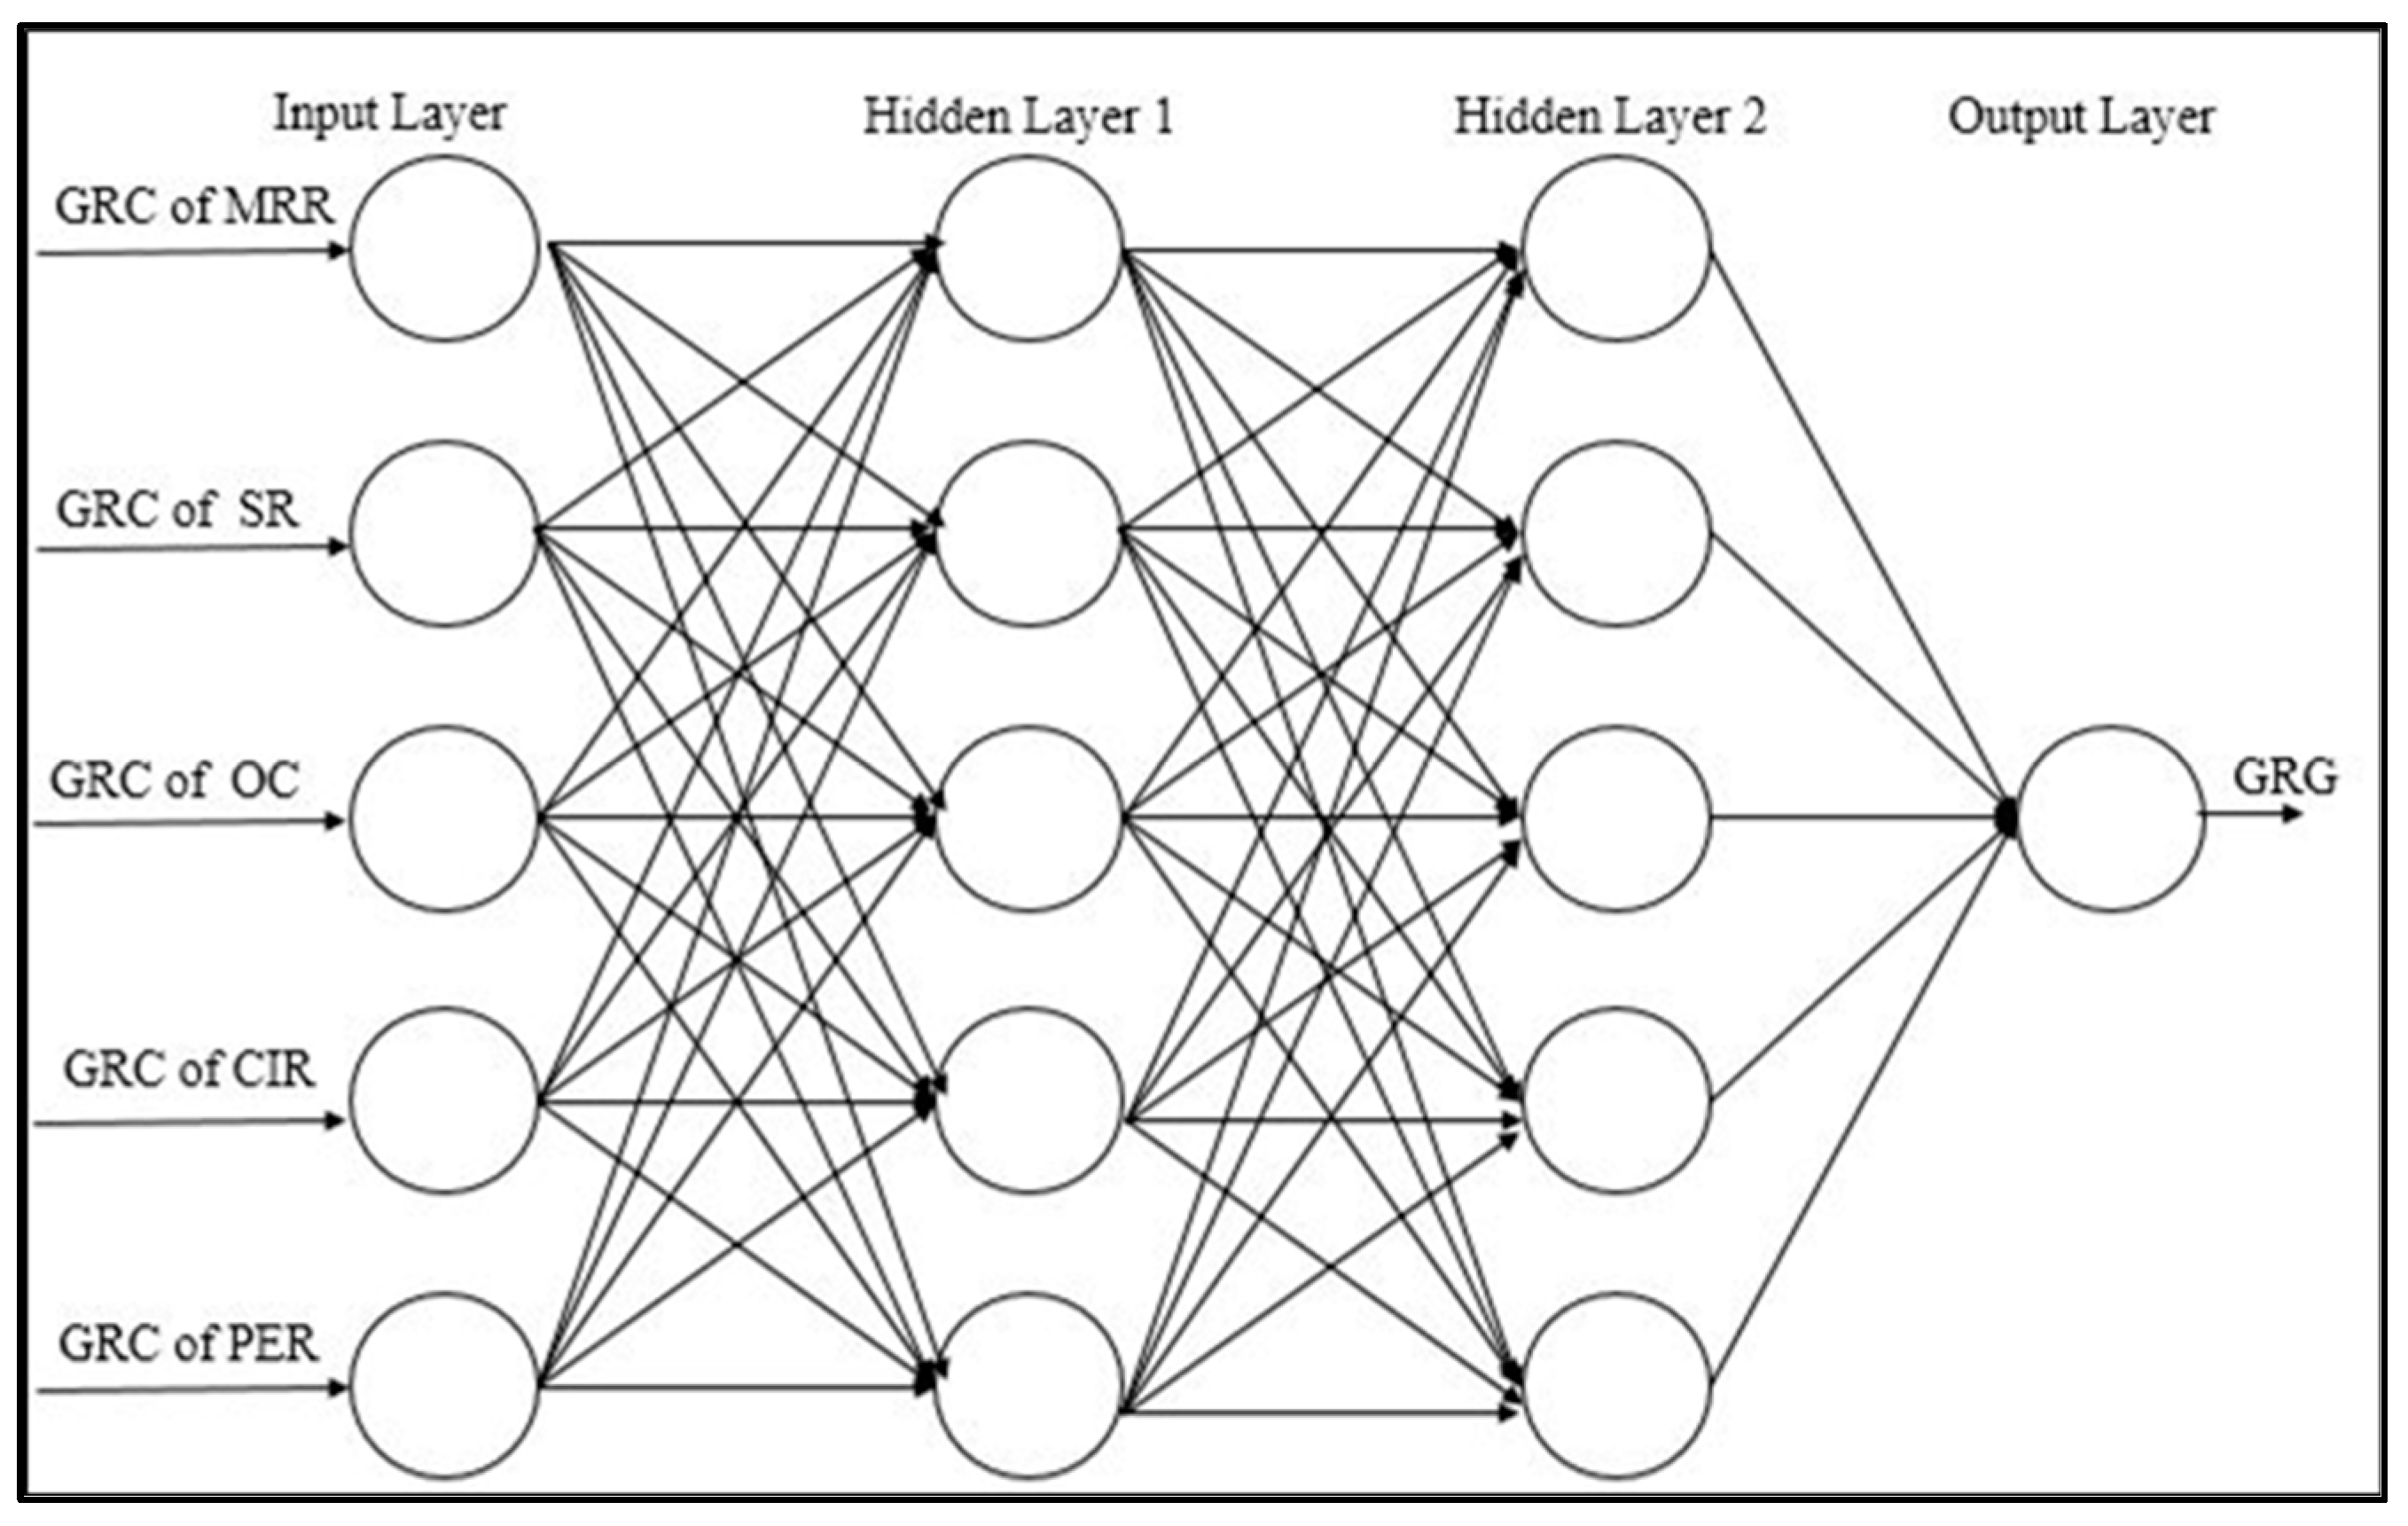
Artificial intelligence has greatly impacted the field of engineering, allowing scientists to create efficient and effective procedures and models for governing various processes. One of the most critical variables that can be deemed while optimizing a process is its accurateness. Various researchers developed statistical models with the help of ANNs, which can be utilized to study various nonlinear and linear problems in engineering disciplines. One of the benefits of adopting ANNs is their comfort in generating NN models using the tools in the MATLAB 2023a software.
The model has five input layers and a single output neuron. The quantity of concealed neurons and layers in the network was ascertained by performing a trial-based procedure.
Figure 5 displays the evolution of the ANN structure for predicting the Grey Relational Grade (GRG).
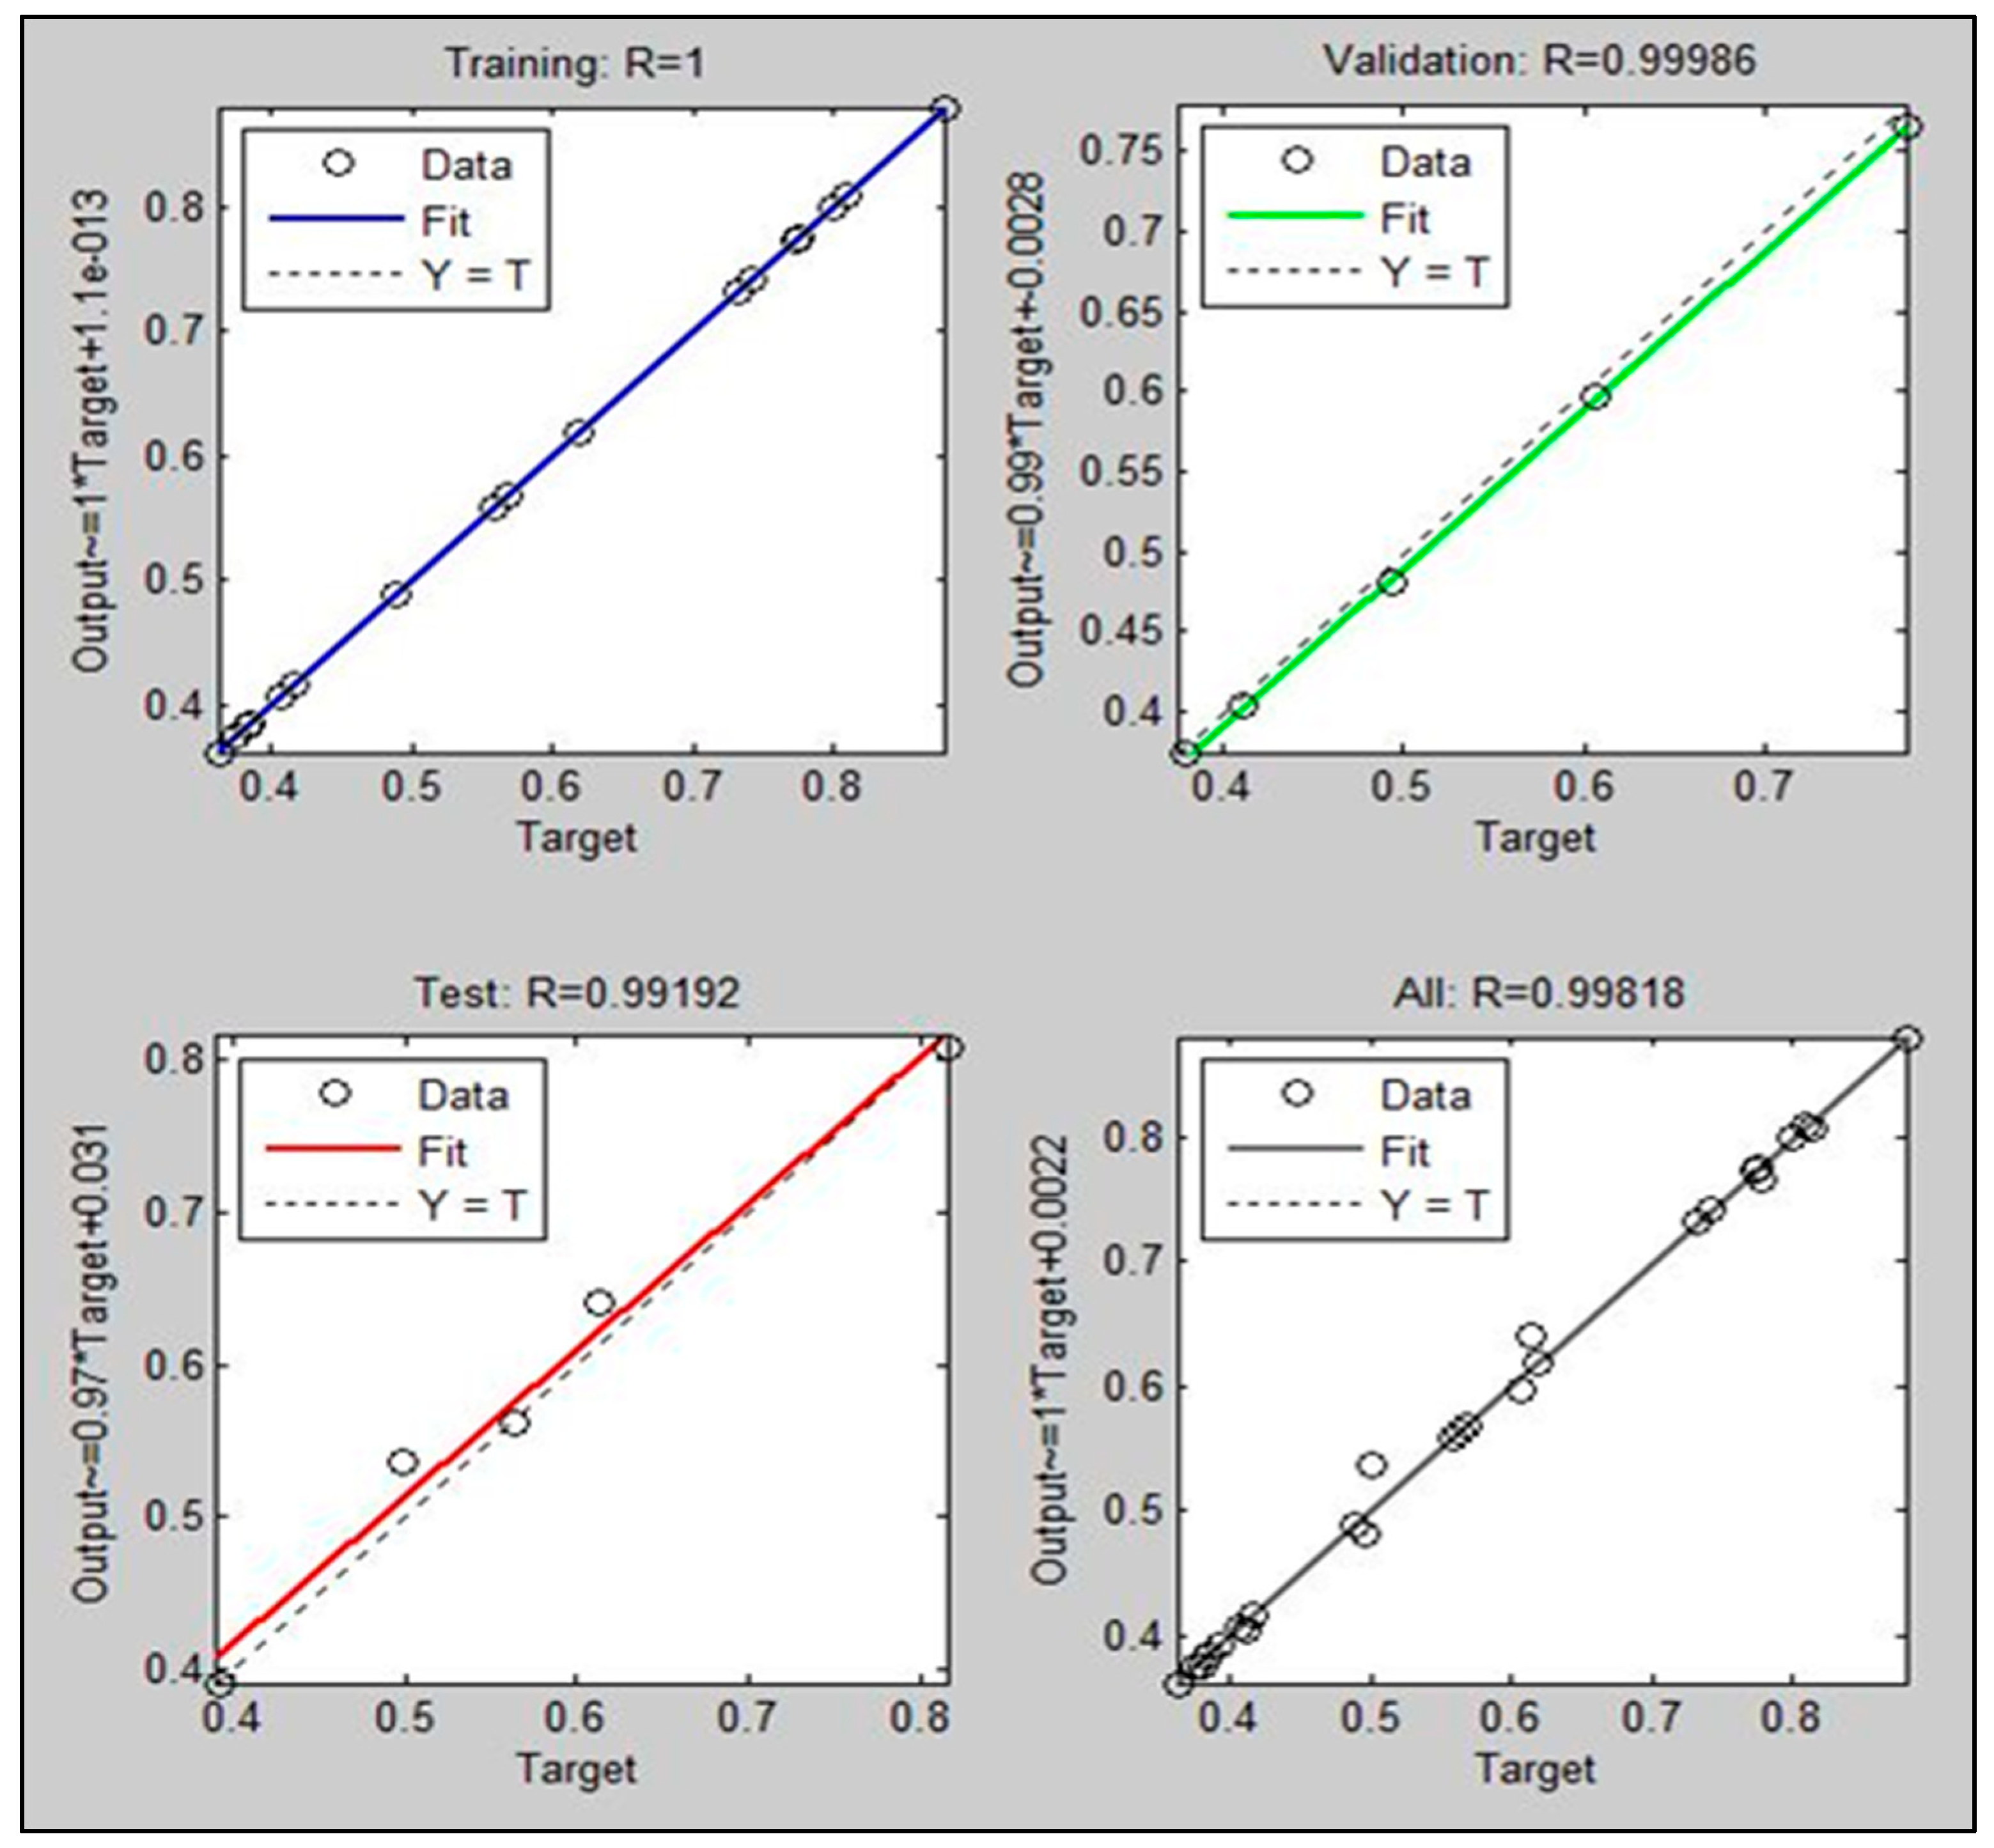
One of the most crucial variables that can be identified when it comes to predicting a process’ accuracy is training performance characteristics. This paper provides a framework that enables the training of a feed-forward backpropagation model using an algorithm-based network. The goal of this study is to perform a series of tests to find the best correlation coefficients for various network architectures. The outcomes of these are portrayed in
Table 2. For the multiple-layer structure (5-20-18-1), the mean correlation coefficient is 0.9981, as represented in
Figure 6.
3. Results and Discussions
This section explores the idea of variance analysis for the sustainable WEDM process for Hastelloy C276 with the aid ANOVA and the Taguchi Grey method. It also discusses the variables that can influence the multiple attributes of the process.
3.1. Optimization of Material Removal Rate (MRR)
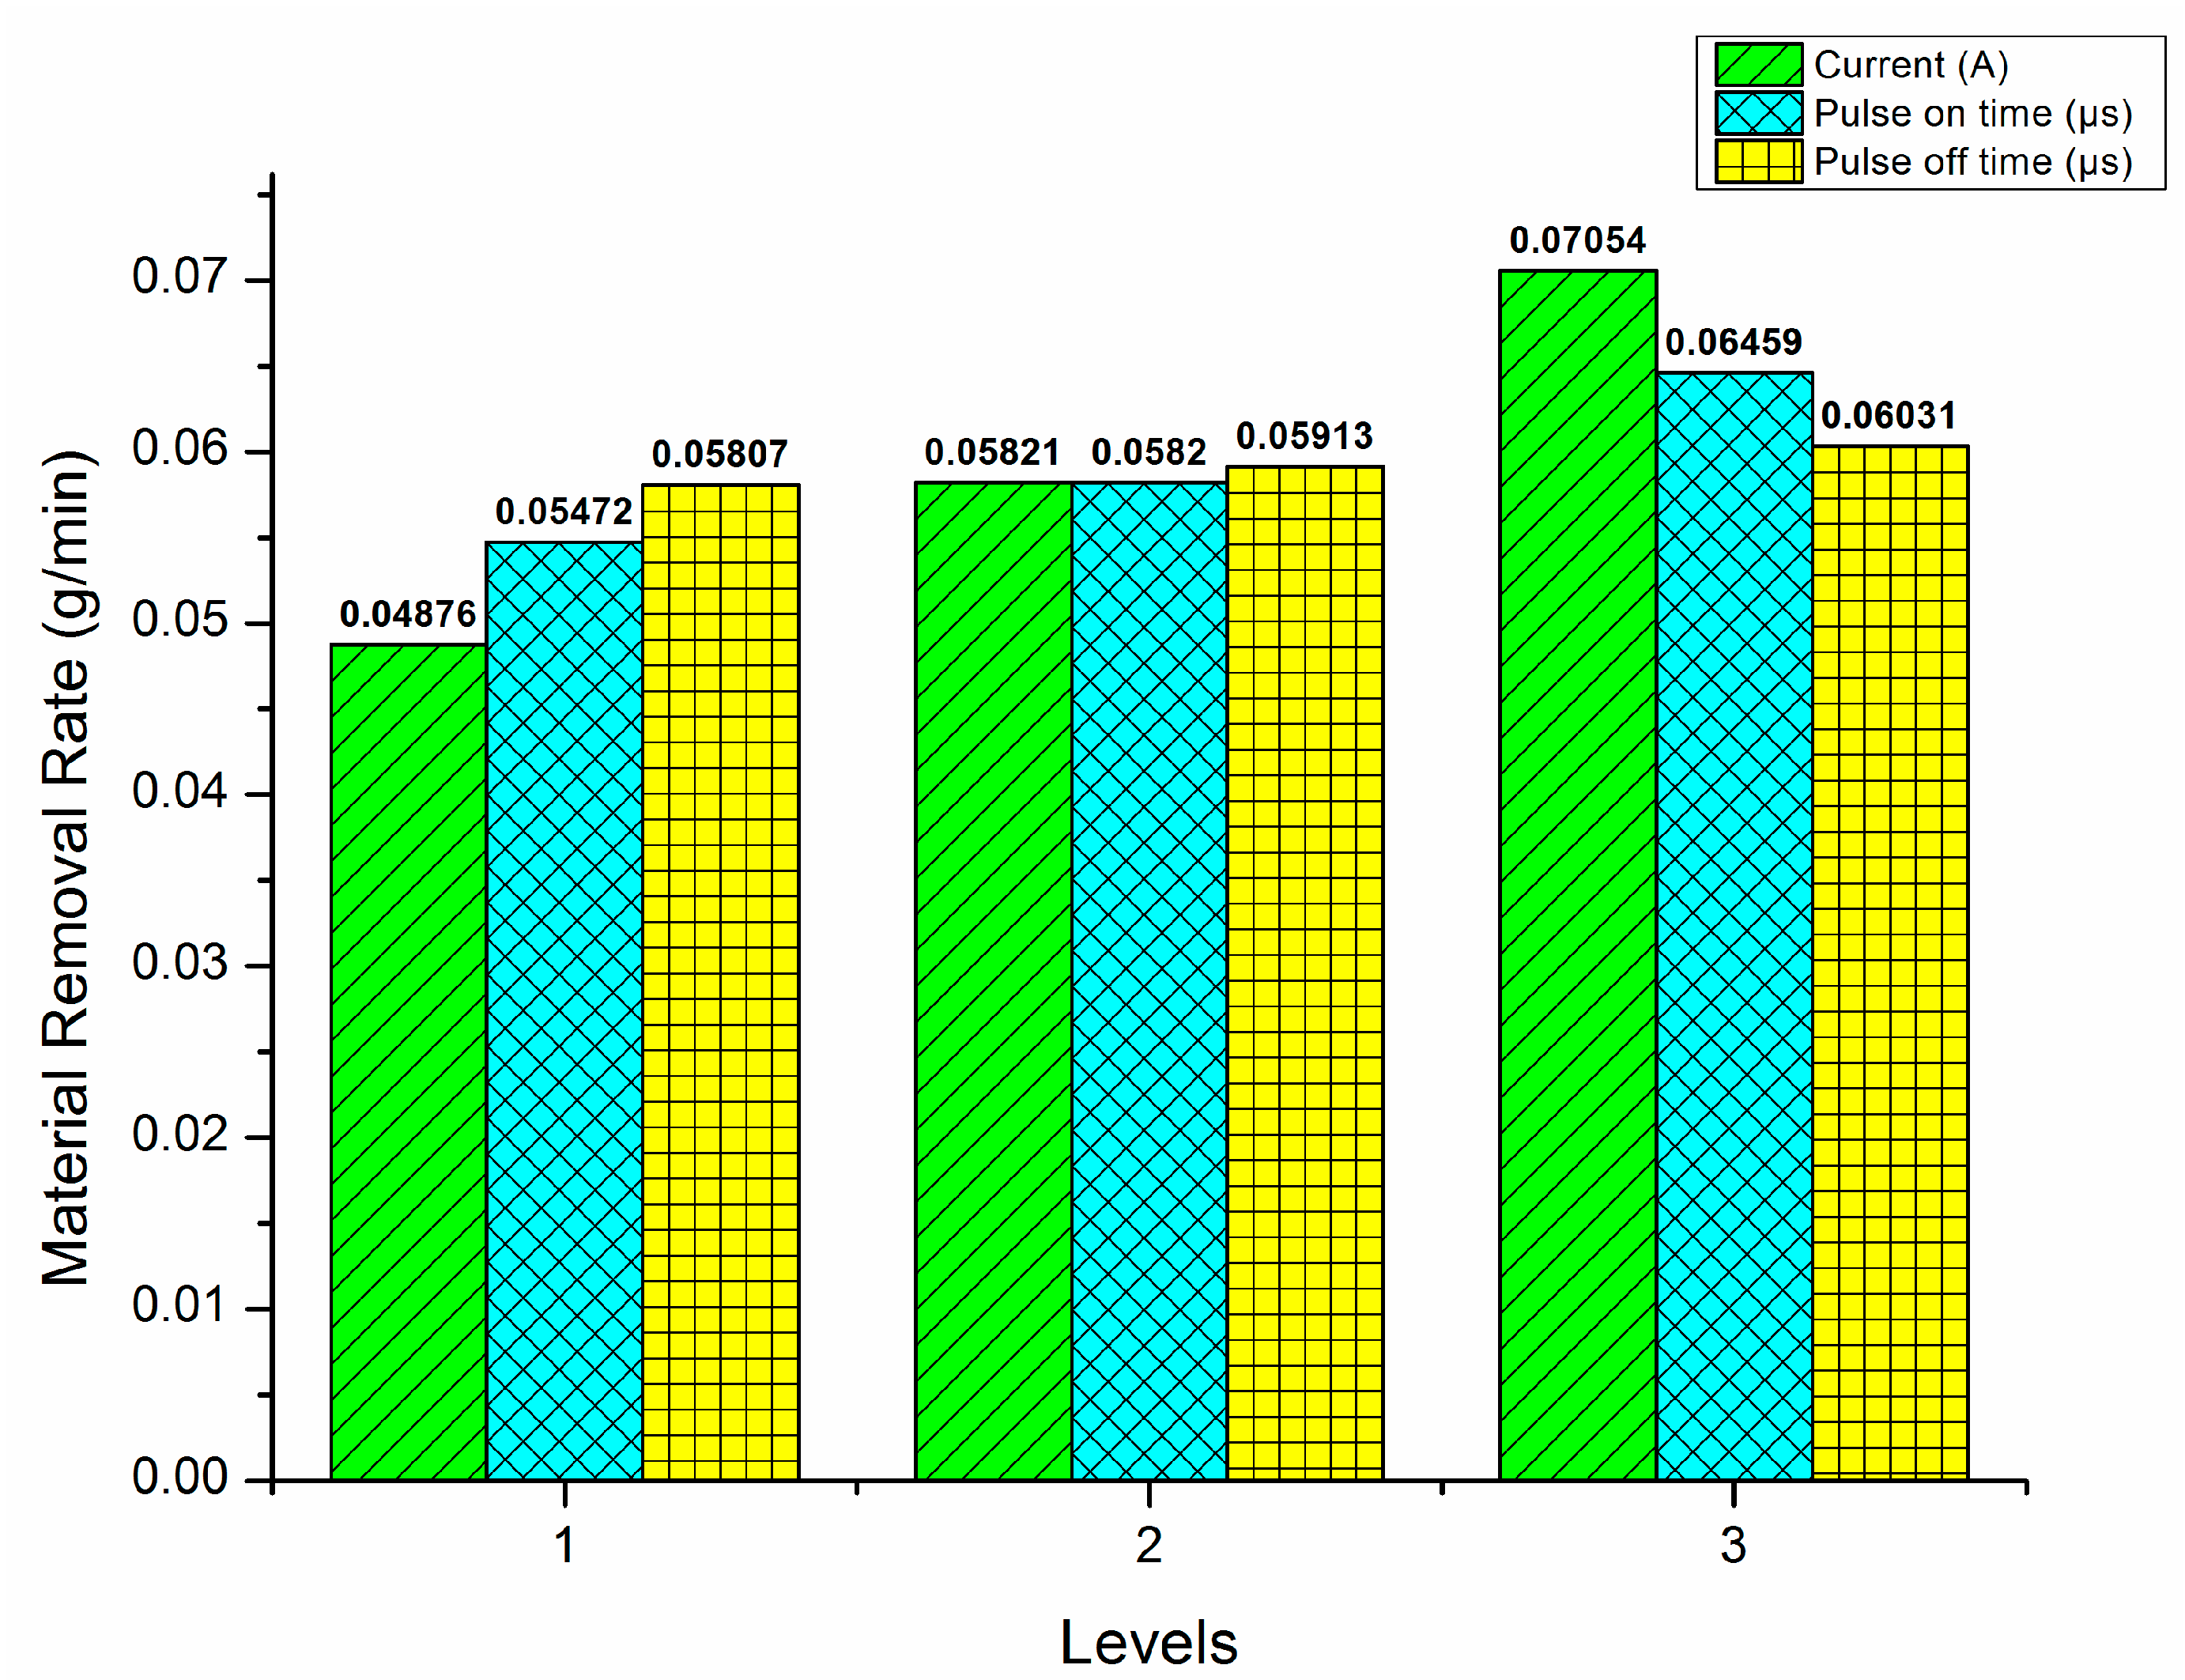
When it comes to the MRR, the larger the criterion, the better it is deemed, which contributes to the reduction in negative environmental impact.
Figure 7 depicts the response plot, which shows that increasing the applied current, “T
on” and “T
off”, causes the material removal rate to increase.
An increase in the amount of current that is being applied can lead to an increase in the discharging energy pulse, which in turn results in a faster MRR. The consistent augmentation in the “Ton” sequels in an intensification in the flow of heat, which in turn causes the temperature of the work specimen to increase. This happens due to the plasma channel encircling the work material growing larger, thereby allowing more heat to penetrate it.
Increases in applied current can result in the discharging energy to intensify, resulting in a quicker MRR. The continual rise in the “Ton” enhances the heat flow, which raises the temperature of the specimen. This occurs when the plasma channel grows, enabling additional heat to reach the working material.
Taguchi conducted a study to ascertain the best plausible machining condition to accomplish an enhanced MRR, and the outcomes are shown in
Figure 7. A3B3C3 is the most possible amalgamation of factors for achieving an increased material removal rate. The investigation exposed that the current is the greatest imperative variable influencing MRR.
3.2. Optimization of Surface Roughness (SR)
The SR criterion is used in sustainable WEDM to evaluate the efficiency of the system. In
Figure 8, the effect plot shows that increasing the “T
on”, “T
off”, and “T
on” values can increase the values of SR. It also shows that the increment in heat energy from the machining zone can cause a decrease in the overall surface temperature. The continuous flow of hot gases and the formation of molten metal pools can reduce the surface temperature of the work zone. This phenomenon also results in crater formation. The crater size can influence the quality of the feature made. The surface temperature can be controlled by the energy that the work zone eruptions generate. The electric discharge’s surface becomes rougher due to the increased pulse of energy.
Figure 8 depicts the optimal machining combinations for minimizing “SR”. The best possible combinations for minimizing “SR” are determined to be A1B1C1. The influence of current on temperature of the machined surface and its conditions are investigated. It is demonstrated that the current is the most important feature that can influence the overall surface temperature of the surface.
3.3. Optimization of Dimensional Deviation
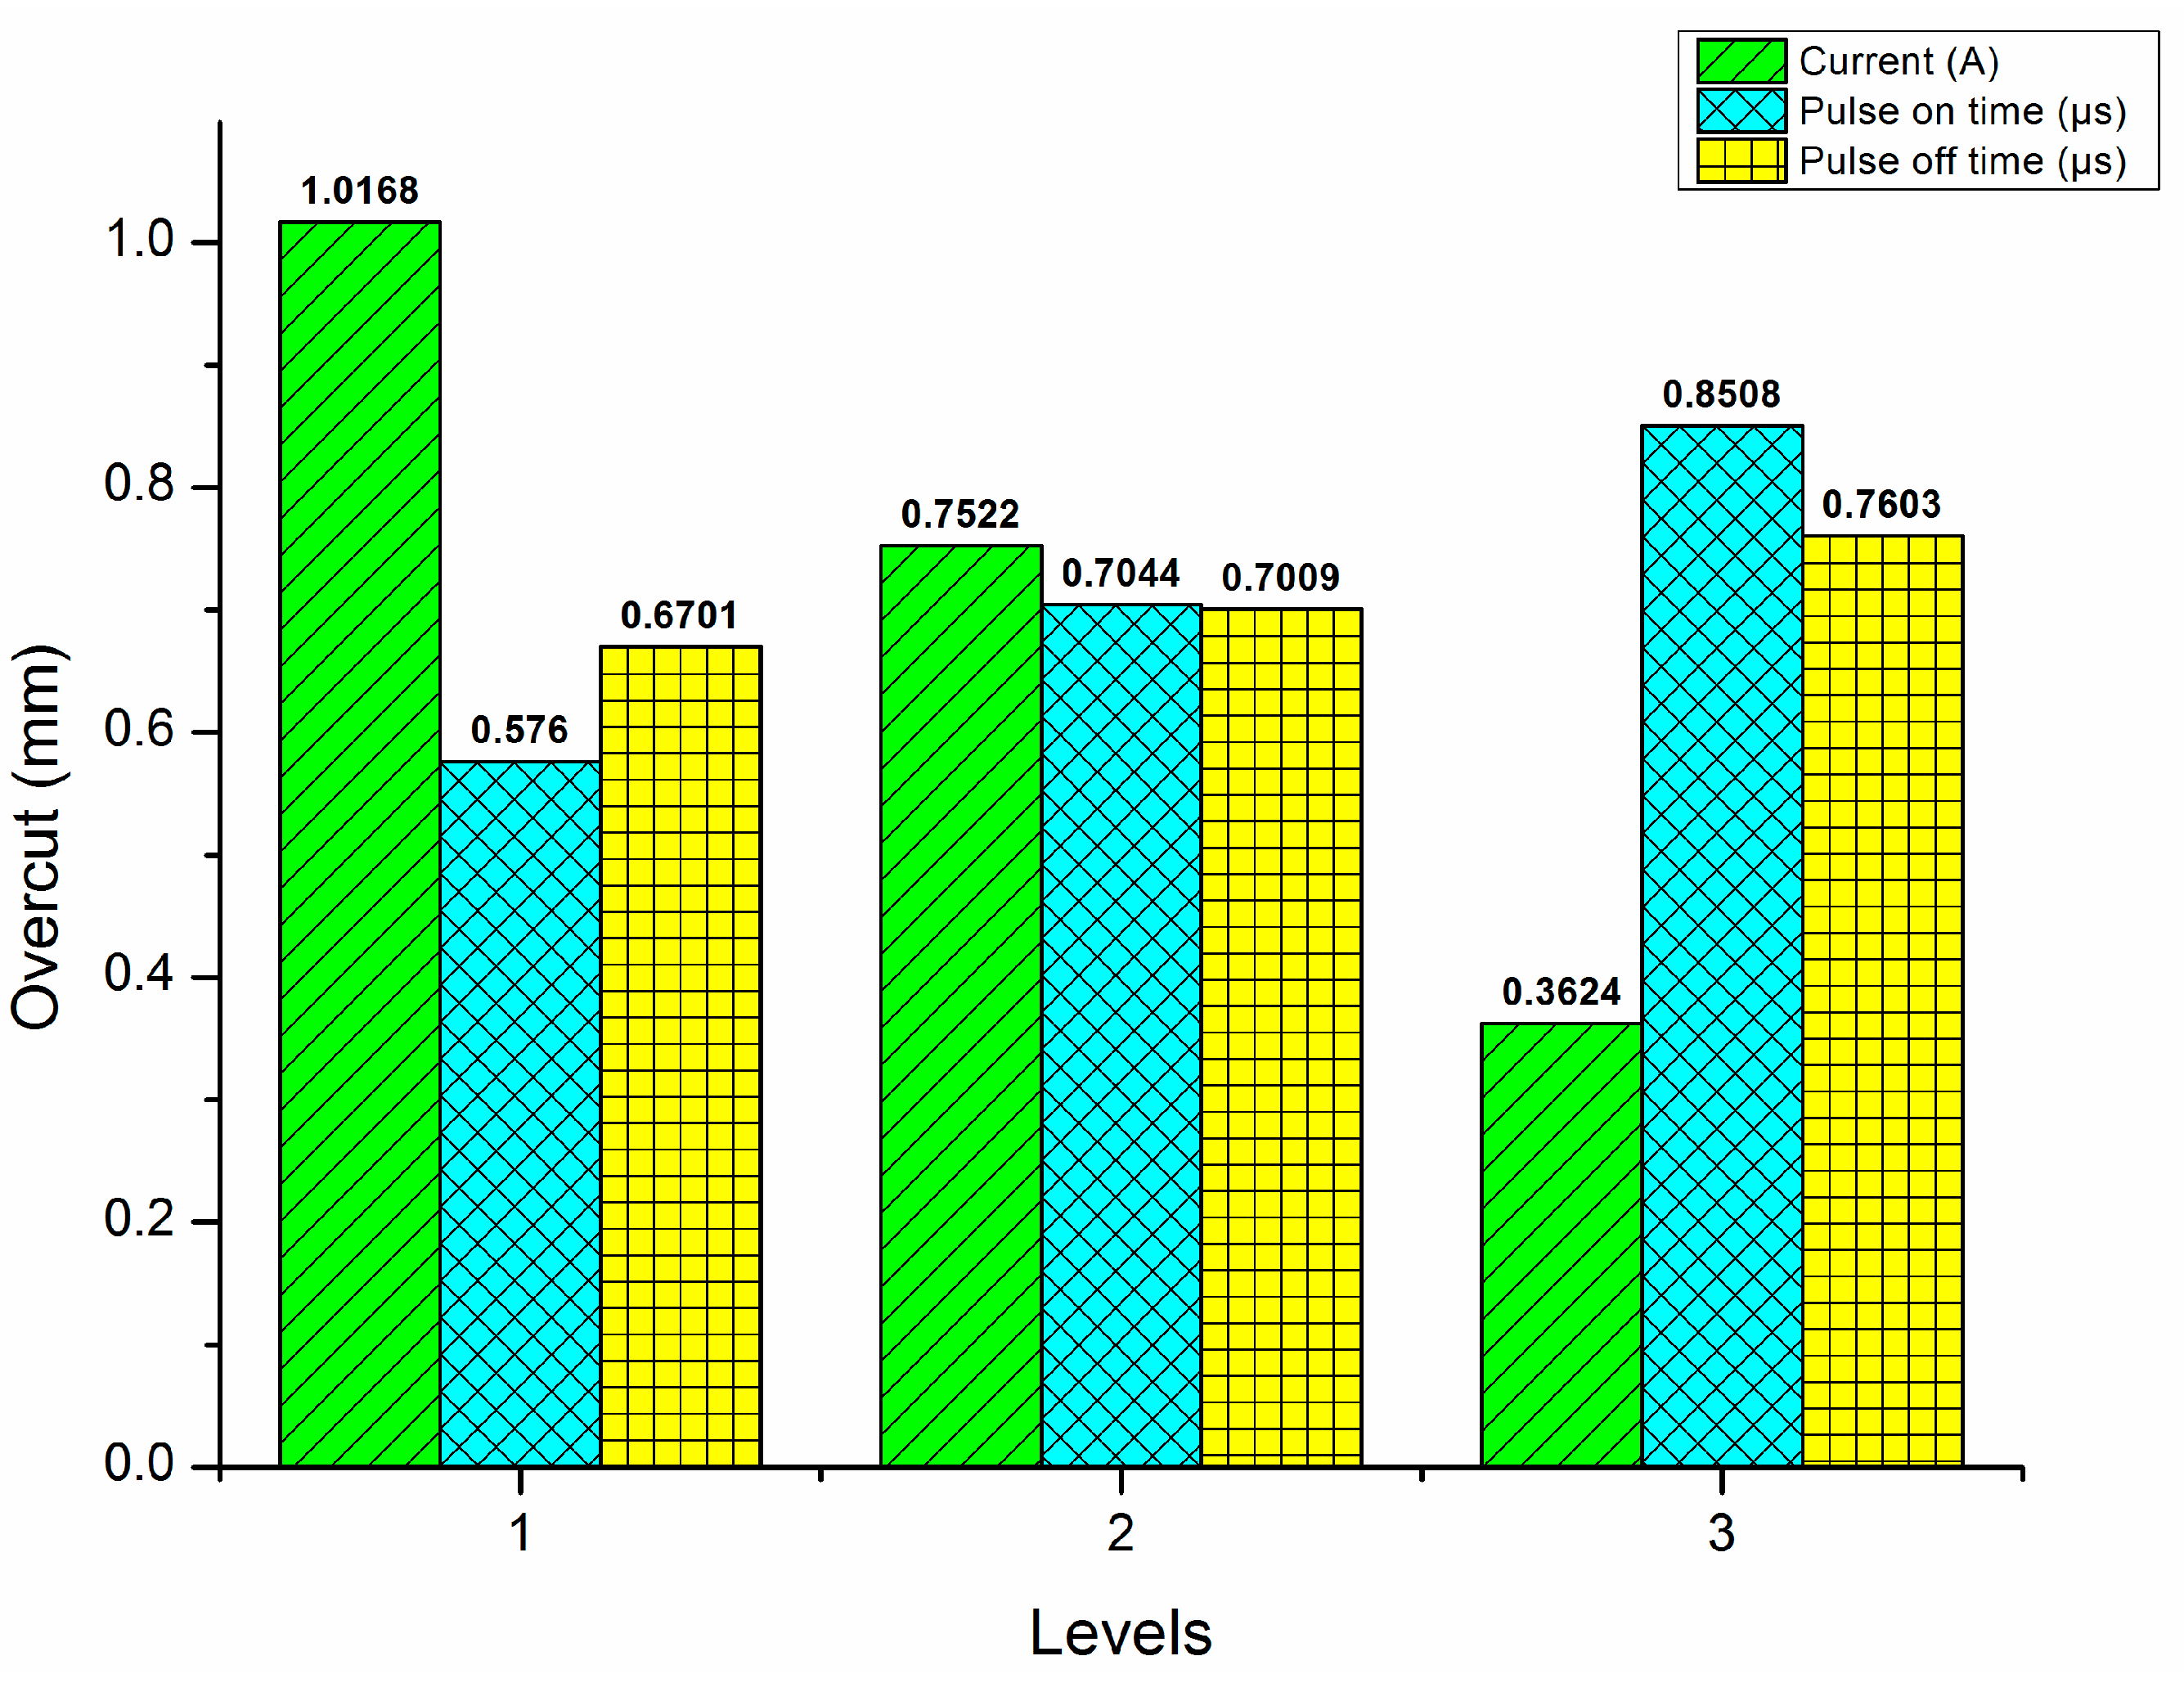
In WEDM, the deviation in dimension is defined by the smallest deviation being the best criterion.
Figure 9 portrays the main effect plot for dimensional deviation. It demonstrates that increasing the current decreases the overcut value, while increasing “T
on” and “T
off” increases it. If the debris has been removed appropriately, it may result in secondary sparks in the cutting region and on the side walls of the made feature. Due to the pulse duration, the discharge energy intensification can result in deep crater formation. When the duration of the pulse increases, debris can become trapped in the interelectrode gap, reducing the device’s dimensional accuracy.
A3B1C1 determines the best machining combinations for obtaining the minimized deviation in dimension during the WEDM of Hastelloy C276.
Figure 9 depicts the results of Taguchi’s analysis. During the WEDM process, the applied current is critical in the overcut.
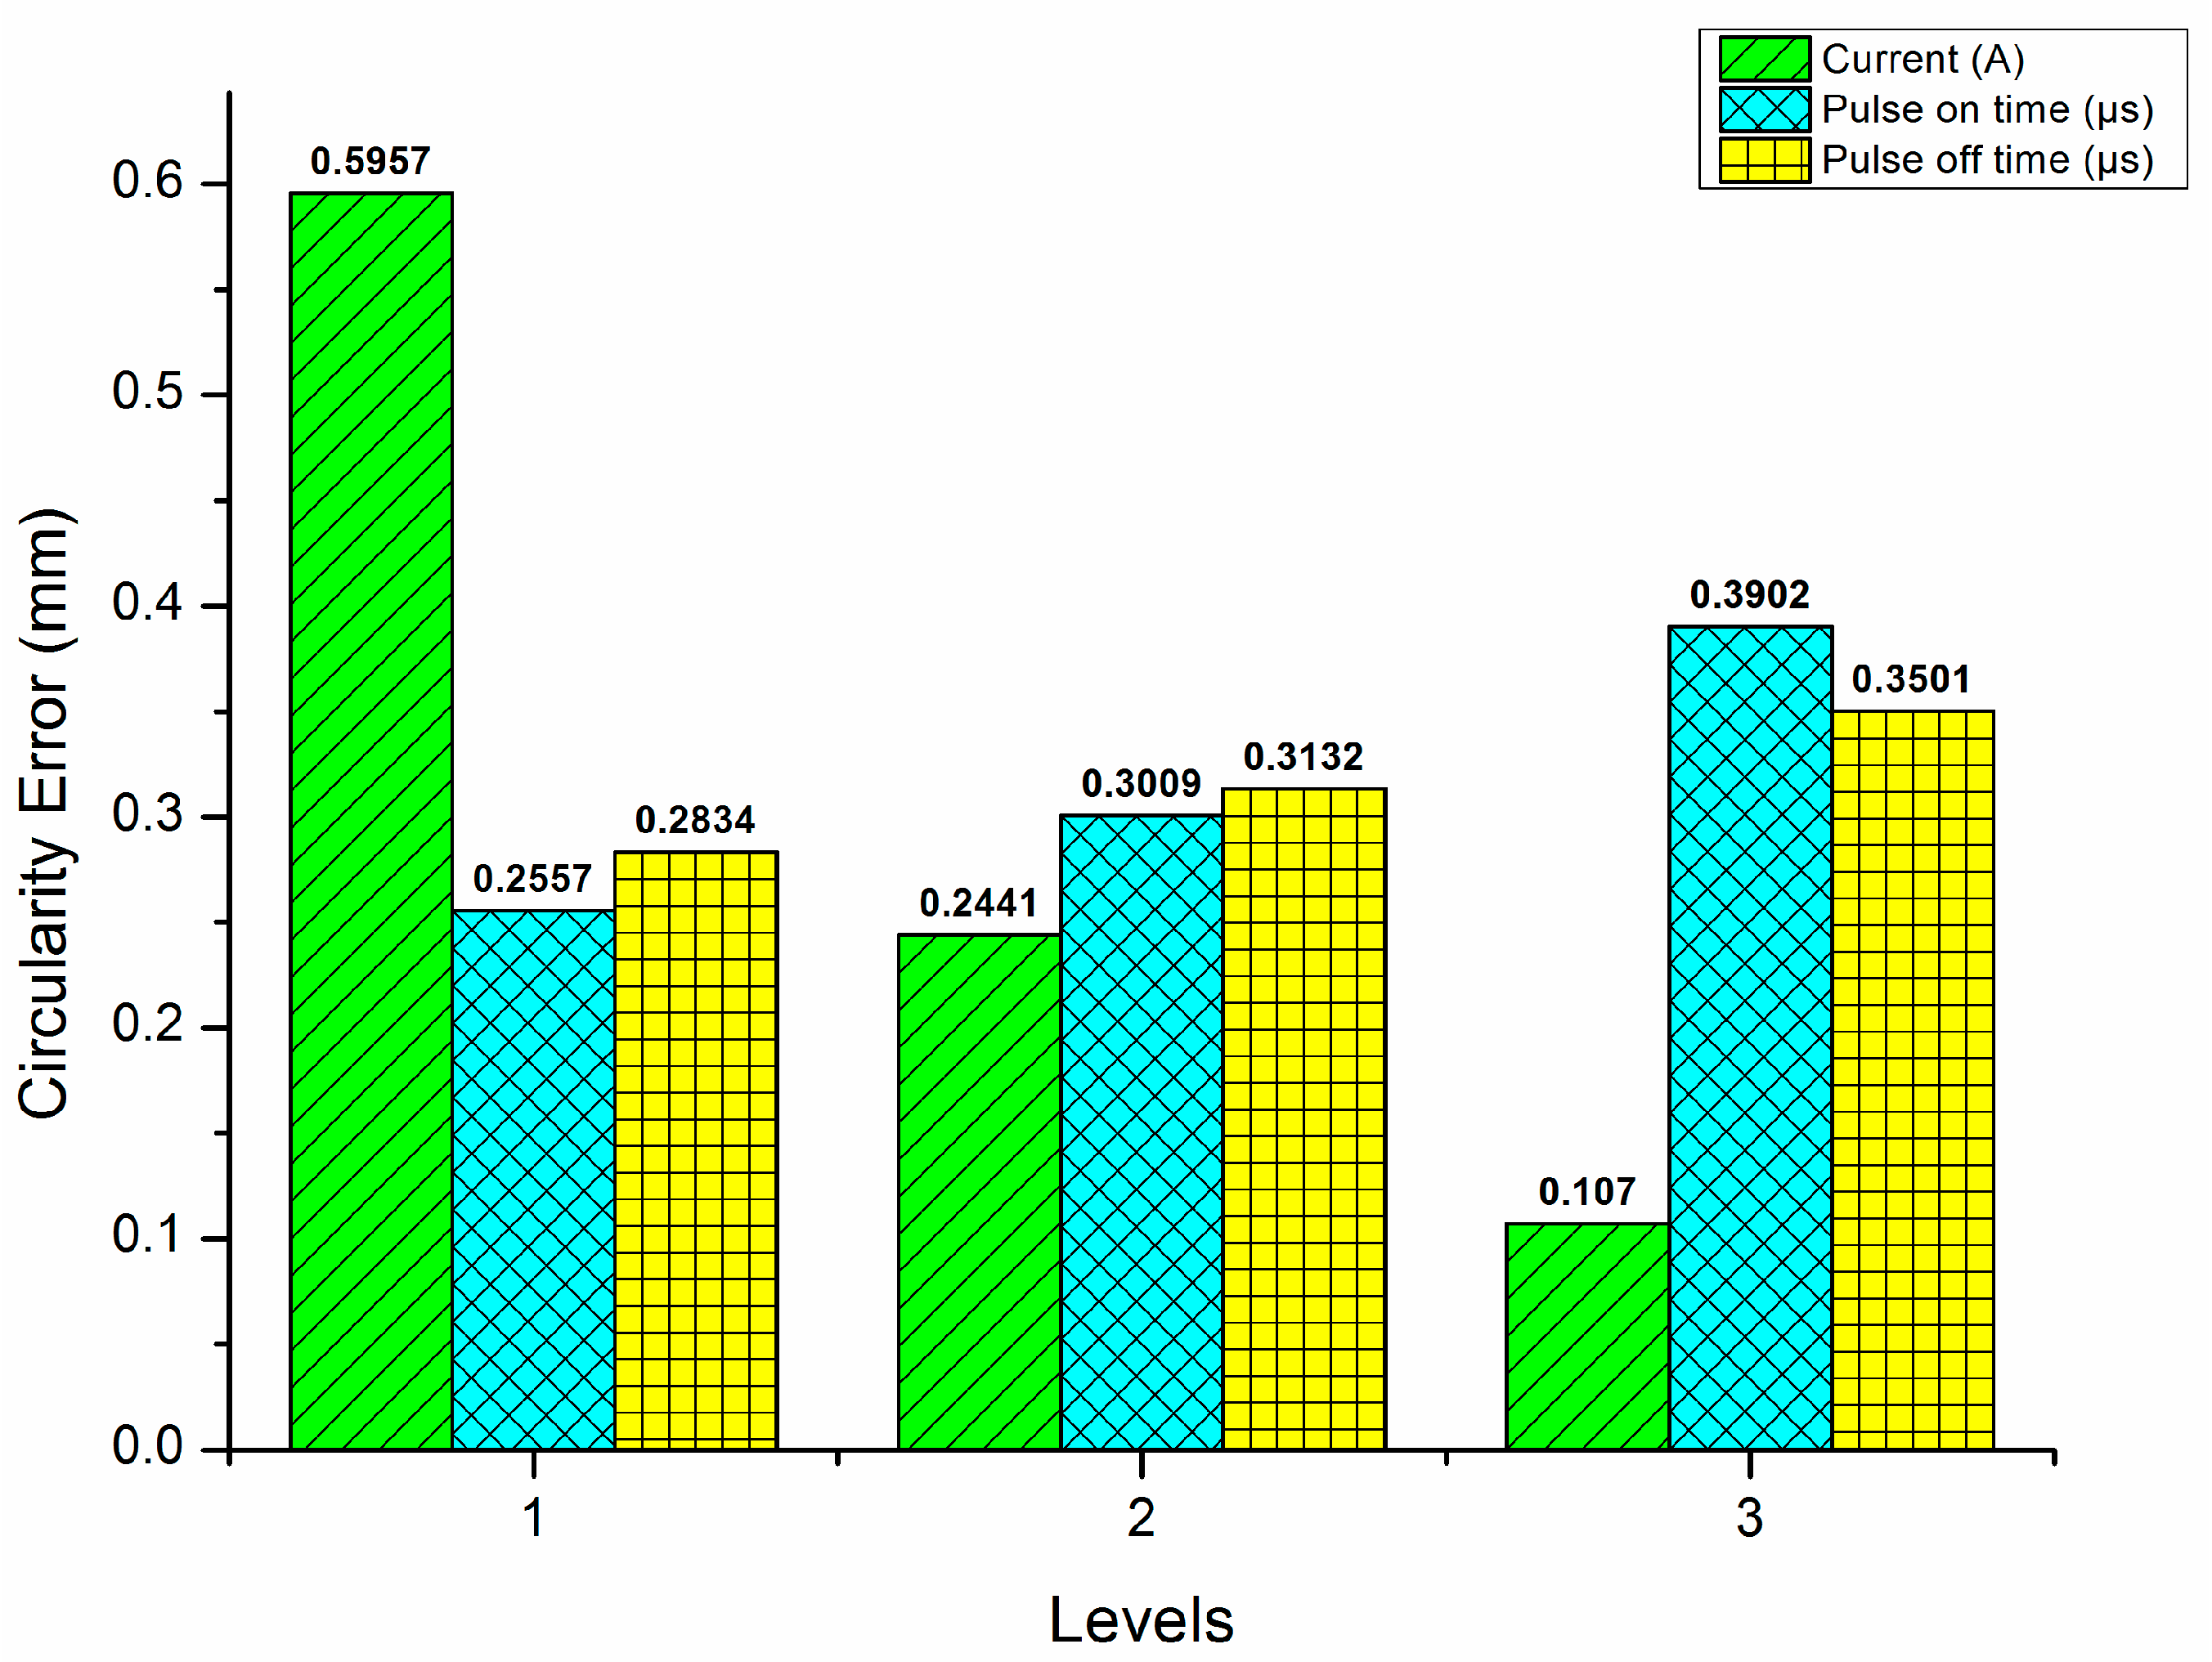
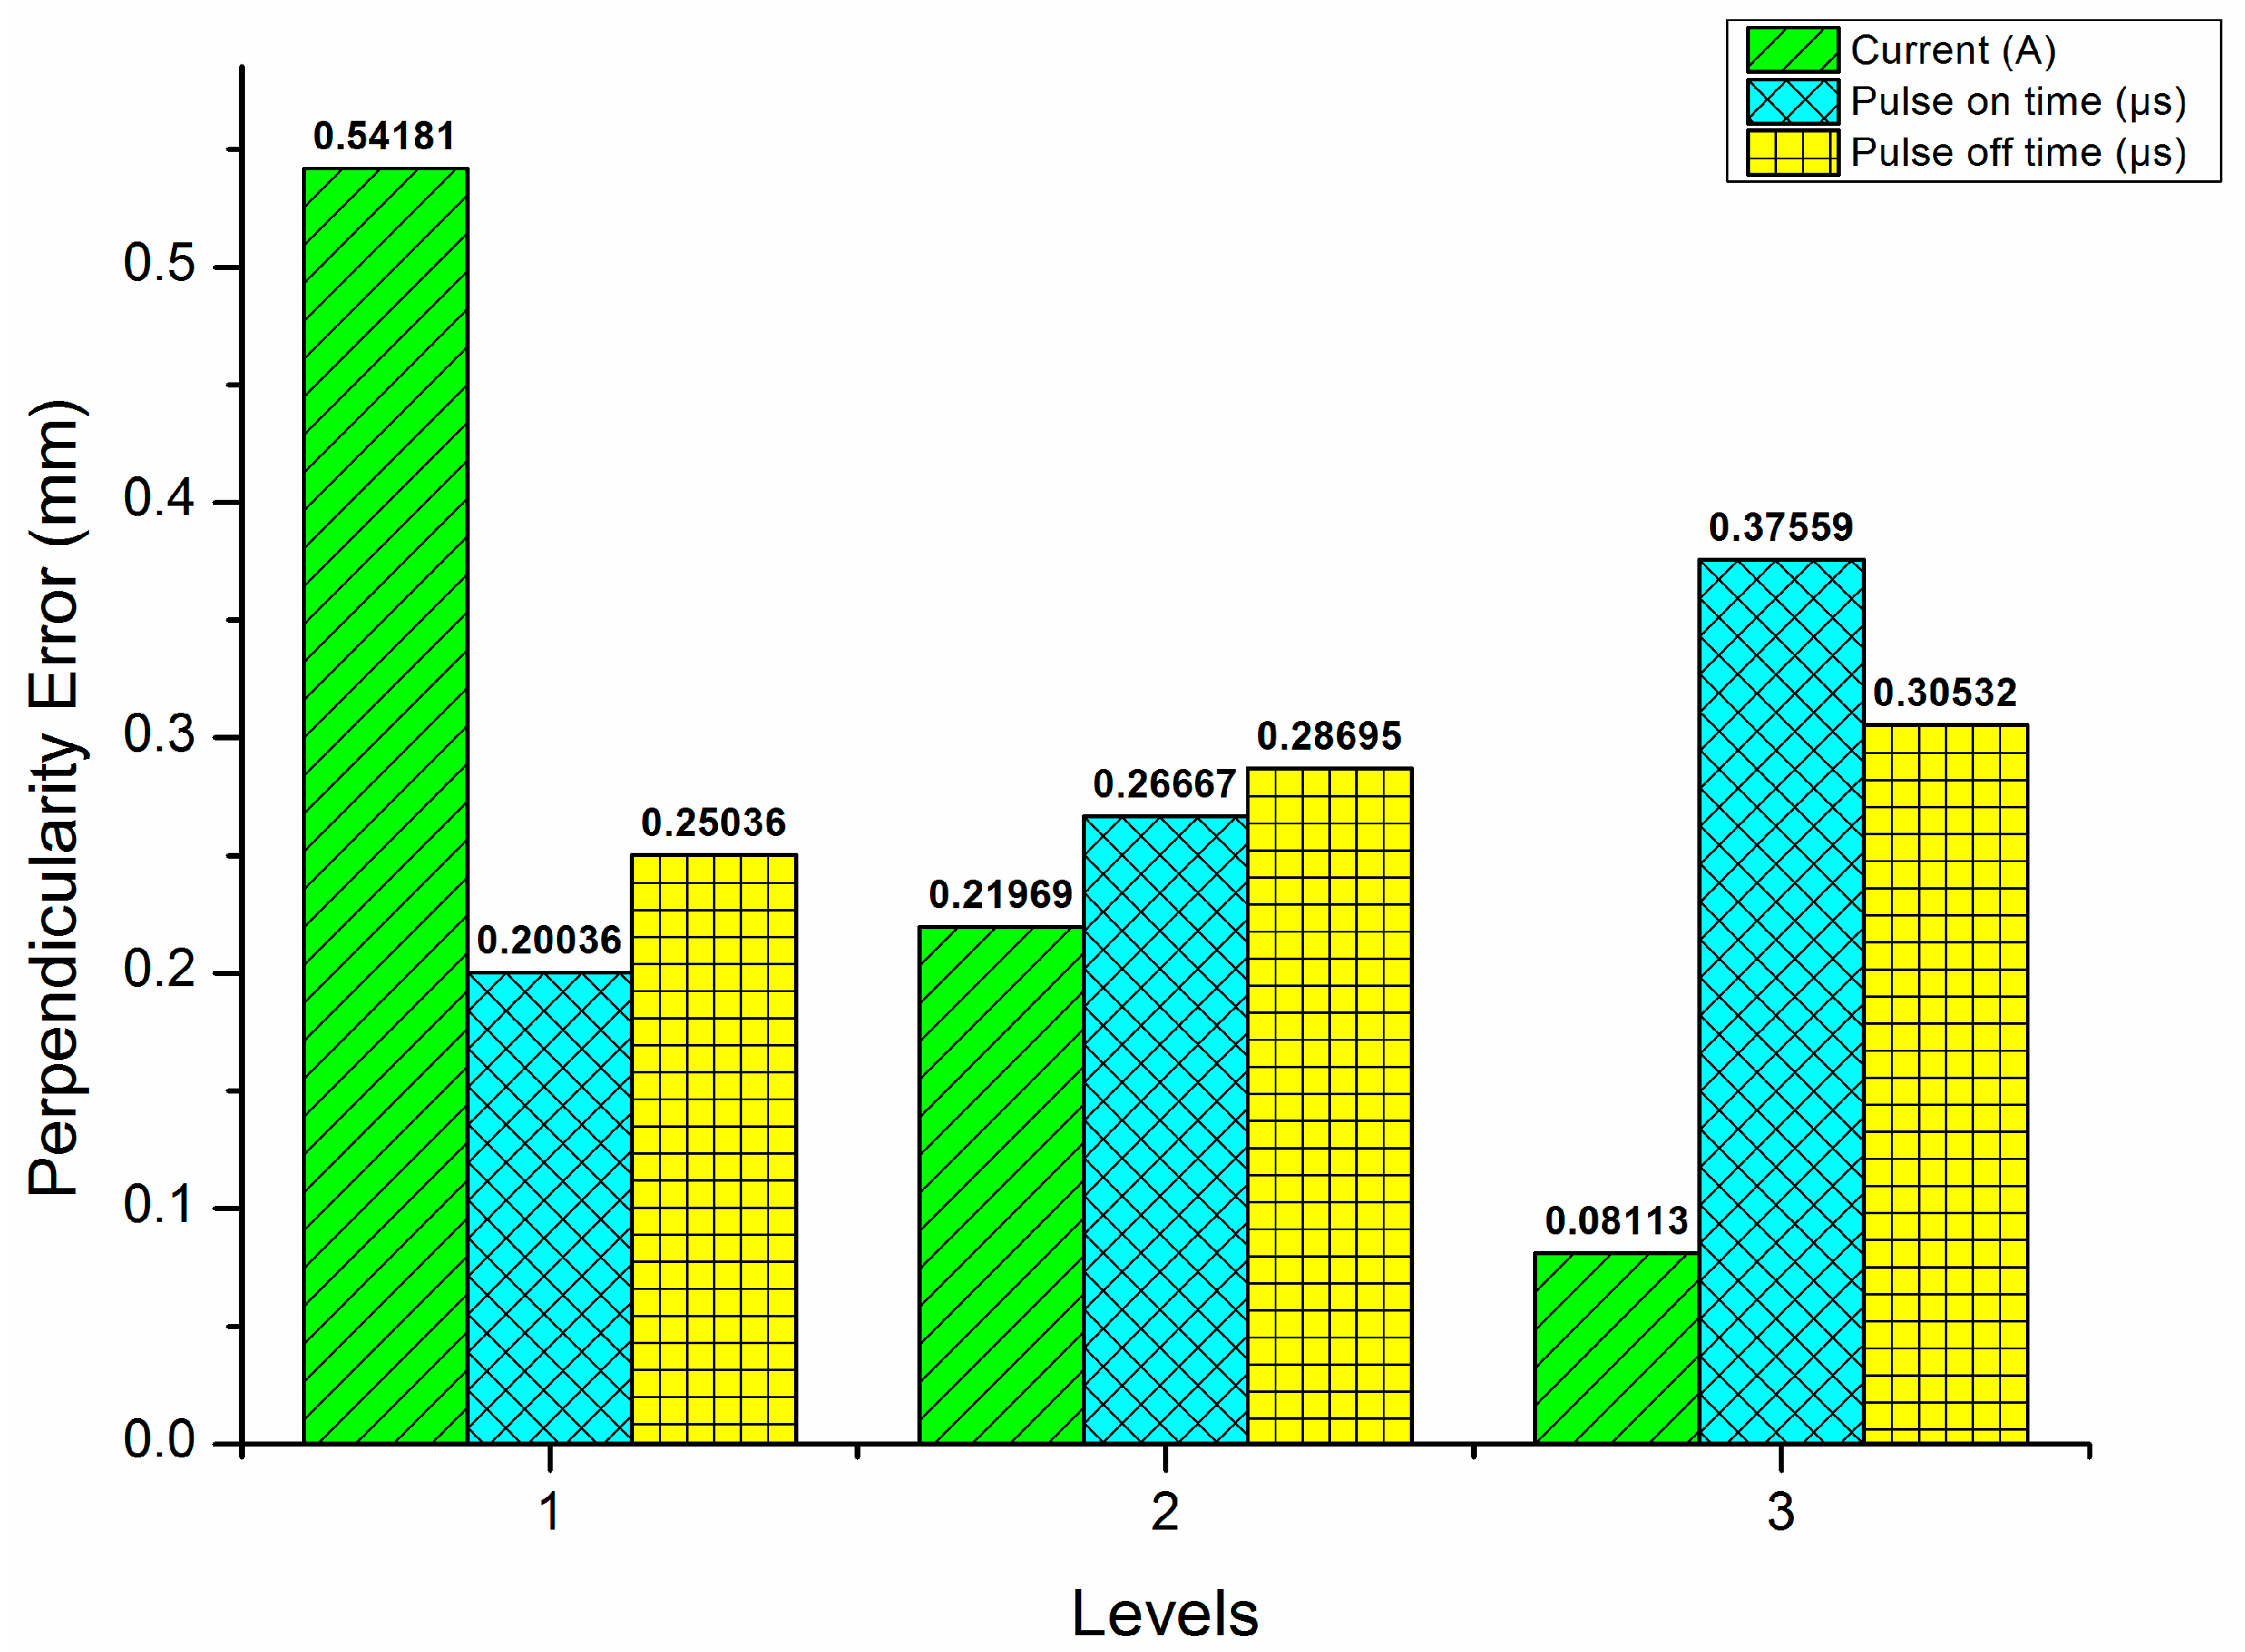
3.4. Optimization of Circularity and Perpendicularity Errors
In advanced processes, circularity and orientation tolerances are important performance indicators.
Figure 10 and
Figure 11 highlight the errors in circularity and perpendicularity errors in WEDM of C-276. The graphical representation shows the influence of the current on these parameters.
The increment in the pulse duration and the pulse rate can lead to a reduction in the accuracy of the circular hole. In addition, it can result in the removal of material to take place in a shorter timeframe. This can cause the development of tolerance and form errors.
This study found that the optimal conditions for the production of a particular type of metal can be achieved by optimizing the A3B1C1 conditions. For minimizing the errors in orientation and form tolerance, a comprehensive analysis has been performed. The current, which is the predominant variable which affects these output measures, was also studied.
3.5. Significance Analysis for Chosen Output Measures
ANOVA is a tool that can be used to examine the numerous variables of this investigational analysis statistically, and it can be performed with the Minitab 20.2.0 software. ANOVA was used to analyze the various parameters of the process involved in the machining of C-276 Hastelloy. The “F” value and the ‘p’ value are two statistical measures that are utilized in the testing of hypotheses. The “F” value is a comparison of the combined effects of all of the variables, and a higher “F” value indicates a greater likelihood that the variation caused by the independent variable is due to a genuine factor rather than being the result of random chance. Given that the alternative hypothesis is false, the ‘p’ value indicates the likelihood of obtaining a result at least as extreme as the one that was actually observed, given that the null hypothesis is accepted. A low ‘p’ value indicates that all of the results obtained are statistically significant. The “F” value is a statistical test that is used in ANOVA to determine if there is a significant difference between two or more groups. To determine it, divide the variance between the groups by the variance within the groups. This will give you the answer. The higher the “F” value, the greater the likelihood that there is a statistically significant disparity between the groups being compared.
Table 3 shows the outcomes from the ANOVA analysis, and it is perceived from the “F” value and % contribution that all the performance measures considered in this investigation are influenced by supplied current. “T
on” is the next momentous parameter for the opted for output characteristics.
3.6. Analysis on the Evolved Neural Network Model
The prediction error is a type of numerical measure that occurs when the values from the evolved model are different from the experimentation values. This is verified by estimating the error using the subsequent Equation (1) and is represented in
Table 5.
The correlation coefficient and the Root Mean Square Error (RMSE) are used to evaluate the prediction model, which can be derived from Equations (2) and (3).
where “
EV” and “
PV” are the actual and foretold values, respectively, for total “
n” number of observations in the model.
The difference between the values that were predicted by a model and the values that occurred is referred to as the prediction error in the field of statistics. The evaluation of the accuracy of predictive models can be done using a variety of errors, each of which can be used in their own unique way. These errors serve as a measurement tool that determines how accurately a model can forecast outcomes based on the data that it is fed. They can be used to evaluate various models and determine which one is superior to others in terms of accurately predicting the outcomes of events.
3.7. Comparison on Actual and Prophesied GRG
The aspiration of this exploration was to evolve an NN model capable of predicting the Grey relational grade using the correlation coefficient. The error convergence procedure was also performed to ascertain the optimum configuration of the network. The outcomes of the investigational analysis revealed that the network that has two hidden layers and 18 neurons has the best suitable parameters.
The NN model was evolved using the algorithm known as the Levenberg–Marquardt method. The average correlation coefficient of the network is 0.9981. It was suggested that two layers with 18 neurons each be placed in the prediction task to execute it well. The values of the network model and those of the experiment setups are compared in
Table 6. The outcomes of the analysis revealed that the foretold data were associated with the calculated ones. It also showed that the ANN model had a strong connection with the experiment’s data.

 ,
, 

