
Hydropower Scenarios in the Face of Climate Change in Ecuador

 , ,
, ,  ,
,  , , and
Abstract
:1. Introduction
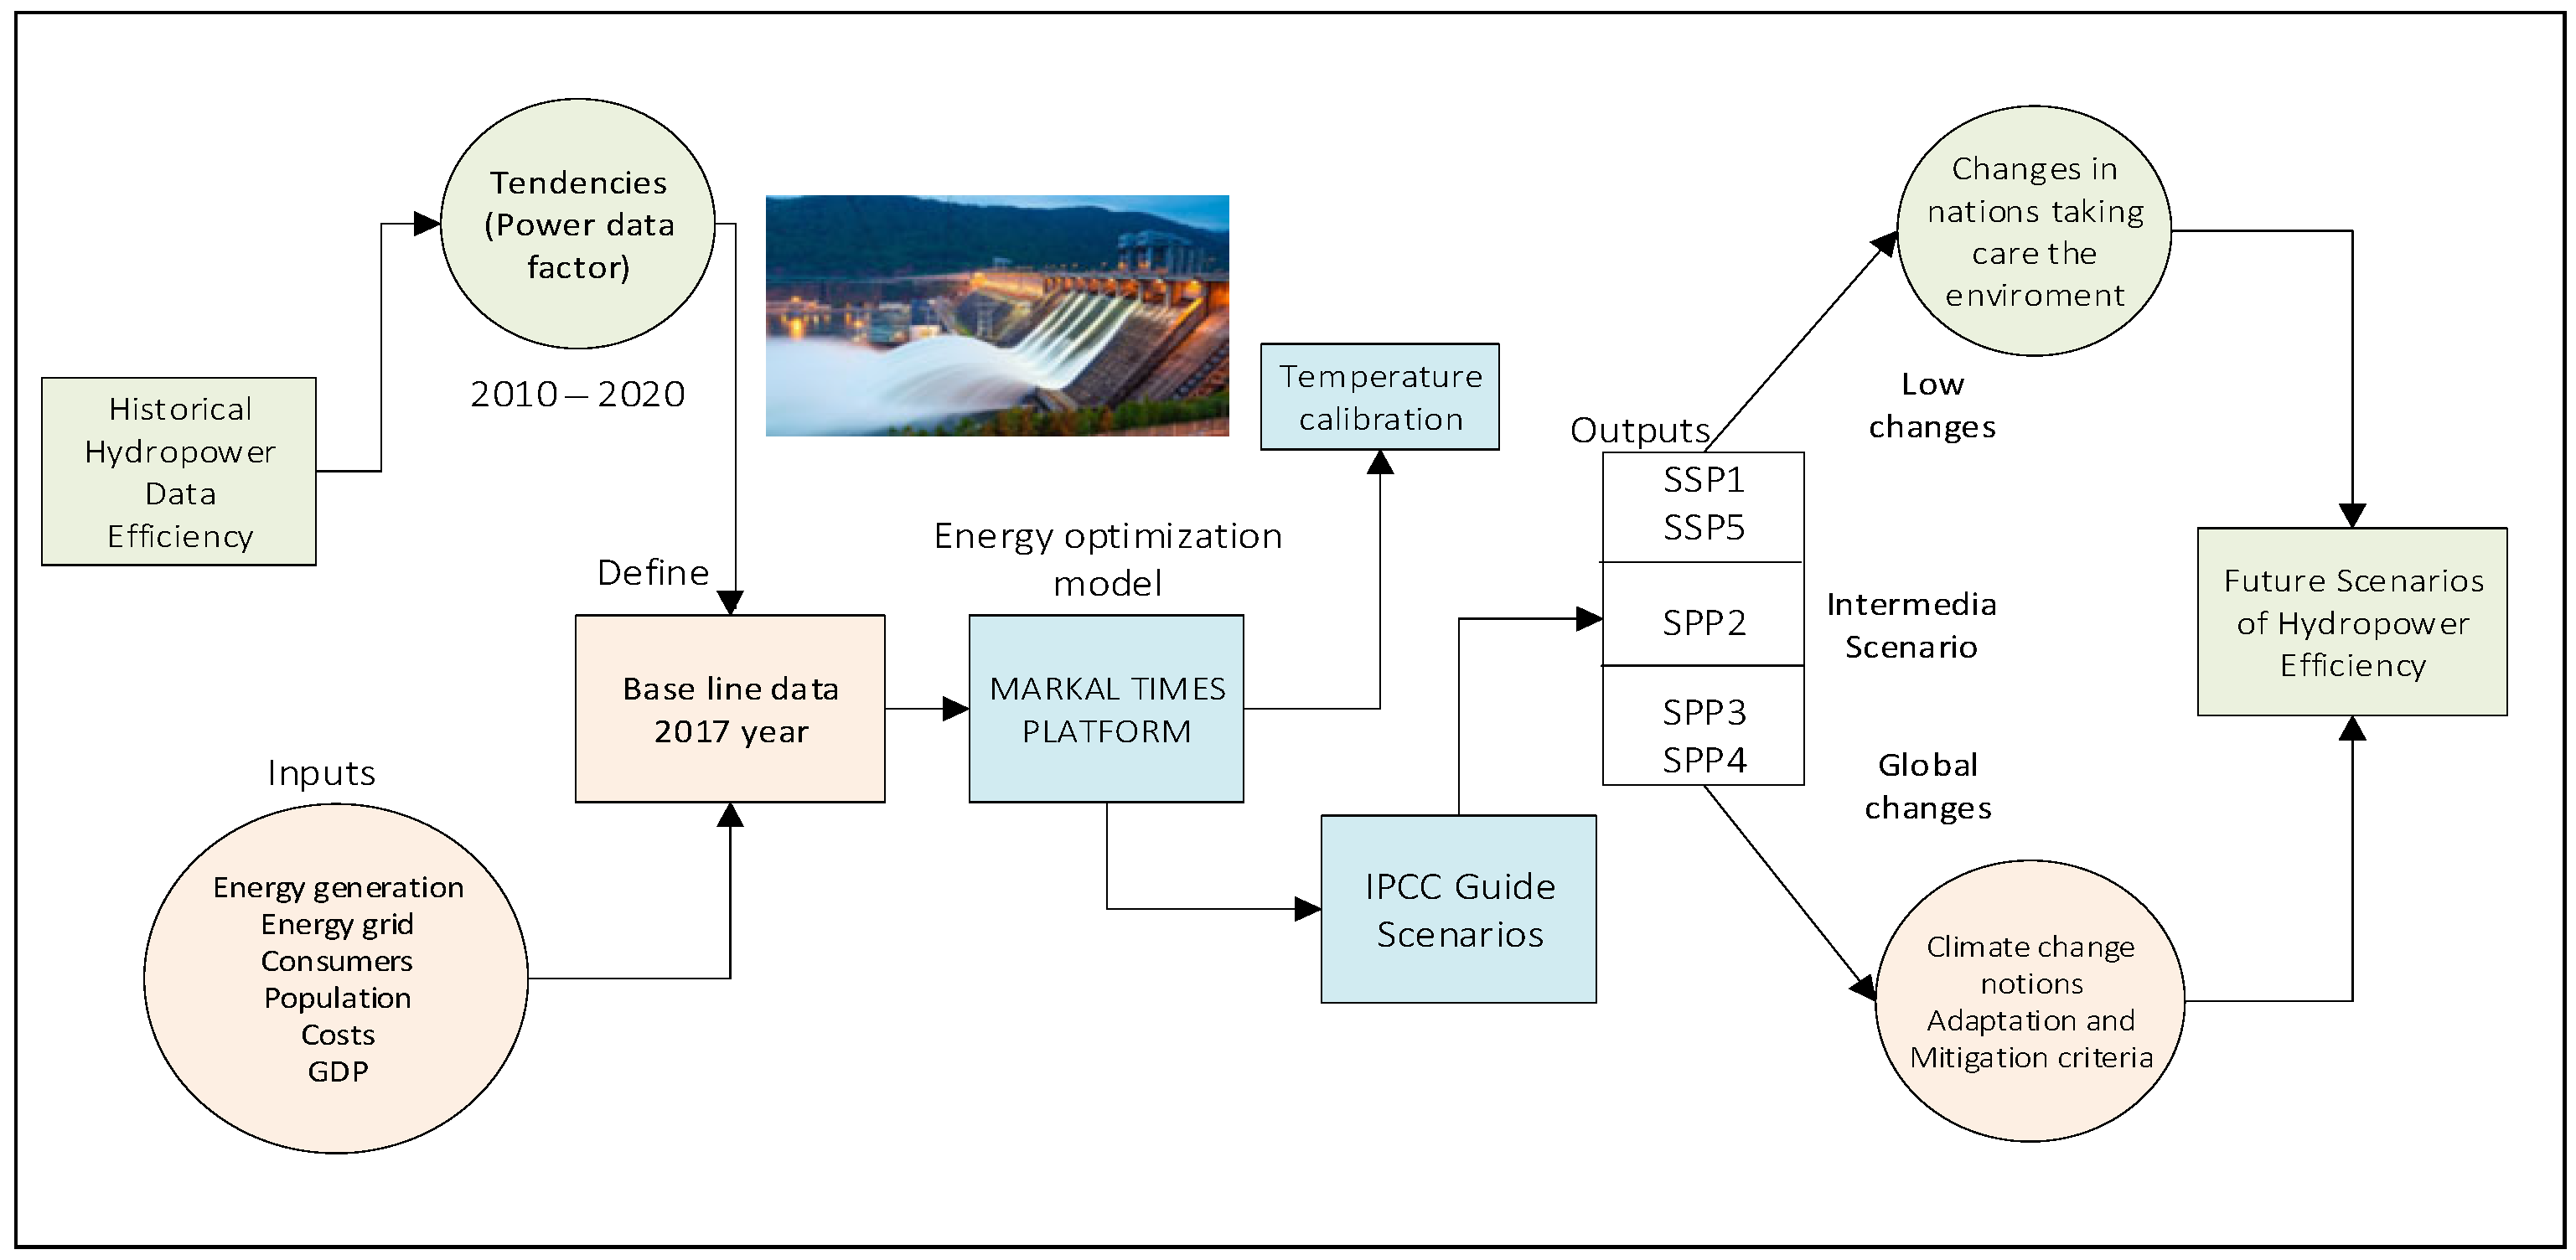
2. Materials and Methods
- The International Renewable Energy Agency;
- Ministry of Environment, Water and Ecological Transition of Ecuador;
- Ministry of Energy and Non-Renewable Resources of Ecuador;
- Agency for the Regulation and Control of Energy and Non-Renewable Natural Resources of Ecuador;
- The Electric Corporation of Ecuador.
3. Results
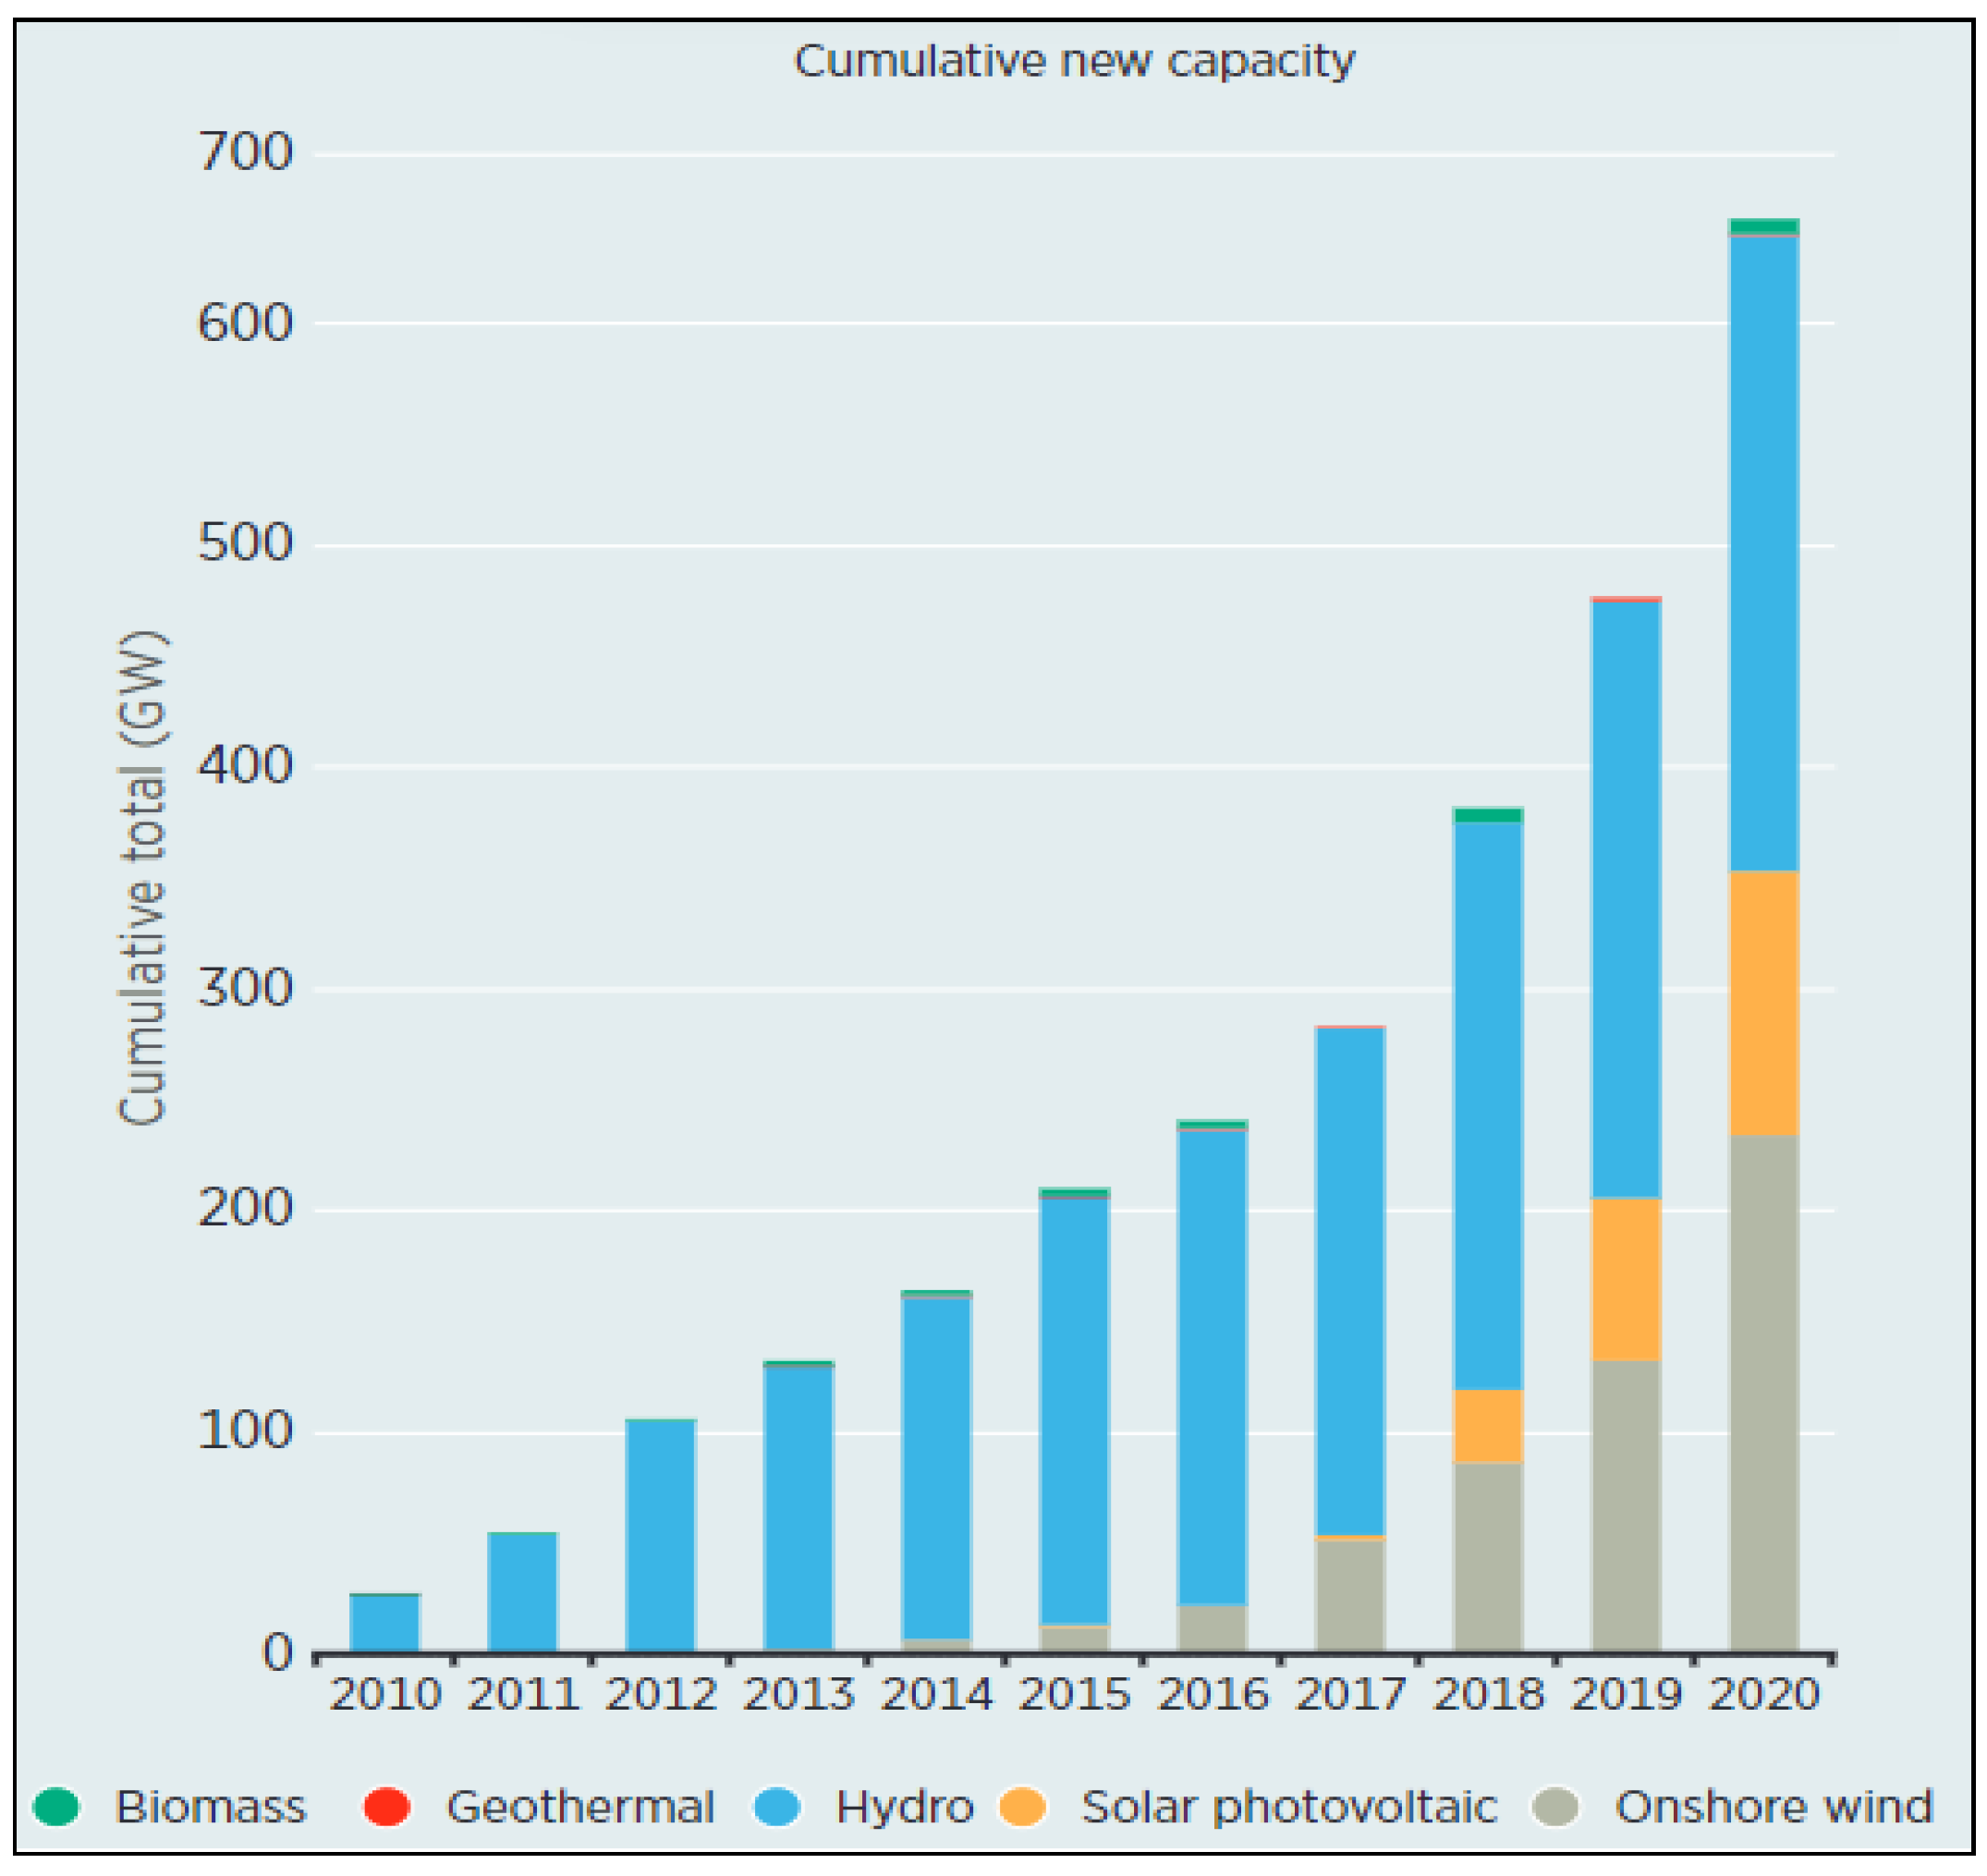
3.1. Trends and Data
3.1.1. Input Data
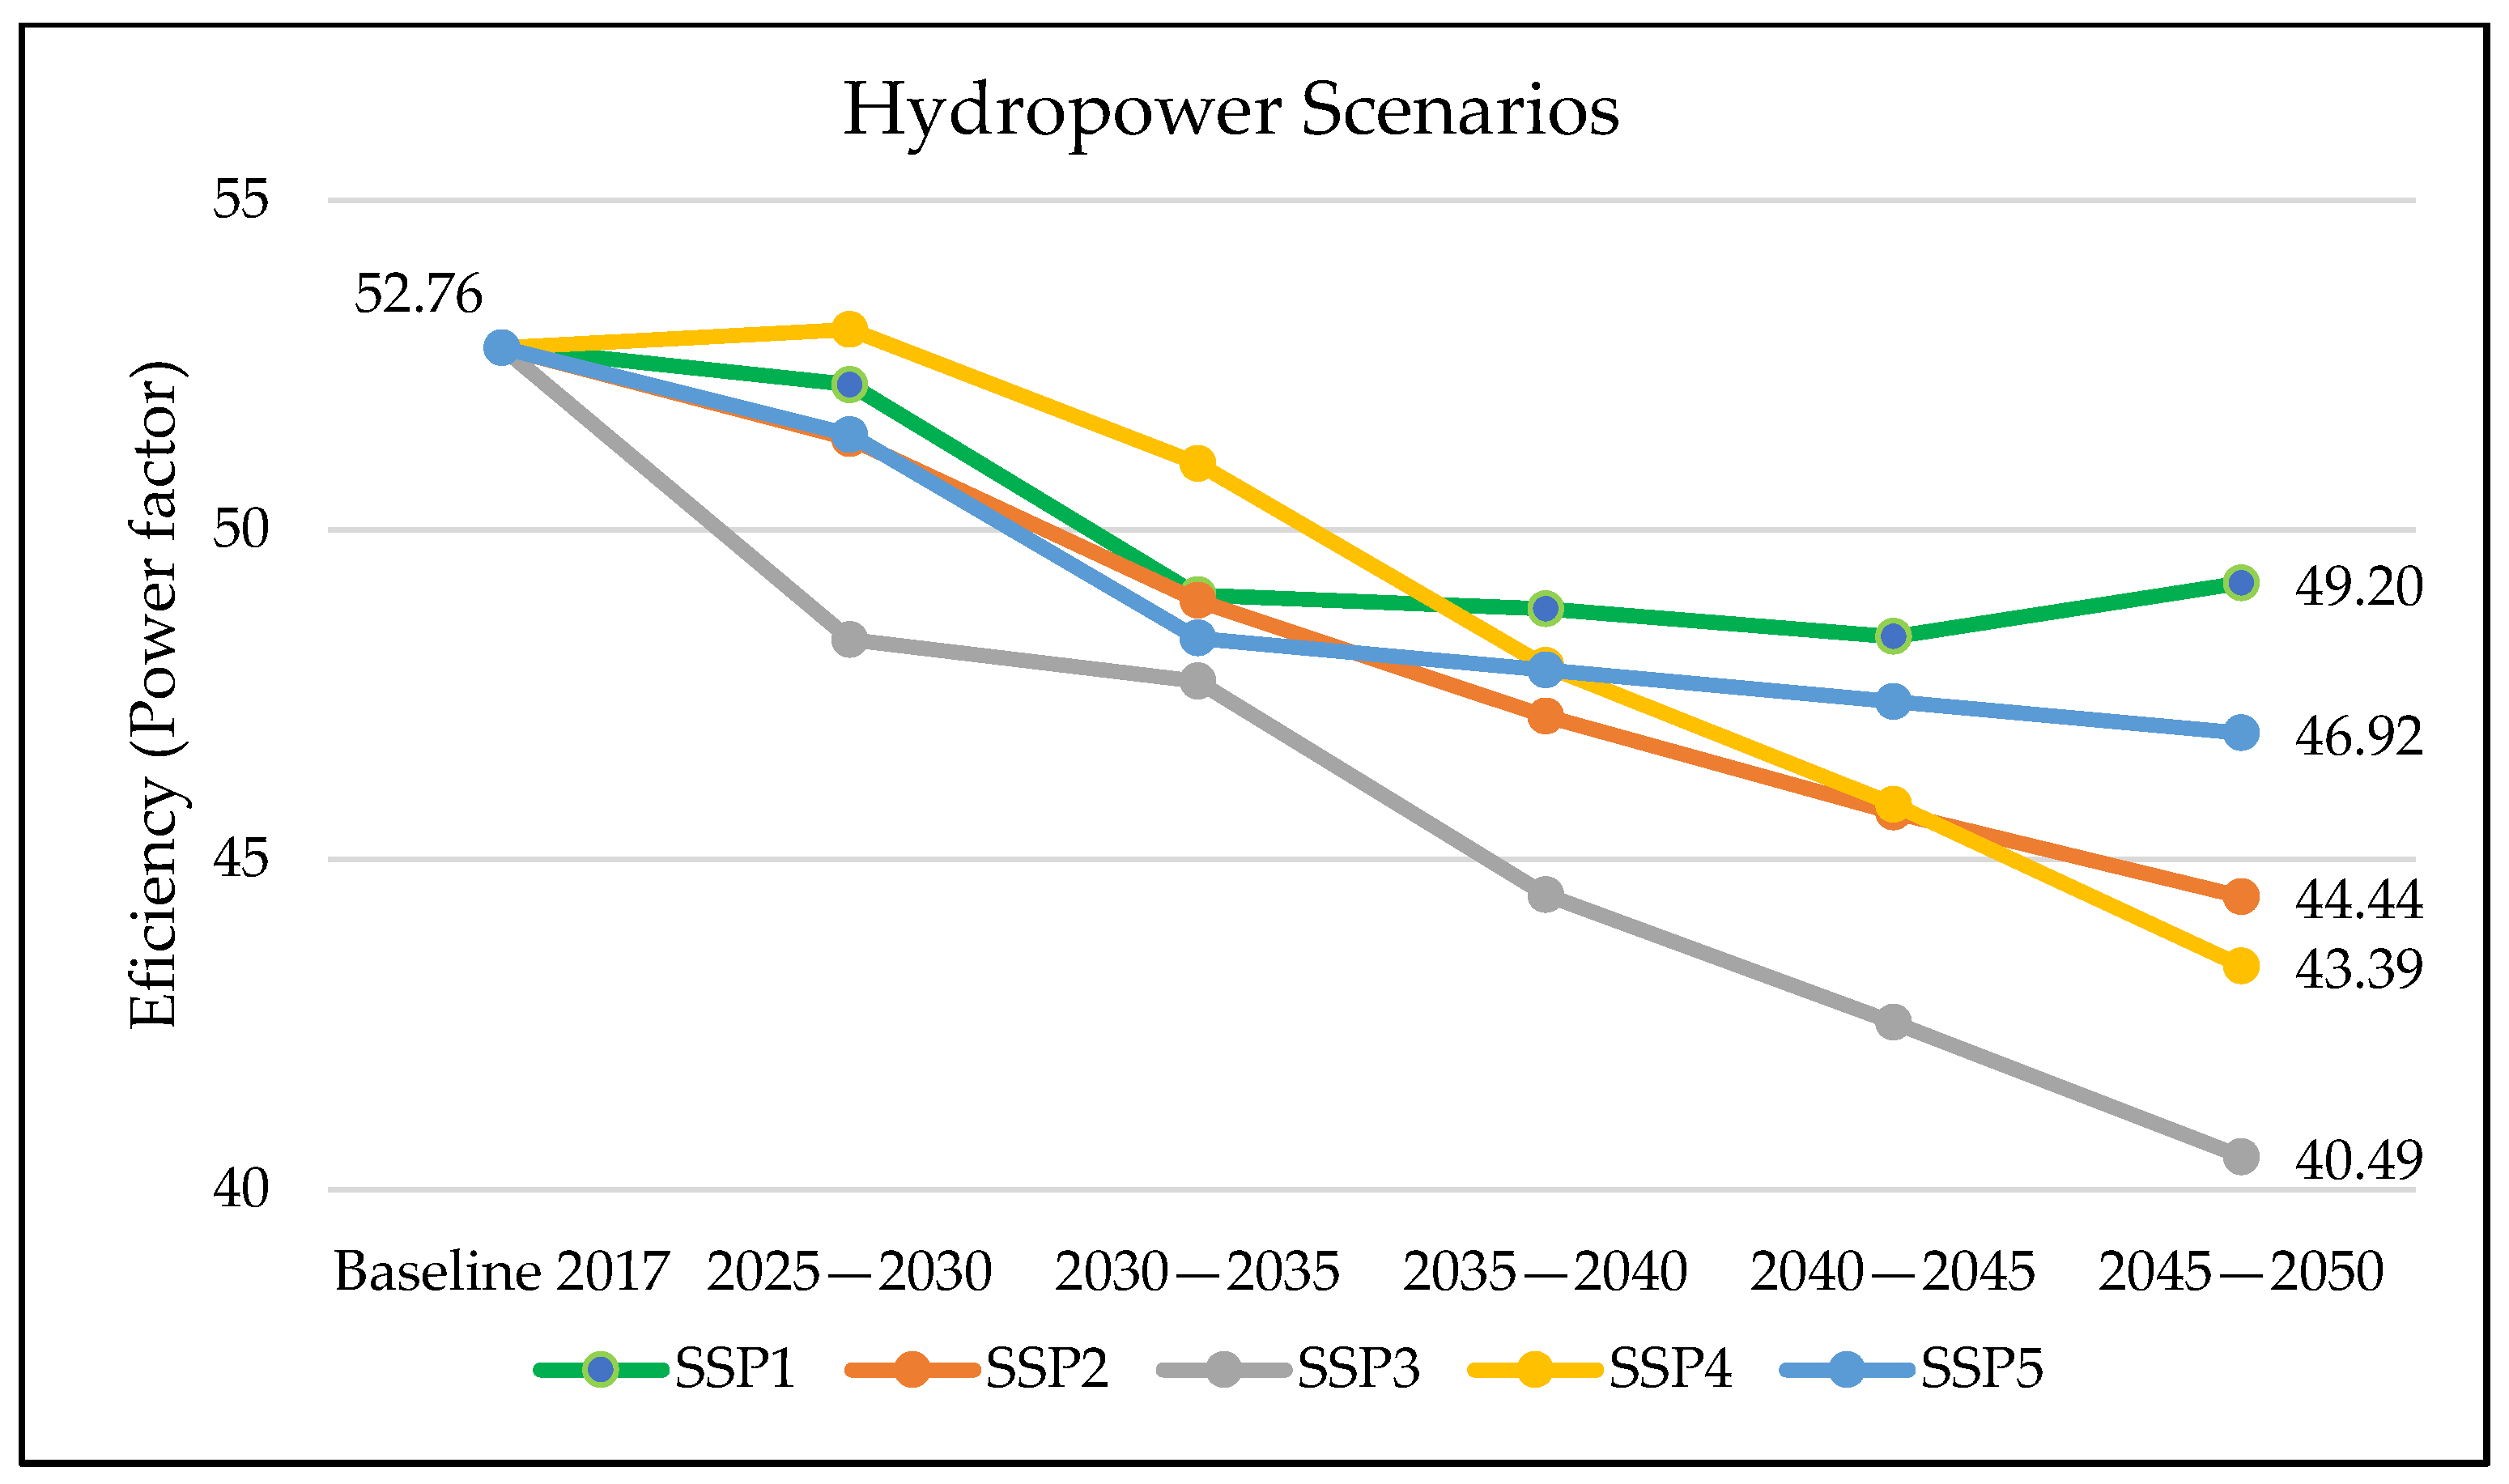
3.1.2. Output Data
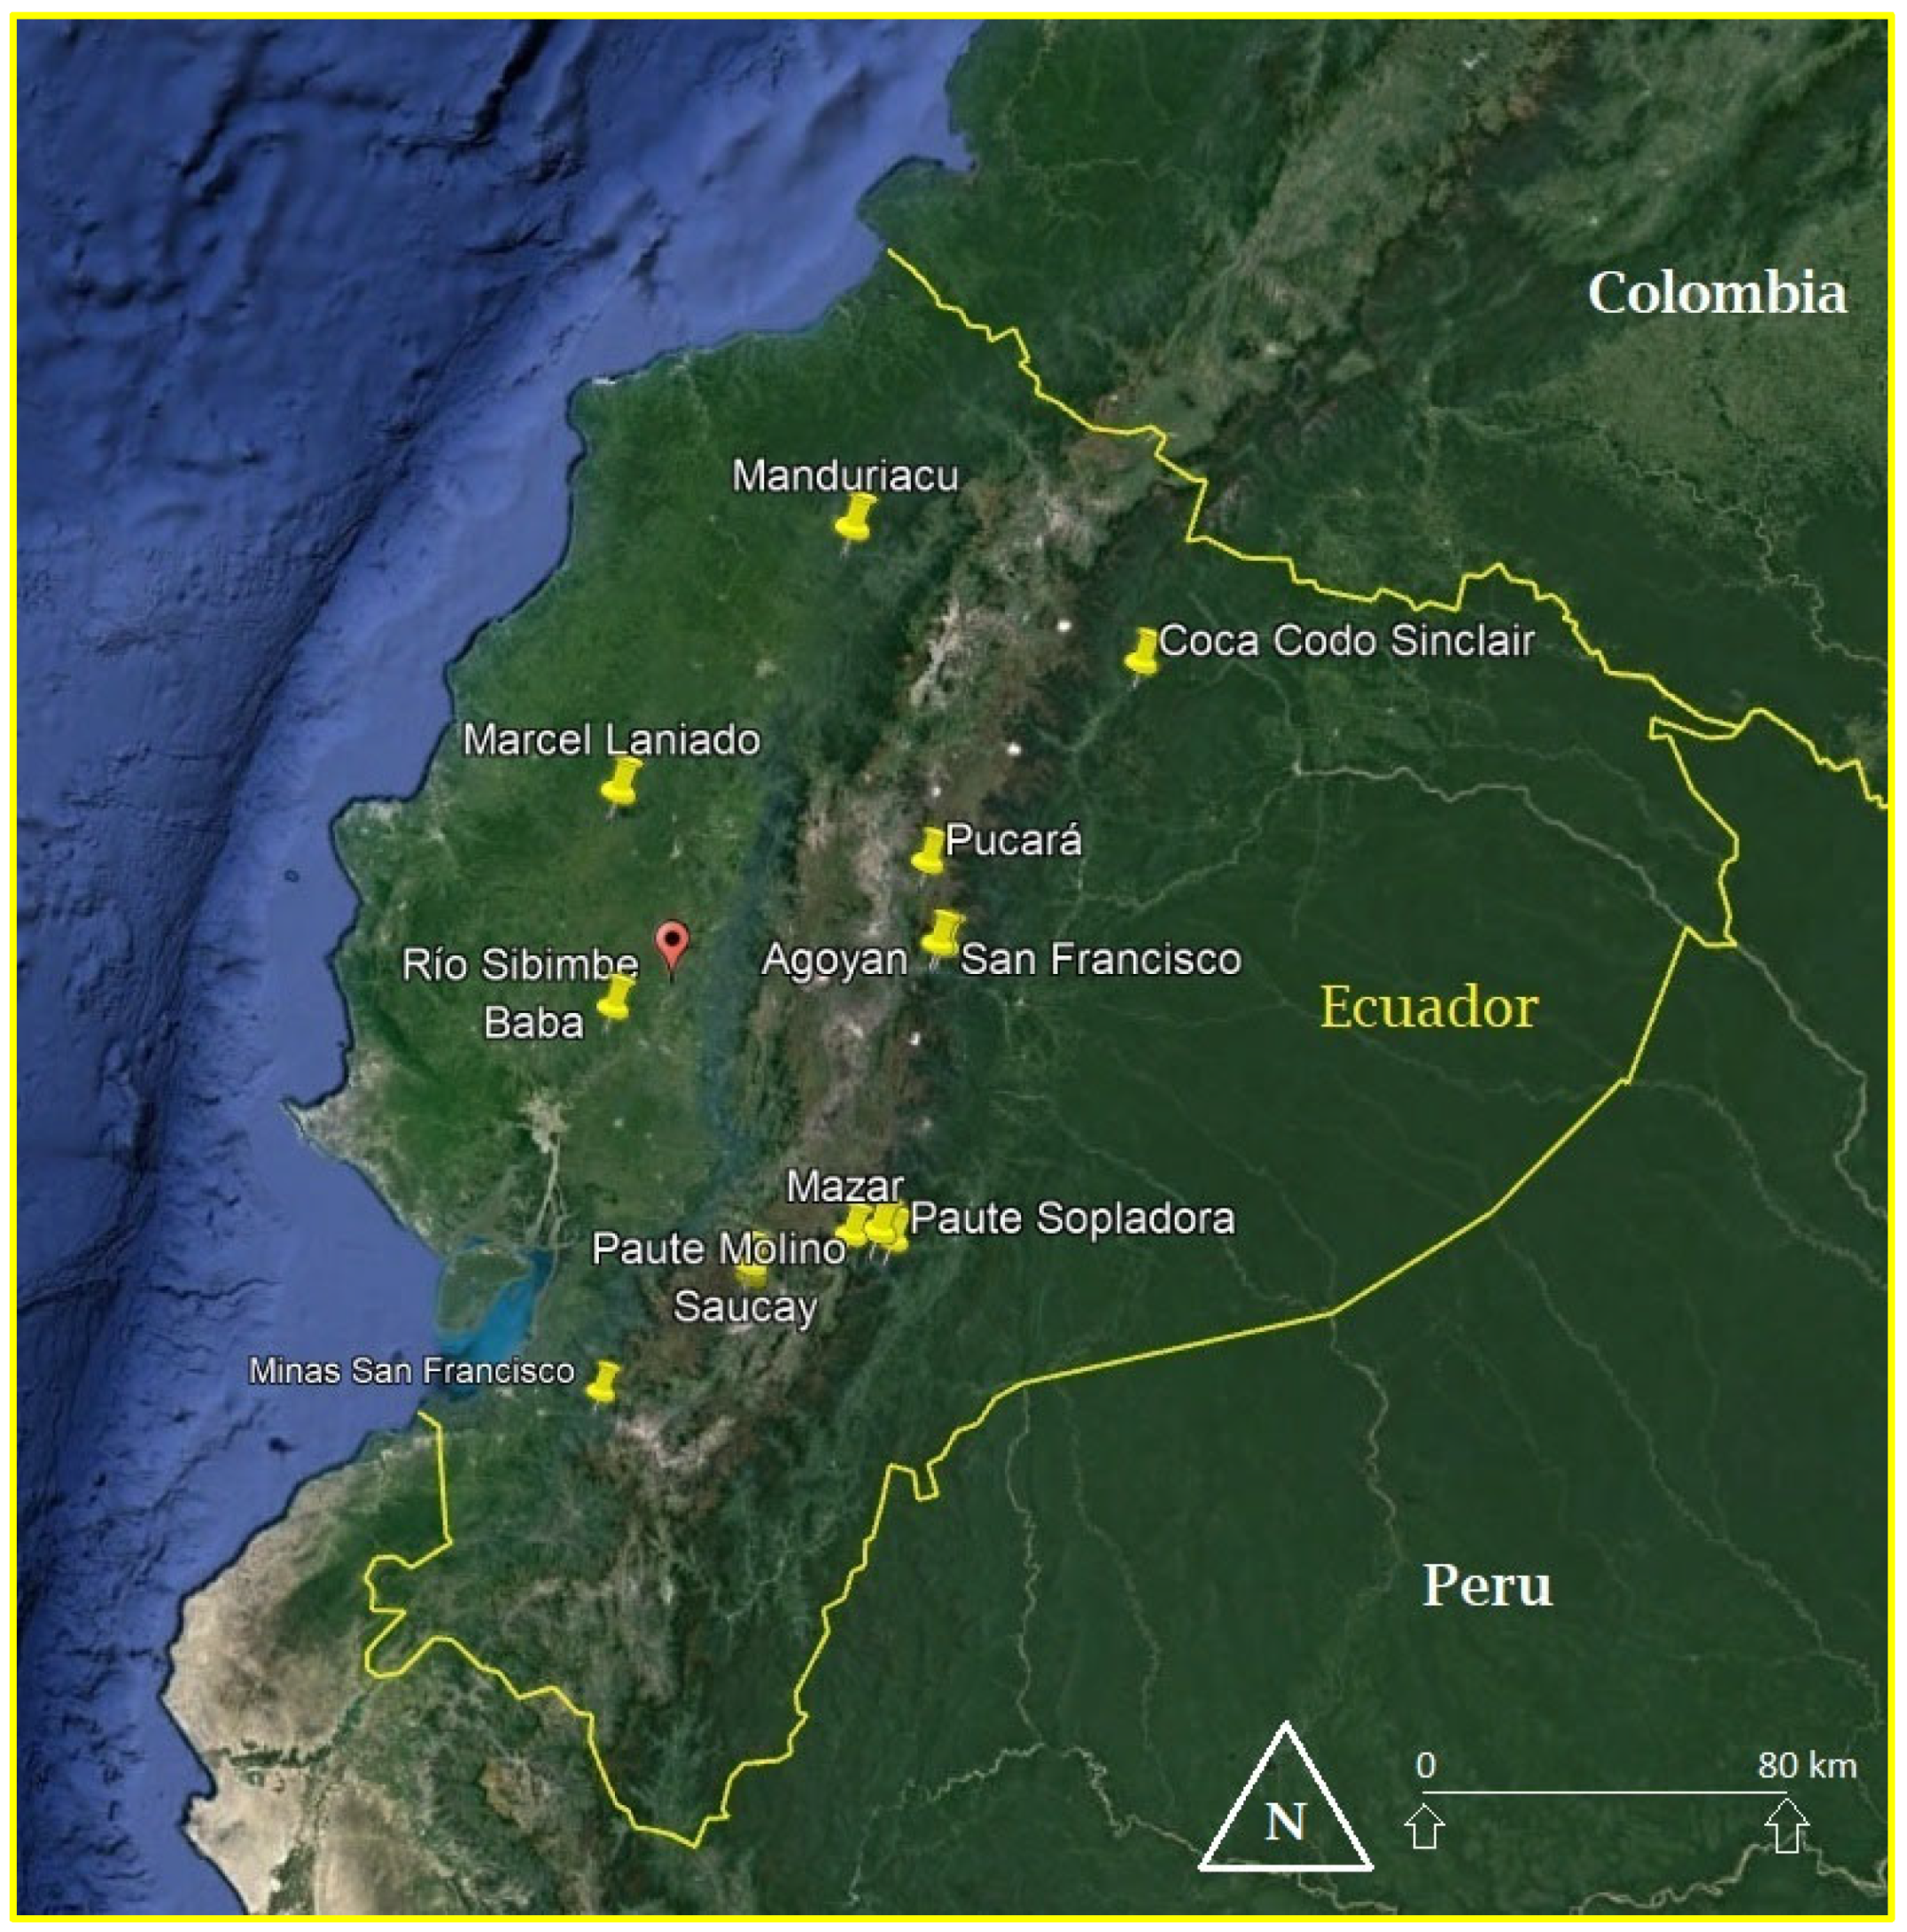
3.2. The Ecuadorian Projection
4. Discussion
5. Conclusions
Author Contributions
Funding
Institutional Review Board Statement
Informed Consent Statement
Data Availability Statement
Acknowledgments
Conflicts of Interest
Appendix A

| No. | Region | Large Hydropower Plants (%) | Small Hydropower Plants (%) | ||
|---|---|---|---|---|---|
| 2010–2015 | 2016–2020 | 2010–2015 | 2016–2020 | ||
| 1 | Africa | 47 | 55 | 56 | 55 |
| 2 | Brazil | 61 | 45 | 63 | 56 |
| 3 | Central America | 48 | 53 | 59 | - |
| 4 | China | 45 | 47 | 46 | 38 |
| 5 | Eurasia | 43 | 42 | 58 | 61 |
| 6 | Europe | 41 | 33 | 48 | 44 |
| 7 | India | 47 | 42 | 50 | 57 |
| 8 | Rest of Asia | 46 | 50 | 80 | 54 |
| 9 | Rest of South America | 62 | 60 | 65 | - |
| Average | 48.89 | 47.44 | 58.33 | 52.14 | |
| Variation (%) | −3.0% | −11.9% | |||
| Average | −7.45% | ||||
References
- Johnson, N.; Burek, P.; Byers, E.; Falchetta, G.; Flörke, M.; Fujimori, S.; Havlik, P.; Hejazi, M.; Hunt, J.; Krey, V.; et al. Integrated solutions for the water-energy-land nexus: Are global models rising to the challenge? Water 2019, 11, 2223. [Google Scholar] [CrossRef] [Green Version]
- Eloranta, A.P.; Finstad, A.G.; Helland, I.P.; Ugedal, O.; Power, M. Hydropower impacts on reservoir fish populations are modified by environmental variation. Sci. Total Environ. 2018, 618, 313–322. [Google Scholar] [CrossRef] [PubMed]
- Cabrera, S.; Eurie Forio, M.A.; Lock, K.; Vandenbroucke, M.; Oña, T.; Gualoto, M.; Goethals, P.L.M.; van der Heyden, C. Variations in benthic macroinvertebrate communities and biological quality in the aguarico and coca river basins in the ecuadorian amazon. Water 2021, 13, 1692. [Google Scholar] [CrossRef]
- Naranjo-Silva, S.; del Castillo, J.A. The American Continent hydropower development and the Sustainability: A Review. Int. J. Eng. Sci. Technol. 2022, 6, 66–79. [Google Scholar] [CrossRef]
- International Energy Agency. Hydropower Special Market Report. In Analysis and Forecast to 2030; International Energy Agency: Paris, France, 2022. [Google Scholar]
- Lohrmann, A.; Child, M.; Breyer, C. Assessment of the water footprint for the European power sector during the transition towards a 100% renewable energy system. Energy 2021, 233, 121098. [Google Scholar] [CrossRef]
- Llamosas, C.; Sovacool, B.K. The future of hydropower? A systematic review of the drivers, benefits and governance dynamics of transboundary dams. Renew. Sustain. Energy Rev. 2021, 137, 110–124. [Google Scholar] [CrossRef]
- Hamududu, B.; Killingtveit, A. Assessing climate change impacts on global hydropower. Energies 2012, 5, 305–322. [Google Scholar] [CrossRef] [Green Version]
- Briones Hidrovo, A.; Uche, J.; Martínez-Gracia, A. Determining the net environmental performance of hydropower: A new methodological approach by combining life cycle and ecosystem services assessment. Sci. Total Environ. 2020, 712, 44. [Google Scholar] [CrossRef] [PubMed]
- Naranjo-Silva, S.; Punina, J.; Del Castillo, J.Á. Comparative cost per kilowatt of the latest hydropower projects in Ecuador. InGenio J. 2022, 5, 22–34. [Google Scholar] [CrossRef]
- Escribano, G. Ecuador’s energy policy mix: Development versus conservation and nationalism with Chinese loans. Energy Policy 2013, 57, 152–159. [Google Scholar] [CrossRef]
- Ponce-Jara, M.A.; Castro, M.; Pelaez-Samaniego, M.R.; Espinoza-Abad, J.L.; Ruiz, E. Electricity sector in Ecuador: An overview of the 2007–2017 decade. Energy Policy 2018, 113, 513–522. [Google Scholar] [CrossRef]
- Reyes, P.; Procel, S.; Sevilla, J.; Cabero, A.; Orozco, A.; Córdova, J.; Lima, F.; Vasconez, F. Exceptionally uncommon overburden collapse behind a natural lava dam: Abandonment of the San-Rafael Waterfall in northeastern Ecuador. J. South Am. Earth Sci. 2021, 110, 103353. [Google Scholar] [CrossRef]
- Carvajal, P.E.; Li, F.G.N. Challenges for hydropower-based national determined contributions: A case study for Ecuador. Clim. Policy 2019, 19, 974–987. [Google Scholar] [CrossRef]
- Ministry of Energy and Non-Renewable Resources of Ecuador. National Energy Efficiency Plan. 2018. Available online: https://www.celec.gob.ec/hidroagoyan/images/PLANEE_INGLES/NationalEnergyEfficiencyPlan20162035_2017-09-01_16-00-26.html (accessed on 1 September 2022).
- Carvajal, P.E.; Li, F.G.N.; Soria, R.; Cronin, J.; Anandarajah, G.; Mulugetta, Y. Large hydropower, decarbonisation and climate change uncertainty: Modelling power sector pathways for Ecuador. Energy Strategy Rev. 2019, 23, 86–99. [Google Scholar] [CrossRef]
- CELEC. CELEC EP Genera y Transmite más del 90 por Ciento de la Energía Eléctrica Limpia que Consume el País y Exporta a los Países Vecinos. 2020. Available online: https://www.celec.gob.ec/gensur/noticias/celec-ep-produce-el-90-de-la-energia-que-consume-el-pais/ (accessed on 22 May 2021).
- Ministry of Environment Water and Ecological Transition of Ecuador. First Contribution Determined at the National Level to the Paris Agreement under the United Nations Framework Convention on Climate Change; Ministry of Environment Water and Ecological Transition of Ecuador: Quito, Ecuador, 2019.
- Vaca-Jiménez, S.; Gerbens-Leenes, P.W.; Nonhebel, S. The water footprint of electricity in Ecuador: Technology and fuel variation indicate pathways towards water-efficient electricity mixes. Water Resour. Ind. 2019, 22, 100112. [Google Scholar] [CrossRef]
- Hasan, M.M.; Wyseure, G. Impact of climate change on hydropower generation in Rio Jubones Basin, Ecuador. Water Sci. Eng. 2018, 11, 157–166. [Google Scholar] [CrossRef]
- Mayeda, A.M.; Boyd, A.D. Factors influencing public perceptions of hydropower projects: A systematic literature review. Renew. Sustain. Energy Rev. 2020, 121, 109713. [Google Scholar] [CrossRef]
- Sahu, N.; Sayama, T.; Saini, A.; Panda, A.; Takara, K. Understanding the hydropower and potential climate change impact on the himalayan river regimes—A study of local perceptions and responses from himachal pradesh, india. Water 2020, 12, 2739. [Google Scholar] [CrossRef]
- Intergovernmental Panel on Climate Change. IPCC AR6 Working Group II Report; Intergovernmental Panel on Climate Change: Geneva, Switzerland, 2021. [Google Scholar]
- Uamusse, M.M.; Tussupova, K.; Persson, K.M. Climate change effects on hydropower in Mozambique. Appl. Sci. 2020, 10, 4842. [Google Scholar] [CrossRef]
- Edenhofer, O.; Madruga, R.P.; Sokona, Y.; Seyboth, K.; Matschoss, P.; Kadner, S.; Zwickel, T.; Eickemeier, P.; Hansen, G.; Schlömer, S.; et al. Renewable Energy Sources and Climate Change Mitigation: Special Report of the Intergovernmental Panel on Climate Change; Cambridge University Press: Cambridge, UK, 2011. [Google Scholar]
- IPCC-IPBES. Scientific Outcome—Biodiversity and Climate Change; IPCC-IPBES: Geneva, Switzerland, 2020. [Google Scholar]
- IPCC; Alley, R.B.; Berntsen, T.; Bindoff, N.L.; Chen, Z.; Chidthaisong, A.; Friedlingstein, P.; Gregory, J.M.; Hegerl, G.C.; Heimann, M.; et al. Resumen para Políticas Responsables de los Expertos sobre Cambio Climático; IPCC: New York, NY, USA, 2007. [Google Scholar]
- International Renewable Energy Agency. Renewable Energy Statistics 2020; Renewable hydropower (including mixed plants); International Renewable Energy Agency: Masdar City, United Arab Emirates, 2020. [Google Scholar]
- Sun, L.; Cai, Y.; Chen, A.; Zamora, D.; Jaramillo, F. Water footprint and consumption of hydropower from basin-constrained water mass balance. Adv. Water Resour. 2021, 153, 103947. [Google Scholar] [CrossRef]
- Filho, G.L.T.; Silva dos Santos, I.F.; Barros, R.M. Cost estimate of small hydroelectric power plants based on the aspect factor. Renew. Sustain. Energy Rev. 2017, 77, 229–238. [Google Scholar] [CrossRef]
- International Energy Agency. Renewables, Analysis and Forecast to 2025; International Energy Agency: Paris, France, 2020; Volume 74, pp. 56–57. [Google Scholar] [CrossRef]
- O’Neill, B.C.; Kriegler, E.; Ebi, K.L.; Kemp-Benedict, E.; Riahi, K.; Rothman, D.S.; van Ruijven, B.J.; van Vuuren, D.P.; Birkmann, J.; Kok, K.; et al. The roads ahead: Narratives for shared socioeconomic pathways describing world futures in the 21st century. Glob. Environ. Change 2017, 42, 169–180. [Google Scholar] [CrossRef] [Green Version]
- Bongio, M.; Avanzi, F.; de Michele, C. Hydroelectric power generation in an Alpine basin: Future water-energy scenarios in a run-of-the-river plant. Adv. Water Resour. 2016, 94, 318–331. [Google Scholar] [CrossRef]
- Calderón, S.; Alvarez, A.C.; Loboguerrero, A.M.; Arango, S.; Calvin, K.; Kober, T.; Daenzer, K.; Fisher-Vanden, K. Achieving CO2 reductions in Colombia: Effects of carbon taxes and abatement targets. Energy Econ. 2014, 56, 575–586. [Google Scholar] [CrossRef] [Green Version]
- Ministry of Energy and Non-Renewable Resources of Ecuador. Master Plan of Electricity 2019–2027; Ministry of Energy and Non-Renewable Resources of Ecuador: Quito, Ecuador, 2019.
- Rivera-González, L.; Bolonio, D.; Mazadiego, L.F.; Naranjo-Silva, S.; Escobar-Segovia, K. Long-term forecast of energy and fuels demand towards a sustainable road transport sector in Ecuador (2016–2035): A LEAP model application. Sustainability 2020, 12, 472. [Google Scholar] [CrossRef] [Green Version]
- Agency for the Regulation and Control of Energy and Non-Renewable Natural Resources of Ecuador. Statistical Information System for the Electricity Sector of Ecuador. In Statistics of the Ecuadorian Electricity Sector; 2023. Available online: https://www.controlrecursosyenergia.gob.ec/estadisticas-del-sector-electrico-ecuatoriano-buscar/ (accessed on 31 May 2023).
- Open Street Map. Location of Ecuadorian Hydroelectric Plants. 2022. Available online: https://www.openstreetmap.org/note/2721104#map=6/-0.754/-73.334 (accessed on 13 February 2023).
- Hartmann, J. Climate Change and Hydropower Training Manual; AICCA Project; Ministry of the Environment and Water of Ecuador—CONDESAN: Singapore, 2020.
- Ministry of Energy and Non-Renewable Resources of Ecuador. The Gained Decade of the Electricity Sector in Ecuador; Ministry of Energy and Non-Renewable Resources of Ecuador: Quito, Ecuador, 2017.
- Poveda-Burgos, G.; Castañeda, Z.N.F.; Flores, E.Á.E.; Molina, K.R.; Ruiz, J.G. Desarrollo local de la nueva matriz energética en el Ecuador desde Coca Codo Sinclair. Oidles 2017, 22, 114–144. [Google Scholar]
- The World Bank. Population Estimates and Projections. 2021. Available online: https://databank.worldbank.org/source/population-estimates-and-projections (accessed on 3 January 2023).
- The World Bank. GDP per Capita (current US$). 2021. Available online: https://data.worldbank.org/indicator/NY.GDP.PCAP.CD?end=2020&locations=BR-EC-CO&start=2000&view=chart (accessed on 3 January 2023).
- Ministry of Energy and Non-Renewable Resources of Ecuador. Atlas of the Ecuadorian Electricity Sector; Ministry of Energy and Non-Renewable Resources of Ecuador: Quito, Ecuador, 2017.
- Villamar, D.; Soria, R.; Rochedo, P.; Szklo, A.; Imperio, M.; Carvajal, P.; Schaeffer, R. Long-term deep decarbonisation pathways for Ecuador: Insights from an integrated assessment model. Energy Strategy Rev. 2021, 35, 100637. [Google Scholar] [CrossRef]
- Lucena, A.F.P.; Hejazi, M.; Vasquez-Arroyo, E.; Turner, S.; Köberle, A.C.; Daenzer, K.; Rochedo, P.R.R.; Kober, T.; Cai, Y.; Beach, R.H.; et al. Interactions between climate change mitigation and adaptation: The case of hydropower in Brazil. Energy 2018, 164, 1161–1177. [Google Scholar] [CrossRef] [Green Version]
- Villamar, D.; Soria, R.; Império, M.; Carvajal, P. Deep Decarbonizatoin Pathways in Latin America and the Caribbean—A case study in Ecuador. In Proceedings of the 7th ELAEE Buenos Aires 2019 Decarbonization, Efficiency and Affordability: New Energy Markets in Latin America, Buenos Aires, Argentina, 9 March 2019; pp. 1–9. [Google Scholar]
- Riahi, K.; van Vuuren, D.P.; Kriegler, E.; Edmonds, J.; O’Neill, B.C.; Fujimori, S.; Bauer, N.; Calvin, K.; Dellink, R.; Fricko, O.; et al. The Shared Socioeconomic Pathways and their energy, land use, and greenhouse gas emissions implications: An overview. Glob. Environ. Chang. 2017, 42, 153–168. [Google Scholar] [CrossRef] [Green Version]
- Choudhury, N.B.; Dey Choudhury, S.R. Implications for planning of hydroelectric projects in Northeast India: An analysis of the impacts of the Tipaimukh project. GeoJournal 2020, 8, 21. [Google Scholar] [CrossRef]
- Yao, Y.; Qu, W.; Lu, J.; Cheng, H.; Pang, Z.; Lei, T.; Tan, Y. Responses of hydrological processes under different shared socioeconomic pathway scenarios in the Huaihe river basin, China. Water 2021, 13, 1053. [Google Scholar] [CrossRef]
- Naranjo-Silva, S.; del Castillo, J.Á. Hydropower: Projections in a changing climate and impacts by this “clean” source. CienciAmérica 2021, 10, 32. [Google Scholar] [CrossRef]
- Hofstra, N.; Kroeze, C.; Flörke, M.; van Vliet, M.T. Editorial overview: Water quality: A new challenge for global scale model development and application. Curr. Opin. Environ. Sustain. 2019, 36, A1–A5. [Google Scholar] [CrossRef]
- Killingtveit, A. Hydropower. In Managing Global Warming: An Interface of Technology and Human Issues; Elsevier: Amsterdam, The Netherlands, 2018; pp. 265–315. [Google Scholar] [CrossRef]
- Denisov, S.E.; Denisova, M.V. Analysis of Hydropower Potential and the Prospects of Developing Hydropower Engineering in South Ural of the Russian Federation. Procedia Eng. 2017, 206, 881–885. [Google Scholar] [CrossRef]
- International Renewable Energy Agency. Renewable Power Generation Costs in 2020; International Renewable Energy Agency: Abu Dhabi, United Arab Emirates, 2021. [Google Scholar]
- Llerena-Montoya, S.; Velastegui-Montoya, A.; Zhirzhan-Azanza, B.; Herrera-Matamoros, V.; Adami, M.; de Lima, A.; Moscoso-Silva, F.; Encalada, L. Multitemporal analysis of land use and land cover within an oil block in the Ecuadorian Amazon. ISPRS Int. J. Geo-Inf. 2021, 10, 191. [Google Scholar] [CrossRef]
- Carvajal, P.E.; Anandarajah, G.; Mulugetta, Y.; Dessens, O. Assessing uncertainty of climate change impacts on long-term hydropower generation using the CMIP5 ensemble—The case of Ecuador. Clim. Chang. 2017, 144, 611–624. [Google Scholar] [CrossRef] [Green Version]
- Vaca-Jiménez, S.; Gerbens-Leenes, P.W.; Nonhebel, S. The monthly dynamics of blue water footprints and electricity generation of four types of hydropower plants in Ecuador. Sci. Total Environ. 2020, 713, 136579. [Google Scholar] [CrossRef]
- Parra, R. Contribution of Non-Renewable Sources for Limiting the Electrical CO2 Emission Factor in Ecuador. WIT Trans. Ecol. Environ. 2020, 244, 65–77. [Google Scholar] [CrossRef]
- Guerra, O.J.; Tejada, D.A.; Reklaitis, G.V. Climate change impacts and adaptation strategies for a hydro-dominated power system via stochastic optimization. Appl. Energy 2019, 233–234, 584–598. [Google Scholar] [CrossRef]
- Arango-Aramburo, S.; Turner, S.W.D.; Daenzer, K.; Ríos-Ocampo, J.P.; Hejazi, M.I.; Kober, T.; Álvarez-Espinosa, A.C.; Romero-Otalora, G.D.; van der Zwaan, B. Climate impacts on hydropower in Colombia: A multi-model assessment of power sector adaptation pathways. Energy Policy 2019, 128, 179–188. [Google Scholar] [CrossRef]
- The World Bank. The World Bank Analyzes of Vietnam Sustainable Development Sector; The World Bank: Washington, DC, USA, 2011. [Google Scholar]
- Aroonrat, K.; Wongwises, S. Current status and potential of hydro energy in Thailand: A review. Renew. Sustain. Energy Rev. 2015, 46, 70–78. [Google Scholar] [CrossRef]
- Chiang, J.L.; Yang, H.C.; Chen, Y.R.; Lee, M.H. Potential impact of climate change on hydropower generation in southern Taiwan. Energy Procedia 2013, 40, 34–37. [Google Scholar] [CrossRef] [Green Version]
- Ardizzon, G.; Cavazzini, G.; Pavesi, G. A new generation of small hydro and pumped-hydro power plants: Advances and future challenges. Renew. Sustain. Energy Rev. 2014, 31, 746–761. [Google Scholar] [CrossRef]
- Cavazzini, G.; Santolin, A.; Pavesi, G.; Ardizzon, G. Accurate estimation model for small and micro hydropower plants costs in hybrid energy systems modelling. Energy 2016, 103, 746–757. [Google Scholar] [CrossRef]


| Hydropower Projects | Power Factor (%) | 2010–2015 Average | 2016–2020 Average | ||||||||||
|---|---|---|---|---|---|---|---|---|---|---|---|---|---|
| 2010 | 2011 | 2012 | 2013 | 2014 | 2015 | 2016 | 2017 | 2018 | 2019 | 2020 | |||
| Agoyán | 66.95 | 68.43 | 72.05 | 74.17 | 71.46 | 80.55 | 72.63 | 70.00 | 65.77 | 71.49 | 69.11 | 72.3 | 69.80 |
| Baba | - | - | - | - | - | - | 42.50 | 36.00 | 28.25 | 41.00 | 46.02 | - | 38.75 |
| Coca Codo Sinclair | - | - | - | - | - | - | 48.51 | 45.00 | 46.59 | 48.05 | 51.91 | - | 48.01 |
| Manduriacu | - | - | - | - | - | 42.59 | 57.04 | 64.35 | 56.00 | 64.05 | 66.57 | 42.6 | 61.60 |
| Marcel Laniado | 41.47 | 35.23 | 56.33 | 44.64 | 50.82 | 55.73 | 60.89 | 58.17 | 48.34 | 63.37 | 46.40 | 47.4 | 55.43 |
| Minas San Francisco | - | - | - | - | - | - | - | - | - | 41.90 | 42.46 | - | 42.18 |
| Paute Mazar | - | 63.52 | 65.58 | 43.44 | 50.98 | 55.78 | 51.13 | 48.44 | 46.37 | 52.21 | 45.14 | 55.9 | 48.66 |
| Paute Molino | 42.02 | 60.70 | 64.25 | 54.43 | 55.73 | 64.39 | 54.81 | 48.07 | 51.13 | 58.22 | 53.94 | 56.9 | 53.23 |
| Paute Sopladora | - | - | - | - | - | - | 27.65 | 52.11 | 50.04 | 56.38 | 57.41 | - | 48.72 |
| Pucará | - | 24.37 | 6.85 | 29.46 | 40.36 | 47.35 | 43.07 | 31.18 | 33.24 | 39.28 | 37.90 | 29.7 | 36.93 |
| San Francisco | 56.05 | 49.05 | 69.81 | 75.10 | 71.50 | 80.03 | 61.80 | 52.39 | 41.23 | 55.41 | 66.89 | 66.9 | 55.54 |
| Saucay | 48.36 | 68.17 | 66.43 | 54.85 | 56.14 | 67.87 | 55.47 | 52.58 | 47.73 | 51.49 | 54.28 | 60.3 | 52.31 |
| Sayamirin | 56.60 | 77.22 | 76.53 | 63.43 | 64.35 | 73.85 | 63.97 | 60.34 | 57.49 | 25.50 | 40.08 | 68.7 | 49.48 |
| Sibimbe | 63.26 | 70.26 | 66.21 | 56.40 | 67.20 | 72.88 | 67.00 | 67.29 | 54.99 | 64.42 | 66.04 | 66.0 | 63.95 |
| Average | 53.04 | 56.67 | 51.76 | ||||||||||
| No. | Pathway | Global Context | Definitions |
|---|---|---|---|
| 1 | SSP2 | This model assumed that the social, economic, and technological trends will remain the same as those in historical patterns, leading to a large GDP growth, which may take more work to maintain consistently over the next few decades. The degree of inequality was maintained, but some nations are making relatively good progress, whereas others need to meet expectations. | The intermediate scenario of challenges is the moderate projection |
| 2 | SSP4 | The evolutionary line produces large challenges for adaptation and low challenges for mitigation; it represents a mixed tendency and is a fragmented projection guided by various changes and presents a difficult path to meet the global goals of maintaining the temperature and socioeconomic development as a result of economic slowdown, material-intensive consumption, and slow economic growth. | Large global changes but development is fragmented |
| 3 | SSP5 | It has large challenges for mitigation, low challenges for adaptation, and energy demand is high in the absence of climate policy, and carbon-based fuels meet most of this demand due to the need for climate policies. This pathway incorporates convenient occasional partnerships, and the government leadership has proposed planning for climate change that needs to be more comprehensive. | Mitigation challenges dominate |
| Average | 2010–2020 | SPP5 Scenario to 2050 | SPP2 Scenario to 2050 | SPP4 Scenario to 2050 |
|---|---|---|---|---|
| 14 Hydropower projects | 53.04 | 46.92 (−6.12) | 44.44 (−8.6) | 43.39 (−9.65) |
| Percentage variation 2010–2020 vs. SPP projections | - | −11.5% | −16.2% | −18.2% |
Disclaimer/Publisher’s Note: The statements, opinions and data contained in all publications are solely those of the individual author(s) and contributor(s) and not of MDPI and/or the editor(s). MDPI and/or the editor(s) disclaim responsibility for any injury to people or property resulting from any ideas, methods, instructions or products referred to in the content. |
© 2023 by the authors. Licensee MDPI, Basel, Switzerland. This article is an open access article distributed under the terms and conditions of the Creative Commons Attribution (CC BY) license (https://creativecommons.org/licenses/by/4.0/).
Share and Cite
Naranjo-Silva, S.; Punina-Guerrero, D.; Rivera-Gonzalez, L.; Escobar-Segovia, K.; Barros-Enriquez, J.D.; Almeida-Dominguez, J.A.; Alvarez del Castillo, J. Hydropower Scenarios in the Face of Climate Change in Ecuador. Sustainability 2023, 15, 10160. https://doi.org/10.3390/su151310160
Naranjo-Silva S, Punina-Guerrero D, Rivera-Gonzalez L, Escobar-Segovia K, Barros-Enriquez JD, Almeida-Dominguez JA, Alvarez del Castillo J. Hydropower Scenarios in the Face of Climate Change in Ecuador. Sustainability. 2023; 15(13):10160. https://doi.org/10.3390/su151310160
Chicago/Turabian StyleNaranjo-Silva, Sebastian, Diego Punina-Guerrero, Luis Rivera-Gonzalez, Kenny Escobar-Segovia, Jose David Barros-Enriquez, Jorge Armando Almeida-Dominguez, and Javier Alvarez del Castillo. 2023. "Hydropower Scenarios in the Face of Climate Change in Ecuador" Sustainability 15, no. 13: 10160. https://doi.org/10.3390/su151310160