Abstract
An intensified farming system can significantly increase crop productivity but can also cause major groundwater overdraft for irrigation and the loss of crop diversity. It is imperative to develop alternative crop rotations beyond the simplified conventional winter wheat–summer maize (W–M) rotation for alleviating the groundwater over-extraction in China’s Huang-Huai Plain. This study systematically quantified crop water requirement (ETc) and irrigation water requirement (ETaw) of eight crops from 2013 to 2018 based on the SIMETAW model applied to the Shangqiu area in the Huang-Huai Plain. Fourteen crop rotations (CI (i.e., crop harvests per rotation cycle year) 1.5 or 2) were constructed based on the ROTAT model. Results showed that compared to W–M rotation, the alternative rotations (CI = 1.5) significantly reduced the annual ETc in wet, normal, and dry years by 9–21%. Replacing winter wheat in the double cropping system did not significantly decrease annual ETc. Wheat–soybean rotation had similar annual ETc and ETaw accompanied by higher economic output and equivalent yield about 1.2 times, with 9% more protein output than the W–M rotation. There were eight crop rotations having greater comprehensive evaluation index (CEI) than W–M rotation by Entropy-TOPSIS when considering 10 indicators including water requirements, yield, economic benefits, water use efficiency, energy, and nutritional values. Spring potato–summer soybean had the highest CEI of 0.627. Sweet potato and potato showed advantages when included in rotations by increasing yield. “Wheat–soybean”-based rotations (CI = 1.5) also performed well in profitability and protein output. Replacing summer maize with soybean is promising for profitability and nutrition output without increasing irrigation requirements. Therefore, decreasing the cropping index, or involving soybean or sweet potato in rotations can be a useful way to improve sustainable land use, save water, and ensure food products in this water stressed region.
1. Introduction
People face the grand challenge of how to produce sufficient food for a growing population under changing climate and environmental conditions [1]. Intensive agricultural management must maximize agricultural output [2]. Although intensive agriculture increased crop productivity in prior decades, it simplified production by lowering crop diversification, created higher uniformity of management practices, and created higher uniformity of agricultural landscapes [3]. Crop diversification has been proposed to enhance crop production [4], reduce groundwater over depletion [5], and improve system resilience [6].
The Huang-Huai Plain is one of the intensive agricultural regions in China, where winter wheat (Triticum aestivum L.) and summer maize (Zea mays L.) (W–M) rotation is the staple cropping system [7]. The majority of annual precipitation is concentrated in the summer maize growing season after winter wheat harvest, which has resulted in a chronic annual water deficit of 200–300 mm per year to support wheat growth [8]. Irrigation pumped from groundwater became a prerequisite for winter wheat production. Groundwater is responsible for approximately 70% of irrigation water use in this area [6,9]. Therefore, it is urgently imperative to build up new water-saving crop rotations to substitute on some land under conventional W–M rotation to mitigate further over-exploitation of groundwater and make crop production in this area more sustainable.
Diversified crop rotations have been applied in current agricultural production to improve crop diversity [10], and provide higher crop yields [11,12]. In the Northern Great Plains of the USA, diversified crop rotations improved wheat aboveground biomass 16–85%, increased preplant soil water 23–118%, and enhanced water productivity 28–61% compared to continuous wheat farming [13]. In India, diversified crop rotations significantly raised system productivity by 45% and profitability by 61% with lower energy consumption (5%) and carbon footprint (22%) compared to conventional pearl millet–wheat rotation [14]. Long-term diversified crop rotations with small grain cereals and cover crops in Canada mitigated maize water stress at the leaf and canopy scales and reduced yield losses to drought by 17% [15]. Garbelini et al. found that diversified crop rotations enhanced soybean yield and profit in Brazil [12]. A diversified crop rotation improved spring wheat yield by up to 30% in no-tillage and by 13% under plowing compared with monoculture [16]. In North China Plain (NCP), advantages of crop rotations included improving sustainability of groundwater use [17]. Yang et al. replaced the traditional W–M with alternative crop rotations that switched between shallow and deep rooted crops and found that promising to reduce groundwater depletion [5,18]. Wang et al. illustrated that diversified crop rotations changed soil indicators and improved wheat productivity [19]. Sun et al. suggested that critical irrigation combined with spring maize→W–M rotation could mitigate groundwater over-exploitation and ensure grain production [20]. Crop rotations involving three harvests in two years have been recommended to be better alternative rotations for water savings than the conventional W–M rotation, which could save 19–45% of the annual water consumption, with a grain yield loss of approximately 16% [21,22].
The multiple benefits of diversified crop rotations should be considered in the adjustment of planting structure toward sustainable land use. Sustainable food systems should provide adequate dietary nutrition, be resilient to climate changes, and limit resource needs and environmental impacts [6]. Zhang et al. reported that optimized planting structure could reduce water consumption up to 0.25 billion m3 [23]. Luo et al. suggested optimizing the planting structure by lowering high water-consumption crops planting, while coordinating the import of water resources (4.6–5.5 billion m3 yr−1) from China’s South-to-North Water Transfer project, which could achieve a balance between groundwater exploitation and replenishment and food production in the Beijing–Tianjin–Hebei region, China [24]. Davis et al. reported that crop production adjusted in India to include more coarse cereals like sorghum and millets, could make the food supply more nutritious, cut resource needs, lower greenhouse gas emissions, and improve climate resilience without sacrificing calorie yield or increasing farmland area [25]. An evolutionary multi-objective optimization analysis was conducted to determine how 30 different crop rotations practiced in the North China Plain could be combined regionally to improve balance among food products, profitability, and environmental costs [26]. Reasonable adjustment of planting structure and establishment of water-saving crop rotations is an important way to reduce agricultural water use in Huang-Huai Plain.
Few studies exist on alternative water-saving crop rotation establishment and comprehensive benefit evaluation considering grain production, nutrition, water use, and water productivity, specifically for the Shangqiu area, a typical groundwater depletion area within the Huang-Huai Plain. Therefore, this study aimed to (1) quantify the water requirements in the region for eight staple crops from 2013 to 2018, (2) configure alternative crop rotations taking into account the high precipitation coupling degree, (3) evaluate the multiple functions of alternative crop rotations comprehensively. This simulation provides background for assembling diversified crop rotations for water-stressed agricultural regions to ensure food sufficiency and enhance economic output and water use efficiency.
2. Materials and Methods
2.1. Study Area
This study was conducted for the Shangqiu area, located in the eastern part of Henan Province (33°43′–34°52′ N, 114°49′–116°39′ E) in the Huang-Huai Plain (Figure 1a). The dominant cropping system in this region is winter wheat–summer maize (W–M) double cropping system. The average annual precipitation from 2013 to 2018 was 615 mm, ranging from 355 to 786 mm (Figure 1b), with uneven distribution of precipitation during the year. The precipitation, mainly concentrated in May to September, accounts for about 69% of the annual precipitation, with the highest value in July (114 mm) and the lowest in January (6 mm) (Figure 1c). The average annual total radiation is 5022 MJ m−2—rich light resources. The average annual temperature is 15.4 °C, with the highest monthly average temperature in July (28.3 °C) and the lowest in January (2.2 °C). The soil texture at the 0–15, 15–30, 30–65, and 65–150 cm layers were loamy clay, clay, loamy clay, and sandy loam, respectively. The soil layer of 0–30 cm has soil organic matter of 9.8 g kg−1, available N of 0.78 mg kg−1, available phosphorus of 10.5 mg kg−1, and available potassium of 52.6 mg kg−1. The deep groundwater has been overdrafted during recent decades, resulting in a serious groundwater cone of depression in this area.
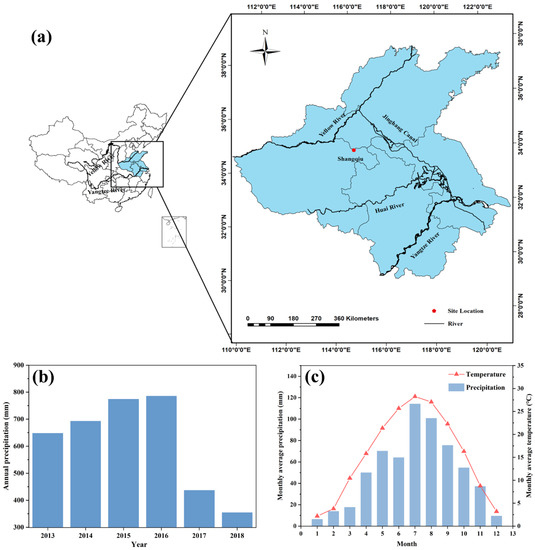
Figure 1.
Location of Shangqiu station in the Huang-Huai Plain (a) and annual precipitation (b) and average monthly precipitation and temperature (c) in Shangqiu from 2013 to 2018.
2.2. Data Sources
2.2.1. Meteorological Data
Daily meteorological data, including maximum temperature, minimum temperature, average temperature, average relative humidity, average wind speed, sunshine hours, and 24 h accumulated precipitation from 2013 to 2018 were selected from the China Meteorological Data Sharing Network (http://data.cma.cn/ accessed on 1 January 2021), as well as the values of geographical features (latitude, longitude, and altitude, etc.) of Shangqiu Station.
2.2.2. Crop and Crop Parameters
Eight crops were selected including winter wheat, summer maize, summer soybean, summer millet, autumn potato, spring potato, spring mung bean, and spring sweet potato. The parameters of each crop including sowing date, harvest date [27,28,29,30,31,32,33,34,35], protein content [36,37,38,39,40,41,42], and energy value [43,44,45] are shown in Table 1. Crop yield and sown area were obtained from the Henan Agricultural Statistical Yearbook [46].

Table 1.
Sowing and harvest date, protein content, and energy of the tested field crops.
2.3. Classification of Precipitation Year Type
In this study, the classification of wet year, normal year, and dry year were calculated as follows [47].
where is the ith year’s precipitation (mm), is the average annual precipitation (mm), δ is the standard deviation. The average annual precipitation from 2013 to 2018 was 615.5 ± 179.5 mm, the precipitation > 747.9 mm for wet years (2015 and 2016), 482.9 mm ≤ precipitation ≤ 747.9 mm for normal years (2013 and 2014), and precipitation < 482.9 mm for dry years (2017 and 2018).
2.4. Alternative Crop Rotations Establishment
Fourteen potential crop rotations including the conventional W–M rotation were defined using the ROTAT model [48] based on the selected eight crops, shown in Table 2. The crop rotation list was generated considering the local soil conditions, climate, water resources, and crop properties (including crop water requirement), crop growth timing and development traits, interactions between previous and succeeding crops, planting frequency, agronomic practices, crop attributes, and the duration to complete a rotation cycle. Meanwhile, exclusion screens were defined to drop agronomically infeasible crop successions and for farm-specific reasons, impractical or undesirable. The exclusions encode a quantitative and explicit indication of the expert knowledge. The final crop rotations newly built in this study included five within-year double cropping systems—CI = 2, cropping index (CI) as the number of crop harvests per year within a cropping system cycle—and nine multi-year crop rotations (CI = 1.5) (Table 2).
Table 2.
The new established crop rotations.
2.5. Calculation Method
(1) Crop water requirement:
The locally-parametrized SIMETAW (Simulation of Evapotranspiration of Applied Water) model [49,50,51] was used to quantify the water requirement in the growing season (ETc), effective precipitation in the growing season (Er), and irrigation water requirement in the growing season (ETaw) for eight selected crops in Shangqiu from 2013 to 2018. The SIMETAW model includes the Penman–Monteith equation for crop water requirements, as shown in Equation (2) [50]. This widely-applied model quantifies the water and irrigation requirements of staple crops such as maize, wheat, and cotton in the research area (e.g., [6]).
where ET0 is the reference crop evapotranspiration (mm·d−1); Rn is the net canopy surface radiation, (MJ m−2 d−1), G is the soil heat flux density (MJ m−2 d), T is the average temperature at 2 m height (°C), es is the saturation vapor pressure (kPa), ea is the actual vapor pressure (kPa), Δ is the slope of the saturation vapor pressure–temperature curve (kPa °C−1) is the psychrometric constant (kPa °C−1), and is the wind speed at 2 m (m s−1).
The crop water requirement is calculated as follows:
where ETc is crop water requirement in the growing season (mm); ET0 is the reference crop water requirement (mm); Kc is the crop coefficient, using the parameter choices built in the SIMETAW model as recommended by FAO-56. The parameters of each crop and soil were selected based on the local condition.
The SIMETAW model requires input of daily rainfall, effective rooting depths, and soil water holding characteristics. SIMETAW simulations produce effective rainfall (Er) and derive hypothetical irrigation time series for summing to seasonal and annual ETaw (in which ETaw represents the net amount of irrigation water needed by the cropped field during the growing season) [50], as follows:
where ETaw is the crop irrigation water requirement, ETc is the crop evapotranspiration, and Er is the effective rainfall, all in mm during the growing season; when ETc − Er < 0, ETaw = 0.
ETaw = ETc − Er
(2) Water requirement of crop rotations:
where is the total water requirement of a whole rotation (mm); is the crop water requirement in the ith growing season within one complete cycle of that certain crop rotation (mm); is the evapotranspiration in the jth fallow season (mm); OKc is a multiplier (recommended by SIMETAW) adjusting bare soil during the fallow period, and ET0 is from Equation (2). The annual ETc of a certain rotation equals AWR divided by the number of years in one rotation cycle including the fallow period.
(3) Precipitation coupling degree of crop rotations:
The precipitation coupling degree (PCD, λ) has been defined as the degree to which precipitation meets the water requirement of a crop or a crop rotation in the growing season (s), ranging from 0.0 to 1.0 [52]:
where is the coupling degree between water requirement and natural precipitation during the growing season for an individual crop in the rotation, Pi is the natural precipitation in the ith growing season of each crop in the rotation (mm), and ETci is the crop water requirement in the ith growing season of each crop in the rotation (mm).
(4) Economic efficiency, equivalent yield, energy, protein content and efficiencies:
This study further analyzed several system output indicators of each crop rotation. The indicators of system output included EB (economic output), EY (equivalent yield to wheat) [9], E (crop energy content), PC (crop protein content), and corresponding water use efficiencies such as EbWUE (economic output water use efficiency), WUE (equivalent yield water use efficiency), EWUE (energy water use efficiency), and PWUE (protein water use efficiency) [6]. Calculations were as follows:
where EB is the total economic output of each crop rotation (Yuan ha−1), Mi is the crop yield of the ith crop in a certain crop rotation (kg ha−1), Pi is the market price of the ith crop in a certain crop rotation (Yuan kg−1); EY is the summed wheat-equivalent yield of a crop rotation (using relative prices as weights); Pw is wheat price(Yuan kg−1), E is the energy contained in one crop rotation (109 J ha−1), Ai is the energy content coefficient of the ith crop product (109 J kg−1), PC is the total protein content of each crop rotation (kg ha−1), Bi is the protein content per kg of the ith crop product (%); EWUE is the economic water use efficiency of one certain crop rotation (Yuan m−3); AWR is the total ETc of each crop rotation (mm), WUE is the equivalent yield water use efficiency of one crop rotation (kg m−3), EWUE is the energy water use efficiency of one crop rotation (109 J m−3), PWUE is the protein water use efficiency of one crop rotation (kg m−3). For comparison, USD 1 = CNY 6.9 in May 2023.
(5) Comprehensive assessment for multiple functions of different crop rotations:
Entropy-TOPSIS [53] was used to calculate the comprehensive benefits of 14 crop rotations. In this study, ten indicators, including EB, EY, E, PC, AWR, PCD, and their corresponding WUEs were considered for the comprehensive evaluation of each crop rotation system. The calculations were as follows.
(1) Normalize the indicators:
where rij is the normalized value of the ith index in the jth crop rotation, xij is the average value of the i th index in the jth crop rotation, and xmax and xmin are the highest and the lowest values of a single index, respectively.
(2) The proportion (fij) of the ith index represented by the jth crop rotation was calculated as follows:
where i = 1, 2, …, m; j = 1, 2, …, n.
(3) The entropy value (ei) of each evaluation index was calculated as follows:
(4) The entropy weight (Wi) of the evaluation index was calculated as follows:
(5) A weighted normalized decision matrix (Z) was constructed by the normalized matrix fij and the weights of each index Wi:
(6) The positive ideal solution vector Z+ and the negative ideal solution vector Z− were determined to form by the positive ideal solution (Zi+) and the negative ideal solution (Zi−):
(7) The Euclidean distance between each index and the positive and negative ideal solutions were calculated as follows:
(8) The comprehensive evaluation index CEIj of each crop rotation was calculated. The proximity between the evaluation object and the optimal scheme was calculated as follows:
2.6. Statistical Analysis
Statistical methods including analysis of variance (ANOVA), cluster analysis, and principal component analysis (PCA) were carried out by SPSS (Statistical Product and Service Solutions, IBM SPSS Inc., Chicago, IL, USA) version 21. The yearly mean data of the diverse crops or diversified crop rotations were statistically analyzed using multi-way ANOVA. Differences between rotation mean values were compared using the least significant difference (LSD) test for post-hoc comparisons at a 95% probability level. Cluster analysis and PCA were used to analyze the relationships among multiple indicators in each crop rotation.
3. Results
3.1. Water Requirements of Eight Crops in the Growing Season
Winter wheat had the highest growing season ETc at 405 mm, followed by spring sweet potato (351 mm), spring potato (310 mm), summer maize (305 mm), summer soybean (266 mm), summer millet (305 mm), autumn potato (192 mm), and spring mung bean was lowest at 187 mm, 55% lower than winter wheat (Figure 2a). Summer millet and summer maize had the highest Er during the growing season at 229 mm and 227 mm, respectively. They were followed by winter wheat (189 mm), spring sweet potato (188 mm), and summer soybean (156 mm). The lowest Er were from spring potato and autumn potato (114 and 111 mm) and spring mung bean (80 mm) (Figure 2b). Winter wheat had the highest ETaw of 216 mm, followed by spring potato (196 mm), spring sweet potato (163 mm), summer soybean (110 mm), spring mung bean (107 mm), and then autumn potato (81 mm), summer maize (85 mm), and summer millet (63 mm) (Figure 2c).
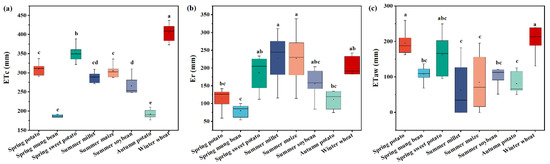
Figure 2.
ETc (a), Er (b), and ETaw (c) in the growing season of eight crops in Shangqiu area from 2013 to 2018. Different lowercase letters show significant differences of each variable of different crops at p < 0.05.
3.2. Water Requirements of Different Crop Rotations during the Growing Season
The conventional, reference W–M rotation had the highest ETc during the crop growing season of 710 mm across all six years (Figure 3a). The winter wheat-based double cropping systems (CI = 2) had similar ETc to the W–M rotation. Sp–S and Sp–Sm rotations (CI = 2) had lower ETc by 16–19% compared with the reference W–M. Four “W–M”-based crop rotations having additional crops spring potato, summer millet, spring mung bean, or spring sweet potato (CI = 1.5) decreased their ETc by 25–37% relative to the reference W–M. Three “W–S”-based rotations (CI = 1.5) with the previous crop spring potato, summer millet, or spring sweet potato had lower ETc by 28–31% relative to the conventional W–M. Two “W–P”-based rotations (CI = 1.5) with the previous crop summer millet or spring mung bean had lower ETc by 38–45% relative to the W–M rotation. ETc of these crop rotations in wet and normal years were higher than in dry years.
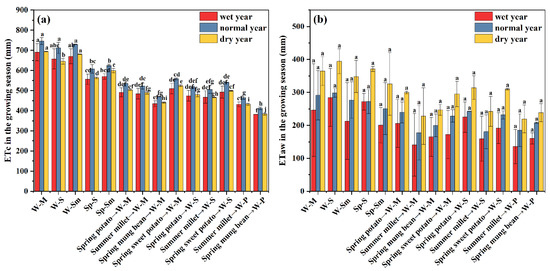
Figure 3.
ETc (a) and ETaw (b) of different crop rotations under different precipitation years from 2013–2018. Different lowercase letters indicate significant differences of different crop rotations in the same precipitation type years. (W–M: Winter wheat–summer maize, W–S: Winter wheat–summer soybean, W–Sm: Winter wheat–summer millet, Sp–S: Spring potato–summer soybean, Sp–Sm: Spring potato–summer millet, W–P: Winter wheat–autumn potato).
The conventional W–M rotation had the greatest ETaw in the growing season of 301 mm across all years (Figure 3b). Sp–S rotation had a similar ETaw to W–M rotation. Two winter wheat-based double cropping systems (CI = 2) had lower the ETaw by 7–8%. The Sp–Sm rotation (CI = 2) had ETaw 14% lower than W–M rotation. Four “W–M”-based crop rotations with the previous crop as spring potato, summer millet, spring mung bean, and spring sweet potato (CI = 1.5) had lower the ETaw by 17–39% compared with the conventional W–M rotation. Three “W–S”-based crop rotations (CI = 1.5) with the previous crop of spring potato, summer millet, or spring sweet potato had lower the ETaw by 13–35% compared with the conventional W–M rotation. Two “W–P”-based crop rotations (CI = 1.5) with the previous crops as summer millet or spring mung bean had lower ETc by 33–40% compared with the conventional W–M rotation. The ETaw in dry years was significantly higher than in normal and wet years for each crop rotation, because less precipitation was available to support crops. The trends of ETaw for each crop rotation in dry, normal, and wet years are similar across all the tested years.
3.3. Annual Water Requirement and Precipitation Coupling Degree of Different Crop Rotations
The W–M rotation had the highest annual ETc of 725 mm across all the years (Figure 4a). The annual ETc values of W–M rotation in wet and normal years were higher than in dry years. Two winter wheat-based rotations (CI = 2) had similar annual ETc across all the years to the W–M rotation. Sp–S and Sp–Sm rotations (CI = 2) had 2–6% lower annual ETc than W–M rotation. Four “W–M”-based rotations (CI = 1.5) involving spring potato, summer millet, spring mung bean, and spring sweet potato had lower annual ETc by 9–16% than the conventional W–M. Three “W–S”-based rotations (CI = 1.5) with previous crop as spring potato, summer millet, and spring sweet potato had lower ETaw by 11–17% than the conventional W–M. Two “W–P”-based rotations (CI = 1.5) with previous crops as summer millet or spring mung bean had lower ETc by 20% and 21%, respectively, than the conventional W–M rotation.
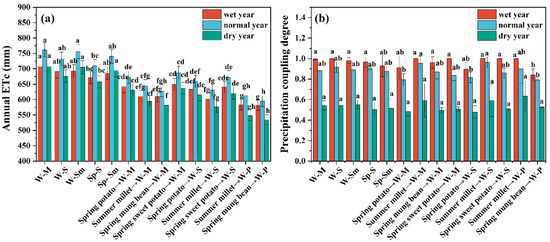
Figure 4.
Annual ETc (a) and precipitation coupling degree (b) of different crop rotations in Shangqiu area from 2013 to 2018. Different lowercase letters indicate significant differences of different crop rotations in the same precipitation type years. (W–M: Winter wheat–summer maize, W–S: Winter wheat–summer soybean, W–Sm: Winter wheat–summer millet, Sp–S: Spring potato–summer soybean, Sp–Sm: Spring potato–summer millet, W–P: Winter wheat–autumn potato).
The precipitation coupling degree (PCD) of each crop rotation all showed trends from high to low as wet year > normal year > dry year (Figure 4b). In the wet year, the PCD of 14 crop rotations was ≥0.84, averaging 0.96, with most rotations having a PCD close to 1. The PCD of all tested crop rotations ranged from 0.79 to 0.96 in normal years, with the highest value in summer millet→W–S rotation (CI = 1.5) and lowest value in spring mung bean→W–P rotation (CI = 1.5). The PCD of all test crop rotations ranged from 0.48 to 0.63 in dry years, with spring potato→W–M or W–S rotation having the lowest PCD while summer millet→W–P rotation had the highest PCD in dry years. Autumn potato with low ETc and ETaw was preferable above spring potato within the considered crop rotations.
3.4. System Output of Different Crop Rotations
The economic efficiency, equivalent yield, and energy and protein nutritional content of 14 crop rotations were further analyzed, as shown Figure 5. The W–M rotation had the annual economic output of 22,174 Yuan ha−1 (Figure 5a). The spring potato-based crop rotations (Sp–S and Sp–Sm) had the highest economic output, 2.1 and 1.7 times higher than W–M rotation. W–S rotation increased the economic output by 20% over the W–M rotation. Summer millet and spring mung bean as single, partial year crops alternated with W–M or W–S (CI = 1.5) decreased the economic output by 25–35%. Six other crop rotations involving sweet potato and potato rotated in W–M and W–S rotations increased economic output by 12–52% compared with the conventional W–M. The average annual equivalent yield of W–M rotation was 12,319 kg ha−1 (Figure 5b). The trend of equivalent yield for different crop rotations was similar to the trend of economic output. The rotations involving millet and mung bean (e.g., W–Sm rotation (CI = 2), summer millet→W–M, spring mung bean→W–M, summer millet→W–S rotations (CI = 1.5) had lower equivalent yield by 20–35% below the W–M rotation. Other crop rotations specified in this study all increased the equivalent yield by 12–113% compared to W–M rotation. The W–M rotation had an annual protein content of 848 kg ha−1 (Figure 5c). The W–S rotation yield increased protein content by 9% due to soybean inclusion. Other crop rotations did not perform as well in protein output due to the lower protein content in sweet potato and potato. The energy content of diversified crop rotations had a similar trend to protein content (Figure 5d). The W–M rotation had an annual average energy content of 173 GJ ha−1. Other crop rotations all had lower energy in calories to different degrees.
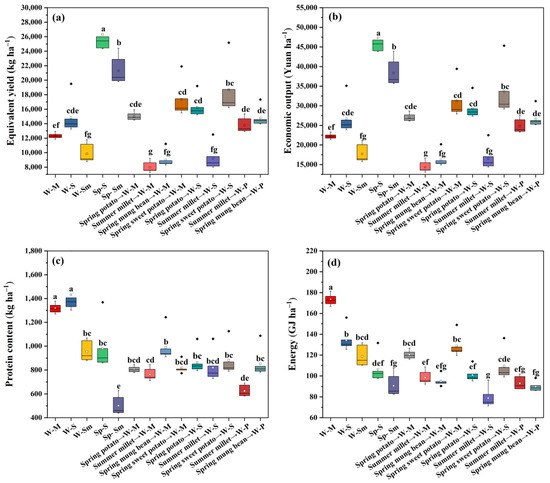
Figure 5.
Economic benefit (a), equivalent yield (b), protein content (c), and energy (d) of diversified crop rotations in Shangqiu area from 2013 to 2018. Different lowercase letters show significant differences of each variable of different crop rotations at p < 0.05. (W–M: Winter wheat–summer maize, W–S: Winter wheat–summer soybean, W–Sm: Winter wheat–summer millet, Sp–S: Spring potato–summer soybean, Sp–Sm: Spring potato–summer millet, W–P: Winter wheat–autumn potato).
3.5. Comprehensive Evaluation of Diversified Crop Rotations by Entropy-TOPSIS
Heat map and principal component analysis (PCA) were adopted to reveal the relationships among multiple indicators in each crop rotation (Figure 6). Sp–B and Sp–Sm formed a small cluster with high equivalent yield, economic output, and corresponding WUEs and low annual ETc. W–M and W–S rotations were a second cluster with similar annual ETc and PCD. Spring sweet potato rotated with W–M or W–S rotations were another cluster, as was spring potato rotated with W–M or W–S rotations, grouping into a larger cluster (Figure 6a). Soybean-based rotations were associated with higher protein contents, economic benefits, and growing season precipitation. The PCA revealed that the cropping index was positively related to annual ETc, therefore, decreasing the cropping index, such as including a fallow season and involving cash crops like soybean, sweet potato, or potato for multi-year crop rotations could be a way to decrease irrigation water requirements (Figure 6b).
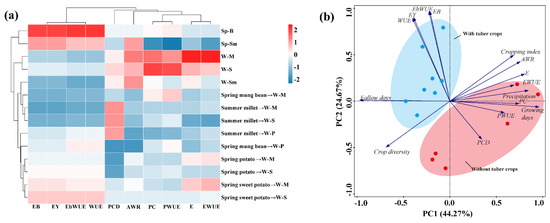
Figure 6.
Heatmaps (a) and principal component analysis (b) for showing the performance of different relative indicators for diversified crop rotations from 2013 to 2018 (W–M: Winter wheat–summer maize, W–S: Winter wheat–summer soybean, W–Sm: Winter wheat–summer millet, Sp–S: Spring potato–summer soybean, Sp–Sm: Spring potato–summer millet, W–P: Winter wheat–autumn potato, EB: Economic output, EY: Equivalent yield, E: Energy, PC: Protein content, AWR: Annual ETc, EbWUE: Economic water use efficiency, WUE: Water use efficiency, EWUE: Energy water use efficiency, PWUE: Protein water use efficiency, PCD: Precipitation coupling degree, Crop diversity is the crop numbers in one rotation cycle).
The Entropy-TOPSIS analysis can be used to explore which crop rotations have overall advantages over the W–M rotation and could be promising alternative crop rotations for the research area. There were eight crop rotations with advantages over the W–M rotation according to the comprehensive evaluation index (CEI) (Table 3). The W–M rotation had a CEI of 0.417. The W–S rotation exceeded in CEI by 12% over the W–M rotation, ranking sixth of fourteen. Sp–S had the highest CEI of 0.627. Spring sweet potato→W–S or →W–M and summer millet→W–P rotations (CI = 1.5) exceeded in CEI by 18–29% above the W–M rotation. Spring mung bean→W–P (CI = 1.5) and Sp–Sm (CI = 2) rotations increased CEI by 7–12% above W–M rotation. Summer millet or spring potato→W–S had similar CEI to the W–M rotation (Figure 7). “W–S”-based rotations performed better than “W–M”-based rotation. It is promising to partially substitute summer maize with summer soybean for more nutritional output without irrigation increase. In this study, three of the “W–M”-based multi-year rotations (CI = 1.5) did not perform better than W–M rotation. W–Sm had the lowest CEI due to the low yield of millet in this region (Table 3).
Table 3.
Euclidean distances (D+ and D−) and comprehensive evaluation index (CEI) for each crop rotation ranked by Entropy-TOPSIS.
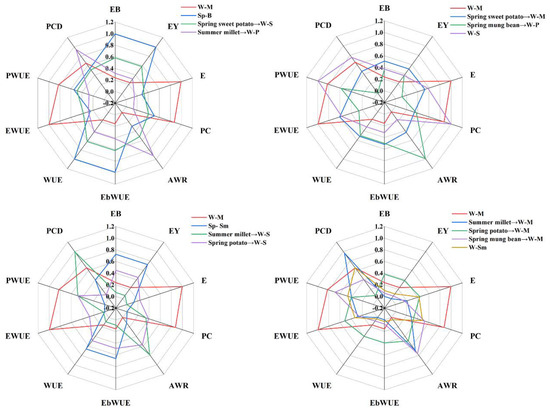
Figure 7.
Multiple objectives analysis of diversified crop rotations in Shangqiu area from 2013 to 2018. (W–M: Winter wheat–summer maize, W–S: Winter wheat–summer soybean, W–Sm: Winter wheat–summer millet, Sp–B: Spring potato–summer soybean, Sp–Sm: Spring potato–summer millet, W–P: Winter wheat–autumn potato, EB: Economic benefits, EY: Equivalent yield, E: Energy, PC: Protein content, AWR: Annual water requirement, EbWUE: Water efficiency and economic use efficiency, WUE: Water use efficiency, EWUE: Water and energy use efficiency, PWUE: Water and protein use efficiency, PCD: Precipitation coupling degree).
4. Discussion
4.1. Water Requirements of Diversified Crop Rotations
This study supplies valuable water requirement information for eight staple crops for the region representable by the Shangqiu research station’s soil and climate. Previous studies focused more on winter wheat and summer maize (e.g., [54,55]). This study adds several other crops with limited studies in Shangqiu area, such as millet, potato, sweet potato, soybean, and mung bean to the water requirement database. It was already well known that winter wheat had higher ETc than spring and summer crops. Spring mung bean had the lowest ETc and ETaw due to greater resistance to drought [56]. Potato had good adaptability to both high and low temperatures, and had low water demand [57]. Millet can maintain a high photosynthetic rate under drought conditions compared with wheat and rice [58]. The information from this study is helpful to build alternative diversified crop rotations including soybean, millet, mung bean, sweet potato, and potato with cereal crops to lower water requirements in the water stressed area.
Alternative water-saving crop rotations are important for mitigating groundwater overuse in Huang-Huai Plain [9]. This study designed 14 crop rotations including 4 double cropping systems (CI = 1.5) and 10 multi-year crop rotations (CI = 2), generated using agronomic criteria in the ROTAT model [48]. The reference W–M had the highest annual ETc in wet, normal, and dry years, in which winter wheat was the main contributor. Replacing summer maize with soybean or millet in W–M rotation did not reduce annual ETc because such rotations retained the high water consumption wheat crop and kept double cropping every year (i.e., CI remained at 2); the annual ETc was barely lower, by only 2–6%. Inserting diversified crops into W–M for multi-year rotations could decrease annual ETc by 8–18%, similar to the result of “W–S”-based multi-year rotations with 9–19% reductions. “W–P”-based multi-year rotations made more progress with 18–24% lower annual ETc. This is evident in the PCA result in Figure 6b. Decreasing cropping index from 2 to 1.5 reduced the average annual ETc by 12%. These results were consistent with previous studies. Annual ETc was reduced by 13–15% [6] and 10–54% [9] when decreasing CI from 2 to 1.5. In this study, the evapotranspiration in the fallow period of 10 multi-year rotations contributed 18–34% of annual ETc, in line with previous studies. The fallow period contributed 15–17% to annual ETc in simulation [6] and 4–15% in field studies [5,9,59].
Considered crop rotations had average precipitation coupling degrees in different precipitation type years as wet year (0.96) > normal year (0.87) > dry year (0.53). Consequently, annual ETaw of all tested crop rotations under different precipitation type years showed dry year > normal year > wet year. The average ETaw decreased by 24% when the cropping index decreased from 2 to 1.5. Compared to the conventional W–M, crop rotations involving soybean, millet, sweet potato, and potato as alternating single crops (CI = 1.5) had lower average ETaw by 17–40%. These results are consistent with previous studies [60,61,62,63]. Li et al. highlighted the water-saving benefit for millet when rotated with rye [60]. Millet required less soil moisture, and its transpiration efficiency and WUE were much higher than other species (sorghum, maize, and wheat) [64,65]. Yang et al. reported that a shallow rooted crop, such as sweet potato, drawing soil moisture from 0–120 cm could preserve deeper soil moisture content for the succeeding deep-rooted crop of winter wheat reaching down to 180 cm or deeper [18]. In addition, excessive root zone soil moisture late in the season was reported to negatively influence storage root yield and quality of sweet potato [66,67]. Growing less water-consuming crops (e.g., maize, soybean, mung bean, and cassava) instead of rice in Thailand proved to show greater tolerance with drought [68]. Including soybean in diversified crop rotations reduced the water footprint in the North China Plain [69] and lowered carbon footprint in Thailand [70].
4.2. Multiple Utilities of Diversified Crop Rotations
In this study, the “W–M”-based rotations (CI = 1.5) with summer millet, spring potato, and spring mung bean, the “W–S”-based rotations (CI = 1.5) with summer millet and spring potato, and W–Sm rotations had lower CEI than W–M rotation, mainly due to the lower yield of soybean and millet, and lower protein content in potato and sweet potato.
The soybean-based double cropping system performed better than W–M rotation. Sp–S and W–S rotations increased CEI by 11% and 57%, respectively, compared with the conventional W–M rotation. Thus, replacing the summer maize with summer soybean could increase the nutrition output and CEI, which is worth considering in building new crop rotations. However, a primary obstacle for soybean development has been the low yield due to the germplasm resources and limited available planting area in Huang-Huai Plain. In this study, the yield of soybean referenced from statistical yearbooks was only 1.6 ± 0.44 t ha−1, which resulted in low rotation output. This was in line with previous studies. Zhang et al. summarized the soybean yield as 2.1 ± 0.18 t ha−1 from 1998 to 2016 in the North China Plain (NCP) [71]. Yang et al. reported that the yield of summer soybean averaged only 3.0 ± 0.26 t ha−1 from surveys conducted in three representative counties across the NCP [63]. Meanwhile, the annual grain yield of wheat–soybean was lower by around 49% than the W–M rotation in this study, consistent with [63] in which the annual grain yield of wheat-soybean was 11.5 t ha−1, lower by 29% than yield from the W–M rotation. The low productivity level of soybean is partly due to the low adoption of improved varieties, the use of poor-quality seed, and inefficient and traditional production technologies [72,73]. Zhang et al. reported that, in the southern North China Plain, the total soybean production change was mainly contributed by yield improvement while in north it was mainly caused by the increased sowing area [71]. Soybean planting area expansion and yield improvement was beneficial for reducing reliance on imports to meet the national self-sufficiency goal [74]. It is promising that W–M rotation could be partly converted to W–S in the research area [71,75]. Therefore, it is important to develop and disseminate improved high-yield soybean varieties and complementary agronomic practices to improve yield, and thus increase the economic return of soybean production and reduce the dependence on subsidy.
In this study, sweet potato and potato were involved in some diversified crop rotations. Potatoes are fat-free, rich in vitamin C and vitamin B6, and can supply good amounts of other micronutrients and dietary fiber that feature in the food-based dietary guidelines of many countries [76]. Since 2015, potato has been proposed as the fourth major staple food crop for improving food security in China. Sweet potatoes have become a trending research topic in recent years due to their special nutritional and functional properties [77]. Sweet potatoes are rich in protein, dietary fibers, vitamin B, β-carotene, minerals (e.g., iron, calcium, magnesium, and zinc), and other dietary bioactive compounds such as polyphenol compounds [77,78,79,80]. Sweet potato has become the sixth ranking food crop all over the world, and fifth most essential food crop on a fresh weight basis in developing countries after rice, wheat, maize, and cassava [81], which contributes to reducing food shortages in times of crisis. In this study, when summer millet rotated with a potato-based crop rotation, the values of CEI were higher than W–M. When summer millet is included in gramineous crops-based rotations, such as W–Sm or Sm→W–M rotation, the system CEI did not have an advantage over W–M rotation due to its lower grain yield compared with summer maize. However, millet has advantages to grow on rainfed marginal lands that are often exposed to water stress [82]. Meanwhile, millet is a major source of energy and protein and has high nutritive value (e.g., high calcium, iron, potassium, magnesium, phosphorous, zinc, dietary fiber, polyphenols, and protein content), comparable to major cereals such as wheat, rice, and maize [83,84,85]. More recent studies have found that millet fits well in rotation with winter annual crops like winter wheat or warm-season broadleaf crops such as sunflower, which can extend and diversify this cropping system to provide multiple benefits [86,87]. In a millet–sunflower or millet–wheat rotation, millet’s shallow roots could reserve deeper soil moisture for the succeeding sunflower or wheat with their deep and extensive roots which often deplete soil water up to 1.8 to 2 m [88].
Summarily, after comprehensively evaluating the multiple functions of 14 crop rotations, we recommended including soybean, potato, sweet potato, and millet into the cereal crop rotations to form the diversified crop rotations to reduce groundwater pumping, improve system output and increase crop diversification.
4.3. Implications
The novelty of this study was that diversified crop rotations with more crop species and lower cropping index decreased the water requirements, slowed groundwater depletion, and increased product output. Limited water availability poses significant challenges to agricultural intensification. Water scarcity, competition for water resources, inadequate infrastructure, environmental concerns, water quality issues, and climate change impacts [89,90,91,92] all contribute to the difficulties. By systematically alternating the types of crops grown, farmers can optimize water use, enhance soil fertility, control pests and diseases, conserve soil, and diversify risk. Incorporating crops with lower water demands reduces overall water consumption, while improved nutrient management and pest control reduce the need for chemical inputs. This study employed the SIMETAW model to quantify the water requirements of several staple crops and used ROTAT model to redesign and generate realistic crop sequences and rotations, which supplied valuable information for the spatial reconfiguration and landscape transformation for sustainable agricultural futures.
This study highlights potential, promising alternative crop rotations which can be considered in the future for sustainable agricultural development in the study region. Candidate rotations for such regions would be defined according to the local weather, soil, social, and economic conditions. Regarding the multiple values of diversified crop rotations in soil health, managing pests and diseases, and optimizing resource use, those are beyond of scope of this study; however, they are definitely worthy of expounding in future studies. In addition, an obvious extension is to apply longer time series data (historical or synthetic) to better understand the effect of different precipitation type years on the water requirements on different crop rotations with different CI and rotation years. Long-term field experiments of diversified crop rotations, while expensive in calendar and resources, are encouraged to obtain first-hand parameters for each crop and model validation data, particularly to reveal the sequencing effects between the rotated crops. The specific carryover effect between the previous crop and succeeding crops should be considered and emphasized when designing new crop rotations. The approach used in this study could be used to design superior crop rotations for other water shortage areas.
5. Conclusions
Well-designed crop rotations are a key element of good agricultural practice, but have been partly lost in the course of specialization and intensification of agricultural production. This study systematically quantified the water requirements of eight crops based on the SIMETAW model, designing 14 crop rotations by ROTAT model for Huang-Huai Plain, and combined multiple outcome dimensions of diversified crop rotations using Entropy-TOPSIS. Results showed that, compared to the W–M rotation, 12-month double cropping system without winter wheat only decreased annual ETc by 2–6%. Decreasing cropping index from 2 to 1.5, including fallow time, reduced the annual ETc by 9–21% in all of the three precipitation-type years. Changing summer maize to soybean (the W–S rotation) had the similar annual ETc and ETaw but with 1.2 times higher economic output and equivalent yield, meanwhile with 9% more protein output than W–M rotation. Eight designed crop rotations had higher CEI than W–M rotation. Compared to W–M rotation, spring potato–summer soybean increased CEI by 57%. Wheat–soybean rotation had higher CEI by 12%. Spring sweet potato→W–M (or S), and “wheat–potato”-based rotations (CI = 1.5) increased CEI by 12–29%. Therefore, decreasing cropping index and including soybean, potato, sweet potato, and millet into cereal crop rotations could save groundwater irrigation and ensure food products in the water stressed regions.
Author Contributions
Conceptualization and methodology: X.Y.; data collection: H.P., J.X., J.Z. and L.Z.; data analysis: H.P., J.X. and X.Y.; writing—original draft: X.Y. and H.P.; review, editing, and revision: X.Y., G.W. and S.P. All authors have read and agreed to the published version of the manuscript.
Funding
This work was jointly financed by the National Natural Science Foundation of China (No. 32071975, 52239002), Chinese Academy of Engineering project (2022-XY-58), Hebei Province Key Research and Development Program of China (20326411D-1), and Undergraduate Innovation Research of Beijing in 2023.
Institutional Review Board Statement
Not applicable.
Informed Consent Statement
Not applicable.
Data Availability Statement
Not applicable.
Conflicts of Interest
The authors declare no conflict of interest.
References
- Bowles, T.M.; Mooshammer, M.; Socolar, Y.; Calderón, F.; Cavigelli, M.A.; Culman, S.W.; Deen, W.; Drury, C.F.; Garcia y Garcia, A.; Gaudin, A.C.M.; et al. Long-term evidence shows that crop-rotation diversification increases agricultural resilience to adverse growing conditions in North America. One Earth 2020, 2, 284–293. [Google Scholar] [CrossRef]
- Massawe, F.; Mayes, S.; Cheng, A. Crop diversity: An unexploited treasure trove for food security. Trends Plant Sci. 2016, 21, 365–368. [Google Scholar] [CrossRef] [PubMed]
- Hufnagel, J.; Reckling, M.; Ewert, F. Diverse approaches to crop diversification in agricultural research. A review. Agron. Sustain. Dev. 2020, 40, 14. [Google Scholar] [CrossRef]
- Lin, B.B. Resilience in agriculture through crop diversification: Adaptive management for environmental change. Bioscience 2011, 61, 183–193. [Google Scholar] [CrossRef]
- Yang, X.L.; Chen, Y.Q.; Pacenka, S.; Gao, W.S.; Ma, L.; Wang, G.Y.; Yan, P.; Sui, P.; Steenhuis, T.S. Effect of diversified crop rotations on groundwater levels and crop water productivity in the North China Plain. J. Hydrol. 2015, 522, 428–438. [Google Scholar] [CrossRef]
- Wang, S.Q.; Xiong, J.R.; Yang, B.Y.; Yang, X.L.; Du, T.S.; Steenhuis, T.S.; Siddique, K.H.; Kang, S.Z. Diversified crop rotations reduce groundwater use and enhance system resilience. Agric. Water. Manag. 2023, 276, 108067. [Google Scholar] [CrossRef]
- Zhou, S.M.; Zhang, M.; Zhang, K.K.; Yang, X.W.; He, D.X.; Jun, Y.I.N.; Wang, C.Y. Effects of reduced nitrogen and suitable soil moisture on wheat (Triticum aestivum L.) rhizosphere soil microbiological, biochemical properties and yield in the Huanghuai Plain, China. J. Integr. Agric. 2020, 19, 234–250. [Google Scholar] [CrossRef]
- Song, N.; Sun, J.S.; Wang, J.L.; Chen, Z.F.; Liu, Z.G. Temporal and spatial variation of water requirement of winter wheat and its influencing factors in Henan Province. Chin. J. Ecol. 2014, 25, 1693–1700. (In Chinese) [Google Scholar] [CrossRef]
- Yang, X.L.; Steenhuis, T.S.; Davis, K.F.; van der Werf, W.; Ritsema, C.J.; Pacenka, S.; Zhang, F.S.; Siddique, K.H.; Du, T.S. Diversified crop rotations enhance groundwater and economic sustainability of food production. Food Energy Secur. 2021, 10, e311. [Google Scholar] [CrossRef]
- Maiga, A.; Alhameid, A.; Singh, S.; Polat, A.; Singh, J.; Kumar, S.; Osborne, S. Responses of soil organic carbon, aggregate stability, carbon and nitrogen fractions to 15 and 24 years of no-till diversified crop rotations. Soil Res. 2019, 57, 149–157. [Google Scholar] [CrossRef]
- Jarecki, M.; Grant, B.; Smith, W.; Deen, B.; Drury, C.; VanderZaag, A.; Qian, B.; Yang, J.; Wagner-Riddle, C. Long-term trends in corn yields and soil carbon under diversified crop rotations. J. Environ. Qual. 2022, 47, 635–643. [Google Scholar] [CrossRef] [PubMed]
- Garbelini, L.G.; Debiasi, H.; Junior, A.A.B.; Franchini, J.C.; Coelho, A.E.; Telles, T.S. Diversified crop rotations increase the yield and economic efficiency of grain production systems. Eur. J. Agron. 2022, 137, 126528. [Google Scholar] [CrossRef]
- Sainju, U.M.; Lenssen, A.W.; Allen, B.L.; Jabro, J.D.; Stevens, W.B. Crop water and nitrogen productivity in response to long-term diversified crop rotations and management systems. Agric. Water. Manag. 2021, 257, 107149. [Google Scholar] [CrossRef]
- Meena, O.P.; Sammauria, R.; Gupta, A.K.; Gupta, K.C.; Behera, B.; Saxena, R.; Yadav, M.R.; Singh, P.; Meena, R.K.; Raza, M.B.; et al. Energy-Carbon Footprint vis-à-vis System Productivity and Profitability of Diversified Crop Rotations in Semi-arid Plains of North-West India. J. Soil Sci. Plant Nutr. 2022, 22, 2026–2041. [Google Scholar] [CrossRef]
- Renwick, L.L.; Deen, W.; Silva, L.; Gilbert, M.E.; Maxwell, T.; Bowles, T.M.; Gaudin, A.C. Long-term crop rotation diversification enhances maize drought resistance through soil organic matter. Environ. Res. Lett. 2021, 16, 084067. [Google Scholar] [CrossRef]
- Jalli, M.; Huusela, E.; Jalli, H.; Kauppi, K.; Niemi, M.; Himanen, S.; Jauhiainen, L. Effects of crop rotation on spring wheat yield and pest occurrence in different tillage systems: A multi-year experiment in Finnish growing conditions. Front. Sustain. Food Syst. 2021, 5, 647335. [Google Scholar] [CrossRef]
- Gao, F.; Luan, X.B.; Yin, Y.L.; Sun, S.K.; Li, Y.; Mo, F.; Wang, J.H. Exploring long-term impacts of different crop rotation systems on sustainable use of groundwater resources using DSSAT model. J. Clean. Prod. 2022, 336, 130377. [Google Scholar] [CrossRef]
- Yang, X.L.; Chen, Y.Q.; Steenhuis, T.S.; Pacenka, S.; Gao, W.S.; Ma, L.; Zhang, M.; Sui, P. Mitigating groundwater depletion in North China Plain with cropping system that alternate deep and shallow rooted crops. Front. Plant Sci. 2017, 8, 980. [Google Scholar] [CrossRef]
- Wang, L.; Zhao, Y.; Al-Kaisi, M.; Yang, J.; Chen, Y.; Sui, P. Effects of Seven Diversified Crop Rotations on Selected Soil Health Indicators and Wheat Productivity. Agronomy 2020, 10, 235. [Google Scholar] [CrossRef]
- Sun, H.Y.; Zhang, X.Y.; Liu, X.J.; Liu, X.W.; Shao, L.W.; Chen, S.Y.; Wang, J.T.; Dong, X.L. Impact of different cropping systems and irrigation schedules on evapotranspiration, grain yield and groundwater level in the North China Plain. Agric. Water. Manag. 2019, 211, 202–209. [Google Scholar] [CrossRef]
- Gao, B.; Ju, X.T.; Meng, Q.F.; Cui, Z.L.; Christie, P.; Chen, X.P.; Zhang, F.S. The impact of alternative cropping systems on global warming potential, grain yield and groundwater use. Agric. Ecosyst. Environ. 2015, 203, 46–54. [Google Scholar] [CrossRef]
- Luo, J.M.; Shen, Y.J.; Qi, Y.Q.; Zhang, Y.C.; Xiao, D.P. Evaluating water conservation effects due to cropping system optimization on the Beijing-Tianjin-Hebei plain, China. Agric. Syst. 2018, 159, 32–41. [Google Scholar] [CrossRef]
- Zhang, Y.F.; Guo, Y.; Shen, Y.J.; Qi, Y.Q.; Luo, J.M. The impact of changes in planting structure on agricultural water demand in the North China Plain. Chin. J. Eco-Agric. 2020, 28, 8–16. [Google Scholar] [CrossRef]
- Luo, J.; Zhang, H.; Qi, Y.; Pei, H.; Shen, Y. Balancing water and food by optimizing the planting structure in the Beijing–Tianjin–Hebei region, China. Agric. Water. Manag. 2022, 262, 107326. [Google Scholar] [CrossRef]
- Davis, K.F.; Chhatre, A.; Rao, N.D.; Singh, D.; Ghosh-Jerath, S.; Mridul, A.; Poblete-Cazenave, M.; Pradhan, N.; DeFries, R. Assessing the sustainability of post-Green Revolution cereals in India. Proc. Natl. Acad. Sci. USA 2019, 116, 25034–25041. [Google Scholar] [CrossRef] [PubMed]
- Groot, J.; Yang, X.L. Trade-Offs in the design of sustainable cropping systems at a regional level: A case study on the North China Plain. FASE 2022, 9, 295–308. [Google Scholar] [CrossRef]
- Zhang, Z. High-yielding wheat planting technology and green control of pests and weeds in Shangqiu City, Henan Province. Agric. Eng. Technol. 2021, 41, 61–63. (In Chinese) [Google Scholar] [CrossRef]
- Han, B.; Zeng, H.; Wang, S.Z.; Shi, H.M.; Sun, X.H.; Wang, Y.M. High-yielding cultivation, and management techniques for semi-winter wheat in Shangqiu City. Agric. Sci. Technol. Commun. 2012, 5, 162–163. (In Chinese) [Google Scholar]
- Guo, T.Z.; Li, Z.P. Screening study on new maize varieties suitable for summer sowing in Joon County, Henan Province. Agric. Sci. Technol. Commun. 2020, 4, 50–52. (In Chinese) [Google Scholar]
- Li, M. Ace potato seed—Yuyu No. 10. Agric. Technol. Serv. 1997, 4, 23–24. (In Chinese) [Google Scholar]
- Kang, Z.H. New high-yielding and early-maturing green bean varieties. Chin. Rural Sci. Technol. 2002, 10, 16–17. (In Chinese) [Google Scholar]
- Liu, Z.L.; Ying, F.Q. Cultivation techniques for autumn planting of potatoes in the Central Plains two-season crop zone. Anhui Agric. Bull. 2006, 7, 93–156. (In Chinese) [Google Scholar]
- Chen, X.W.; Chen, K. High yield and high efficiency cultivation techniques of soybean in Shangqiu Area. Anhui Agric. Bull. 2017, 23, 57–58. (In Chinese) [Google Scholar] [CrossRef]
- Liang, X.A.; Sun, X.Z. Three high-efficiency cultivation patterns for spring potato, spring maize and autumn-winter cauliflower. Henan Agric. Sci. 2005, 8, 79–80. (In Chinese) [Google Scholar]
- Wu, Q.F. Reason for the low yield and cultivation techniques with good-quality and high-yielding of millet in the North Henan. Anhui Agric. Sci. 2003, 31, 443–444. (In Chinese) [Google Scholar] [CrossRef]
- Huang, T.; Xu, D.J.; Wan, C.Q. Determination and analysis of the protein content and hardness of wheat. Anhui Agric. Sci. 2007, 30, 9485–9487. (In Chinese) [Google Scholar] [CrossRef]
- Li, X.H.; Shen, S.X.; Li, Y.L.; Cao, W.M.; Du, H. QTL analysis of protein content in high-oil maize using seed trait QTL explorer. Crop. J. 2011, 4, 40–42. (In Chinese) [Google Scholar] [CrossRef]
- Yang, S.; Xu, L.; Liu, H.M. Determination of protein and water soluble sugar sontent in potato. Agric. Prod. Process. 2022, 5, 71–73. (In Chinese) [Google Scholar] [CrossRef]
- FAO. FAO/INFOODS Food Composition Database for Biodiversity—Version 4.0 (BioFoodComp4.0); Food and Agriculture Orgnaization of the United Nations: Rome, Italy, 2012. Available online: https://www.fao.org/infoods/infoods/tables-and-databases/faoinfoods-databases/en/ (accessed on 1 January 2021).
- Ning, H.L.; Hu, G.H.; Li, W.B.; Li, W.X. The effects of based NPK fertilizer on protein content in soybean. Soybean Sci. 2006, 3, 288–293. (In Chinese) [Google Scholar]
- Liang, Z.P.; Gong, L. Effect of different dosages of nitrogen fertilizer on protein content of cereals. Chin. High-Technol. Enterp. 2011, 36, 99–100. (In Chinese) [Google Scholar] [CrossRef]
- Li, R.G.; Guo, S.Y.; Wang, H.Y. Measurement of content of protein and vitamin c green gram in germination periods and its nutritional value. Food Res. Dev. 2012, 33, 170–173. (In Chinese) [Google Scholar]
- Chen, F. Nongyeshengtaixue, 2nd ed.; China Agricultural University Press: Beijing, China, 2011. (In Chinese) [Google Scholar]
- Zhao, A.J.; Feng, C.T.; Zhou, J.H. Determination of the heat of combustion of cereals. Henan Sci. 2014, 32, 1189–1192. (In Chinese) [Google Scholar] [CrossRef]
- He, P.; Zhang, J.J. Determination and analysis of the calorific values of carbohydrates and common crops in the northern. Grain Fats 2018, 31, 79–81. (In Chinese) [Google Scholar]
- Henan Bureau of Statistics. Henan Agricultural Statistical Yearbook, China. 2019. Available online: http://www.stats.gov.cn/ (accessed on 1 January 2021).
- Wang, B.; van Dam, J.; Yang, X.L.; Ritsema, C.; Du, T.S.; Kang, S.Z. Reducing water productivity gap by optimizing irrigation regime for winter wheat-summer maize system in the North China Plain. Agric. Water. Manag. 2023, 280, 108229. [Google Scholar] [CrossRef]
- Dogliotti, S.; Rossing, W.A.H.; van Ittersum, M.K. ROTAT, a tool for systematically generating crop rotations. Eur. J. Agron. 2003, 19, 239–250. [Google Scholar] [CrossRef]
- Snyder, R.L.; Geng, S.; Orang, M.N.; Matyac, J.S.; Sarreshteh, S. A simulation model for ET of applied water. Acta Hortic. 2004, 664, 623–629. [Google Scholar] [CrossRef]
- Snyder, R.L.; Orang, M.N.; Matyac, S.G.J.S.; Sarreshteh, S. SIMETAW (Simulation of Evapotranspiration of Applied Water), 2005, California. Calif. Water Plan Update 2005, 4, 211–226. [Google Scholar]
- Snyder, R.L.; Geng, S.; Orang, M.; Sarreshteh, S. Calculation and simulation of evapotranspiration of applied water. J. Integr. Agric. 2012, 11, 489–501. [Google Scholar] [CrossRef]
- Shao, Y.; Zhu, Q.Y.; Weng, Z.P. Research on resource utilization efficiency of different crop rotation modes based on equivalent yield. Henan Agric. Sci. 2020, 49, 45–53. (In Chinese) [Google Scholar] [CrossRef]
- Liu, X.G.; Peng, Y.L.; Yang, Q.L.; Wang, X.K.; Cui, N.B. Determining optimal deficit irrigation and fertilization to increase mango yield, quality, and WUE in a dry hot environment based on TOPSIS. Agric. Water. Manag. 2021, 245, 106650. [Google Scholar] [CrossRef]
- Zhong, Z.Z.; Zhao, J.B.; Yu, X.C.; Ju, H. Calculation and analysis of water demand of major dryland crops in Northern China. Chin. J. Agrometeorol. 2000, 2, 2–5+53. (In Chinese) [Google Scholar]
- Mo, Y.C.; Bao, Z.X.; Song, X.M.; Wang, G.Q.; Liu, C.S.; Tian, Y.M. Study on the spatial-temporal evolution of water demand and water shortage of main crops in the Huang Huai Hai basin from 1961 to 2017. J. North Chin. Univ. Water Res. Hydr. 2022, 43, 49–60. [Google Scholar] [CrossRef]
- Bano, H.; Athar, H.U.R.; Zafar, Z.U.; Ogbaga, C.C.; Ashraf, M. Peroxidase activity and operation of photo-protective component of NPQ play key roles in drought tolerance of mung bean [Vigna radiata (L.) Wilcziek]. Physiol. Plant. 2021, 172, 603–614. [Google Scholar] [CrossRef]
- Obidiegwu, J.E.; Bryan, G.J.; Jones, H.G.; Prashar, A. Coping with drought: Stress and adaptive responses in potato and perspectives for improvement. Front. Plant Sci. 2015, 6, 542. [Google Scholar] [CrossRef]
- Pant, S.R.; Irigoyen, S.; Doust, A.N.; Scholthof, K.B.G.; Mandadi, K.K. Setaria: A food crop and translational research model for C-4 grasses. Front. Plant Sci. 2016, 7, 1885. [Google Scholar] [CrossRef]
- Yang, X.L.; Chen, Y.Q.; Pacenka, S.; Steenhuis, T.S.; Sui, P. Managing food and bioenergy crops with declining groundwater levels in the North China Plain. Field Crops Res. 2019, 234, 1–14. [Google Scholar] [CrossRef]
- Li, M.Z.; Hao, H.B.; Xie, N.; Xie, J.X.; Wang, G.R. Feasibility study on biannual rotation of millet and forage in Heilonggang Area. J. Heibei Agr. Sci. 2010, 14, 5–7. (In Chinese) [Google Scholar] [CrossRef]
- Luo, X.P.; Xia, J.; Yang, H. Modeling water requirements of major crops and theirresponses to climate change in the North China Plain. Environ. Earth Sci. 2015, 74, 3531–3541. [Google Scholar] [CrossRef]
- Zhao, J.; Yang, Y.; Zhang, K.; Jeong, J.; Zeng, Z.; Zang, H. Does crop rotation yield more in China? A meta-analysis. Field Crops Res. 2020, 245, 107659. [Google Scholar] [CrossRef]
- Yang, Y.H.; Zou, J.; Huang, W.H.; Manevski, K.; Olesen, J.E.; Rees, R.M.; Hu, S.; Li, W.; Kersebaum, K.-C.; Louarn, G.; et al. Farm-scale practical strategies to increase nitrogen use efficiency and reduce nitrogen footprint in crop production across the North China Plain. Field Crops Res. 2022, 283, 108526. [Google Scholar] [CrossRef]
- Tang, S.; Li, L.; Wang, Y.Q.; Chen, Q.N.; Zhang, W.Y.; Jia, G.Q.; Zhi, H.; Zhao, B.H.; Diao, X.M. Genotype-specific physiological and transcriptomic responses to drought stress in Setaria italica (an emerging model for Panicoideae grasses). Sci. Rep. 2017, 7, 10009. [Google Scholar] [CrossRef]
- Guo, Y.; Hao, D.D.; Wang, X.X.; Wang, H.; Wu, Z.H.; Yang, P.; Zhang, B. Comparative transcriptomics reveals key genes contributing to the differences in drought tolerance among three cultivars of foxtail millet (Setaria italica). Plant Growth Regul. 2023, 99, 45–64. [Google Scholar] [CrossRef]
- Siqinbatu, Y.K.H.; Hirai, R.; Endo, T. Shibuya. Effects of water contents and CO2 concentrations in soil on growth of sweet potato. Field Crops Res. 2013, 152, 36–43. [Google Scholar] [CrossRef]
- Gajanayake, B.; Reddy, K.R. Sweet potato responses to mid-and late-season soil moisture deficits. Crop. Sci. 2016, 56, 1865–1877. [Google Scholar] [CrossRef]
- Arunrat, N.; Sereenonchai, S.; Chaowiwat, W.; Wang, C. Climate change impact on major crop yield and water footprint under CMIP6 climate projections in repeated drought and flood areas in Thailand. Sci. Total Environ. 2022, 807, 150741. [Google Scholar] [CrossRef]
- Yang, J.; Cui, J.X.; Lv, Z.Q.; Ran, M.M.; Sun, B.B.; Sui, P.; Chen, Y.Q. Will maize based cropping systems reduce water consumption without compromise of food security in the North China Plain. Water 2020, 12, 2946. [Google Scholar] [CrossRef]
- Arunrat, N.; Wang, C.; Pumijumnong, N. Alternative cropping systems for greenhouse gases mitigation in rice field: A case study in Phichit province of Thailand. J. Clean. Prod. 2016, 133, 657–671. [Google Scholar] [CrossRef]
- Zhang, Z.; Lu, C. Clustering analysis of soybean production to understand its spatiotemporal dynamics in the North China Plain. Sustainability 2020, 12, 6178. [Google Scholar] [CrossRef]
- Van Vugt, D.; Franke, A.C.; Giller, K.E. Participatory research to close the soybean yield gap on smallholder farmers in Malawi. Exp. Agric. 2017, 53, 396–415. [Google Scholar] [CrossRef]
- Tufa, A.H.; Alene, A.D.; Manda, J.; Akinwale, M.G.; Chikoye, D.; Feleke, S.; Manyong, V. The productivity and income effects of adoption of improved soybean varieties and agronomic practices in Malawi. World Dev. 2019, 124, 104631. [Google Scholar] [CrossRef]
- Wu, Y.H.; Wang, E.R.; Miao, C.H. Fertilizer use in China: The role of agricultural support policies. Sustainability 2019, 11, 4391. [Google Scholar] [CrossRef]
- Shen, Y.W.; Sui, P.; Huang, J.X.; Wang, D.; Whalen, J.K.; Chen, Y.Q. Global warming potential from maize and maize-soybean as affected by nitrogen fertilizer and cropping practices in the North China Plain. Field Crops Res. 2018, 225, 117–127. [Google Scholar] [CrossRef]
- Wijesinha-Bettoni, R.; Mouill’e, B. The contribution of potatoes to global food security, nutrition and healthy diets. Am. J. Potato Res. 2019, 96, 139–149. [Google Scholar] [CrossRef]
- Alam, M.K.; Rana, Z.H.; Islam, S.N.; Akhtaruzzaman, M. Comparative assessment of nutritional composition, polyphenol profile, antidiabetic and antioxidative properties of selected edible wild plant species of Bangladesh. Food Chem. 2020, 320, 126646. [Google Scholar] [CrossRef] [PubMed]
- Alam, M.K.; Rana, Z.H.; Islam, S.N. Comparison of the proximate composition, total carotenoids and total polyphenol content of nine orange-fleshed sweet potato varieties grown in Bangladesh. Foods 2016, 5, 64. [Google Scholar] [CrossRef] [PubMed]
- Islam, S. Antimicrobial activities of Ipomoea batatas (L.) leaf. J. Food Agric. Environ. 2008, 6, 14–17. [Google Scholar] [CrossRef]
- Sun, Y.M.; Pan, Z.J.; Yang, C.X.; Jia, Z.Z.; Guo, X.B. Comparative assessment of phenolic profiles, cellular antioxidant and antiproliferative activities in ten varieties of sweet potato (Ipomoea batatas) storage roots. Molecules 2019, 24, 4476. [Google Scholar] [CrossRef]
- CIP. Institutional Brochure; International Potato Center: Lima, Peru, 2019; Available online: https://hdl.handle.net/10568/99442 (accessed on 1 January 2021).
- Kumar, A.; Tomer, V.; Kaur, A.; Kumar, V.; Gupta, K. Millets: A solution to agrarian and nutritional challenges. Agric. Food Secur. 2018, 7, 31. [Google Scholar] [CrossRef]
- Amadou, I.; Gounga, M.E.; Le, G.W. Millets: Nutritional composition, some health benefits and processing—A review. Emir. J. Food Agric. 2013, 25, 501–508. [Google Scholar] [CrossRef]
- Saleh, A.S.; Zhang, Q.; Chen, J.; Shen, Q. Millet grains: Nutritional quality, processing, and potential health benefits. Compr. Rev. Food Sci. Food Saf. 2013, 12, 281–295. [Google Scholar] [CrossRef]
- Gupta, S.; Shrivastava, S.K.; Shrivastava, M. Proximate composition of seeds of hybrid varieties of minor millets. Int. J. Res. Eng. Technol. 2014, 3, 687–693. [Google Scholar] [CrossRef]
- Lyon, D.J.; Burgener, P.A.; DeBoer, K. EC08-137 Producing and Marketing Proso Millet in the Great Plains; University of Nebraska-Lincoln: Lincoln, NE, USA, 2008; Available online: https://digitalcommons.unl.edu/extensionhist/4794/ (accessed on 1 January 2021).
- Santra, D.K. Proso Millet Varieties for Western Nebraska; University of Nebraska-Lincoln: Lincoln, NE, USA, 2013; Available online: https://extensionpubs.unl.edu/publication/9000016369012 (accessed on 1 January 2021).
- Habiyaremye, C.; Matanguihan, J.B.; D’Alpoim Guedes, J.; Ganjyal, G.M.; Whiteman, M.R.; Kidwell, K.K.; Murphy, K.M. Proso millet (Panicum miliaceum L.) and its potential for cultivation in the Pacific Northwest, US: A review. Front. Plant Sci. 2017, 7, 1961. [Google Scholar] [CrossRef]
- Fathian, M.; Bazrafshan, O.; Jamshidi, S.; Jafari, L. Impacts of climate change on water footprint components of rainfed and irrigated wheat in a semi-arid environment. Environ. Monit. Assess. 2023, 195, 324. [Google Scholar] [CrossRef] [PubMed]
- Jamshidi, S.; Zand-Parsa, S.; Kamgar-Haghighi, A.A.; Shahsavar, A.R.; Niyogi, D. Evapotranspiration, crop coefficients, and physiological responses of citrus trees in semi-arid climatic conditions. Agric. Water Manag. 2020, 227, 105838. [Google Scholar] [CrossRef]
- Xu, X.X.; Zhang, M.; Li, J.P.; Liu, Z.; Zhao, Z.; Zhang, Y.; Zhou, S.; Wang, Z. Improving water use efficiency and grain yield of winter wheat by optimizing irrigations in the North China Plain. Field Crops Res. 2018, 221, 219–227. [Google Scholar] [CrossRef]
- Zhang, S.H.; Wang, H.D.; Sun, X.; Fan, J.L.; Zhang, F.C.; Zheng, J.; Li, Y.P. Effects of farming practices on yield and crop water productivity of wheat, maize and potato in China: A meta-analysis. Agric. Water Manag. 2021, 243, 106444. [Google Scholar] [CrossRef]
Disclaimer/Publisher’s Note: The statements, opinions and data contained in all publications are solely those of the individual author(s) and contributor(s) and not of MDPI and/or the editor(s). MDPI and/or the editor(s) disclaim responsibility for any injury to people or property resulting from any ideas, methods, instructions or products referred to in the content. |
© 2023 by the authors. Licensee MDPI, Basel, Switzerland. This article is an open access article distributed under the terms and conditions of the Creative Commons Attribution (CC BY) license (https://creativecommons.org/licenses/by/4.0/).