Article

Multicriteria Decision-Making for Evaluating Solar Energy Source of Saudi Arabia

by
Abdulaziz Alanazi
1 and
Mohana Alanazi
2,*
1
Department of Electrical Engineering, College of Engineering, Northern Border University, Arar 73222, Saudi Arabia
2
Department of Electrical Engineering, College of Engineering, Jouf University, Sakaka 72388, Saudi Arabia
*
Author to whom correspondence should be addressed.
Sustainability 2023, 15(13), 10228; https://doi.org/10.3390/su151310228
Submission received: 22 May 2023 / Revised: 22 June 2023 / Accepted: 25 June 2023 / Published: 28 June 2023

Abstract

:
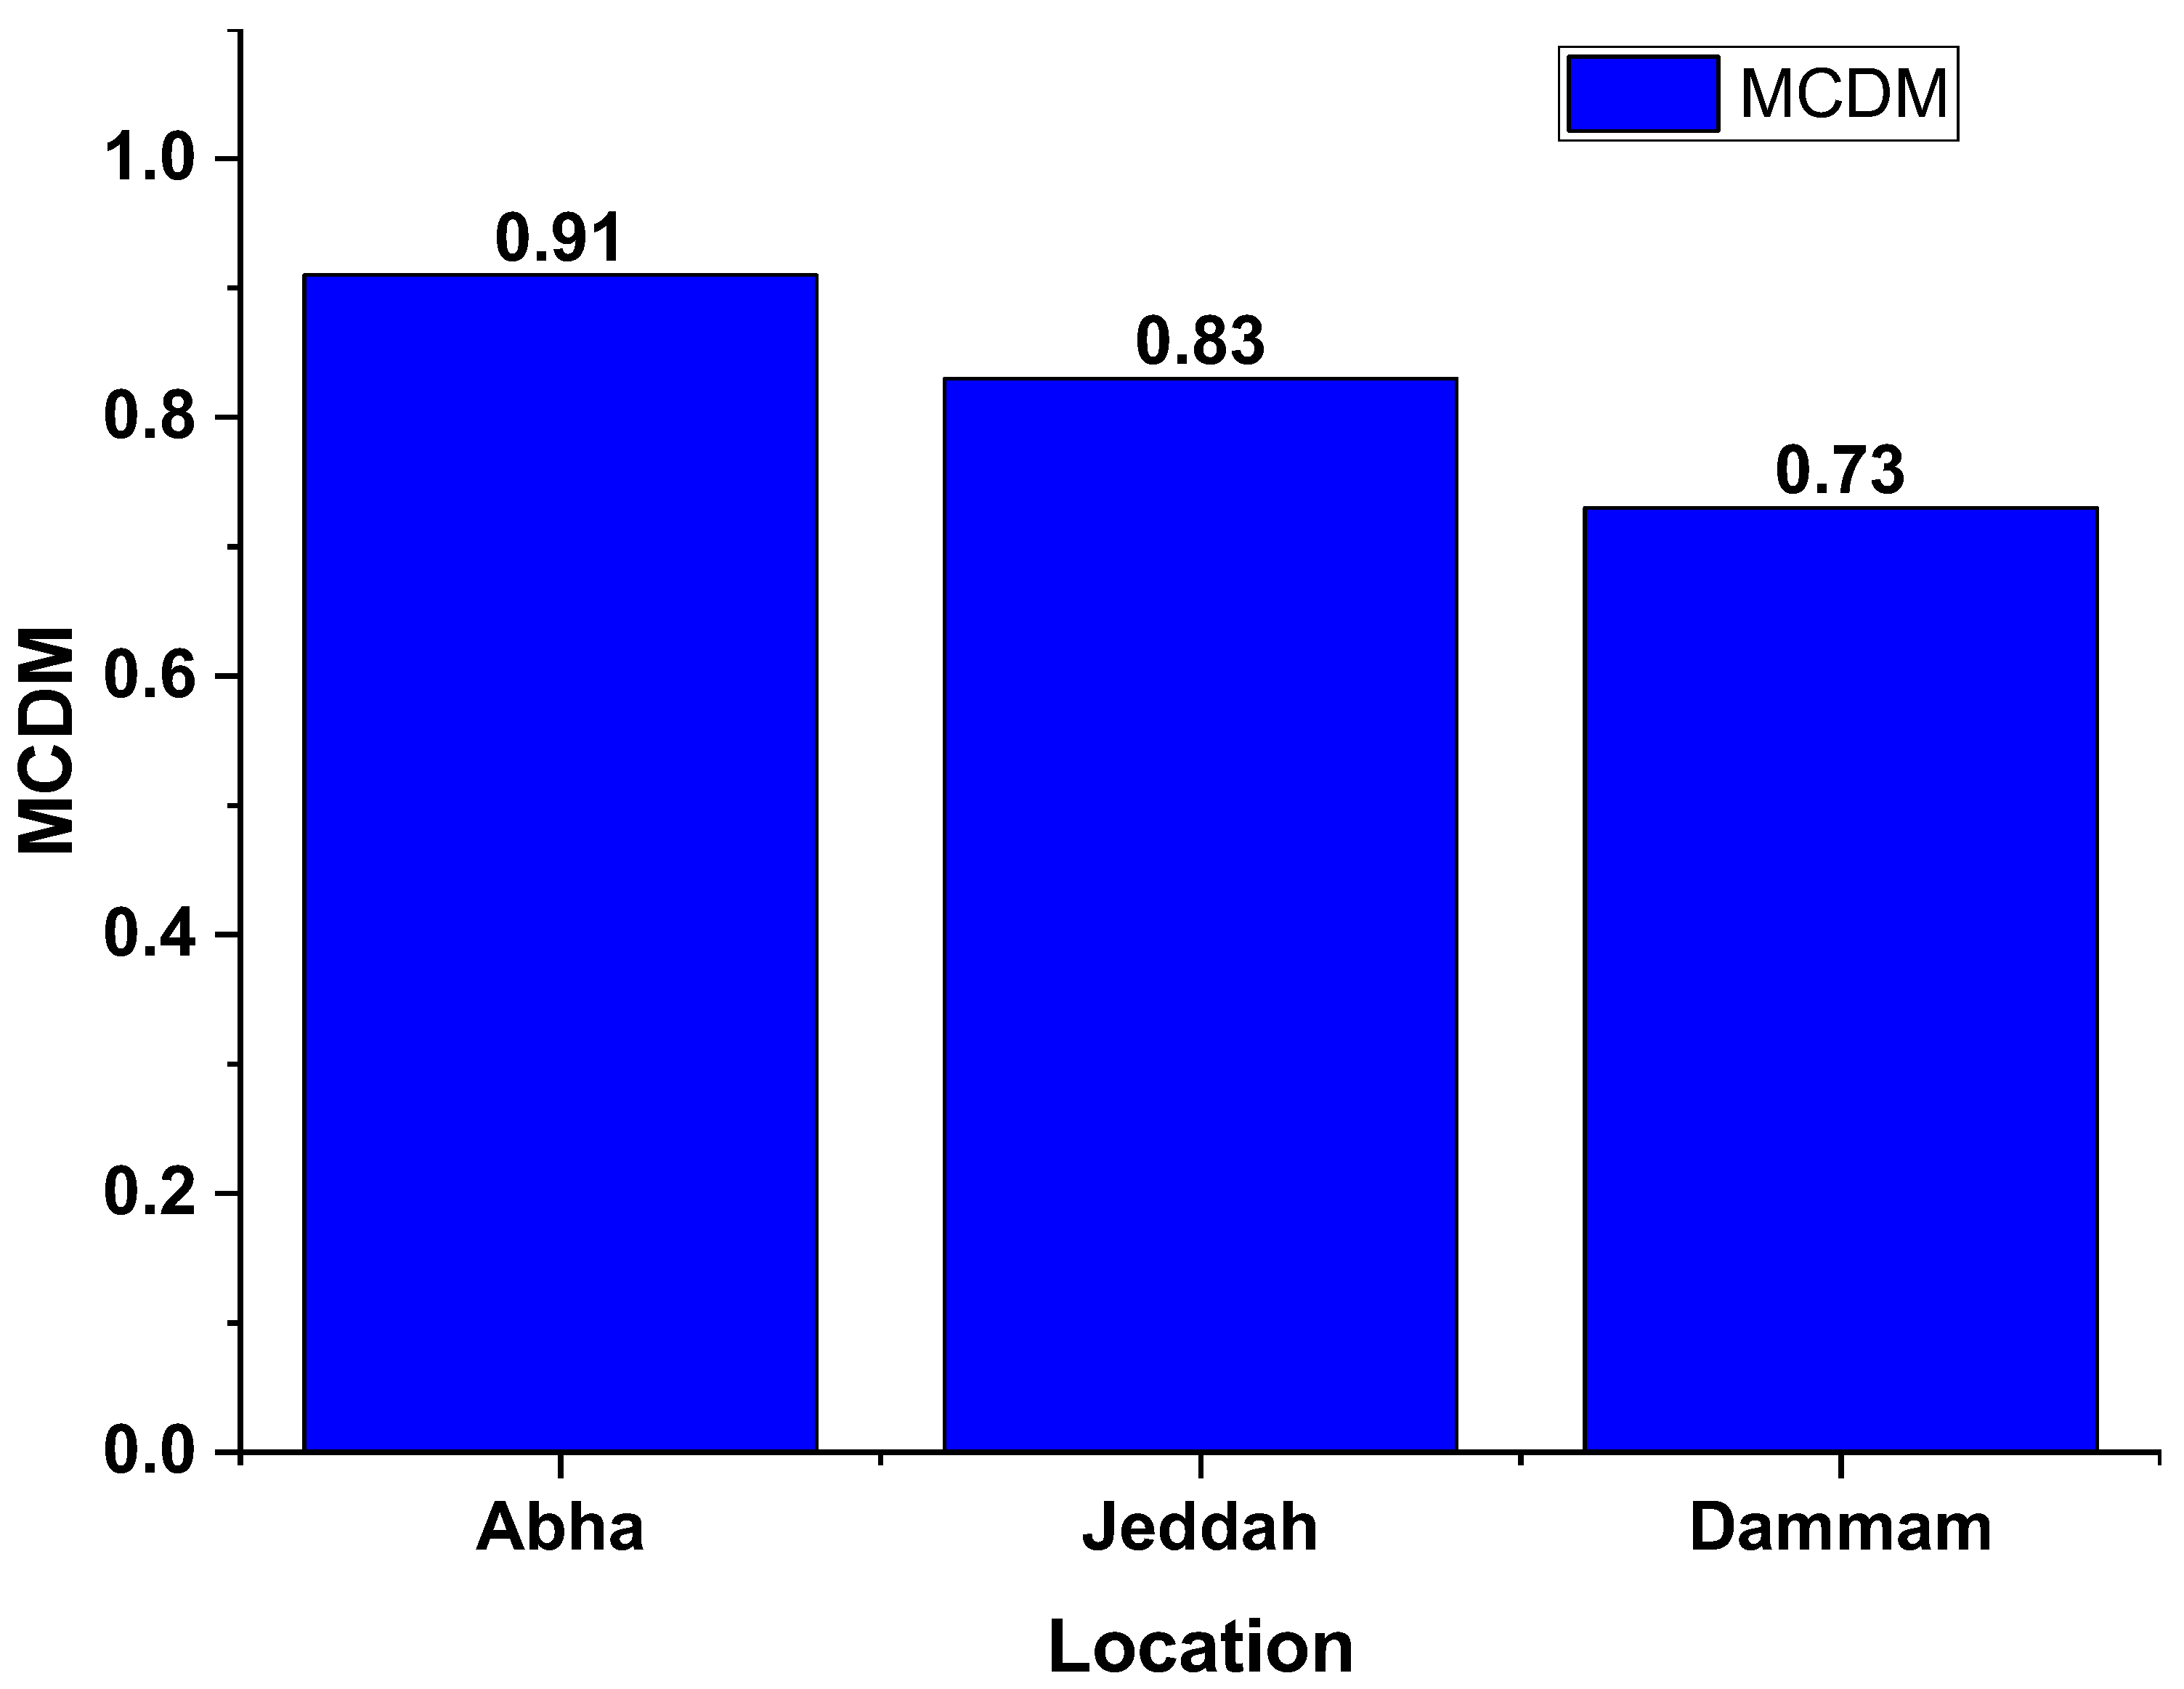
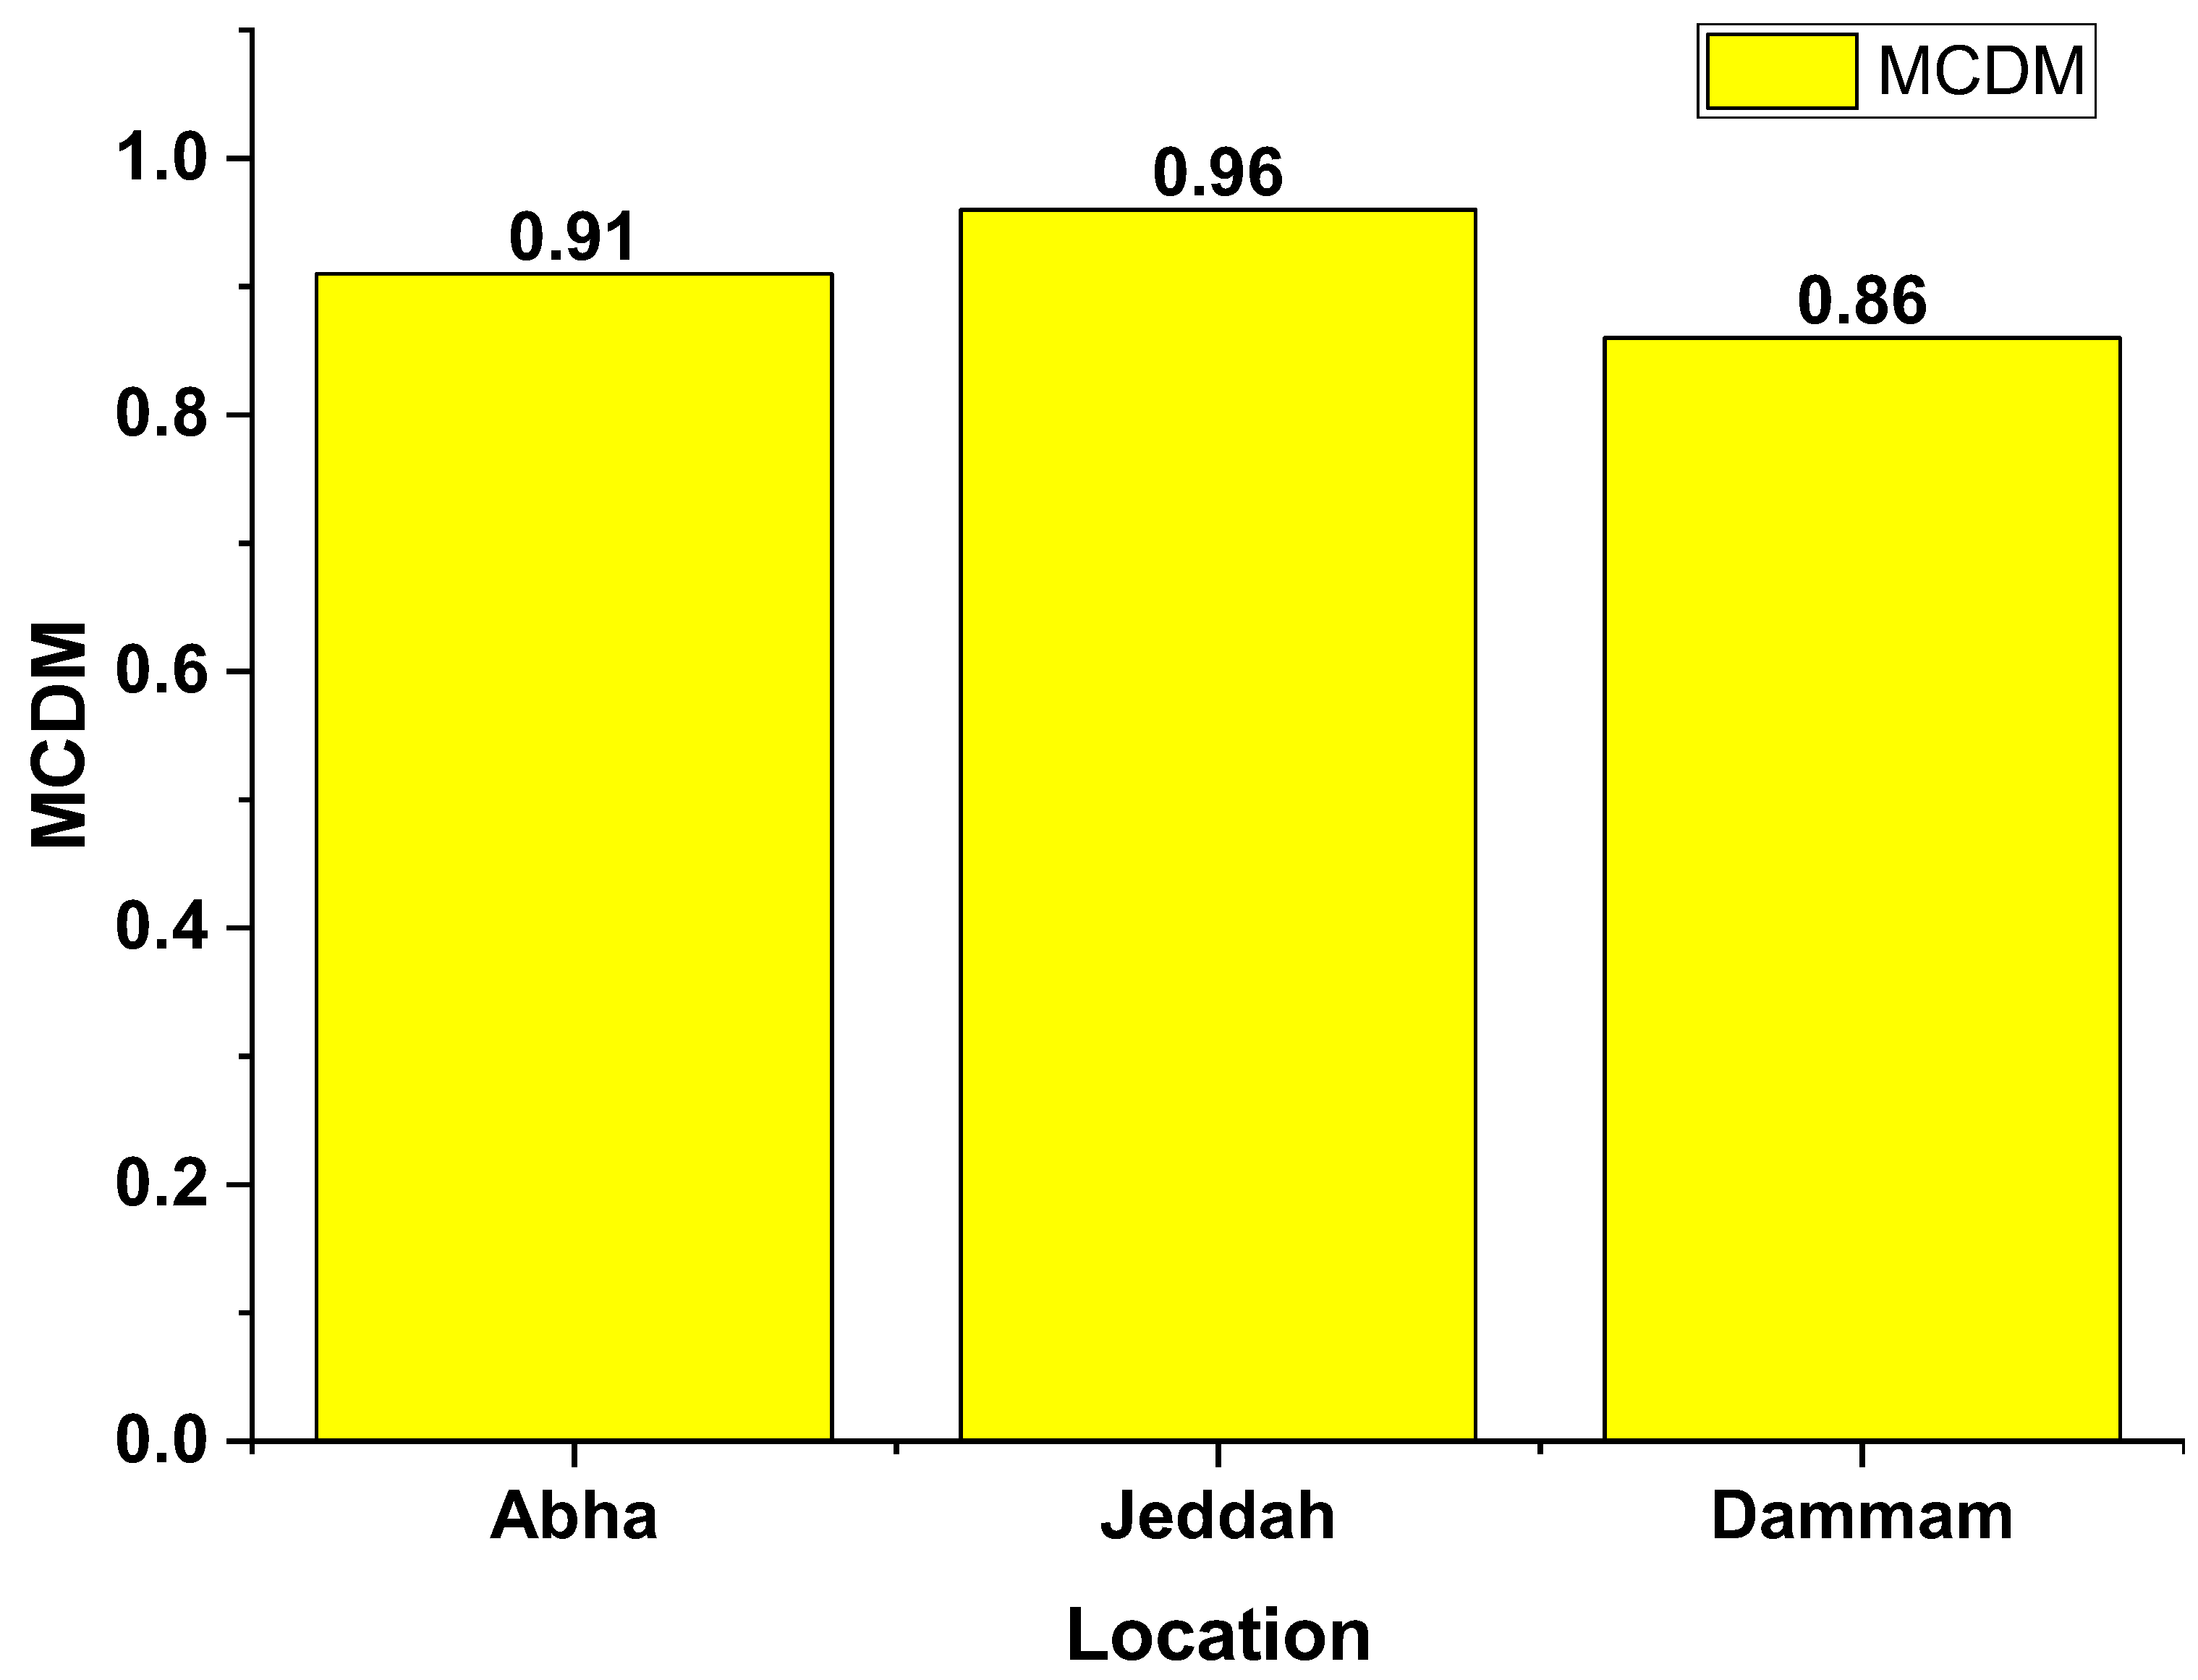
Saudi Arabia generates more than 98% of its electricity through hydrocarbon resources. To reduce the consumption of fossil fuel resources and protect the environment, the government of Saudi Arabia is planning to make renewable energy an essential part of its energy mix. In this study, due to the country’s abundant solar potential, solar energy has been selected as the energy source to generate renewable energy in Saudi Arabia. The two solar energy technologies, photovoltaic (PV) and solar thermal, have been analyzed in three different locations within the country. Multi-criteria decision-making (MCDM) techniques were used to rank the cities for each of the technologies. The SAW(Simple Additive Weighting)-AHP(Analytic Hierarchy Process) MCDM method based on climate, environmental, technical, economic, and social has been adopted to analyze the suitability of each technology for all locations. To assign weights to the criteria AHP method was used, while to rank the technologies, SAW was used. The results show that for the PV technology, Abha ranked 1st with a performance score of 91%, making it the most suitable location, followed by Jeddah with 83%. While for solar thermal technologies, Jeddah is the most suitable location, with a performance score of 96%, followed by Abha with 91%. The PV systems generated a maximum of 11,019 MWh in Abha, while the solar thermal produced maximum of 14,000 MWh in Jeddah. Overall, solar thermal technology outperformed PV technology in Saudi Arabia due to the country’s higher temperature. The analysis of photovoltaic and solar thermal technologies in this study provides valuable insight for the government of Saudi Arabia in identifying the best site for solar energy technologies in the country.

1. Introduction

Throughout the world, hydrocarbon resources or fossil fuels are major sources of energy as they are utilized in various applications such as automobiles, generators, heaters, lamps, and stoves. However, the consumption of fossil fuels leads to the emission of billions of tons of carbon dioxide and other greenhouse gases into the environment, making it the primary contributor to climate change. Additionally, fossil fuels have the disadvantage of being finite resources that will eventually deplete over time. Therefore, it is imperative to prioritize the utilization of alternative resources, specifically renewable energy sources (RES), to reduce reliance on fossil fuels and mitigate carbon dioxide emissions [1].
RES are recognized for their environmental friendliness and are considered clean energy sources with minimal to no carbon footprint [2,3,4]. The utilization of RES can effectively reduce the contribution of fossil fuels to carbon dioxide (CO2) emissions [5], mitigate greenhouse gas (GHG) concerns, and address environmental pollution [6,7]. With recent advancements in RES technologies, they have become capable of meeting both domestic and industrial energy demands [8,9]. RES is progressively emerging as the primary source of power generation in various regions worldwide. Furthermore, a global trend is rapidly emerging to replace conventional fuels with RES to fulfill the increasing energy demands [10]. Thus, it is crucial to fulfill international agreements related to environmental protection and promote sustainable development in remote desert and mountainous areas [11,12,13]. Unlike fossil fuels, RES offers economic advantages, environmental protection, a pollution-free environment, and energy security. Therefore, it is of utmost importance for present and future generations to rely on RES to meet global energy requirements [14,15,16].
Several studies have been conducted to evaluate the feasibility of Hybrid Energy Systems (HES) in different locations, considering various renewable energy sources and backup options. Rad et al. conducted a study in the rural city of Iran’s North-West region, which frequently experienced power outages. They concluded that a PV/wind/biogas/fuel cell HES was the most viable option, with a cost of electricity (COE) of 0.233 $/kWh [17]. Similarly, Hoseinzadeh et al. examined the island city of Catania in Italy and determined that a PV/wind/fuel cell/electrolyzer/hydrogen tank hybrid system offered a reliable power supply, with PV contributing 72% of the energy [18]. Ali et al. explored the potential of HES in the northern province of Gilgit-Baltistan in Pakistan and identified hydroelectric power as the most promising source. They proposed optimizing it with wind/battery backup systems [19].
Kumar et al. designed a stand-alone Hybrid Energy System (HES) comprising wind, PV, diesel generator, and battery storage to meet a 5 kWh/day load in Delhi, India [20]. The renewable energy sources successfully fulfilled 98% of the load demand, with the remaining 2% supplied by the generator. In a similar vein, Seedahmed et al. designed a HES (wind/fuel cell/generator/battery) for a remote company in Al-Shumaisi, Saudi Arabia, demonstrating a 13.84% reduction in net present cost and a 64.2% decrease in greenhouse gas emissions compared to an individual diesel generator [21]. AKAN et al. designed a stand-alone HES consisting of PV, wind, and battery to meet an 11.2 kWh/day load in Tekirdağ, Turkey [22]. The system successfully produced sufficient energy, with 62% coming from PV, 38% from the wind turbine, and battery backup available. Khan et al. designed a HES of PV/wind/generator/battery to power rural residential and agricultural loads in India [23]. Their study highlighted the importance of optimization and location selection, as system performance varied across different locations. Through optimization and careful location selection, the net present cost (NPC) of the system could be reduced by 4%, the cost of electricity (COE) lowered to 0.183 $/kWh (9%), and the share of renewable energy increased to 94%. These studies underscore the significant impact of optimization and location considerations on energy production, NPC, COE, and greenhouse gas emissions in HES.
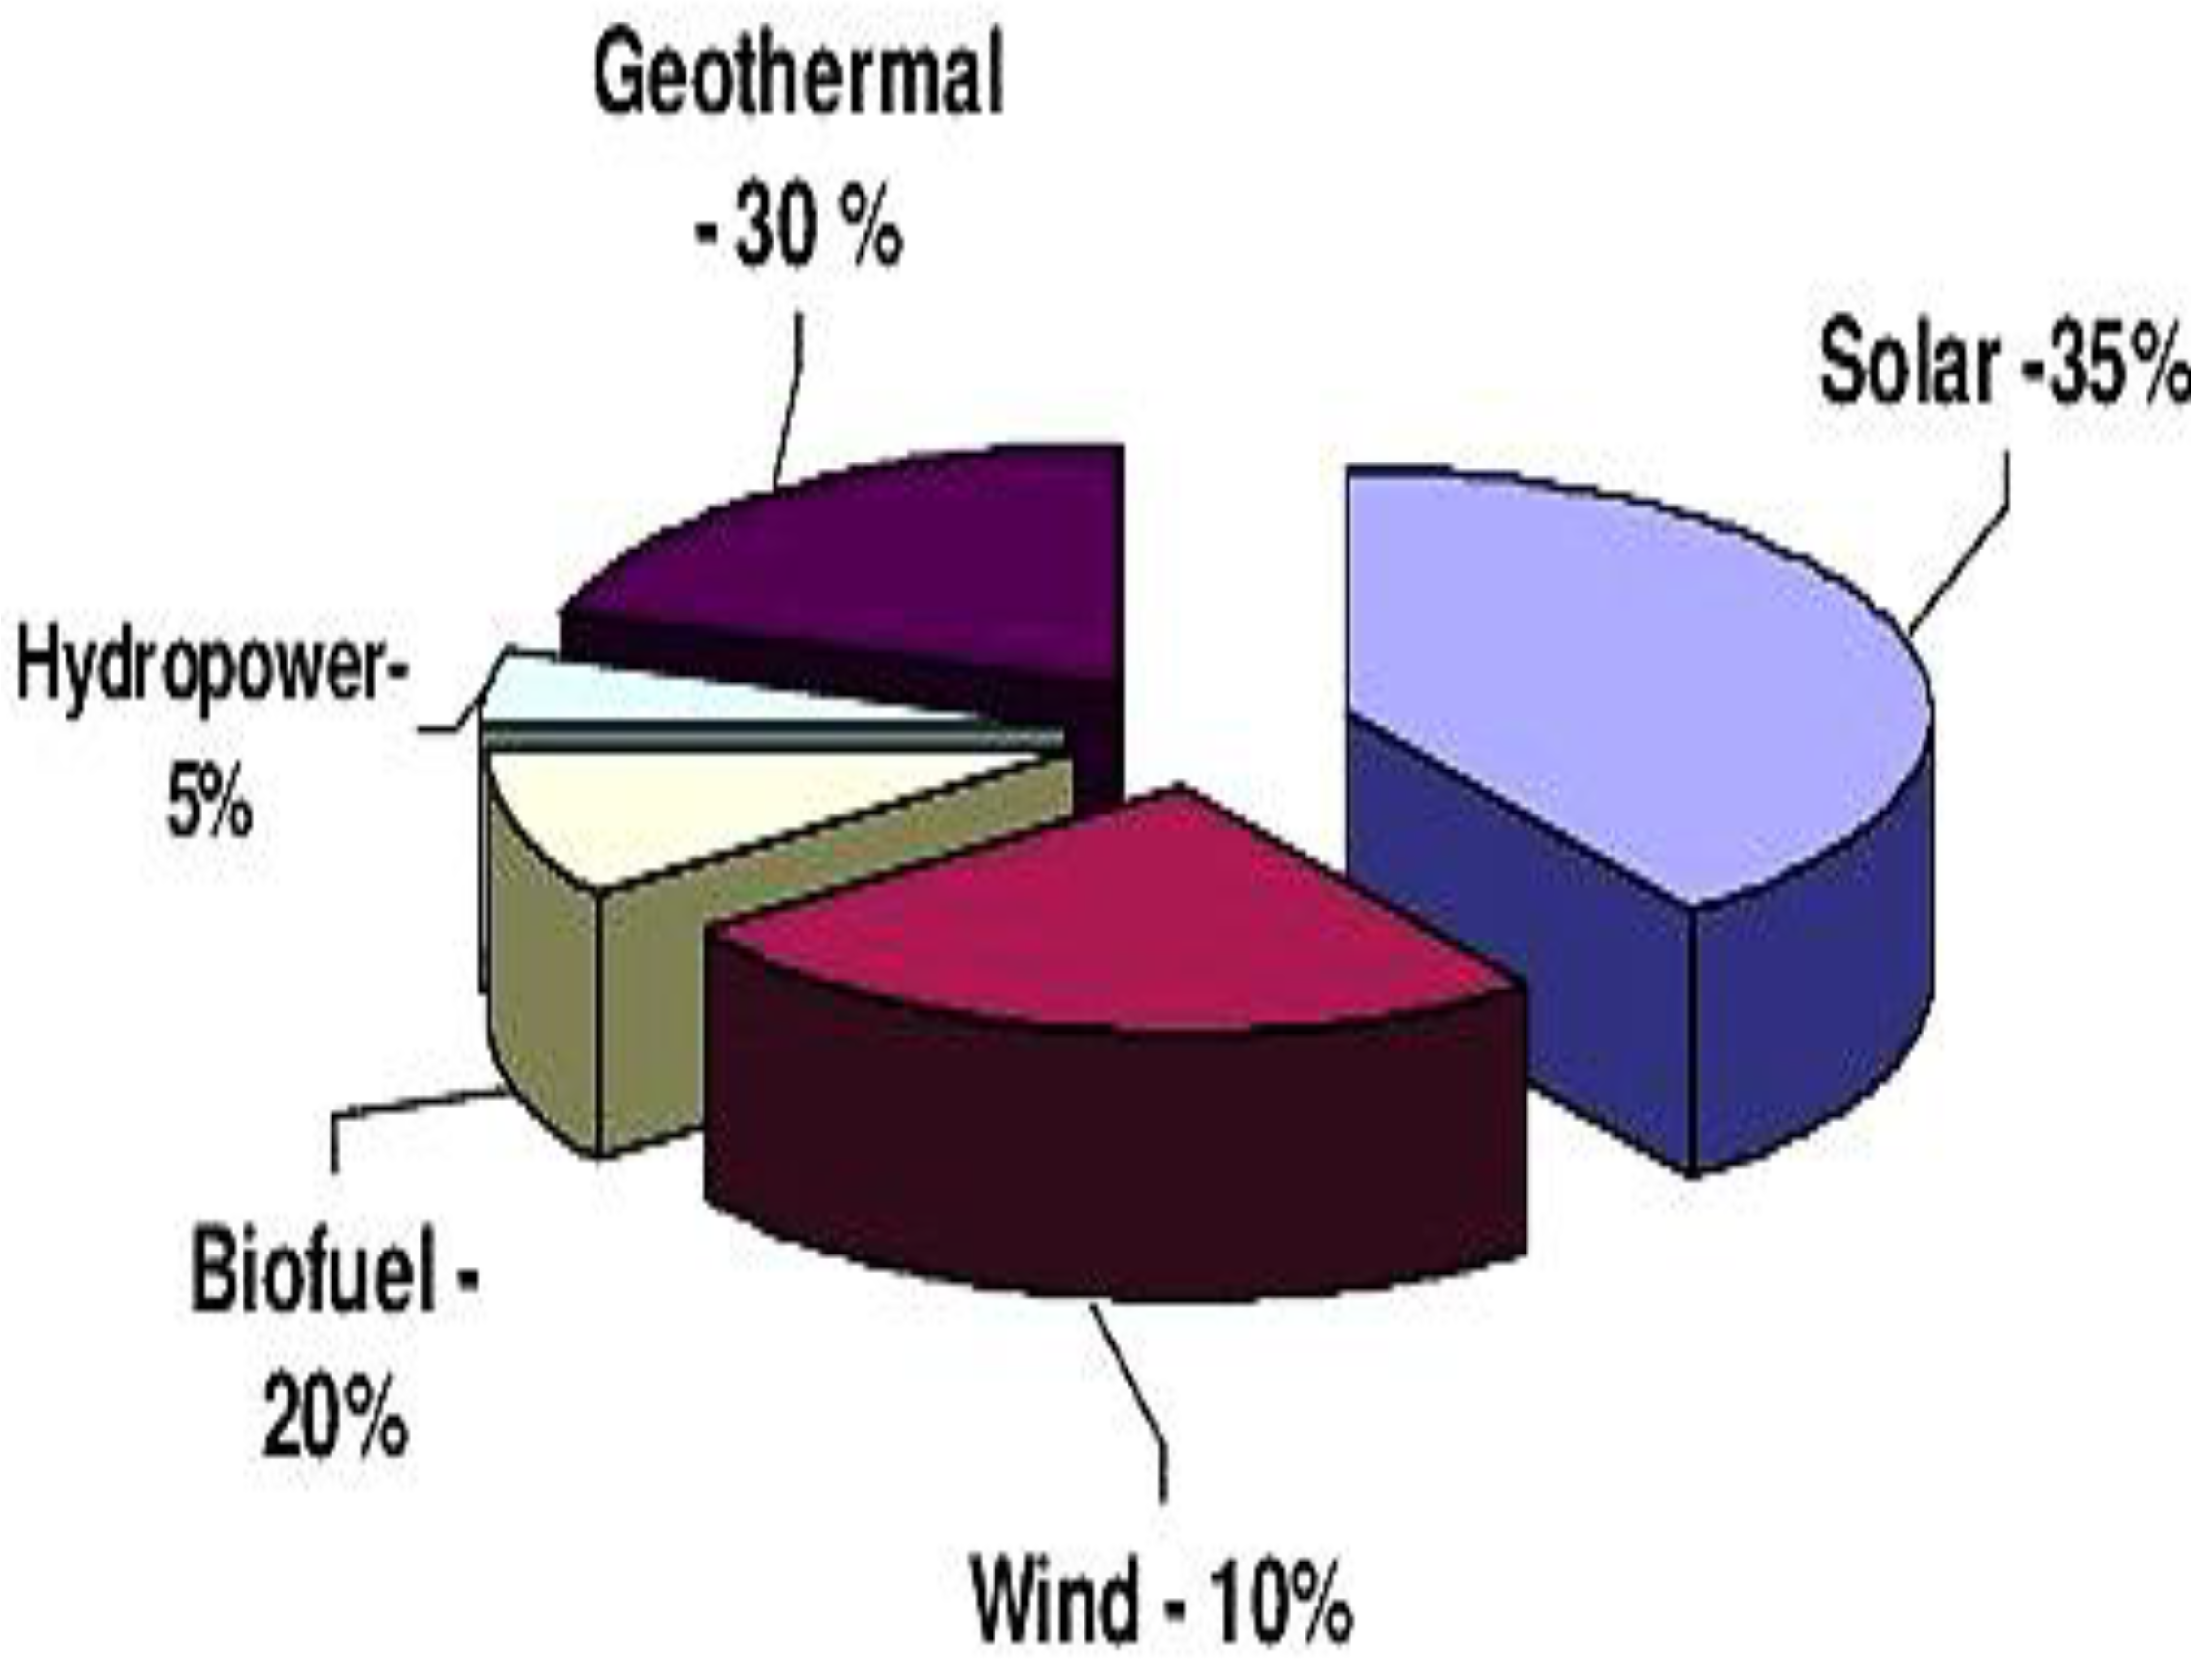
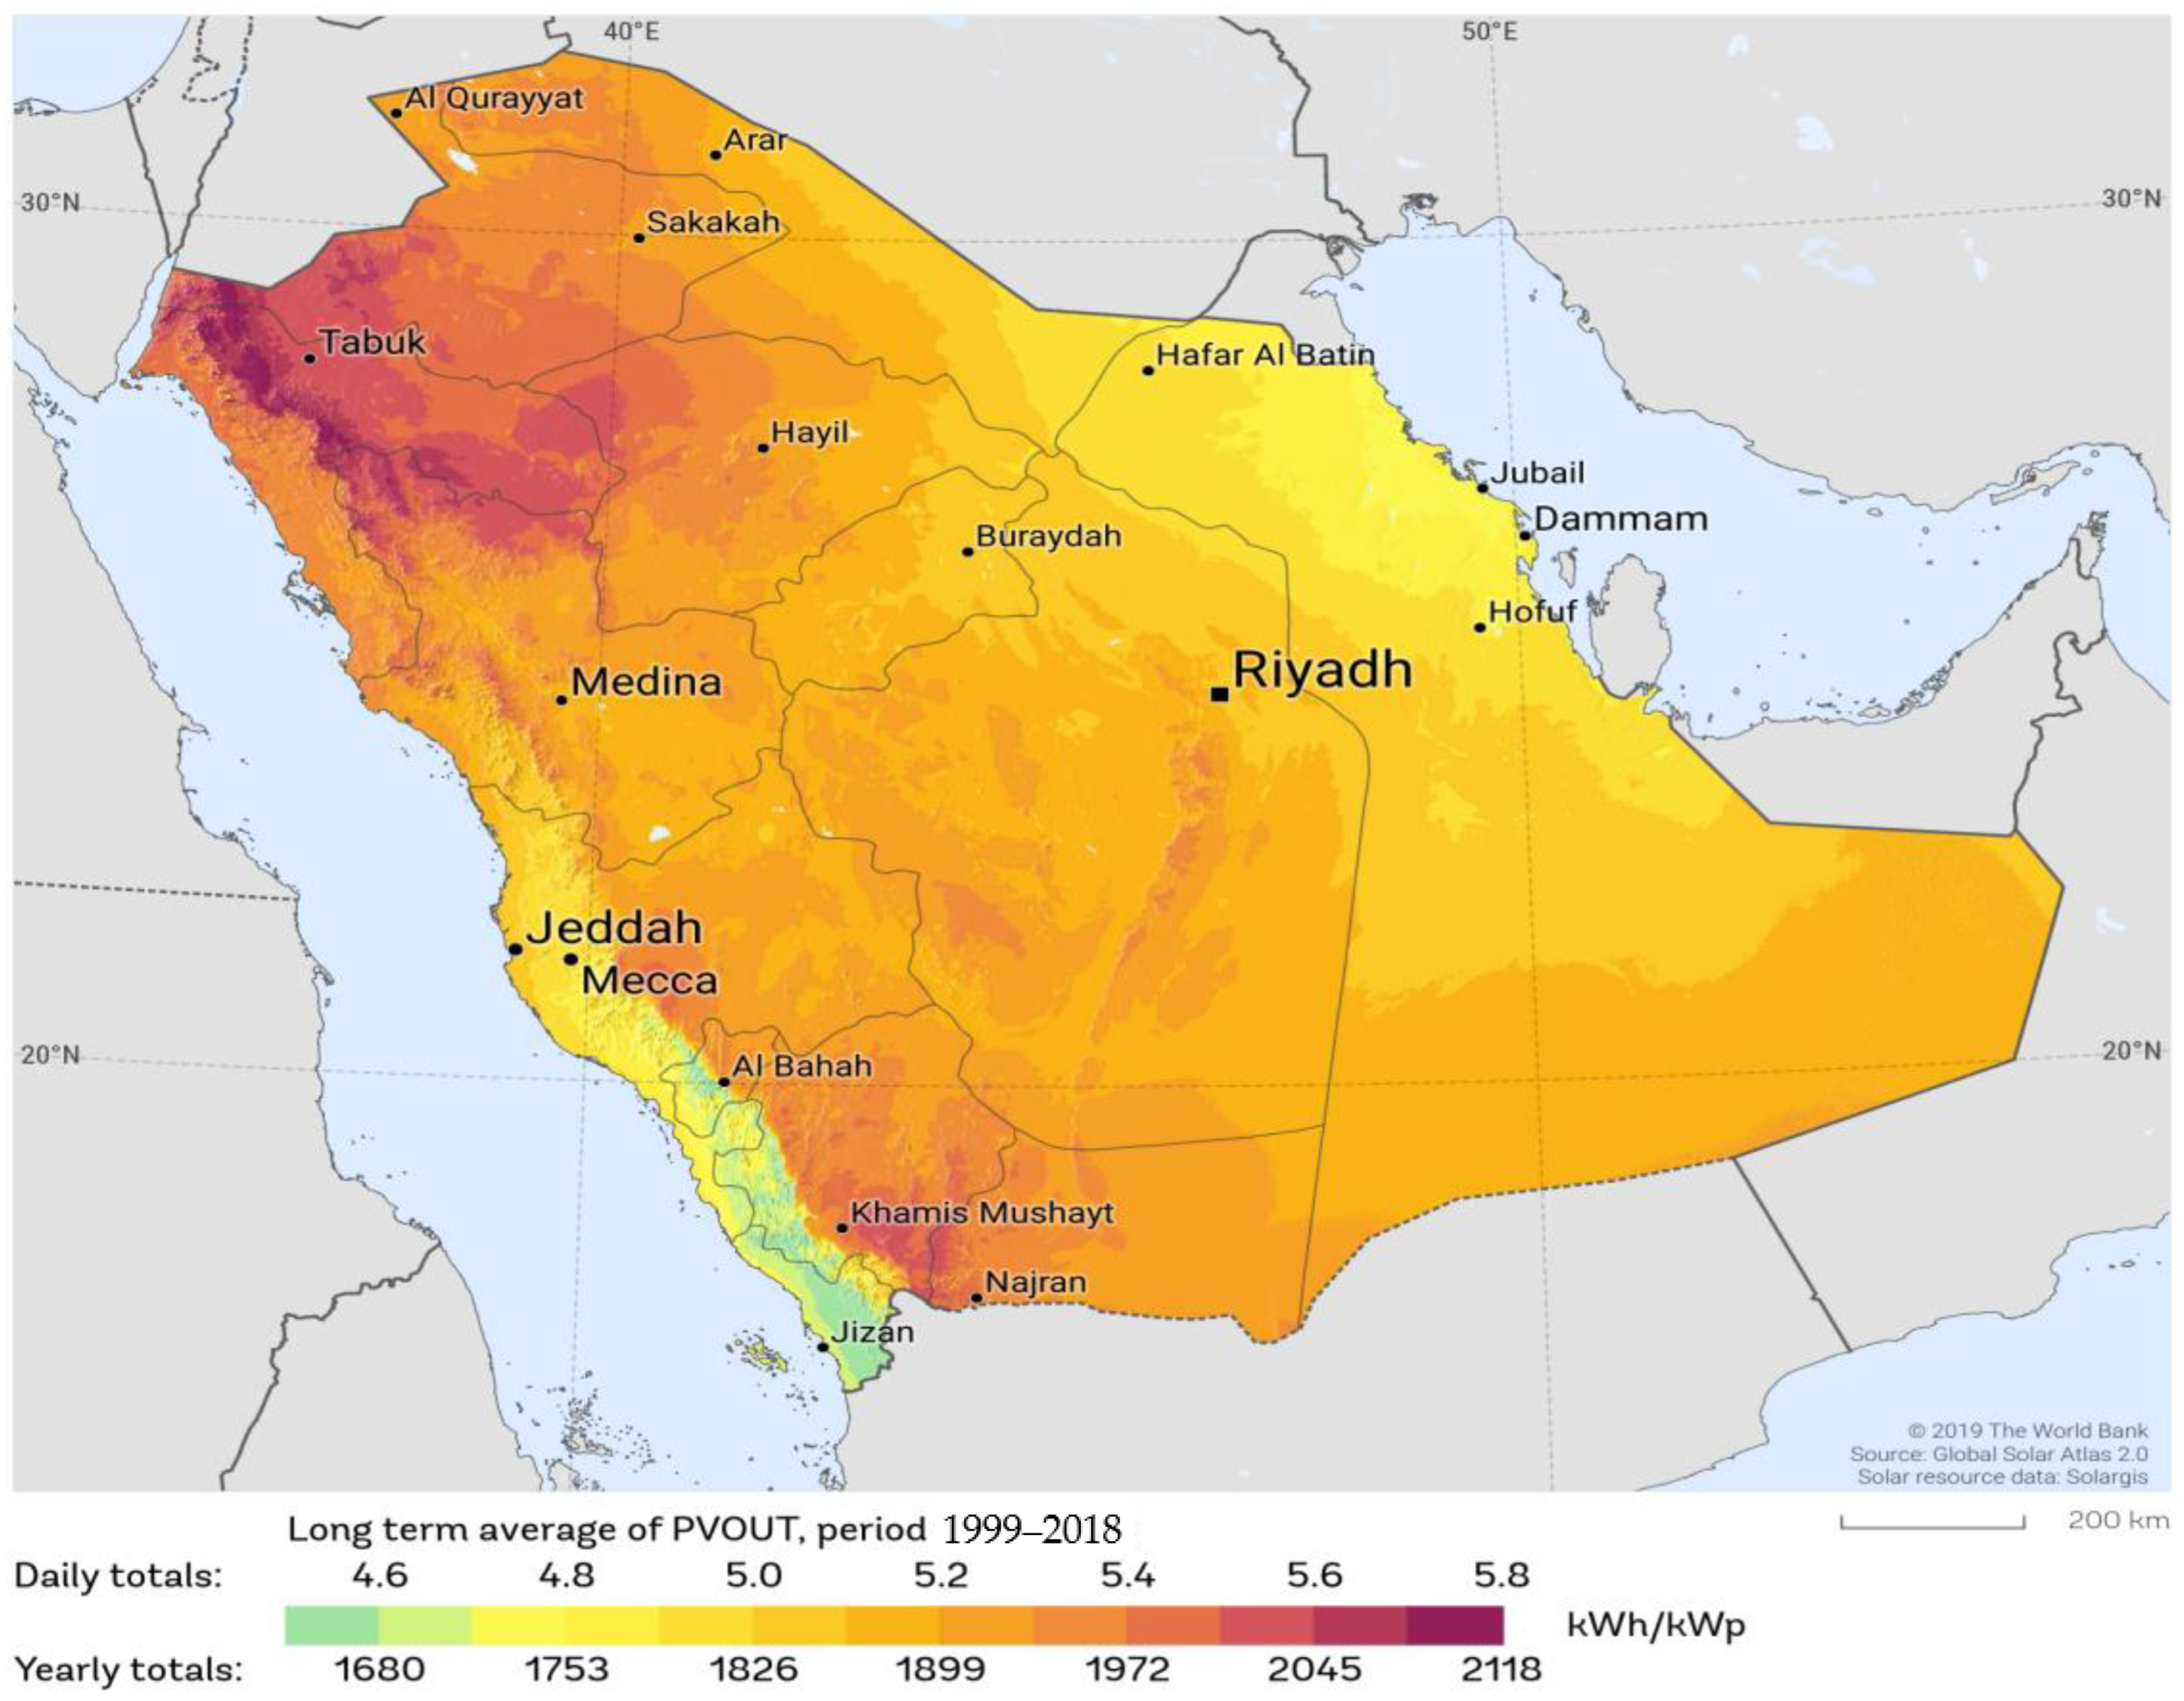
Saudi Arabia, the fifth largest country in Asia, attracts approximately 37 million visitors annually due to its rich cultural and historical heritage, boasting numerous landmarks and attractions. Notably, it is home to significant religious sites, such as Mecca and Medina, attracting Muslim pilgrims year-round. Recognizing the importance of its electric power sector, the country has made substantial investments [24]. Currently, over 98% (Figure 1) of Saudi Arabia’s electricity is generated from hydrocarbon resources, resulting in approximately 14.62 metric tons of CO2 emissions per capita [25]. Saudi Arabia, situated at coordinates 23.8859° N and 45.0792° E, encompasses a vast land area of 2,150,000 km2. According to World Bank data, the country is blessed with abundant renewable energy resources. Its favorable geographic location, characterized by dry and sunny weather conditions, combined with expansive open regions, has positioned solar energy as a highly available and promising source (Figure 2) [26]. The daily solar radiation levels can reach up to 5.8 kWh/m2, while the annual solar radiation surpasses 2100 kWh/m2 across most regions in Saudi Arabia (Figure 3) [27]. These factors establish Saudi Arabia as a prime candidate for the widespread implementation of solar-powered systems. To reduce dependence on fossil fuels and mitigate environmental impact, the Saudi Arabian government has formulated plans to incorporate renewable energy as a vital component of its energy portfolio. Recently, the Kingdom of Saudi Arabia (KSA) successfully established two renewable energy projects in Sakaka and Dumat Al-Jandal.
Amran et al. examined the current status, growth, potential, resources, sustainability performance, and future prospects of renewable and sustainable energy (RnSE) technologies in Saudi Arabia in line with the goals of Saudi Vision 2030 [28]. The study predicted that the electricity demand would grow to 120 GW by 2032, with an expected growth to 8.3 million oil barrels per day from 3.4. It reviewed various RnSE resources such as wind, solar, geothermal, hydro, and biomass, with a focus on solar power as a prominent source as the country expects to add 9500 MW from these sources. The study found that the country has remarkable potential in wind and PV, which could be enough for the next 50 years. The potential of offshore wind, biomass, and thermal energy is also emphasized in the study.
Tlili et al., in their study, also emphasized that Saudi Arabia has a large potential for wind and PV energy would fulfill the country’s energy requirement [29]. Due to the lack of rivers and natural water falls in the country, the study shows that Saudi Arabia does not have much potential for conventional hydropower energy. But as the country is surrounded by the Red Sea and the Persian Gulf on two sides, it has a large potential for Tidal and Wave energy. Similarly, the south west region of the country, especially Jizan, has access to hot springs and volcanic rocks, making it an attractive site for geothermal energy. The study also recommends not utilizing biomass in the present as there is a lack of agriculture land in the country, and it may be re-visited in the future if more land is made feasible for plantation.
Alnatheer et al. conducted a study to assess the costs and savings associated with renewable energy systems in Saudi Arabia [30]. The study found that currently, the most cost-effective and savings-driven technology is PV (photovoltaic) due to its rapid development. The next best option is wind energy. The study highlights that building hydro power stations is expensive and time-consuming due to the lack of natural infrastructure. Additionally, technologies like geothermal and fuel cells are still expensive and cannot be considered viable options at this time.
Solar energy is a crucial renewable resource due to the numerous benefits it offers, including cleanliness, abundant energy sources, and the availability of various technologies. Two well-established solar technologies are Photovoltaics (PV) and Solar Thermal [31]. Photovoltaic systems directly convert photon energy from sunlight into electrical energy through semiconductor panels [32]. While solar thermal systems concentrate sunlight using mirrors onto a specific area to capture its heat through absorbers [33,34]. This heat is then utilized to generate electric power.
As solar energy is gaining a foothold in the KSA energy market, it is important to understand one of the most critical factors, that is, the choice of suitable solar technology for each location. As the installation of solar plants requires considerable planning, manpower, time, and cost, it is important to carry out a detailed study for the selection of suitable locations before the installation of the solar technology system [35].
Multi-Criteria Decision Making (MCDM) is a method used to select between two or more solutions based on predetermined standards and common problems [36]. MCDM considers several alternatives and utilizes a mathematical model for resolution. Over the past decades, the use of MCDM has significantly increased for solving various problems related to environmental issues, supply chain concerns, energy storage systems, and more [37]. The MCDM approach typically involves qualitative and quantitative decisions, integrating expert opinions and historical data by quantifying subjective judgments [38].
Diemuodeke et al. conducted a comprehensive study on the optimal configuration of hybrid energy systems in six locations within the South-South geopolitical (SS) zone of Nigeria: Benin City, Warri, Yenagoa, Port Harcourt, Uyo, and Calabar [39]. The study focused on wind and PV-based systems, incorporating energy storage and backup diesel generators for residential households. To determine the optimal hybrid energy system for each location, the researchers employed the HOMER software and a multi-criteria decision-making algorithm that considered technical, economic, environmental, and sociocultural criteria. The analysis revealed that the most suitable hybrid system for Benin City, Yenagoa, and Port Harcourt consists of a combination of a diesel generator, PV panels, wind turbines, and batteries. On the other hand, for the locations of Warri, Uyo, and Calabar, the optimal hybrid system comprises PV panels, wind turbines, and batteries without the need for a diesel generator. These findings were derived from the implementation of the multi-criteria decision-making algorithm, which identified the most favorable hybrid energy system configuration based on the specific requirements and conditions of each location.
In another study, Konneh et al. conducted research in Sierra Leone aimed at addressing the supply deficit by optimizing the sizing of grid-connected hybrid blocks [40]. The study focused on ten hybrid blocks consisting of various components, including Photovoltaic (PV) panels, onshore wind turbines, biomass combustion plants utilizing sugarcane bagasse, Battery Energy Storage Systems (BESS), and Diesel Generation (DG) systems as backup power. To determine the optimal sizing of these hybrid blocks, the researchers utilized a Multi-Criteria Decision-Making (MCDM) approach. The analysis took into consideration factors such as technical feasibility, economic viability, and the potential to reduce the supply deficit in Sierra Leone. The findings of the study highlighted the Kabala district as the most suitable location for the installation of PV panels and wind farms. Dehshiri et al. conducted a comprehensive study on the feasibility of implementing hybrid energy systems in Isfahan province, one of the most polluted and densely populated provinces in Iran [41]. The study evaluated the potential of various components in the hybrid energy system, including wind turbines (WT), photovoltaic panels (PV), diesel generators (DG), converters (CV), and two energy storage scenarios involving batteries (BT), and hydrogen storage. To prioritize the scenarios and identify the most suitable one, the study employed multi-criteria decision-making (MCDM) methods. These methods took into account the various criteria and weights associated with technical feasibility, economic viability, and environmental impact. The results of the MCDM analysis revealed that the PV-WT-CV-BT system emerged as the most favorable option among the considered scenarios.
There are several MCDM models, such as SAW, AHP, ANP, ELECTRE, VIKOR, TOPSIS, etc., and each one has its algorithm [42]. An effective strategy for making decisions using multiple criteria is the Simple Additive Weighting (SAW) method. To assist in decision-making for renewable energy projects, several processes are involved. Firstly, relevant factors to be considered during the decision-making process are determined, including price, environmental impact, energy efficiency, technological viability, social acceptability, and scalability. Secondly, these criteria are normalized to ensure comparability by transforming them into a standard scale. This stage enables the objective evaluation of the criteria using various measuring scales or units. The next step is assigning weights to each criterion to represent its relative relevance. These weights can be calculated using expert judgment, stakeholder preferences, or analytical techniques such as the Analytic Hierarchy Process (AHP). Each solution is then compared to the established criteria to determine its performance. This is achieved by multiplying the normalized values of each choice by the relevant weights assigned to the criteria and summing up the results. Decision-makers can select the best option for the renewable energy project by ranking the alternatives based on their total performance scores.
Xu et al. developed a novel approach called Energy-Aware Computation Offloading (EACO) to effectively reduce energy consumption in mobile computing environments [43]. The primary objective of their study was to optimize the process of offloading computational tasks from mobile devices to remote servers, thereby minimizing energy usage. To determine the optimal offloading solution, the researchers employed the Simple Additive Weighting (SAW) method, which allowed for a comprehensive evaluation of different offloading strategies. By considering various criteria and assigning appropriate weights, the SAW method facilitated the selection of the most efficient offloading approach. The results of their investigation demonstrated that the proposed EACO method outperformed other existing approaches in terms of performance and energy efficiency.
In their research, Mostafaeipour et al. conducted a comprehensive investigation into the feasibility of establishing solar plants for the production of electrolysis-based green chemical fertilizers in five major Iranian petrochemical complexes [44]. The aim was to assess the suitability of these complexes based on a multi-criteria decision-making model. The study considered ten criteria for evaluating and prioritizing the petrochemical complexes, which were grouped into four main categories: climatic, geographic, environmental, and the probability of natural disaster occurrence. By analyzing these criteria, the researchers aimed to determine the most favorable petrochemical complex for the production of green fertilizer using solar energy-assisted water electrolysis. To validate the results, the researchers employed the simple additive weighting (SAW) method, which allowed for a comprehensive assessment and ranking of the petrochemical complexes based on the established criteria. The SAW method played a crucial role in providing objective validation and ensuring the robustness of the findings. The results of the study indicated that the Shiraz Petrochemical Complex received the highest priority for the production of green fertilizer through solar energy-assisted water electrolysis, while the Khorasan Petrochemical Complex obtained the lowest priority. Similarly, Ibrahim et al. used SAW in creating a decision support system for identifying the best school in Jambi [42].
A systematic decision-making method for complex situations with multiple criteria and alternatives is the Analytic Hierarchy Process (AHP). The AHP technique can streamline the decision-making process in renewable energy projects by ranking and comparing various factors. The procedure follows a step-by-step, systematic methodology. The decision problem is first divided into stages using a hierarchical framework, starting with the main objective, followed by criteria and sub-criteria, and finally, the options. The relative importance of the elements is then determined through pairwise comparisons within each level. Decision-makers assign numerical values in a pairwise comparison matrix to express the preference or importance of one element over another. The consistency of these judgments is then examined to ensure clear and accurate comparisons. Next, weights are assigned to each element based on pairwise comparison judgments. Mathematical calculations, such as eigenvalue calculations and eigenvector normalization, are used to determine these weights. Subsequently, the effectiveness of the alternatives is assessed by comparing their performance against each criterion and sub-criterion. Ratings or scores are assigned to the alternatives based on their performance. To obtain a final ranking of the alternatives, the performance scores are combined according to the weights of the criteria and sub-criteria. The alternative with the highest overall rating is considered the best choice for the renewable energy project.
In their study, Zhou et al. conducted a comprehensive analysis of risk factors in distributed wind power systems [45]. They began by reviewing relevant literature to identify and compile a comprehensive list of these risk factors. Subsequently, expert opinions were gathered to rank the identified risks based on their perceived significance. To assess the risks associated with the life cycle of distributed wind farms, the researchers employed the Analytic Hierarchy Process (AHP) method. Political, Economic, Social, and Technical (PEST) factors were identified as the main criteria. AHP revealed that the risk of changes in electricity price policy emerged as the most critical factor influencing the sustainable development and profitability of distributed wind power systems.
In their research, Raghav et al. introduced a novel microgrid energy management approach that incorporates a flexible price elasticity-based incentive-driven Demand Response Program (DRP) [46]. Their work aimed to evaluate the techno-economic performance of various demand response scenarios and identify the most optimal alternative. To achieve this, the researchers created nine different demand response scenarios, each representing a distinct configuration of the microgrid energy management system. Subsequently, they assessed the techno-economic performance indices for each scenario, taking into account factors such as energy cost, system reliability, and load shedding. To determine the best alternative among the evaluated scenarios, the researchers employed the Analytic Hierarchy Process (AHP). This decision-making method enabled them to consider multiple techno-economic criteria and establish their relative importance. By applying AHP, the researchers were able to derive a comprehensive assessment and select the most suitable option based on the established criteria.
In their research, Baseer et al. addressed the pressing need for renewable and sustainable energy generation systems to mitigate the adverse environmental impacts of traditional power generation methods [47]. The focus of their study was on wind farm site suitability analysis using a multi-criteria decision-making (MCDM) approach combined with geographic information system (GIS) modeling. The analysis incorporated various factors such as wind resources, accessibility, proximity to the electrical grid, and considerations of climatic, economic, aesthetic, and environmental criteria. By utilizing published literature and establishing criteria constraints, including buffer zones and exclusion zones, suitability scores were assigned to each criterion. The analytical hierarchy process (AHP) was employed to assign relative weights to the criteria, reflecting their importance. Applying the developed model to the Kingdom of Saudi Arabia, the study identified the most suitable wind farm sites, including locations near Ras Tanura on the coast in the Eastern Province, Turaif in Al-Jawf region at the northern borders, and Al-Wajh on the coast in the western region. The central and southeastern regions were deemed unsuitable due to limited wind resources, sparse settlements, and inadequate connectivity to roads and the electrical grid.
In their study, Kharrich et al. explored the design of an economic microgrid system for the Yanbu region of Saudi Arabia [48]. Hybrid microgrids of photovoltaic (PV), wind, and biomass, along with energy storage systems, were considered as a solution to various electrical energy challenges. The microgrids offered advantages such as clean energy generation, stable power supply, reduced grid congestion, and new investment opportunities. However, economic aspects, particularly the net present cost (NPC) and the levelized cost of energy (LCOE), posed barriers to their widespread adoption. To address the challenges, the researchers investigated the optimal microgrid configuration based on the quantity, quality, and availability of sustainable energy sources in the Yanbu region, as well as the optimal design of microgrid components. The objective was to minimize both NPC and LCOE while considering technical conditions such as the loss of power supply probability and availability index. To achieve this, the Giza Pyramids Construction (GPC) algorithm was employed as the optimization algorithm. The results highlight that the best microgrid configuration for the Yanbu region was the PV/biomass hybrid microgrid, which achieves a minimum NPC of $319,219 and an LCOE of $0.208/kWh.
In another study, Almasad et al. addressed the challenges associated with implementing photovoltaic (PV) solar power projects in Saudi Arabia, considering environmental, economic, and technical factors that can impact efficiency and cost-effectiveness [49]. The objective of the study was to develop a site-suitability model for solar PV projects in the country. The researchers combined the Analytical Hierarchy Process (AHP) as a weighting technique with the Preference Ranking Organization Method for Enrichment Evaluations (PROMETHEE II) to accurately evaluate site suitability. Twelve factors categorized into technical and economic criteria were incorporated to minimize construction costs and maximize power output from PV power plants. The resulting suitability map revealed that Saudi Arabia possesses vast potential for implementing solar PV projects, with approximately 376,623 km2 (65.1%) of the total studied area. The results indicate that 90.6% of the future projects aligned with the “most and highly suitable” areas identified by the suitability map.
The SAW and AHP methodologies provide structured frameworks for the selection of renewable energy projects. These techniques empower decision-makers to consider multiple factors, analyze alternatives systematically, and incorporate personal preferences or judgments. By utilizing these methodologies, stakeholders can make informed decisions, taking into account various variables such as cost-effectiveness, environmental impact, technical feasibility, public acceptance, and other relevant considerations. The ultimate goal is to identify the renewable energy source that aligns best with the project’s requirements and objectives in terms of viability and sustainability.
In their research, Mashal et al. presented a recommendation system that addresses the challenge of selecting the most suitable Internet of Things (IoT) applications for individual users [50]. The proposed system utilized a hybrid multicriteria decision-making approach, combining the Analytical Hierarchy Process (AHP) and Simple Additive Weighting (SAW) methods. The model encompassed three critical criteria: smart objects, applications, and providers. These criteria were selected based on their significance in determining the appropriateness of IoT applications for users. The findings of the study revealed that the applications criterion holds greater importance for users compared to the other two criteria. In another research, Kumar et al. introduced a novel evaluation approach that combines the Analytic Hierarchy Process (AHP) and Simple Additive Weighting (SAW) methods to determine the optimal brake friction composite formulation [51]. The study focused on evaluating various attributes related to the performance of the brake friction material, including the coefficient of friction, fade percentage, wear, recovery percentage, friction fluctuations, stability, and variability coefficient. The researchers used the AHP method to establish the relative importance of these attributes in the performance assessment. By assigning weights to each attribute, they were able to quantify their significance in the selection process. Subsequently, the SAW method was employed to calculate the overall performance scores for different brake friction formulations, considering the assigned weights and the performance data. Based on the SAW-AHP evaluation results, the formulation labeled NF-1, which contained 5 wt% ramie fiber, exhibited the most favorable combination of tribological properties required for an effective brake friction material.
In this study, three main cities in the Kingdom of Saudi Arabia (Abha, Jeddah, and Dammam) were selected to investigate the potential of utilizing solar-based power generation through a 5 MW system. Both photovoltaic and solar thermal technologies were considered for each location. Multi-Criteria Decision-making techniques based on SAW and AHP were employed to select the best possible location based on five parameters: climate, environmental, technical, economic, and social. The PV system and solar thermal system were designed using PVSyst V 7.3 and System Advisory Model (SAM) V 2022.11.21r3 software, respectively. The output results of both systems were used as input data for the MCDM calculations.
To the best of our knowledge, this study represents the pioneering attempt to evaluate Photovoltaic (PV) and Solar Thermal Power technologies for three different cities in Saudi Arabia by employing the AHP-SAW technique. This unique approach contributes to the existing body of knowledge by providing a comprehensive assessment of these solar technologies in the context of the selected Saudi Arabian cities. By considering the specific characteristics of each city, such as climate, geography, and load demand, this study aims to enhance our understanding of the performance and suitability of renewable energy sources in Saudi Arabia. The findings of this research can serve as a valuable resource for policymakers, energy planners, and investors, helping them make informed decisions regarding the implementation of renewable energy technologies in the country.
The main contributions of the paper are as follows:
  • Designing of solar technology systems (PV and CSP) for three different cities of Saudi Arabis;
  • Investigating the techno-economic performance of the two solar technologies;
  • Comparative study of the proposed systems based on five parameters, i.e., climate, environmental, technical, economic, and social;
  • Designing a Multi-Criteria Decision-making technique based on SAW and AHP to evaluate each solar technology at the three locations;
  • Identifying the best location for each technology.

2. Methodology

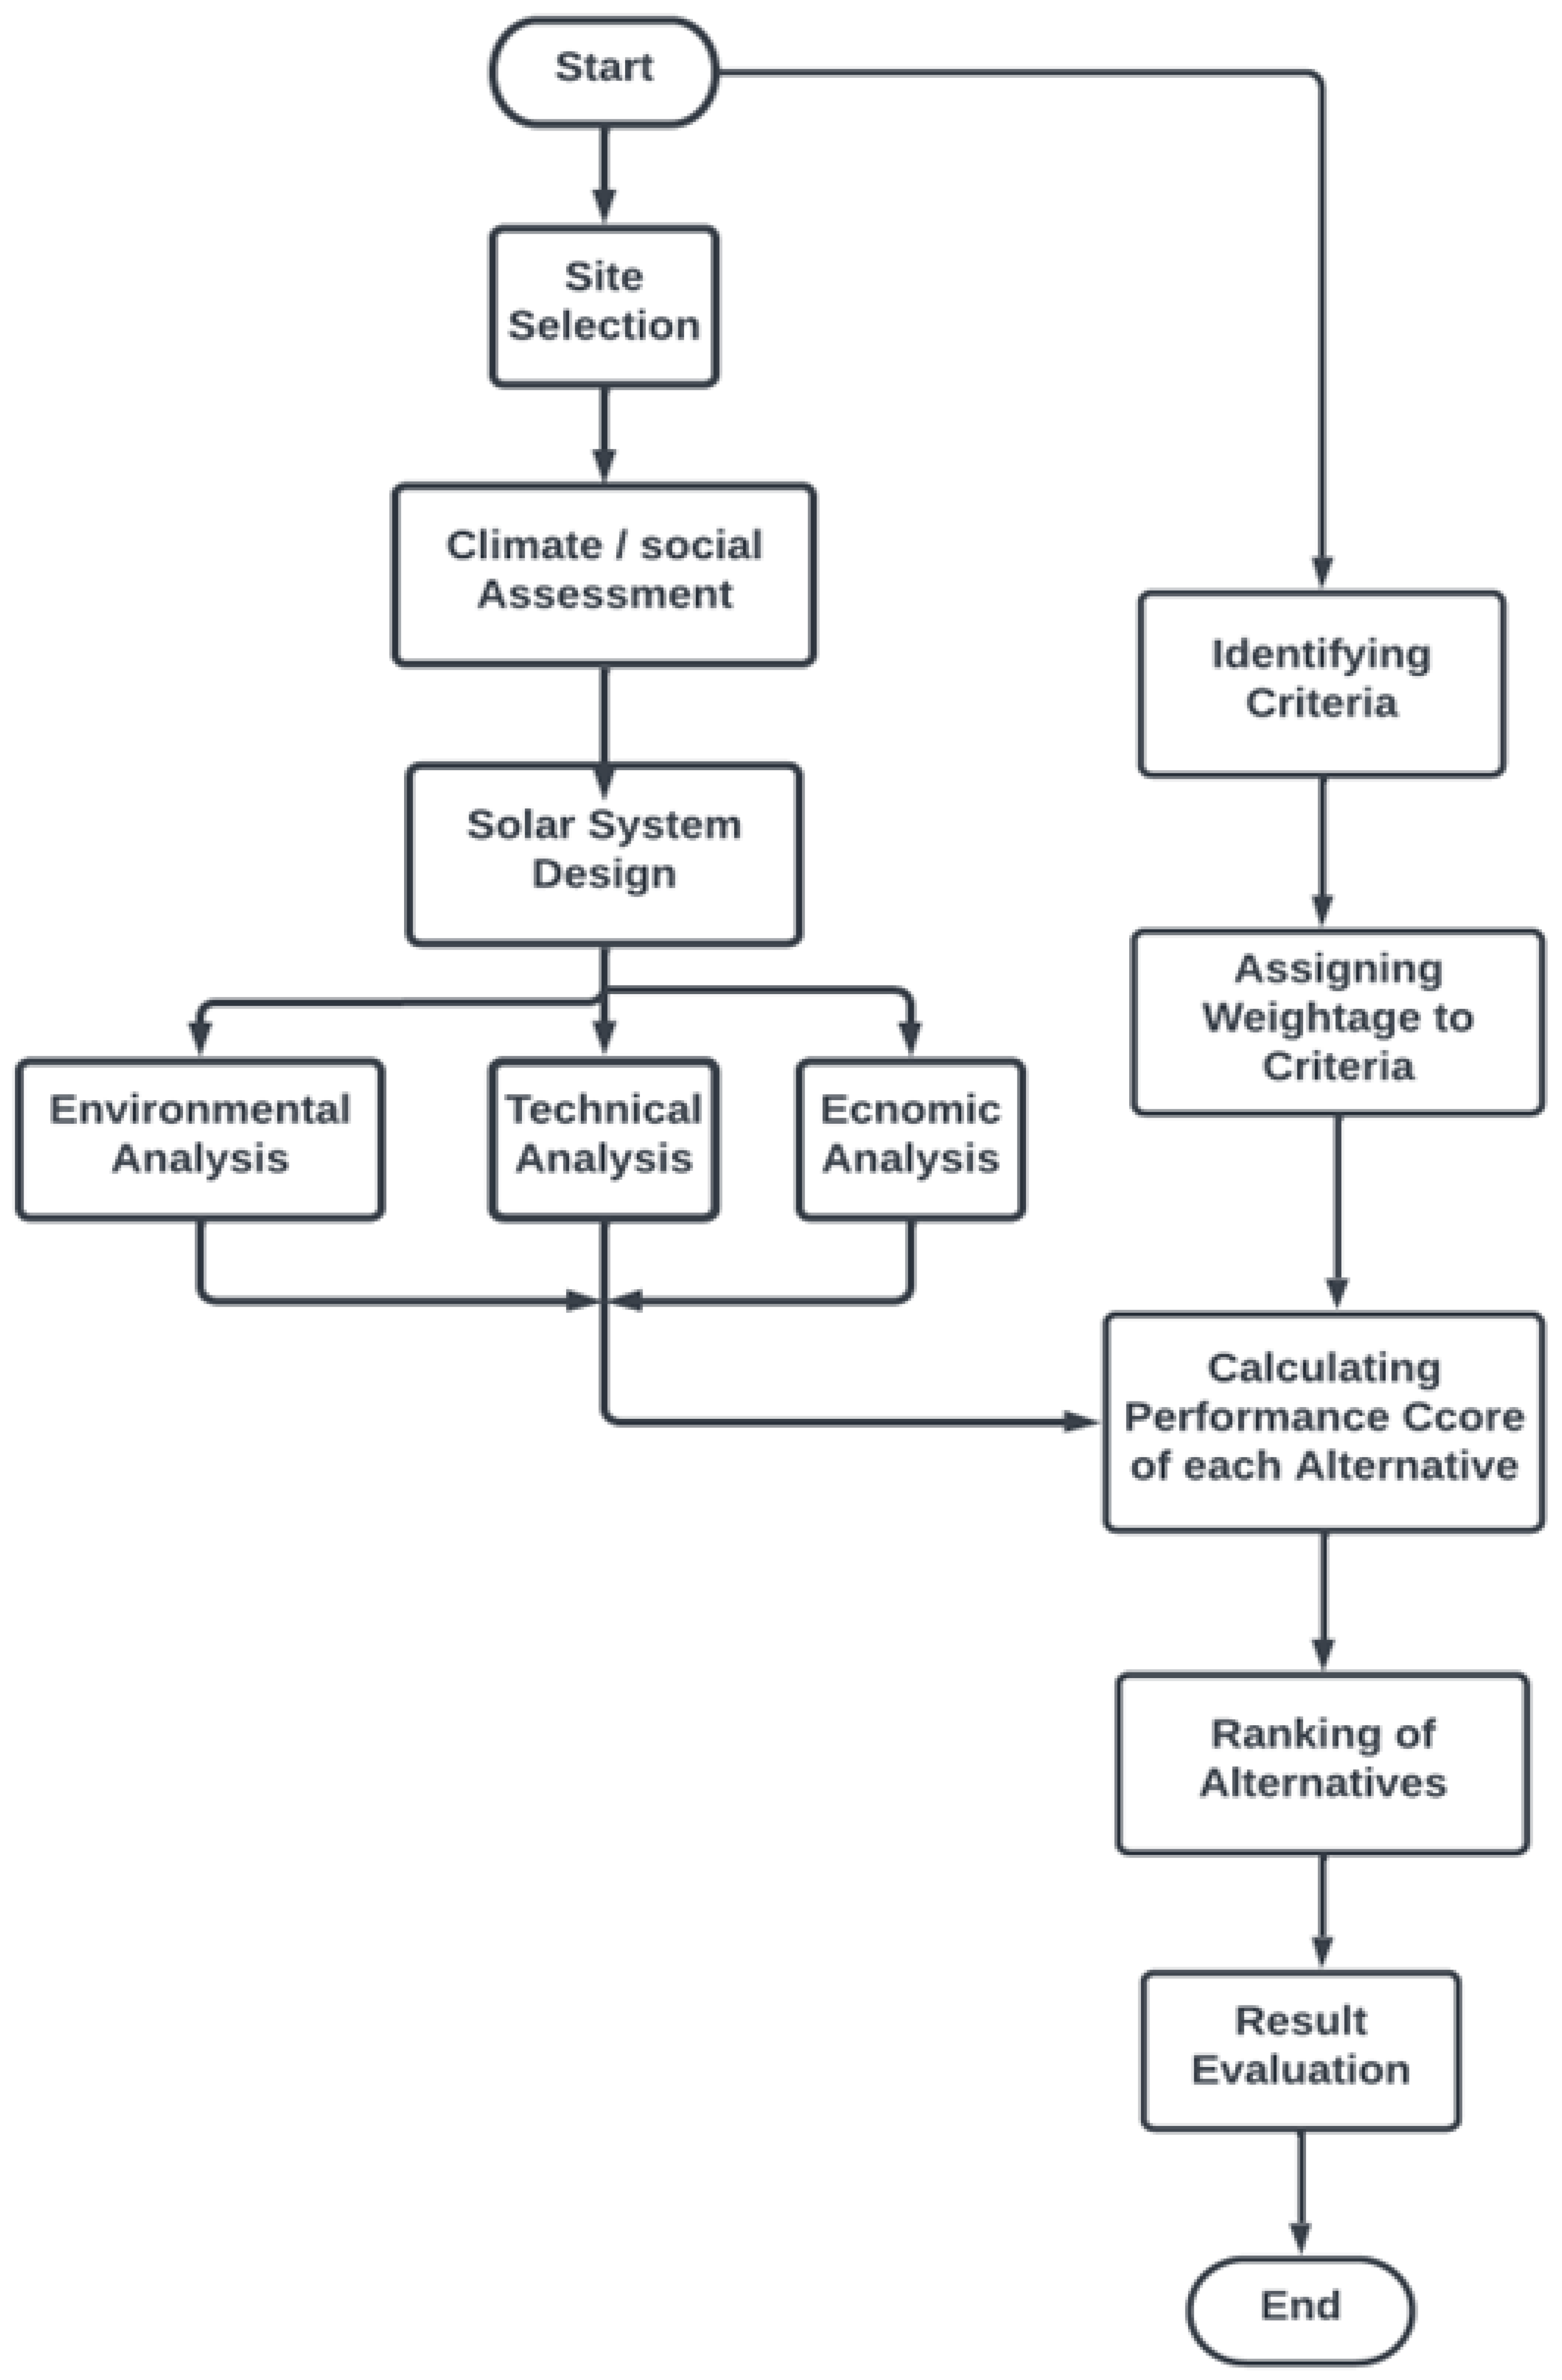
In this work, the Multi-Criteria Decision Making (MCDM) method was used to select the best possible technology for each location. The Analytical Hierarchy Process (AHP) method was utilized to assign weights to the criteria, while the Simple Additive Weightage (SAW) method was employed for data analysis and evaluation. The SAW method, also known as the weighted summing method, calculates the weighted sum of performance evaluations for each alternative across all attributes. It requires normalizing the decision matrix to ensure a comparable scale for all available alternative ratings. The SAW method has an advantage over other decision-making models as it is based on pre-defined values and preference weightage, allowing for more accurate judgments. The methodology of the proposed system is illustrated in Figure 4.
The proposed methodology in this work consists of six steps:
Step 1. Identifying a list of factors that affect the generation of power from solar systems;
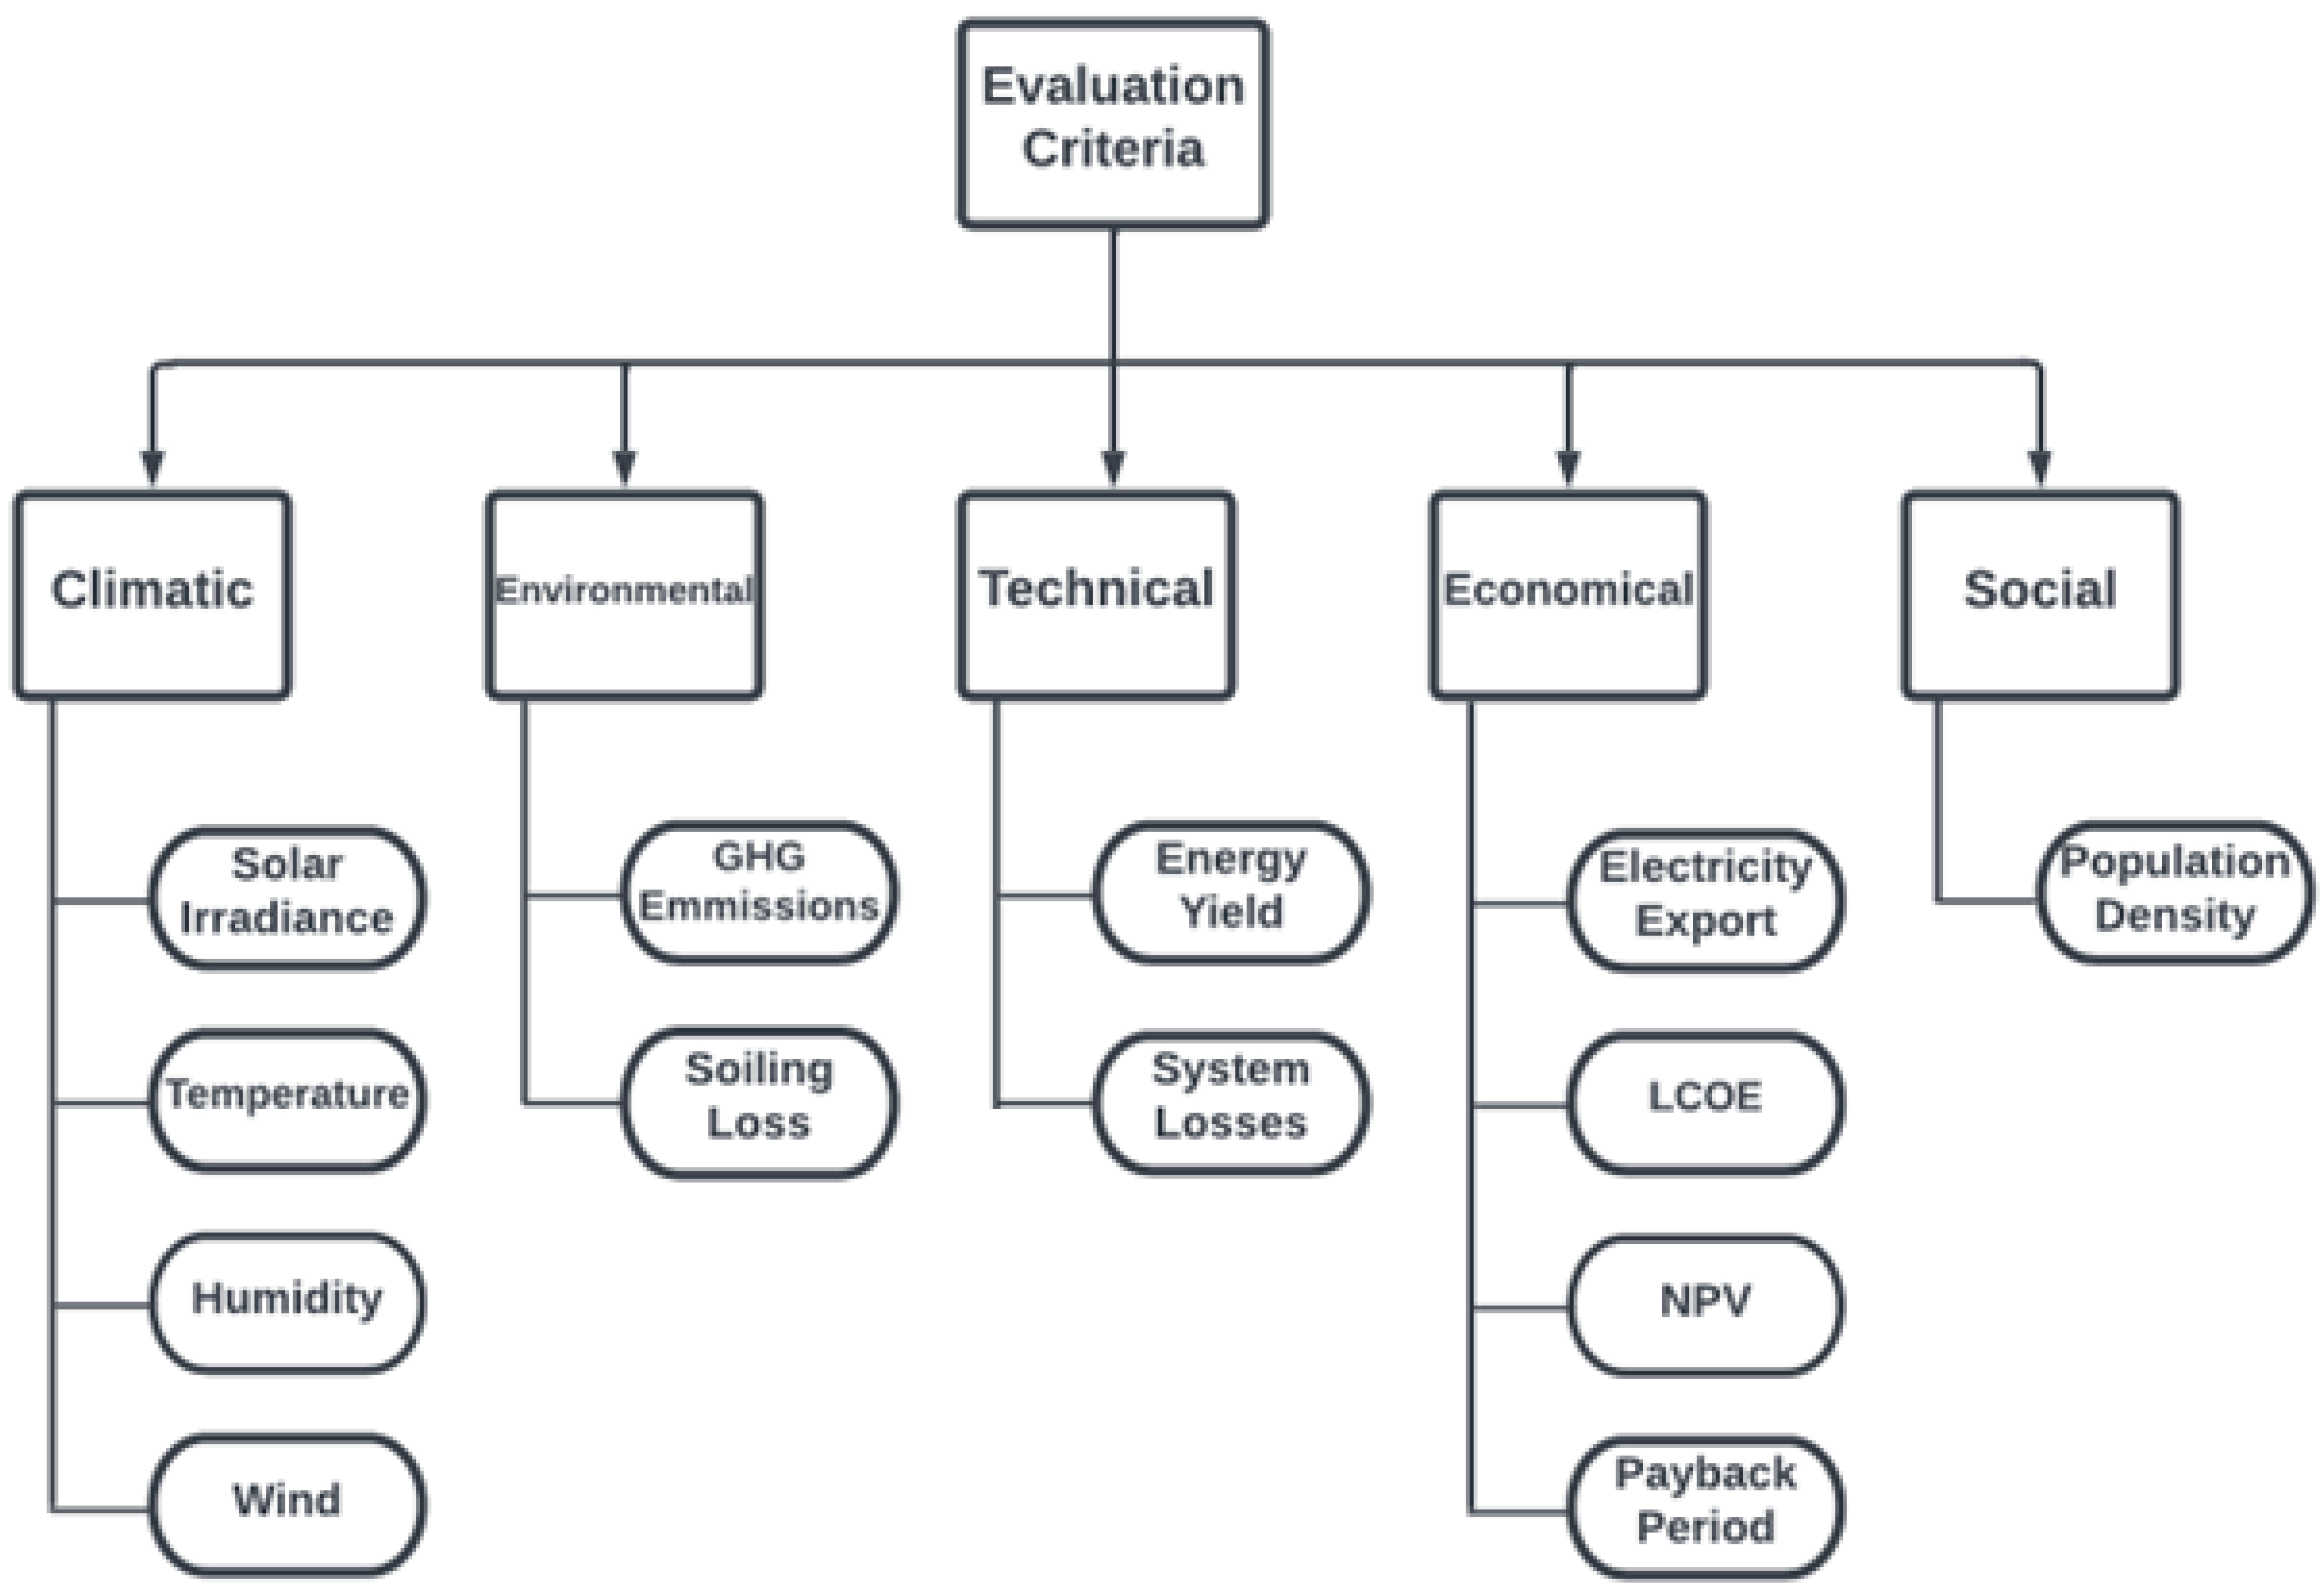
Step2. Selecting criteria for evaluation; in this work, five criteria (Figure 5) were selected based on the technical and environmental features;
Step 3. Assigning weightage to each criterion;
Step 4. Obtaining the decision matrix;
Step 5. Calculating the normalized decision matrix using Equations (1) and (2);
For   Positive   Criteria   x i j = r i j r i m a x
For   Negative   Criteria   x i j = r j m i n r i j
where,
xij = the normalized performance rating of all alternatives;
rij = the rows and columns of the matrix;
rjmax = the maximum value of each row and column;
rjmin = the minimum value of each row and column;
Step 6. Multiplying the normalized weightage of each criterion with the respective criteria weightage;
A j = w j x i j
Aj = the final value of the Alternative;
Wj = the defined weightage;
xij = matrix normalization;
A higher value of the Aj shows that the Alternative is preferred over others.

2.1. Algorithm

In the first step of the algorithm, the criteria that have a huge impact on the MCDM for the solar systems were identified by carrying out an extensive literature review. The system is designed based on the criteria given in Table 1.
To account for the varying levels of importance among the evaluation criteria, a careful selection process was employed in this study. The chosen criteria were specifically tailored to the unique circumstances that may impact the output of the installed solar energy systems. To determine the appropriate weightage for each criterion, the Analytic Hierarchy Process (AHP) method was utilized. To facilitate this process, a comparison decision matrix was created to allow for direct comparisons between each criterion and its pair. This approach enabled the identification of the most significant criteria and ensured a rigorous and systematic evaluation of the solar energy systems in question.
Table 2 shows the scaling values of the pairwise comparison of the criteria. The scale is from 1–9, representing the relative importance of each criterion. The square matrix A = m*m (m represents the number of criteria) is used to create the pairwise comparison matrix. The entry value in the comparison matrix is aij, which denotes the comparison value between both the ith (row) criteria relative to the jth (column) criterion. The values of the comparison matrix are given for all criteria, as shown in Table 3. The pairwise values of Table 3 were generated after going through an extensive literature review. Multiple articles about MCDM used in renewable energy, especially solar energy, were studied in detail. Through the analysis, the relative importance of each criterion was identified and assigned numbers. The values for the table were then derived. Furthermore, the priority vector was created for the matrix, which was then verified through the Consistency Verification process. The consistency ratio (CR) was obtained below 10%, which gives validation to the matrix.
A = a i j
a i j = 1 a j i   i f   i j
e l s e   i f   i = j , a i j = 1
In the next step, each entry value aij must be divided by the sum of the entry values in the belonging column to create a normalized pairwise comparison matrix. The value of the normalized matrix is using Equation (5), as shown in Table 4.
a i j = a i j l = 1 m a l j
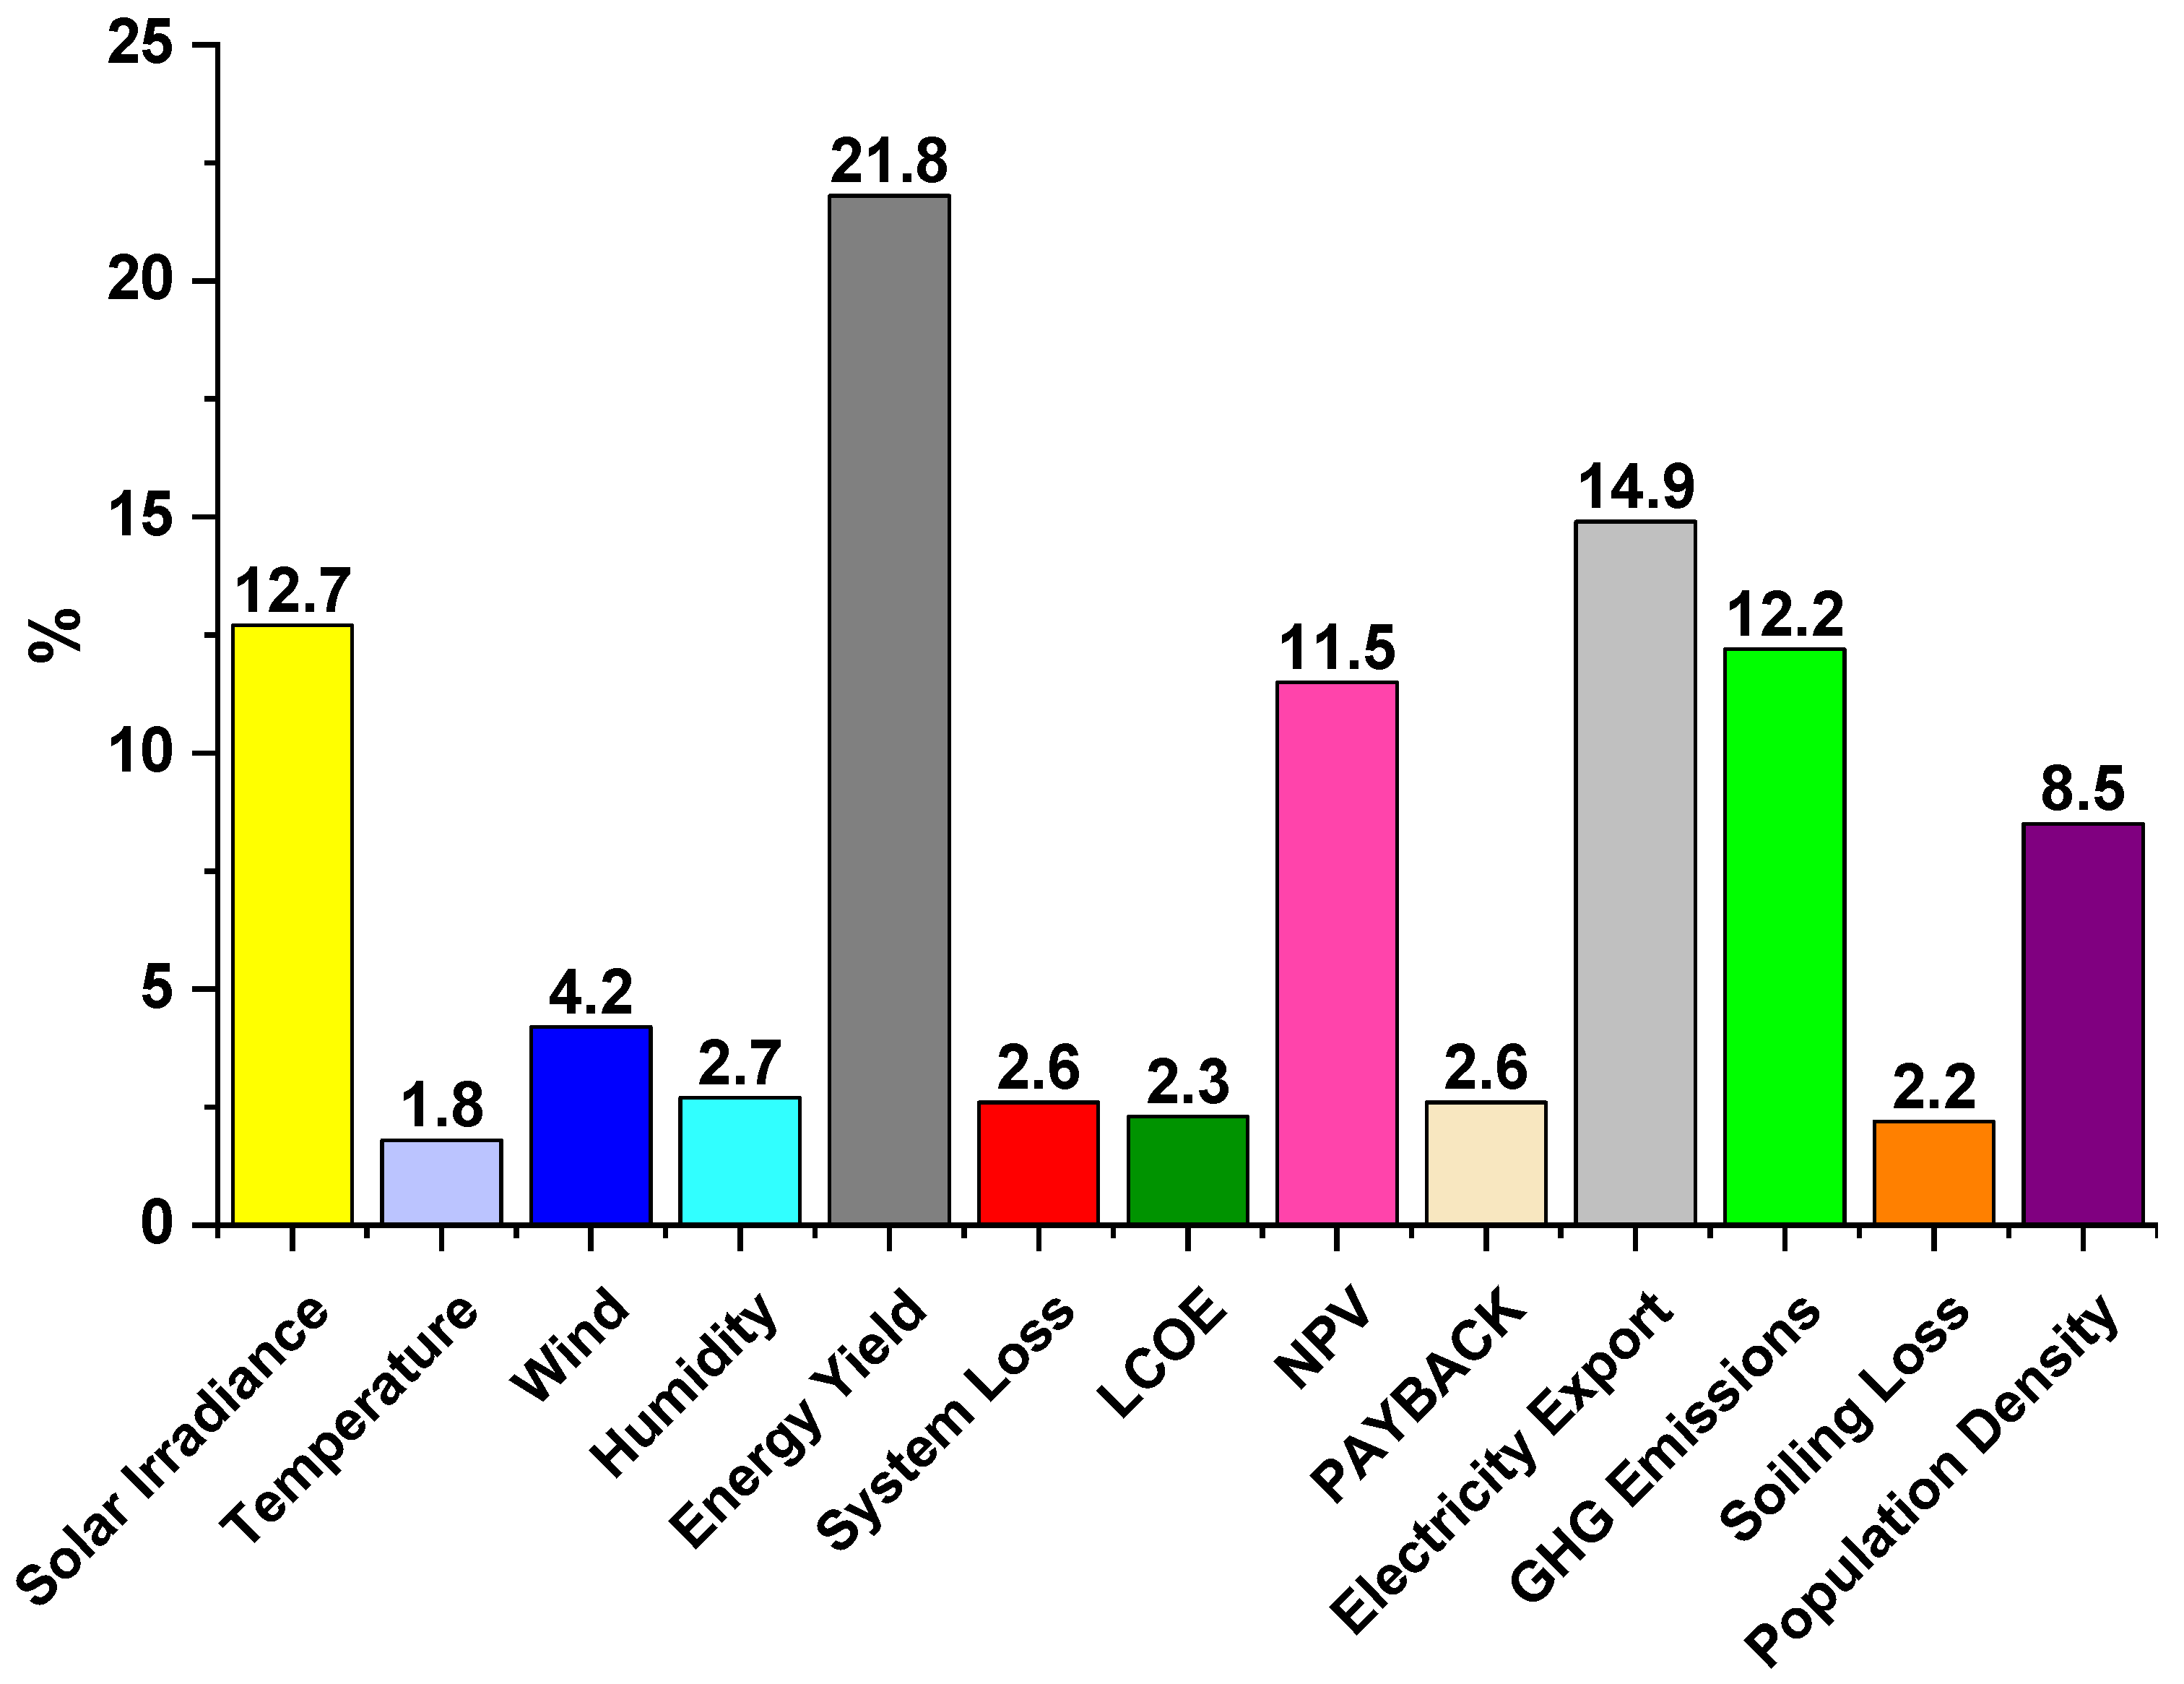
The final step in calculating the overall weight vector involves averaging each row of the matrix shown in Table 5 using Equation (6) and are displayed in Figure 6:
w i = l = 1 m a i l
The multi-criteria utility function (U) is the mathematical representation used in MCDM processes to assess and evaluate alternative options based on multiple criteria. It combines different criteria into a single utility value to facilitate the comparison and ranking of options. The utility function assigns weights or values to each criterion, reflecting their relative importance or priority. These overall weights have been determined in Table 5. The utility function transforms the performance of each alternative on different criteria into a single utility value. This allows us to compare and rank the alternatives based on their overall utility, taking into account the trade-offs and preferences among the criteria. The value for the multi-criteria utility function, taking into consideration the weights of all the criteria, is given in Equation (7).
Multi-Criteria Utility Function (U) = 0.127 × [C1] + 0.018 × [C2] + 0.042 × [C3] + 0.027 × [C4] + 0.218 × [C5] +
0.026 × [C6] + 0.023 × [C7] + 0.115 × [C8] + 0.026 × [C9] +0.149 × [C10] + 0.122 × [C11] + 0.022 × [C12] + 0.085
× [C13]

2.2. Software Tool

2.2.1. PVSyst

PVSyst is a widely used software tool in the field of photovoltaic system design and analysis. It provides comprehensive capabilities for simulating and evaluating the performance of PV systems. With its advanced modeling features, PVSyst enables engineers and researchers to assess various aspects of PV systems, including solar irradiation, energy production, system losses, and financial analysis. The software incorporates accurate and detailed models for PV modules, inverters, and other system components, allowing for precise simulations of energy generation under different conditions. PVSyst takes into account factors such as shading, temperature effects, and module characteristics to provide realistic estimates of system performance. In this study, PVSyst was employed as a key tool for simulating the performance of PV systems in different cities in Saudi Arabia. By utilizing PVSyst, the study was able to calculate the effective global irradiance, estimate annual energy production, analyze system losses, and evaluate the economic viability of the PV systems.

2.2.2. SAM

SAM (System Advisor Model) is a powerful software tool widely used in the field of renewable energy system analysis, including solar thermal systems. Developed by the National Renewable Energy Laboratory (NREL), SAM provides comprehensive capabilities for simulating and assessing the performance of various renewable energy technologies, including solar, wind, and geothermal. In this study, SAM was utilized specifically for the analysis of solar thermal systems in different cities in Saudi Arabia. With its advanced modeling features, SAM enables engineers and researchers to evaluate the technical and economic feasibility of solar thermal projects, assess system performance, and estimate energy production. SAM incorporates sophisticated models for different components of solar thermal systems, including solar collectors, storage tanks, and heat transfer fluids. By inputting site-specific data such as solar irradiation, ambient temperature, and system specifications, SAM calculates key performance parameters such as thermal energy output, system efficiency, and cost projections. Through the use of SAM, the study was able to simulate and analyze the performance of solar thermal systems in the selected cities, taking into account factors such as solar resource availability, system design, and operational characteristics. The software’s comprehensive analysis capabilities provided valuable insights into energy production, system losses, and economic feasibility.

2.3. System Design

The design of a solar power plant depends on various factors, including solar irradiance, type of collectors, installation direction, technology type, and meteorological conditions of the site [54]. Prior knowledge of the planned power production and the total available area for the system’s installation is beneficial when selecting solar technology. In this section, we describe the methodology for designing 5 MW solar plants using photovoltaic and solar thermal technologies in the Abha, Jeddah, and Dammam regions of Saudi Arabia. PVSyst is employed for designing the PV system, while SAM is used for the parabolic trough system.

2.3.1. Photovoltaic System

A PV module is a device that generates direct current power in the presence of global solar radiation. PV modules are categorized based on their manufacturer, quality, and rating. In this study, Polycrystalline Silicon modules from Suntech company were used, with each module having a nominal power of 350 W. The efficiency of these modules was determined to be 15.7%. The efficiency calculation was performed using Equation (8) [55].
ɲ = P m a x S I A 100
where SI = solar irradiance;
A = surface area of the module;
Pmax = panel power.
In this study, a 5 MW grid-connected PV power plant was designed, comprising 14,286 solar modules. These modules were connected in series, with 19 modules per string and a total of 752 strings connected in parallel. The PV modules were installed on a fixed tilted plane. To convert the DC power generated by the modules to AC and mitigate harmonics, inverters were employed. Specifically, five inverters manufactured by Sungrow, each with a rating of 1000 kW, were used in the system. The output from the PV modules, known as the PV array, was directed to the inverters and connected to the utility grid. The specifications of the PV modules can be found in Table 6. The number of PV modules required for the 5 MW system was calculated using Equation (9) [56].
N u m b e r   o f   P V   P a n e l s = T o t a l   P o w e r R a t i n g   o f   S i n g l e   P V   M o d u l e
Inverter efficiency refers to the effectiveness of an inverter in converting DC (direct current) power to AC (alternating current) power [57]. It measures how efficiently an inverter can convert the input DC power from a solar panel or battery into usable AC power for electrical devices or grid connections. A higher inverter efficiency indicates that less power is lost during the conversion process, resulting in more effective utilization of the available energy. The efficiency of this inverter was found to be 98.79%. The efficiency of this inverter is obtained using the Euro efficiency Equation (10).
ɲ(%) = 0.03 × ɲ5% + 0.06 × ɲ10% + 0.1 × ɲ30% + 0.48 × ɲ50% + 0.2 × ɲ100%

2.3.2. Solar Thermal System

In this study, the solar thermal technology chosen was the parabolic trough [58]. The specific model selected for this study is the SkyFuel Sky Trough, which has been certified by NREL as the most efficient technology in its category [59]. It boasts a high thermal efficiency of 73% at 350 °C. For the absorber component of this model, the Schott PTR80 was chosen, and it utilizes HITEC solar salt as the heat transfer fluid. The HITEC solar salt can operate at temperatures of up to 550 °C [60]. Detailed information regarding the design of the collector, receiver, and heat transfer fluid can be found in Table 7 [61].
The following mathematical equations are related to parabolic trough systems for optimum designing and calculating the result [33]. Table 7 presents the design details of the different solar thermal parabolic trough systems based on calculations derived by solving the following equations.
N o .   o f   l o o p s   r e q u i r e d = P t h O u t p u t   p o w e r   c o l l e c t o r N o .   o f   c o l l e c t o r s   p e r   l o o p
F i e l d   A p e r t u r e   s o l a r   m u l t i p l e = P o w e r   c y c l e   c a p a c i t y S o l a r   f i e l d   c a p a c i t y
Output Net = Output Gross × CF
η s e = W e i = 1 1 W s u b , i Q s o l a r + i = 1 n Q a d d , i
ΔWe = power output;
Qsolar = thermal energy input;
i = 1 1 W s u b , i = power consumption;
i = 1 n Q a d d , i = thermal energy load in the boiler.

3. Criteria Calculations

3.1. Climate

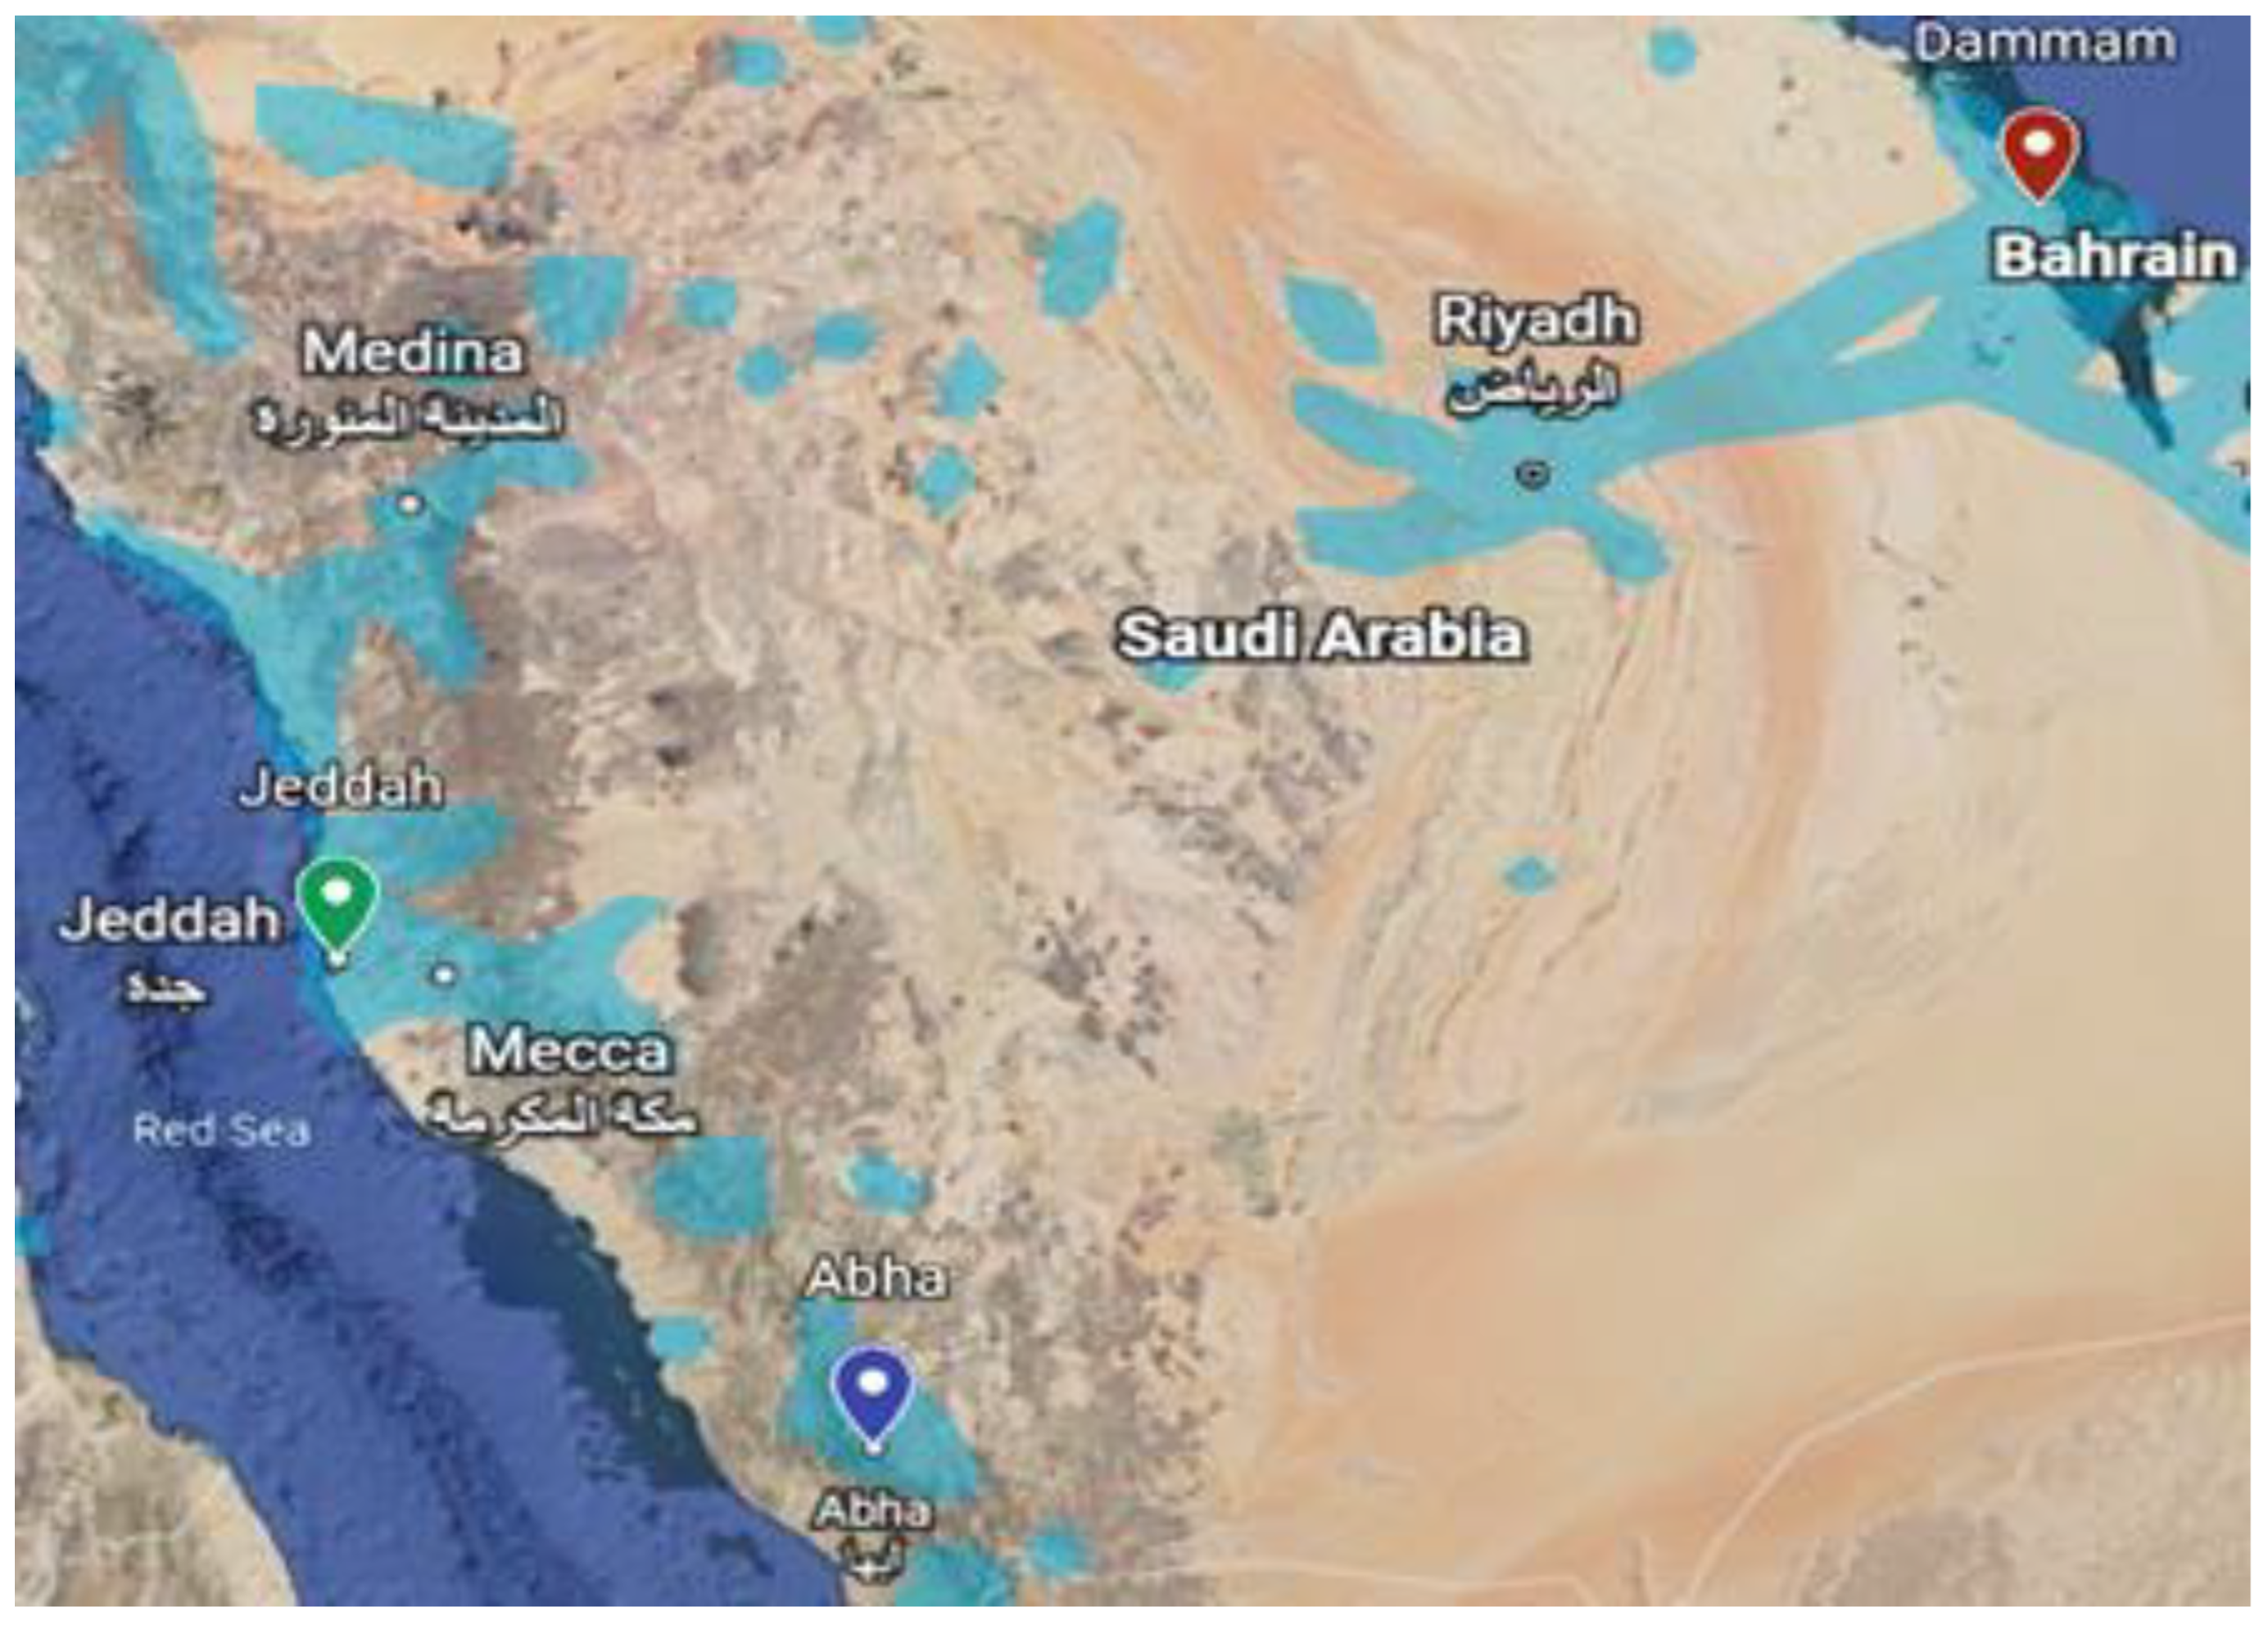
The longitude, latitude, and altitude of each site were obtained using Google Earth Pro V 7.3.3 software. The locations of the three selected cities, Dammam, Jeddah, and Abha, are shown in the map in Figure 7. Table 8 shows the geographical location (latitude and longitude), tilt angle, and azimuth angle of each site.
As Saudi Arabia is located in the Northern Hemisphere, the solar collectors will be oriented towards the south, resulting in an azimuth angle of 0 [21]. The tilt angles for all three locations were calculated using Equation (15) [62].
β = Ø + 23.5   S i n ( 360 365 284 + d )
β = Tilt angle
Ø = Latitude
d = Day of the year
The climate criteria values were derived from PVSyst and is shown in Table 9. The climate in Abha is warm and dry, with a relative humidity of 54.9% and an average yearly temperature of 18.6 °C. Abha experiences an average daily solar irradiation of 5.43 kWh/m2. Jeddah has an extremely hot and dry climate, with a relative humidity of 60.4% and an average yearly temperature of 28.2 °C. The average daily solar irradiation in Jeddah is 5.94 kWh/m2. Dammam also has an extremely dry and hot climate, with a relative humidity of 52%, an average yearly temperature of 26.5 °C, and an average daily solar irradiation of 5.6 kWh/m2. The solar irradiance for any selected location can be calculated using the following equations [63].
I r r a d i a n c e = A v e r a g e   I n s o l a t i o n A v e r a g e   S u n s h i n e
I r r a d i a n c e = i r r a d i a n c e k w h 1000 h o u r s
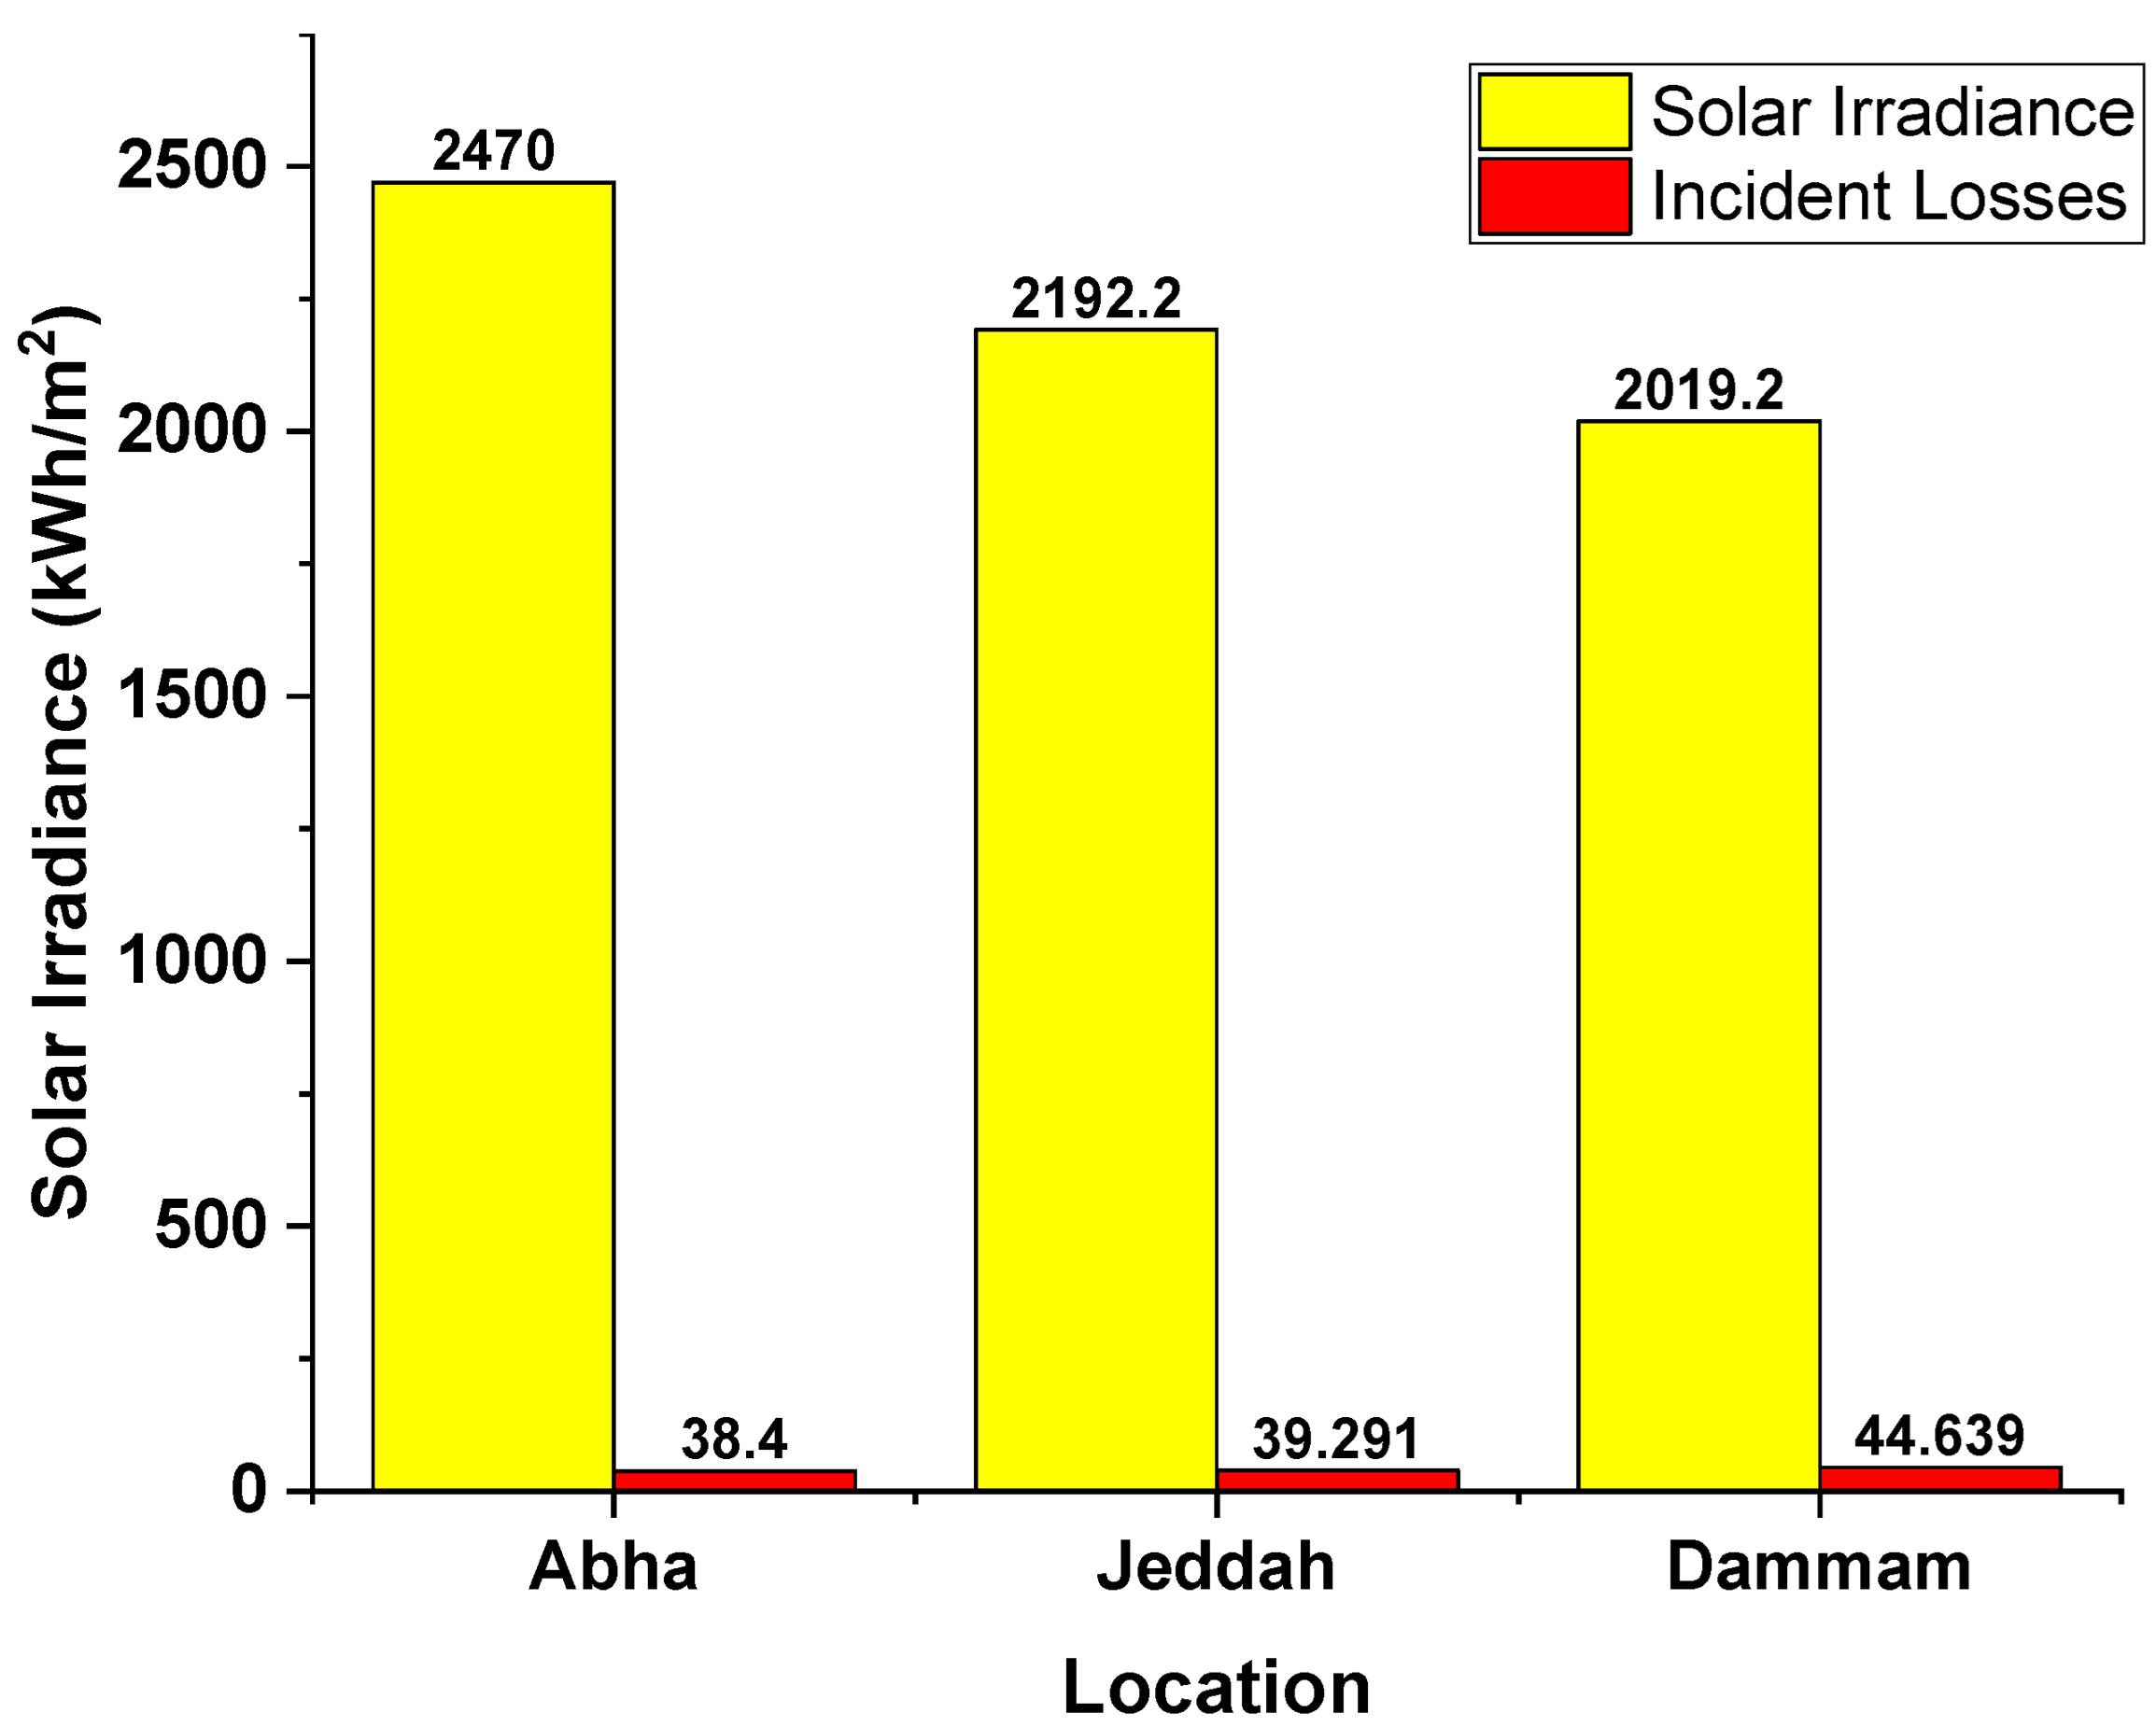
The total yearly global effective irradiance and incident losses for a specified location are be found through the PVsyst V7.3 software’s simulation result option. The results are displayed in Figure 8. The total yearly global effective irradiance for Abha is 2470 kWh/m2, 2192 kWh/m2 for Jeddah, and 2020 kWh/m2 for Dammam. Abha receives the highest amount of yearly solar irradiance, followed by Jeddah and then Dammam. Table 10(b) shows the global incident losses for the cities. The total irradiance loss for the Abha site is 38.4 kWh/m2 (0.3%), 39.391 kWh/m2 (0.4%) for Jeddah, and 44.639 kWh/m2 (0.4%) for Dammam. Dammam has the highest incident losses, followed by Jeddah. Abha has the lowest incident losses.

3.2. Technical Criteria

3.2.1. Energy Yield

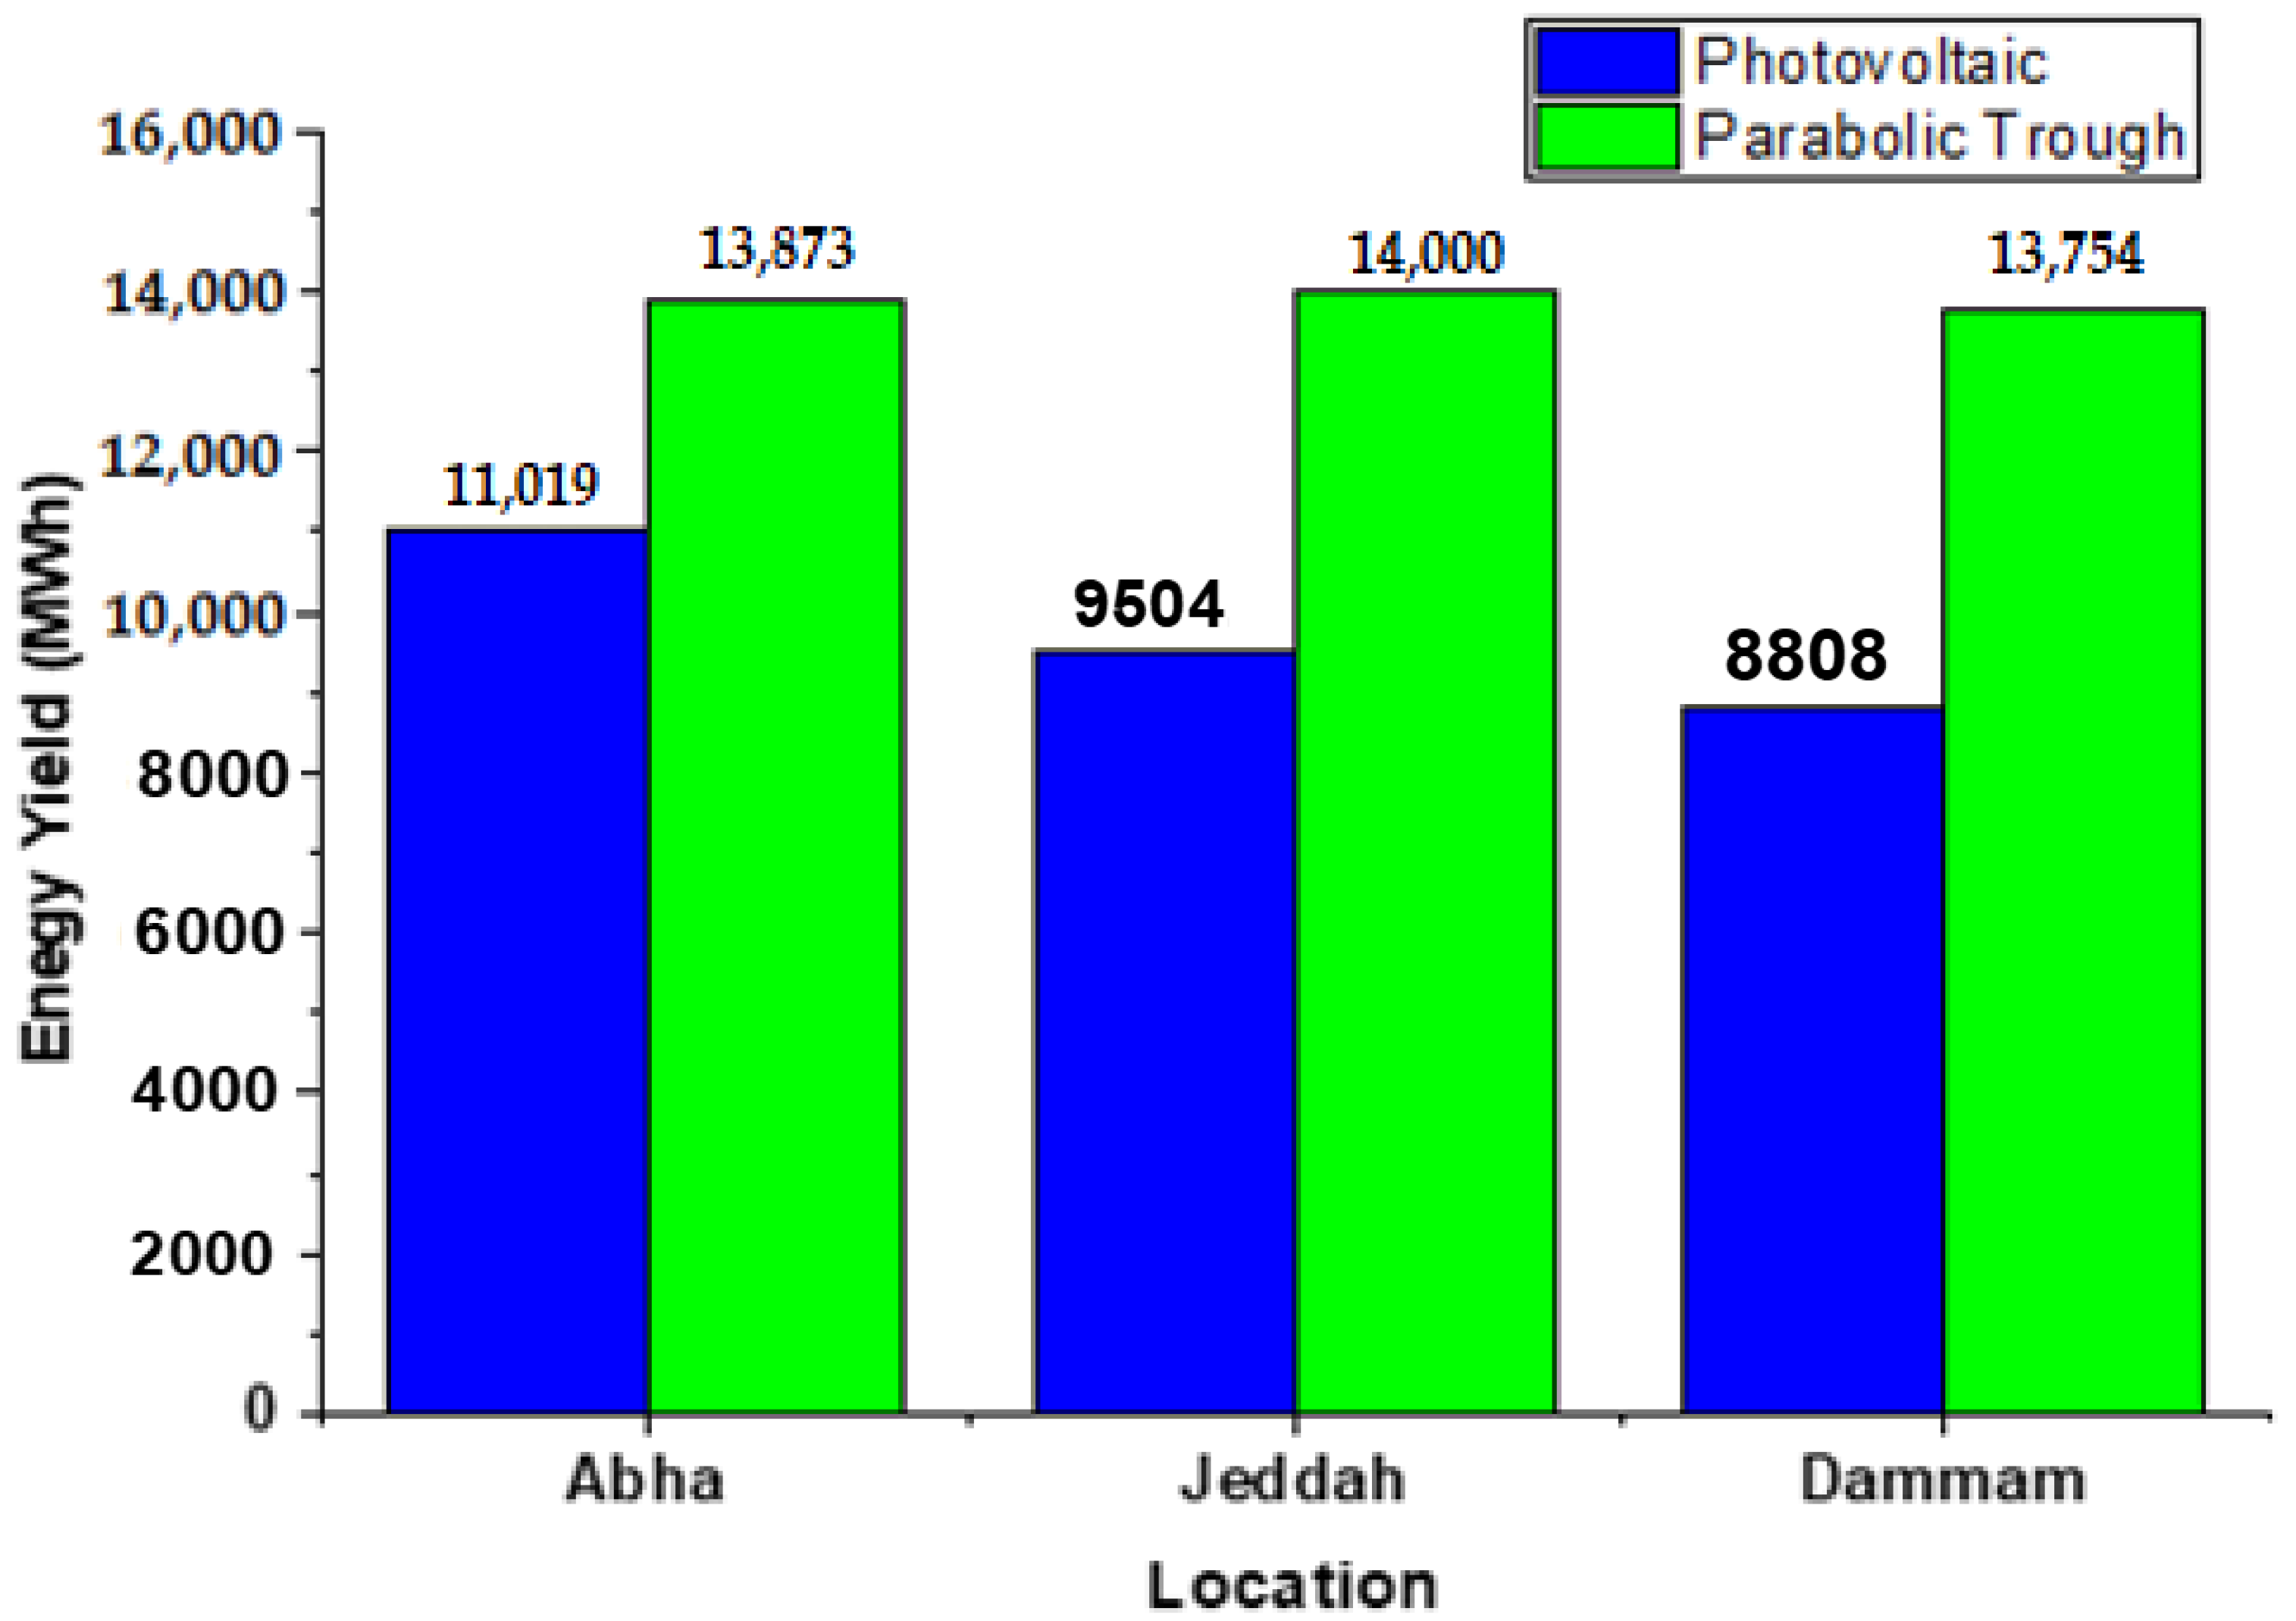
Table 11 displays the total energy injected into the grid for all three sites: Abha, Jeddah, and Dammam, for both solar technologies. The energy yield for the PV system was determined using the PVSyst software, while SAM was utilized for the parabolic trough system. The total energy injected into the grid by the PV system for Abha, Jeddah, and Dammam was 11,019 MWh, 9504 MWh, and 8808 MWh, respectively. On the other hand, the solar thermal system produced 13,873.12 MWh, 14,000.14 MWh, and 13,754.31 MWh, respectively. Figure 9 illustrates the annual energy yield of the systems.
In the PV systems, it can be observed that the system produces more energy during winters than summers due to the lower ambient temperature [64]. Conversely, the parabolic trough behaves oppositely, producing more energy during summers than in winters due to the higher temperatures. Overall, the parabolic trough yields more energy than its counterpart in Saudi Arabia, thanks to the country’s warm weather. Among the PV systems, the highest energy yield is observed in Abha, followed by Jeddah and then Dammam. On the other hand, the parabolic trough system exhibits the highest yield in Jeddah, followed by Abha and then Dammam.

3.2.2. System Losses

Table 12 displays the total energy losses for the PV system, while Table 13 shows the losses for the parabolic trough system in all three sites: Abha, Jeddah, and Dammam. The system losses for the PV system were calculated using the PVSyst software, while SAM was utilized for determining the losses in the parabolic trough system. In the PV system, solar energy is directly converted into electrical energy, resulting in prominent electrical losses. On the other hand, the parabolic trough system converts solar energy into thermal energy first and then into electrical energy, making both thermal and electrical losses prominent in the system.
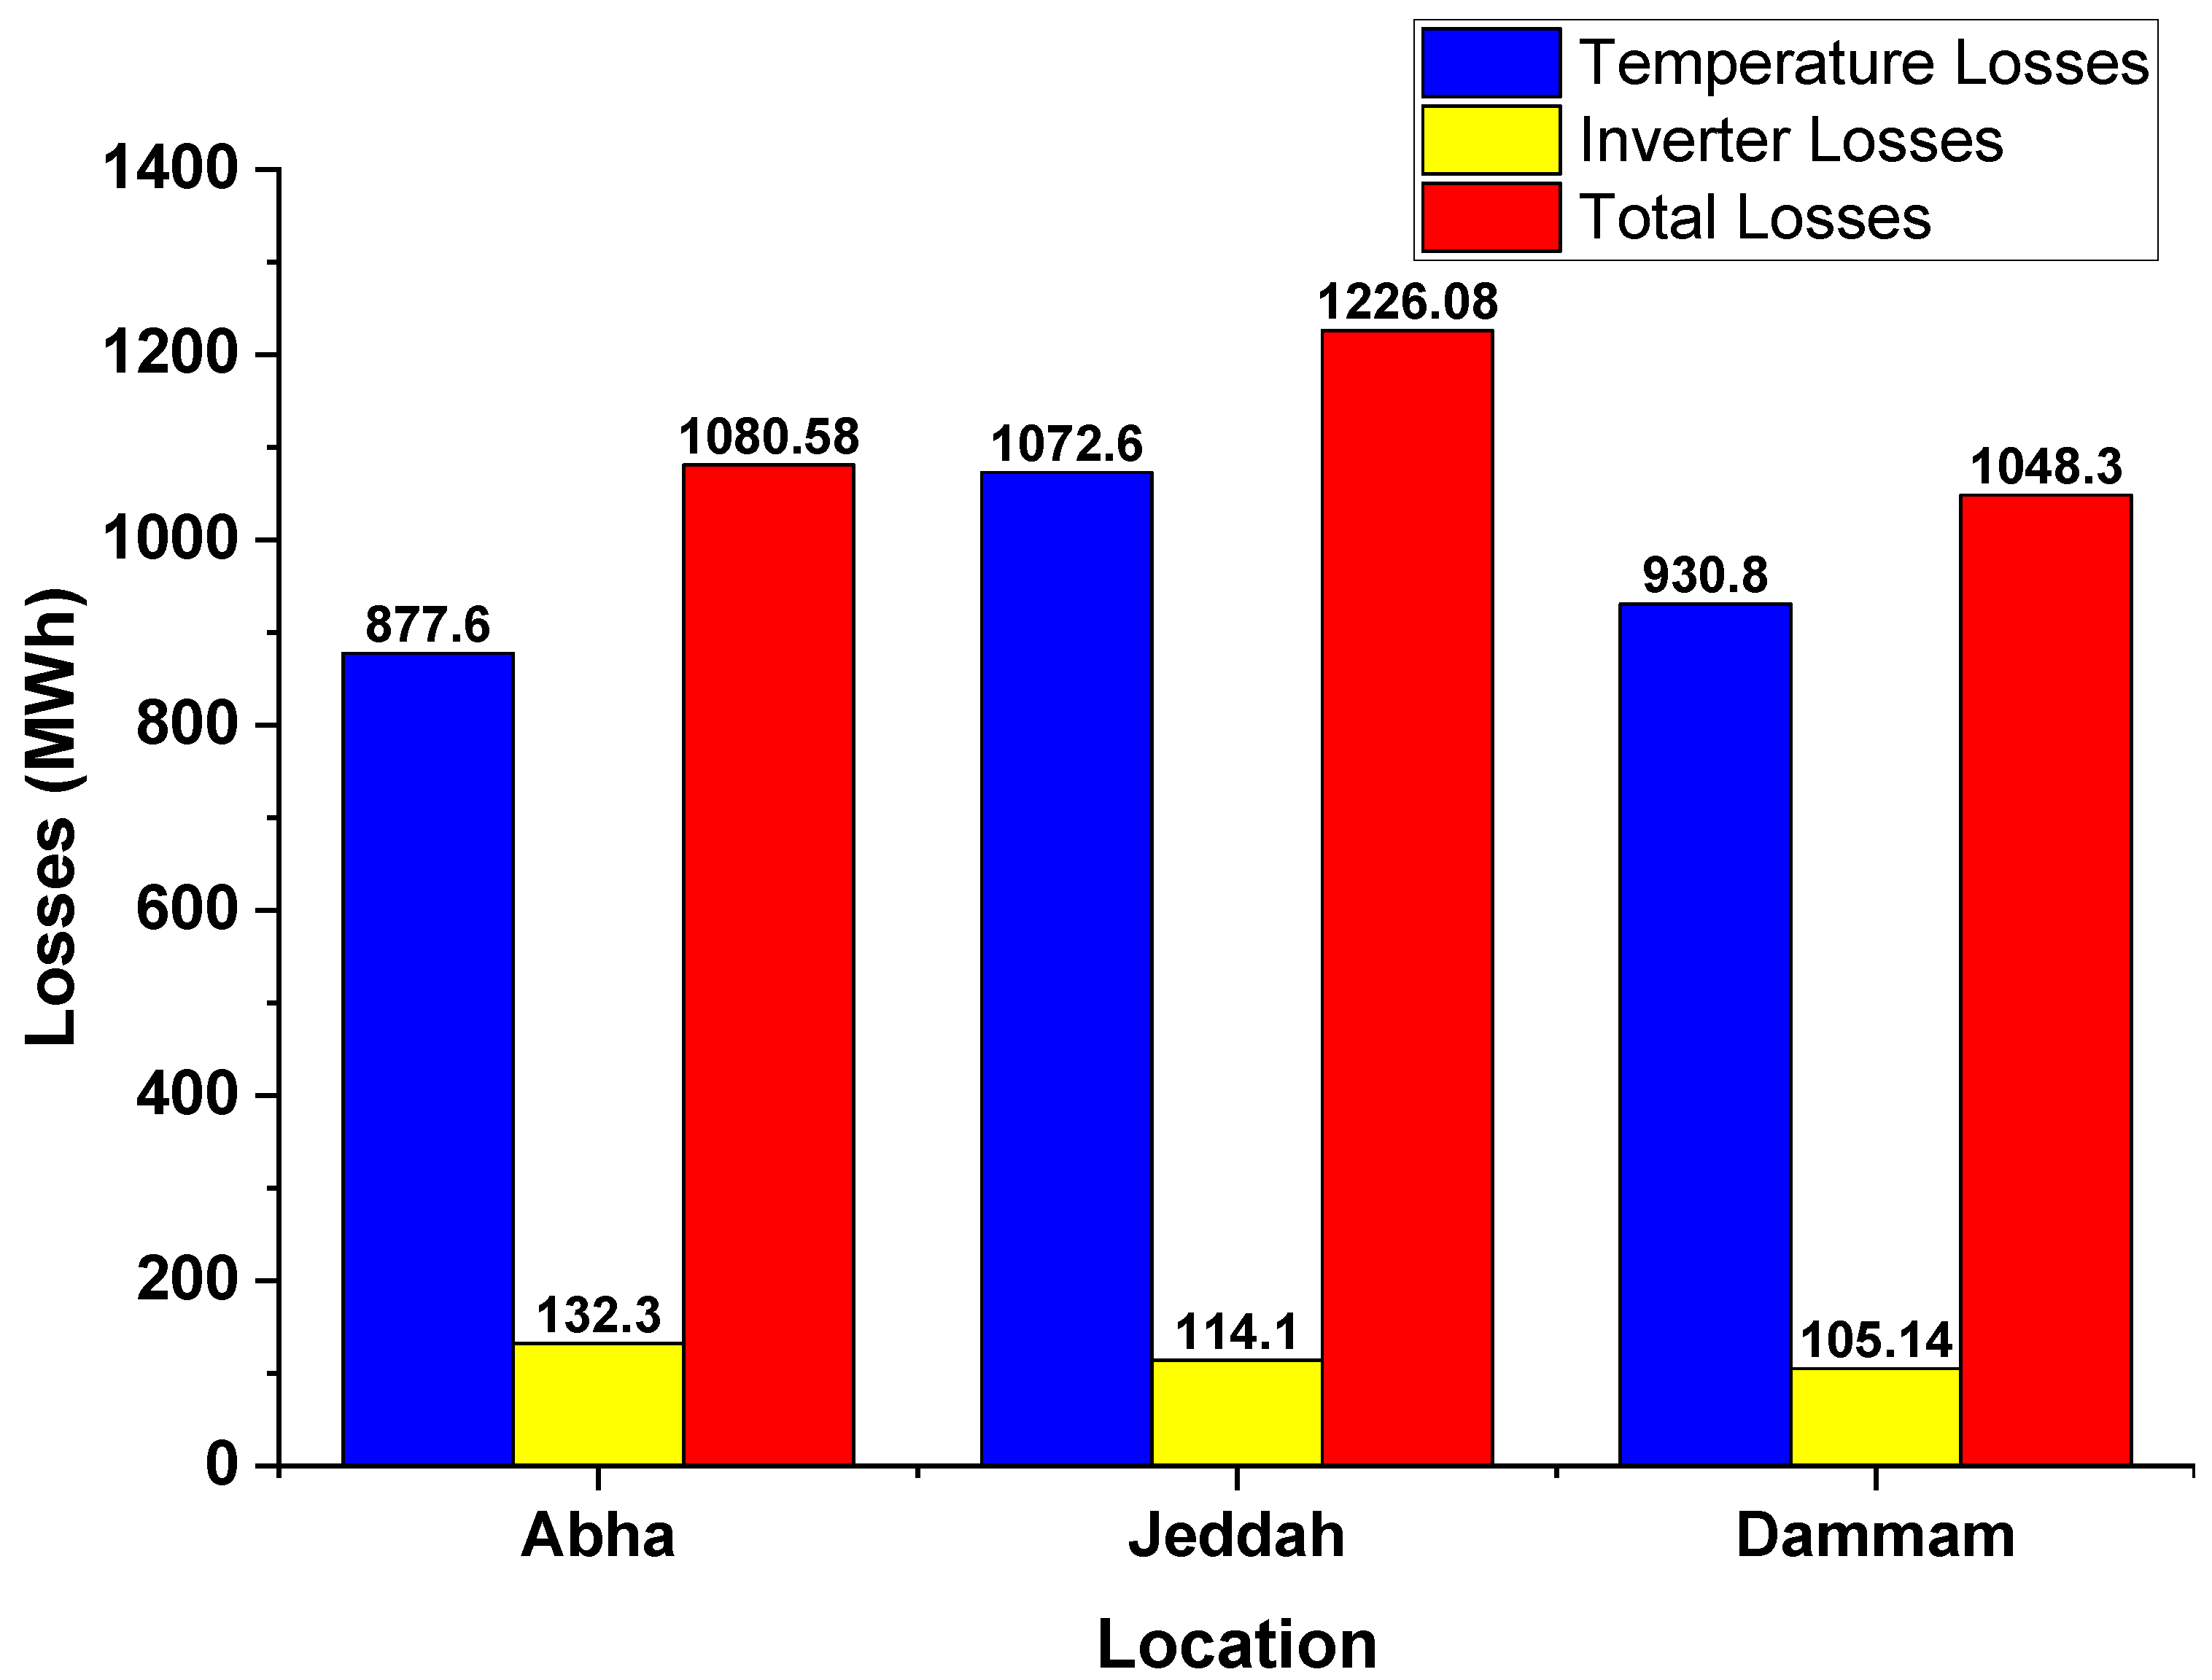
For the PV system, the temperature has a minimal effect during the winter season, with temperature losses being less than 100 MWh for all three sites: Abha, Jeddah, and Dammam. However, from May to August, the increased temperature results in significant power loss. The highest temperature losses were observed in Dammam (126.7 MWh) and Jeddah (114.3 MWh) during July and May, respectively. In terms of total temperature losses, Jeddah had the highest losses (1072 MWh), followed by Dammam (930.3 MWh) and Abha (877.56 MWh). Due to the relatively cooler weather in Abha, temperature losses have a minimal impact on injected energy, with losses being less than 100 MWh throughout the year. Inverter losses totaled 132.3 MWh for Abha, 114.1 MWh for Jeddah, and 105.14 MWh for Dammam. Considering all the losses, including other ohmic and optical losses [65], the PV system in Jeddah experiences the highest losses of 1226.08 MWh, followed by Abha with 1080.58 MWh. The system in Dammam has the lowest losses (1048.2 MWh). Figure 10 illustrates the annual losses in the PV system.
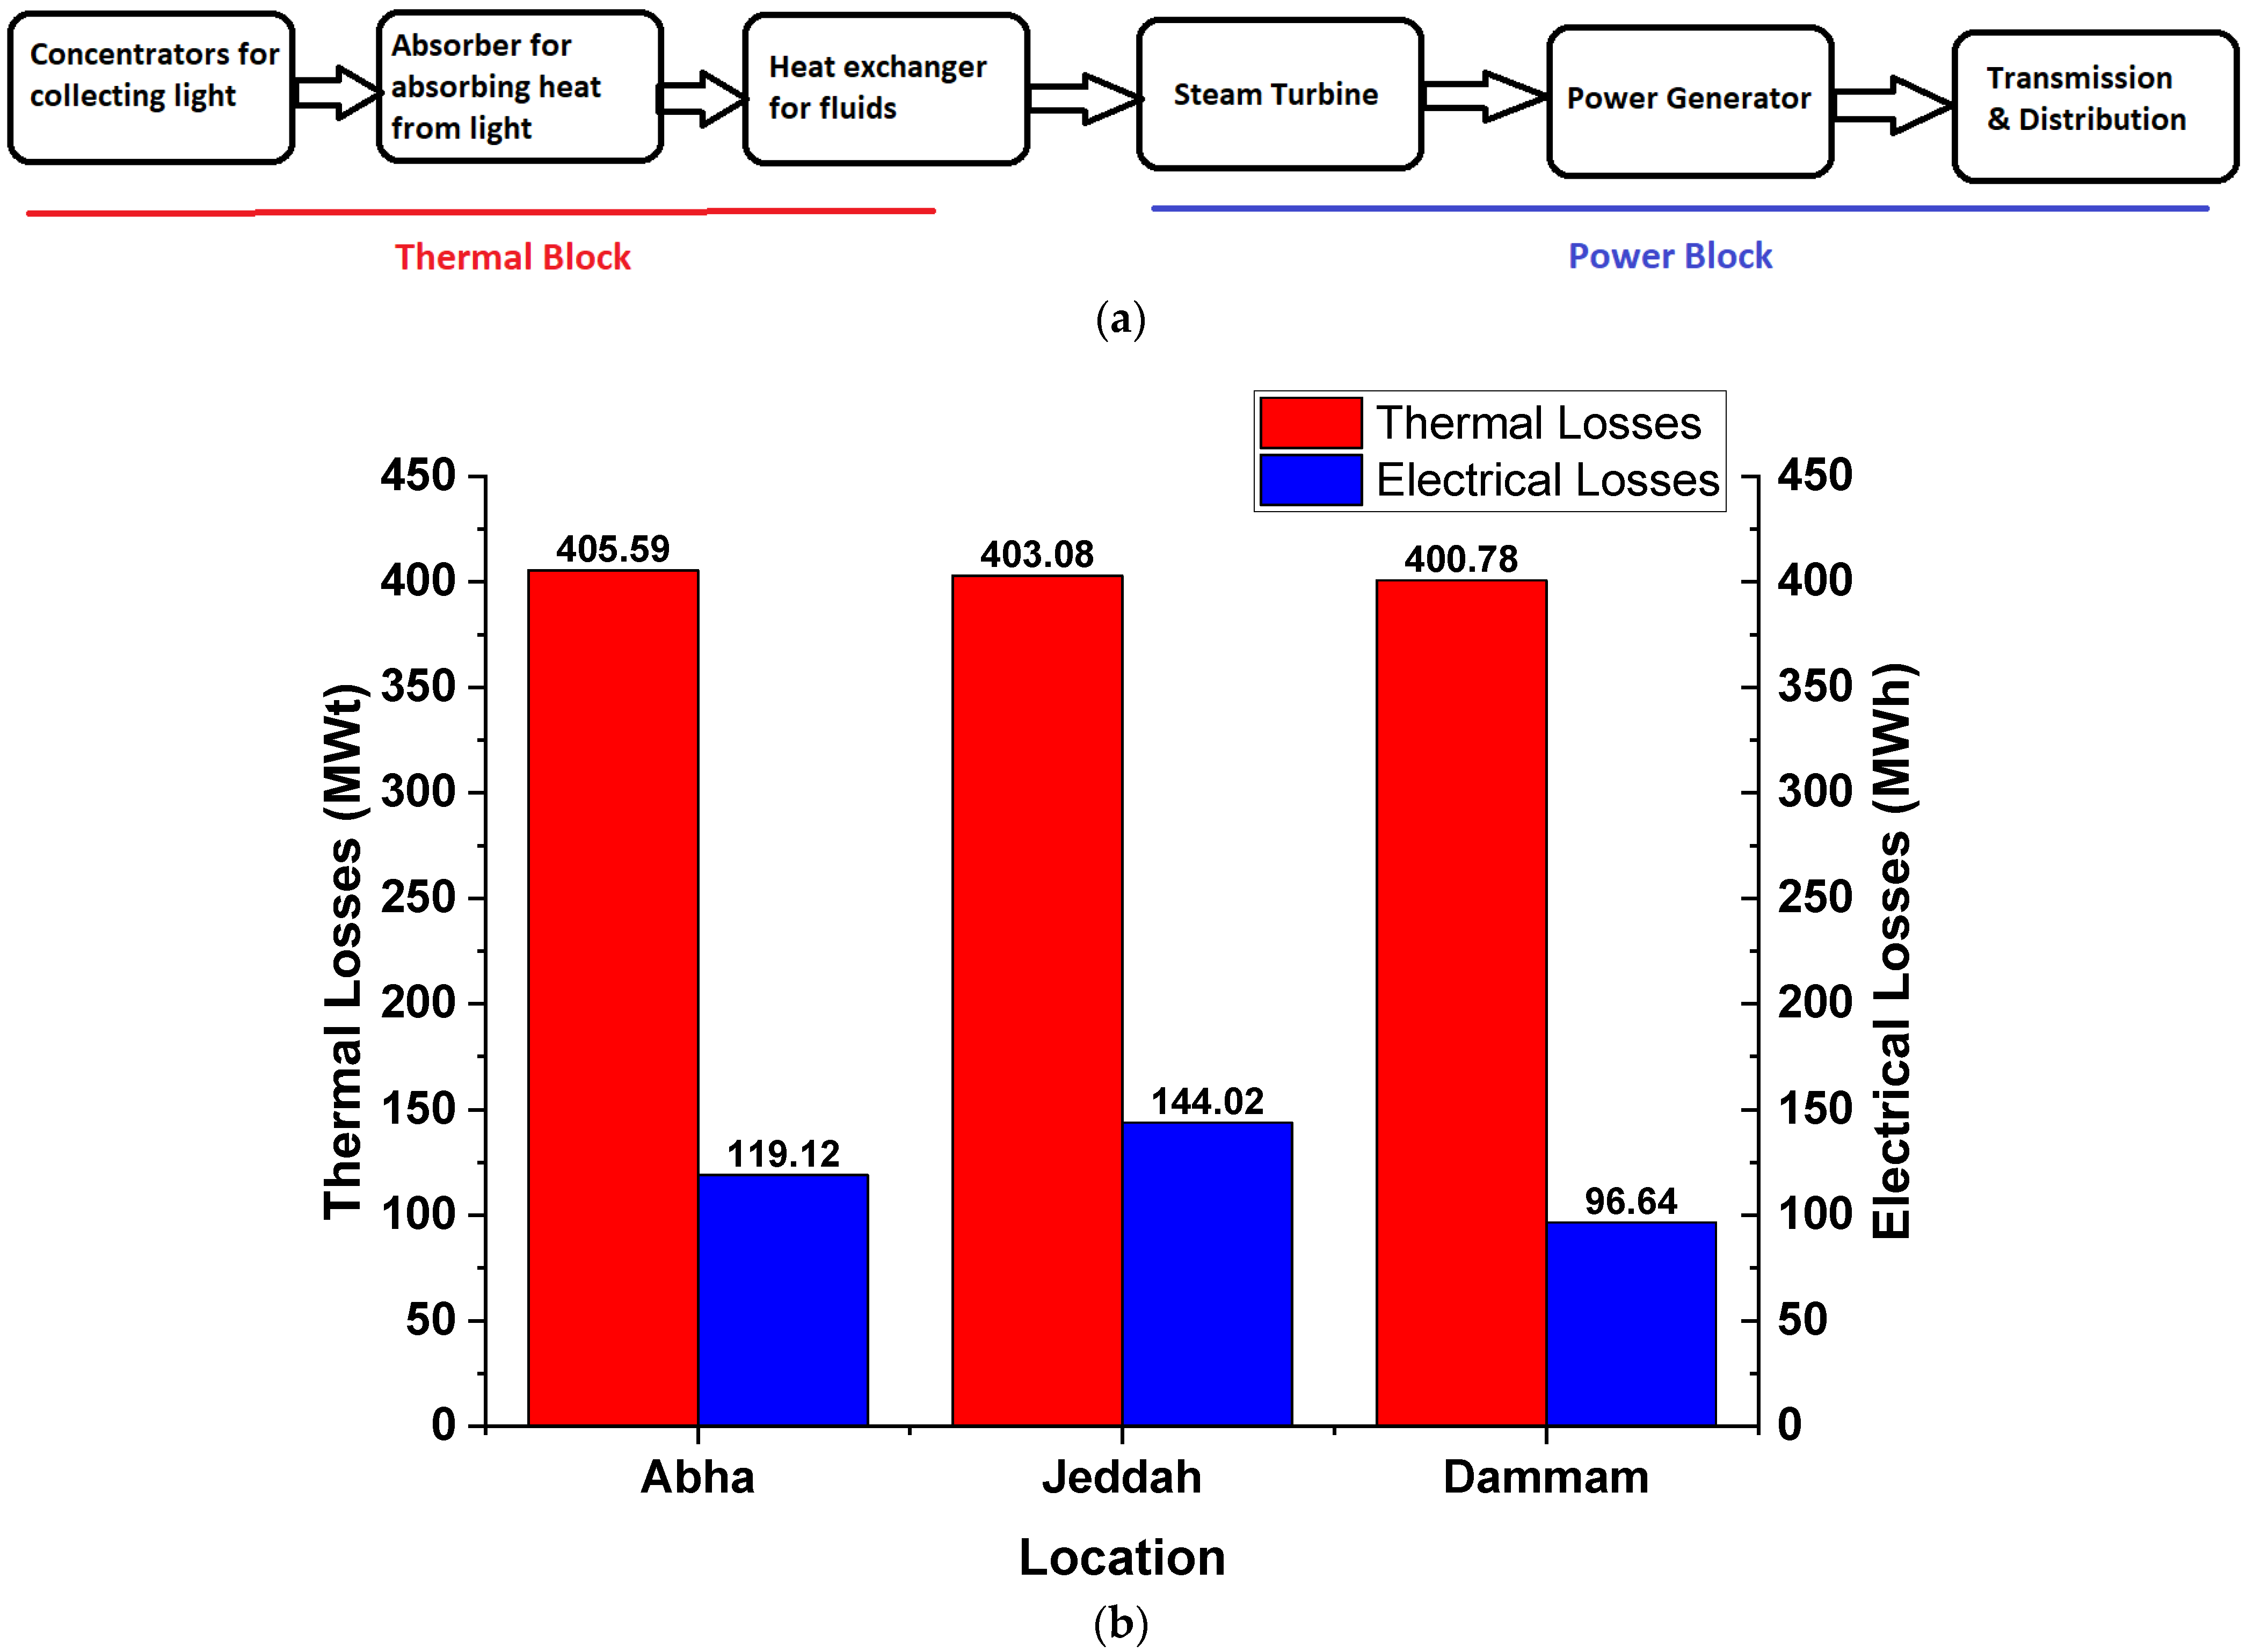
The total thermal losses and total electrical losses are significant factors that impact the overall efficiency of a Parabolic Trough system. Thermal losses in a Parabolic Trough system occur at various stages of the energy conversion process. These losses can be classified into two main categories: thermal losses in the receiver and thermal losses in the heat transfer fluid [66]. Thermal losses in the receiver are primarily due to convection and radiation losses from the hot receiver tube to the surrounding environment. Thermal losses in the heat transfer fluid occur during the transportation of the fluid from the receiver to the power block, including heat losses in the piping system and heat exchangers. These losses are defined and estimated by considering factors such as heat transfer coefficients, surface areas, and temperature differentials, which are influenced by the design and operating conditions of the system. In terms of electrical losses, the conversion of thermal energy into electricity in a Parabolic Trough system involves several stages where losses can occur. These include losses in the power block and losses in the electrical power distribution system [67]. Power block losses occur during the process of converting thermal energy into mechanical energy and then into electricity. These losses are mainly attributed to the inefficiencies of turbines, generators, and other power conversion components. Additionally, losses in the electrical power distribution system, including transformers, cables, and other electrical components, contribute to the overall electrical losses in the system. Estimation of these losses is performed by considering the efficiency characteristics of the components and accounting for factors such as fluid flow rates, pressure differentials, and electrical resistances. Figure 11a shows the single-line diagram of the parabolic trough system.
In the parabolic trough system, the temperature does not have a significant effect on the losses as the system relies on heat. The system experiences nearly uniform thermal losses throughout the year in all cities. However, electrical losses are slightly higher in summer than in winter. This is because the system generates more power during summer due to higher temperatures [67]. Among the three cities, Abha has the highest losses in the parabolic trough system, followed by Jeddah, while Dammam experiences the least losses. Figure 11b illustrates the annual losses in the parabolic trough system.

3.3. Environmental Losses

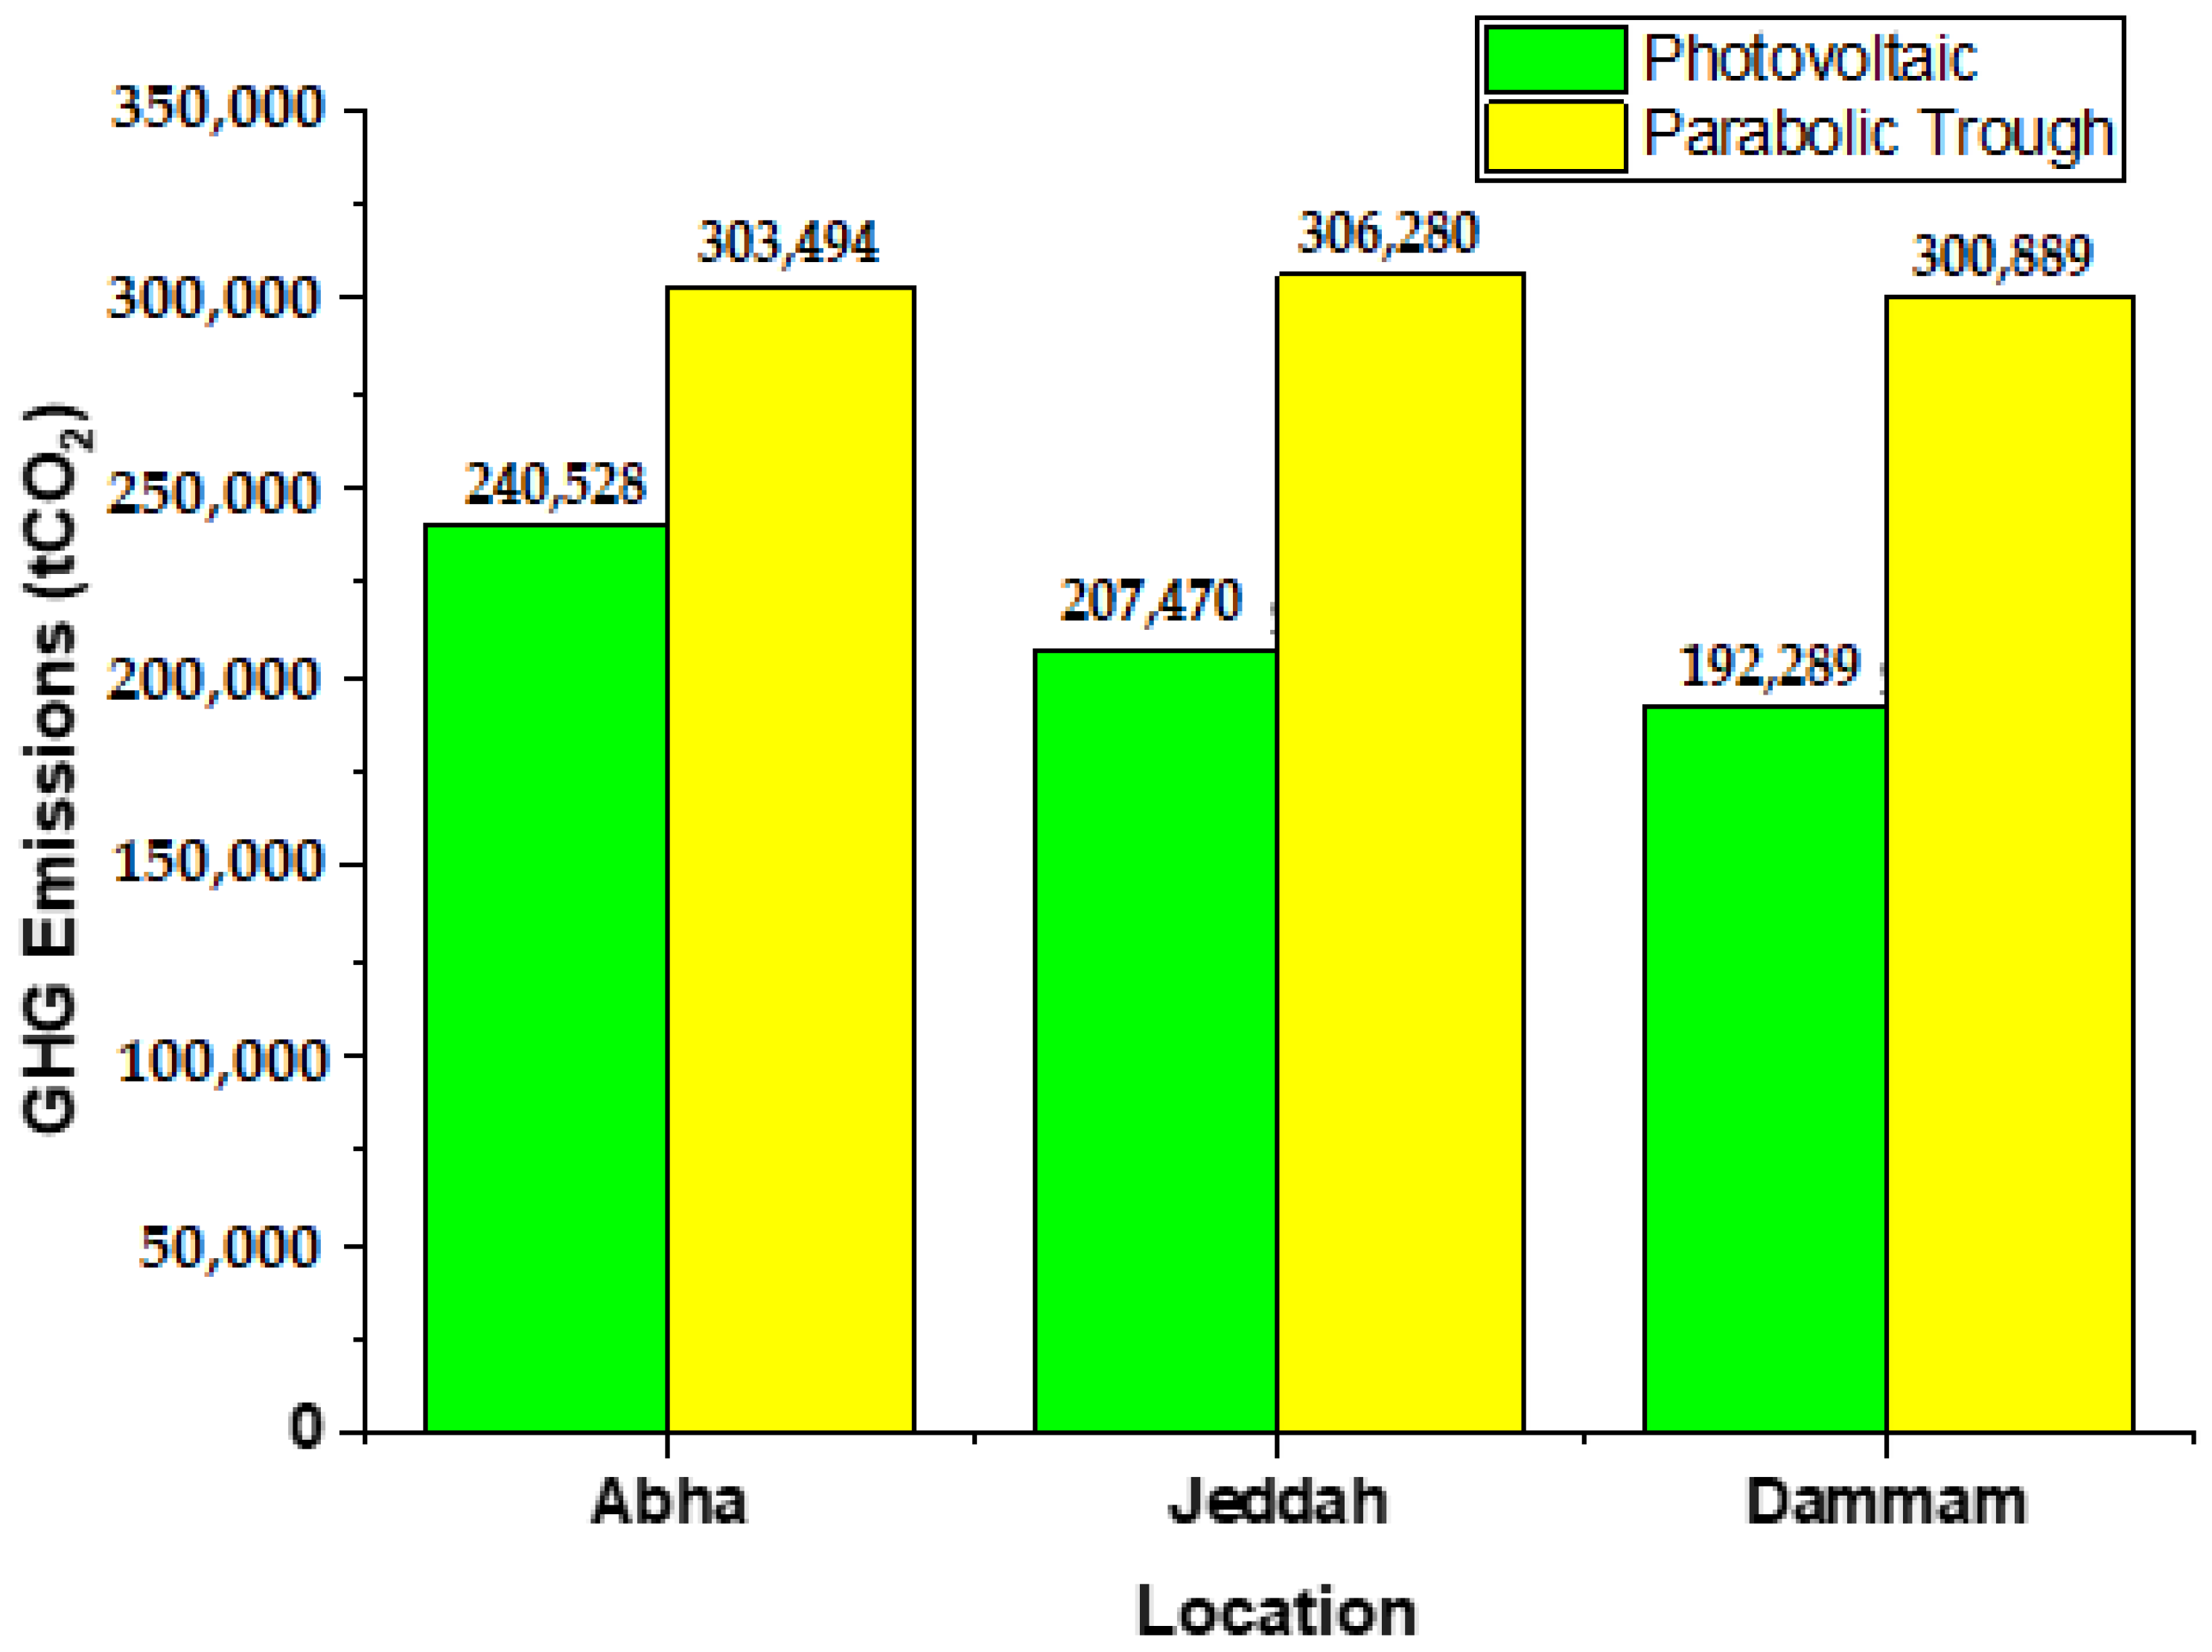
The built-in carbon emission calculation tool in both software enables the estimation of expected CO2 emissions savings from solar system installations. Therefore, the difference between the produced and saved CO2 emissions represents the total carbon balance for a solar system [68]. The CO2 emissions savings depend on the total energy yield from the solar power plant for 1 year. The energy yield will decrease yearly by 1% due to the deterioration of components as they age [69]. The amount of energy replaced, which determines the reduction in CO2 emissions, depends on the lifespan of the plant installation and the total energy injected into the grid by the power plant [70]. The net CO2 emission balance calculation also takes into account the System Life Cycle Emission (LCE). The LCE represents the overall emissions caused by the construction, installation, and operation of components in the solar plant. According to NREL’s report, the LCE for PV systems is estimated to be about 46 g CO2eq/kWh, while for the parabolic trough, it is about 36 g CO2eq/kWh [71]. Table 14 provides details on CO2 emissions, and Figure 12 illustrates the annual GHG emissions by the systems.
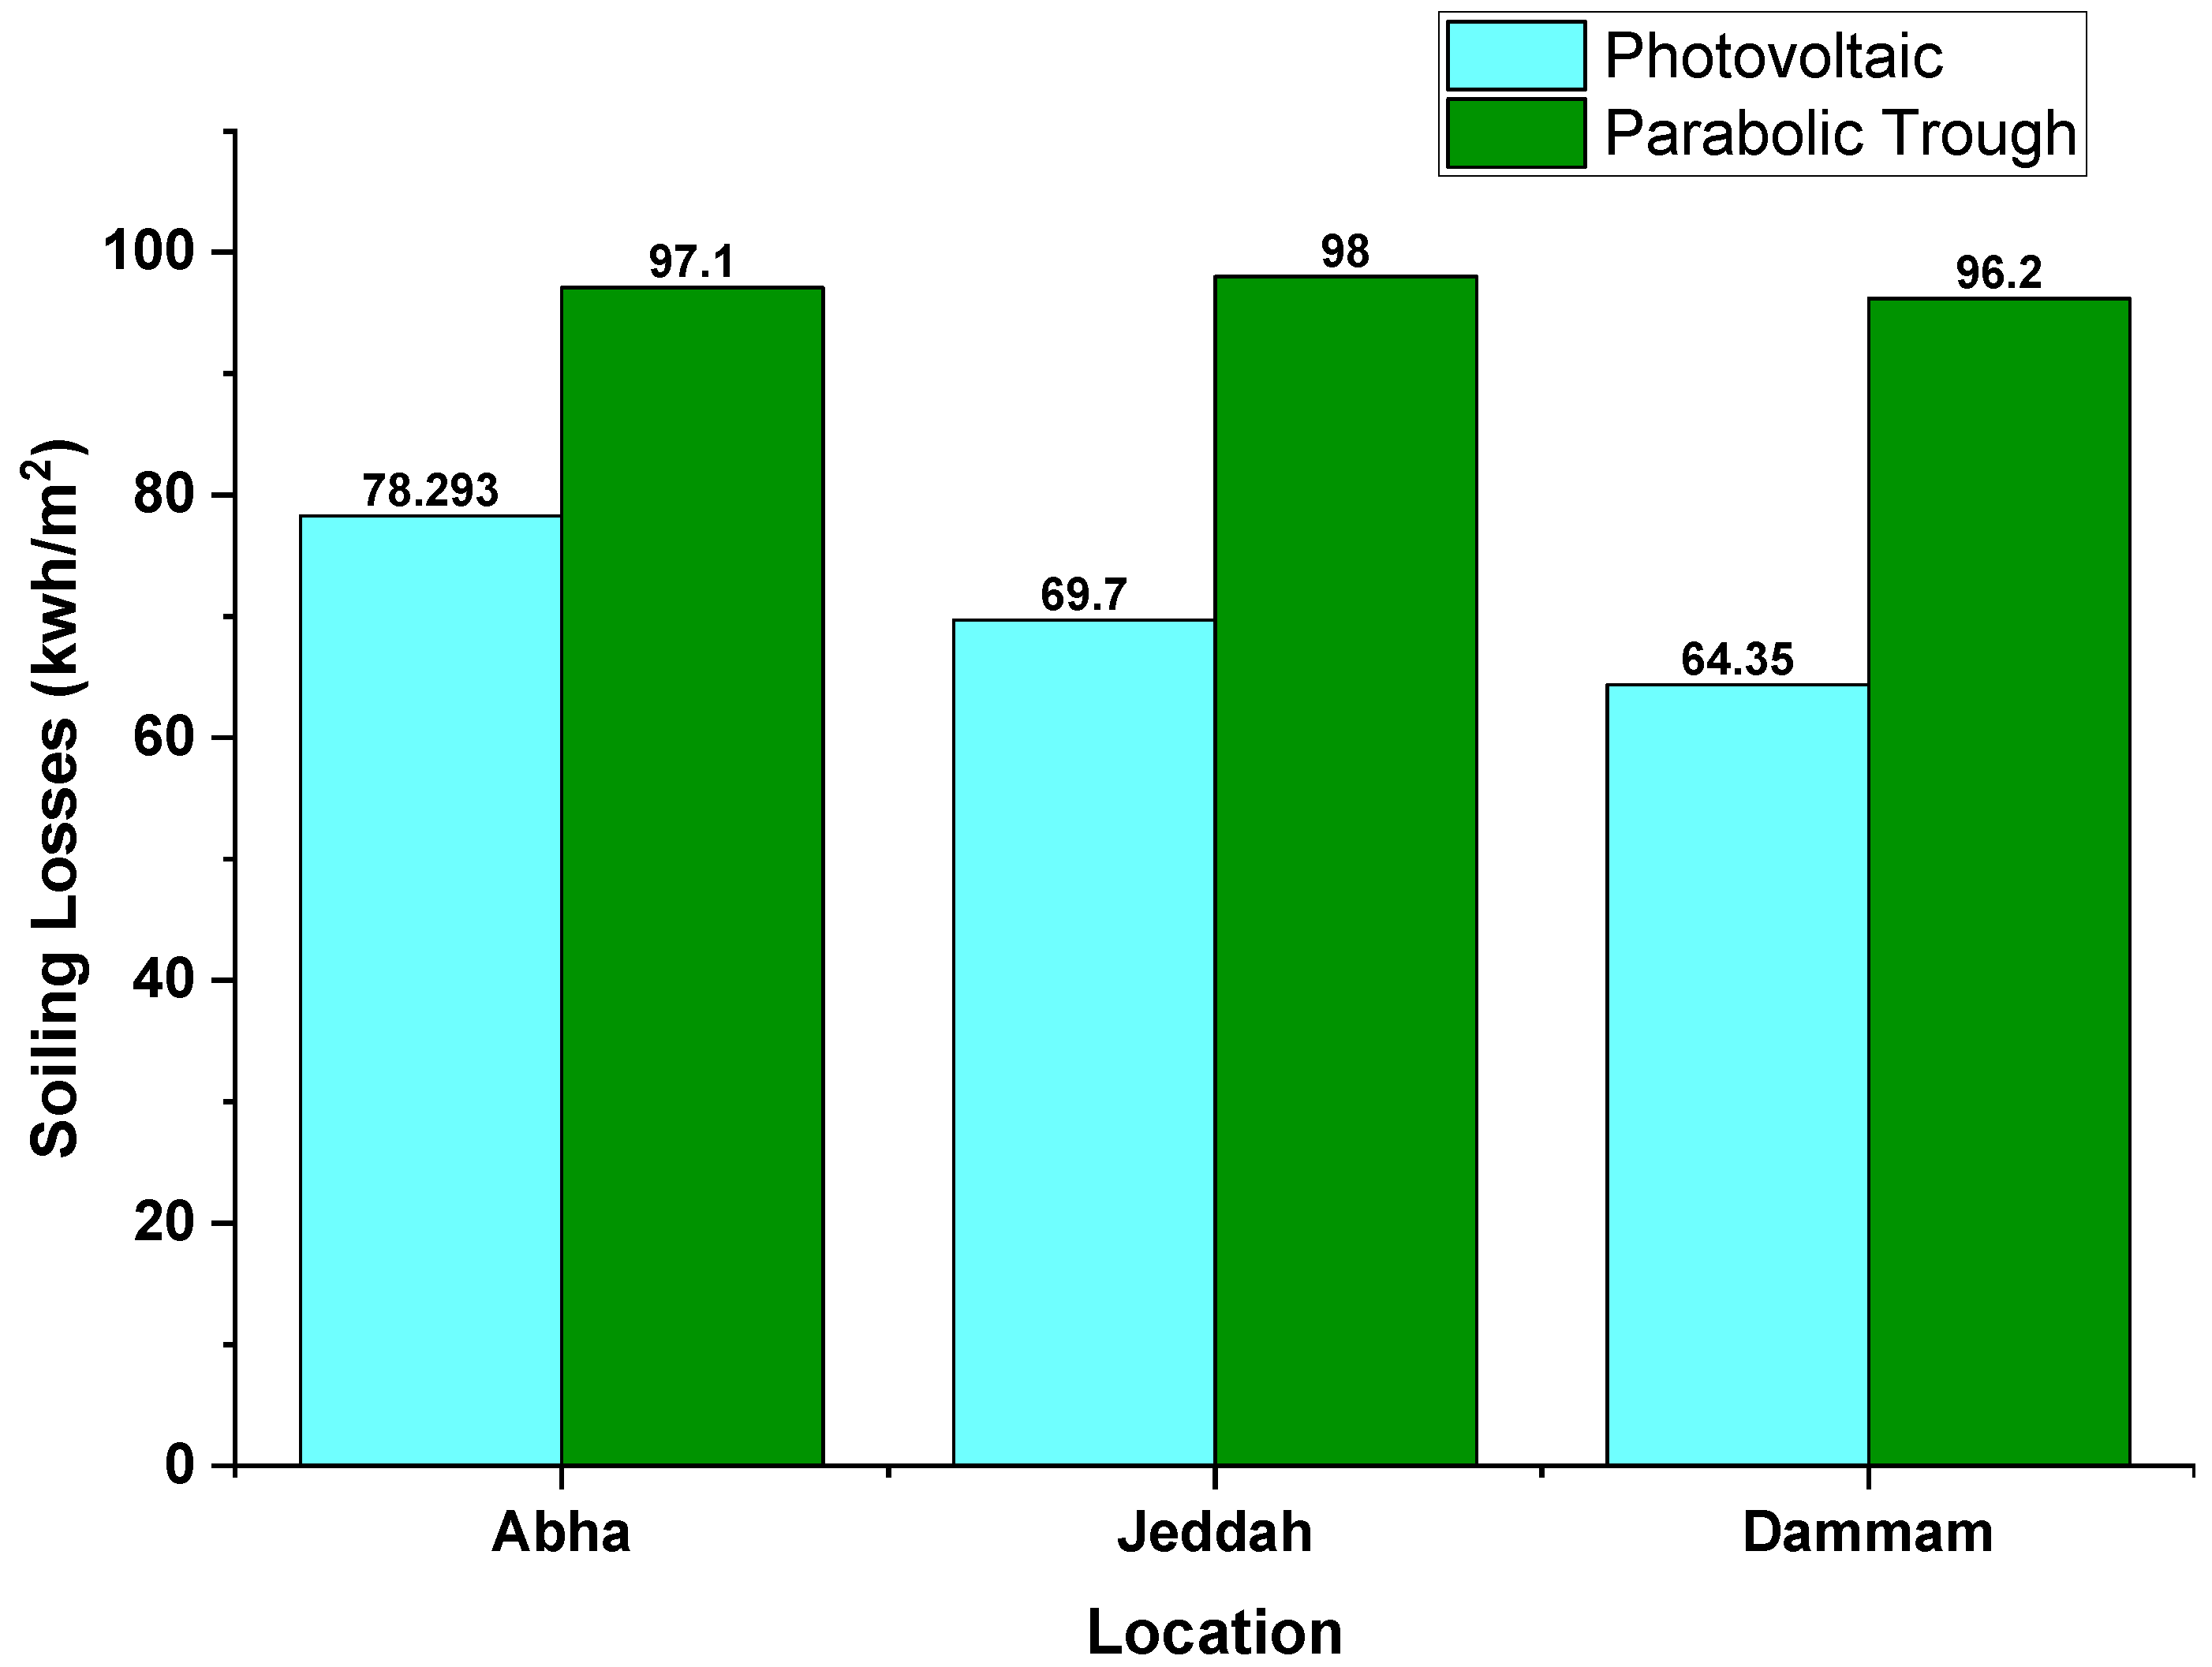
Soiling losses refer to the reduction in the energy output of a solar system caused by the accumulation of dirt, dust, or other particulate matter on the surface of solar panels or mirrors. These losses can occur in various types of solar systems, including photovoltaic (PV) and concentrating solar power (CSP) systems. When dirt or dust builds up on the surface of solar panels or mirrors, it hinders the sunlight, resulting in a decrease in energy output. The soiling losses are calculated by the simulation tool (PVSyst) for the locations. Figure 13 presents the average soiling losses of the solar systems.

3.4. Economic Criteria

Economic criteria play a crucial role in the deployment and adoption of solar systems [72]. These criteria are employed to assess the economic viability and feasibility of solar projects, which can influence investment decisions made by stakeholders. The economic criteria used in evaluating the two solar systems include Levelized Cost of Electricity (LCOE), Net Present Value (NPV), Payback Period, and Electricity Export Revenue [73]. Table 15 presents the calculated values of these economic criteria using the respective software for each technology.
The LCOE is a measure of the cost of generating electricity from a solar system over its lifetime, including capital and operational costs [74]. It is calculated by dividing the total lifetime cost of the system by the total electricity generation over the same period [75]. Equation (18) shows the formula for calculating the LCOE.
L C O E = C a n C b C t h E a c + E d c + E g
where the total annualized cost is denoted by Can and CbCth denotes marginal costs. The total AC-based primary load, DC load, and grid sales are represented as Eac, Edc, and Eg, respectively.
The PV systems have a lower Levelized Cost of Electricity (LCOE) ranging from 32 to 40 $/MWh compared to the thermal system’s LCOE of 147–155 $/MWh. The lower LCOE of PV systems can be attributed to their lower capital costs compared to parabolic trough systems. PV technology has experienced a significant reduction in module prices over the past decade. Additionally, PV systems have a simpler design and require less maintenance than parabolic trough systems, resulting in lower operation and maintenance costs. PV systems also have shorter construction periods, reducing financing costs and the time value of money. A lower LCOE indicates a more cost-effective system.
Net Present Value (NPV) is a measure of the profitability of a solar system, taking into account the time value of money [76]. It is calculated by subtracting the initial investment cost from the sum of the present value of cash inflows over the system’s lifetime [23]. PV systems have lower NPV than parabolic trough systems. One of the main reasons is the difference in capital costs between the two technologies. PV systems have lower capital costs due to their simpler design and lower material requirements. Additionally, PV systems may have higher degradation rates, reducing their lifetime energy production and hence their NPV. The performance difference between the two technologies also plays a role, as parabolic trough systems have higher capacity factors and overall efficiencies, resulting in higher revenue and NPV.
The payback period is a financial metric used to estimate the length of time it takes for an investment to recoup its initial costs [20]. In the context of solar energy systems, the payback period refers to the time it takes for the total cost of installing and operating the system to be offset by the savings generated from reduced energy costs or revenue from selling excess energy back to the grid [55]. PV systems have a shorter payback period than thermal systems due to their lower capital costs and faster installation times. PV systems use simpler technology and have lower material requirements compared to parabolic trough systems. Additionally, PV modules can be installed relatively quickly, whereas parabolic trough systems require significant time and resources for construction and installation. As a result, PV systems achieve a positive cash flow and recoup the initial investment in a shorter period than parabolic trough systems.
Electricity export revenue refers to the revenue generated by exporting excess electricity produced by a power generation system to the grid [77]. In many countries, including Saudi Arabia, companies are required by law to purchase excess electricity from renewable energy systems, such as solar power systems, at a fixed price known as the feed-in tariff [22]. The electricity export revenue earned by solar power system owners can significantly enhance the economic viability of the system. The tariff rate for solar PV ranges from 0.108 to 0.136 $/kWh, depending on the project size, while the tariff rate for solar thermal ranges from 0.18 to 0.24 $/kWh. Therefore, PV systems generate lower electricity export revenue compared to the thermal system.

4. Multi-Criteria Decision Making (MCDM)

After calculating the values for each criterion, they are used in the MCDM for analysis. The MCDM is first applied to each solar technology individually for all the locations to identify the best city for it. After that, the MCDM is applied overall on both technologies for all the locations.

4.1. PV System MCDM

First, the PV Technologies were analyzed. The assigned values are shown below in Table 16. Abha is represented by A1, Jeddah by A2, and Dammam by A3.
In the next step, the normalization decision matrix is obtained using the equation for positive and negative criteria.
110.7210.95310.97111110.8220.253
Xij=0.8870.6810.5810.7990.880.8550.8650.7020.8210.860.8620.9231
0.8170.718110.8310.80.5650.730.8130.79910.141
The final step of preference is calculated by ranking the alternatives from the sum of decision matrix multiplication by weights using Equation (7).
A1 = 0.127 × [1] + 0.018 × [1] + 0.042 × [0.72] + 0.027 × [0.95] + 0.218 × [1] + 0.026 × [0.97] + 0.023 × [1] + 0.115
× [1] + 0.026 × [1] +0.149 × [1] + 0.122 × [1] + 0.022 × [0.822] + 0.085 × [0.253] = 0.919003
A2 = 0.127 × [0.88] + 0.018 × [0.68] + 0.042 × [0.581] + 0.027 × [0.799] + 0.218 × [0.88] + 0.026 × [0.855] + 0.023
× [0.865] + 0.115 × [0.702] + 0.026 × [0.821] +0.149 × [0.86] + 0.122 × [0.862] + 0.022 × [0.923] + 0.085 × [1] =
0.836718
A3 = 0.127 × [0.817] + 0.018 × [0.718] + 0.042 × [1] + 0.027 × [1] + 0.218 × [0.772] + 0.026 × [1] + 0.023 × [0.8] +
0.115 × [0.565] + 0.026 × [0.73] +0.149 × [0.813] + 0.122 × [0.799] + 0.022 × [0.1] + 0.085 × [0.141] = 0.735097
From the MCDM analysis, it can be concluded that for the PV system, the best city is Abha, followed by Jeddah and then Dammam. Figure 14 shows the MCDM analysis of the PV systems.

4.2. Parabolic Trough system MCDM

The MCDM was then applied to the parabolic trough system. The assigned values are shown below in Table 17.
The normalization decision matrix is obtained using the equation for positive and negative criteria.
10.6800.8060.9530.9900.9580.9480.9960.9710.9900.990.9920.253
Xij=0.887110.79910.929111110.9831
0.8170.9470.58110.98210.980.9950.9350.9760.98110.141
A1 = 0.911, A2 = 0.96, A3 = 0.86
The final step of preference is calculated by ranking the alternatives from the sum of decision matrix multiplication by weights using Equation (7). From the MCDM analysis, it can be concluded that for the parabolic trough system, the best city is Jeddah (A2 = 0.96), followed by Abha (A1 = 0.91), and then Dammam (A3 = 0.86). Figure 15 shows the MCDM analysis of the Parabolic Trough systems.

4.3. PV and PT System MCDM

The MCDM was then applied simultaneously to both solar technologies in all locations. The assigned values are shown below in Table 18.
The normalization decision matrix is obtained using the equation for positive and negative criteria.
110.720.9530.7910.96910.70710.7910.7850.8210.253
10.6800.800.9530.9900.7080.2060.9960.4380.990.9900.6620.253
Xij=0.8870.6810.580.7990.7000.8540.8640.4960.8210.6800.6770.9231
0.887110.79910.6860.21710.450110.6561
0.8170.718110.65710.80.3990.7300.6430.62710.141
20190.9470.5810.9820.7390.2130.9950.4220.9760.9820.6670.141
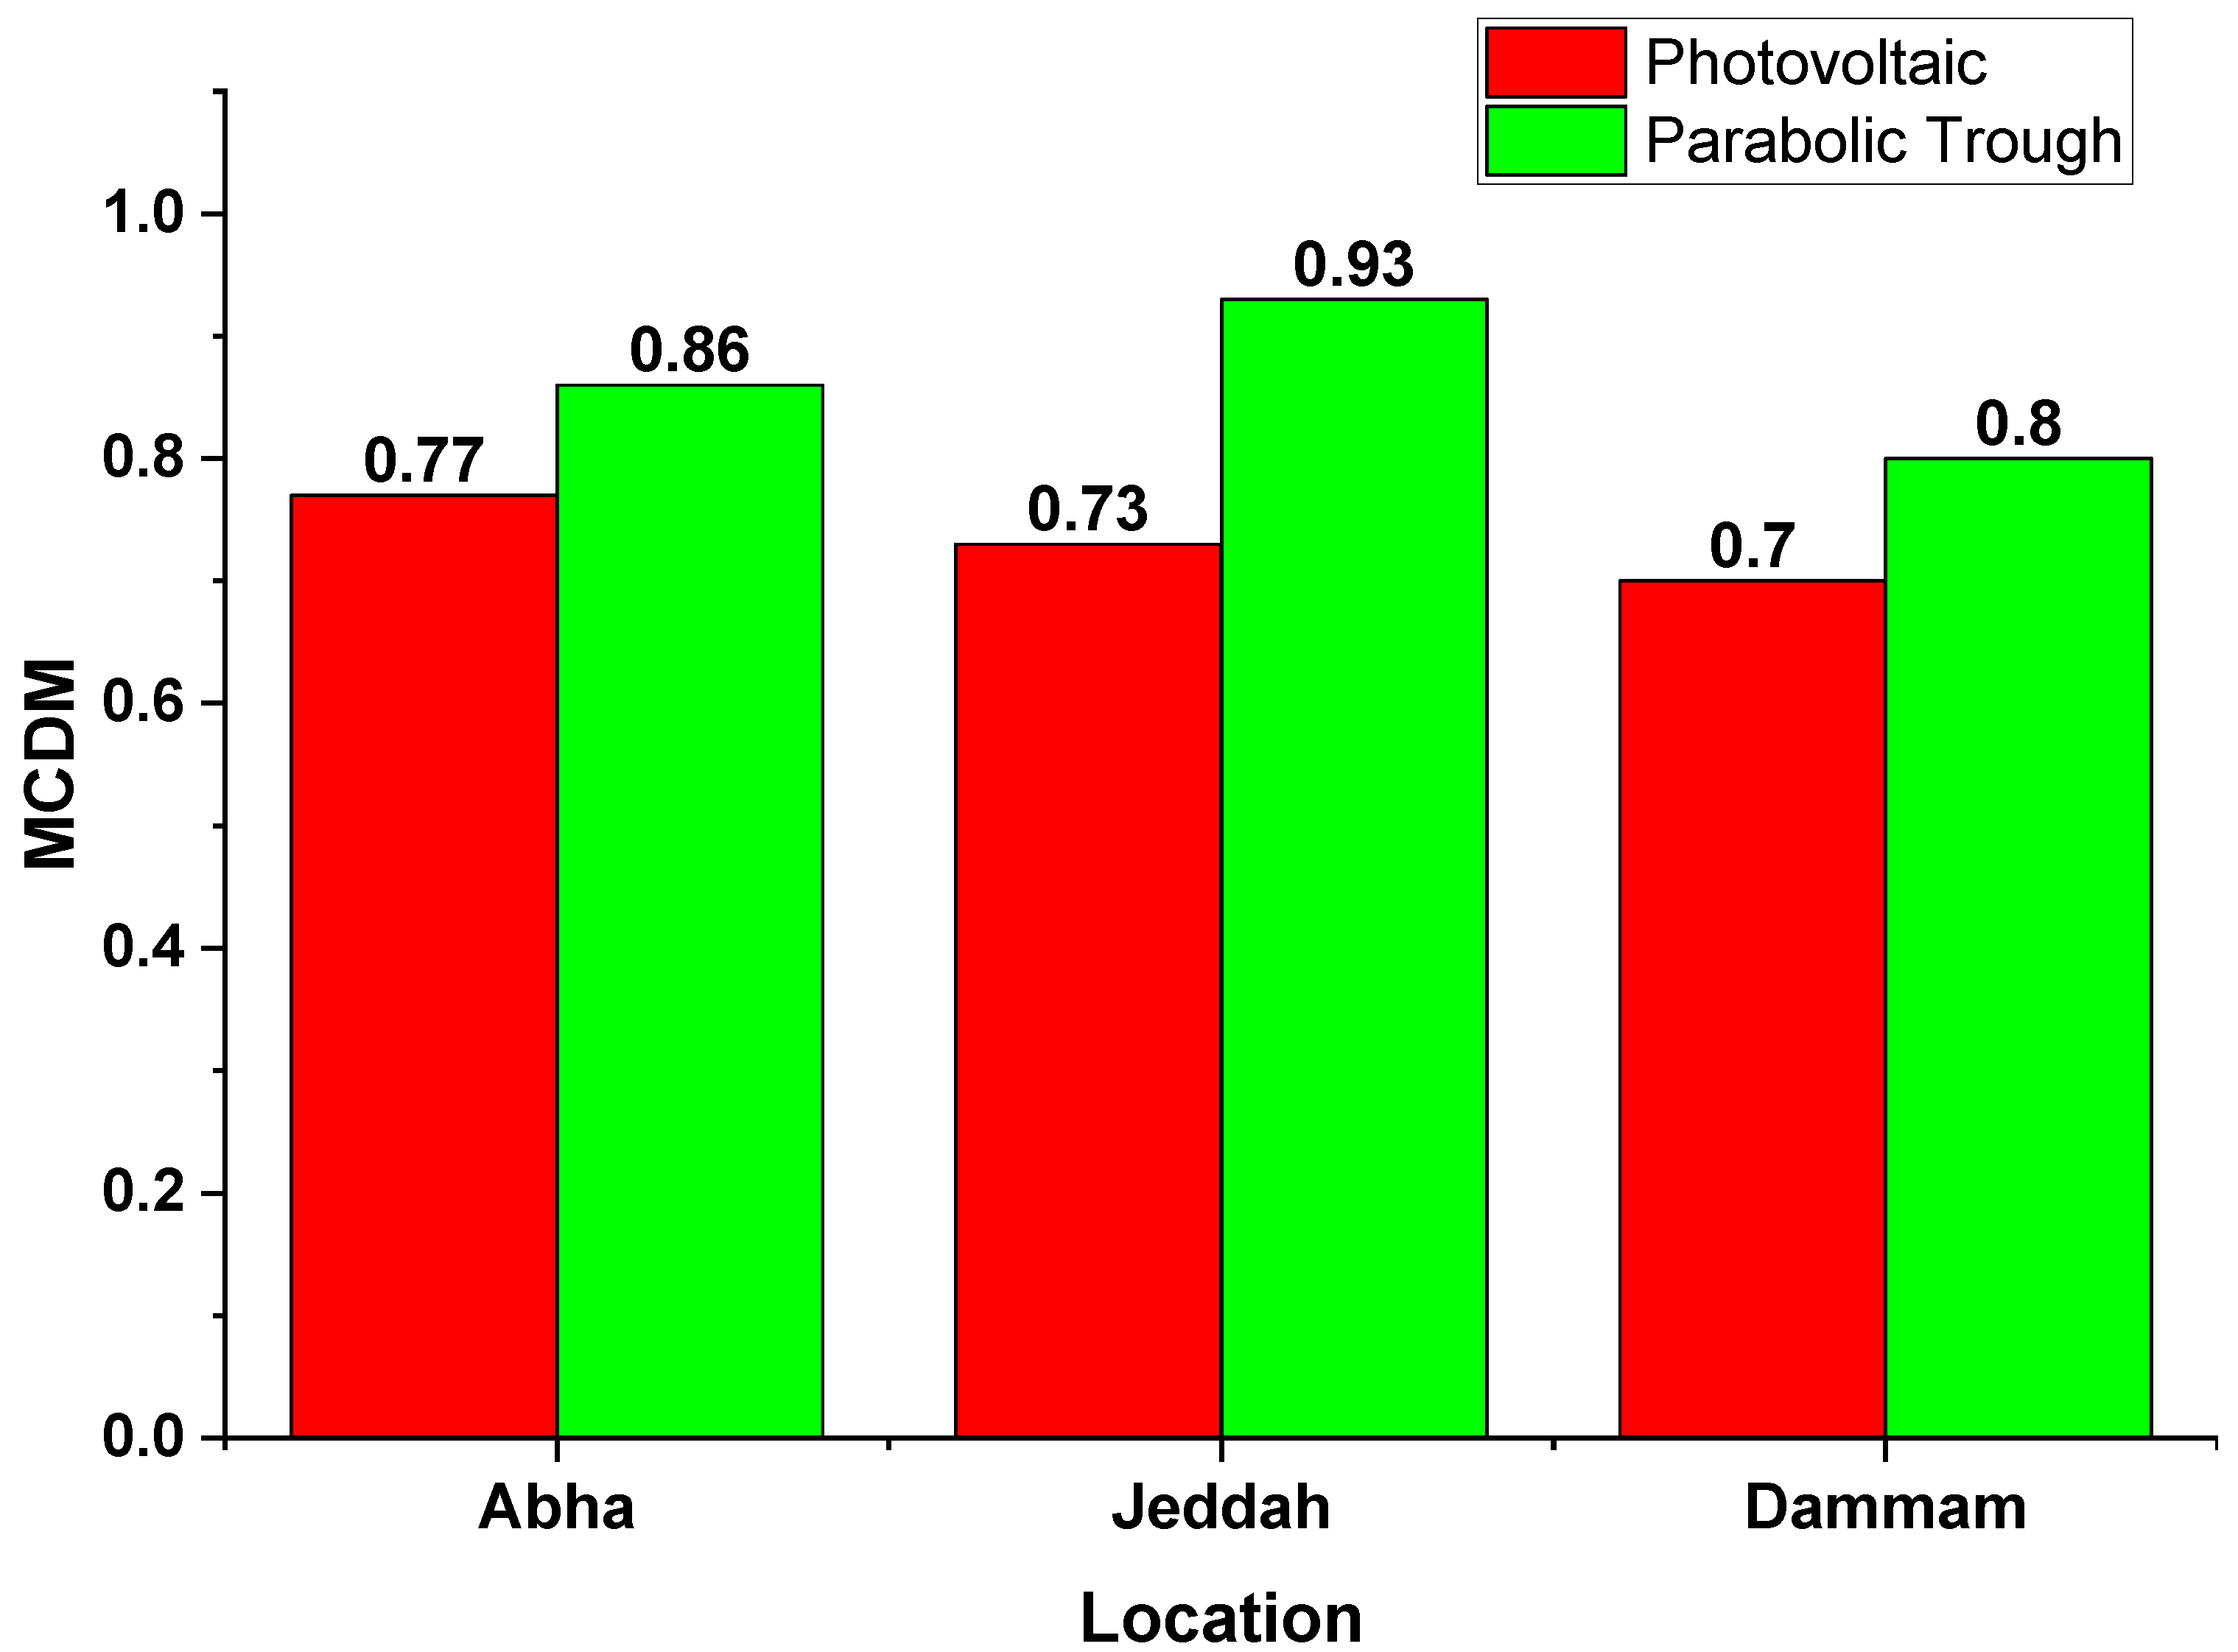
The final step of preference is calculated by ranking the alternatives from the sum of decision matrix multiplication by weights using Equation (7). From the MCDM analysis, it can be concluded that the parabolic trough systems (PT) have a higher ratio than the PV systems in all the locations. Figure 16 shows the MCDM analysis of both solar systems.
A1: PV = 0.77 PT = 0.86
A2: PV = 0.73 PT = 0.93
A3: PV = 0.70 PT = 0.80

4.4. Equal Weight MCDM

The MCDM was then applied on equal weights for the criteria to compare with the SAW-AHP MCDM strategy. 0.077 weightage was assigned to all 13 criteria. The Multi-Criteria Utility Function becomes Equation (19).
Multi Criteria Utility Function (U) = 0.077 × [C1] +0.077 × [C2] + 0.077 × [C3] + 0.077 × [C4] + 0.077 × [C5] +
0.077 × [C6] + 0.077 × [C7] + 0.077 × [C8] + 0.077 × [C9] + 0.077 × [C10] + 0.077 × [C11] + 0.077 × [C12] + 0.077
× [C13]
The results for the PV system saw that the ranking remained the same (Abha > Jeddah > Dammam), but the overall score decreased. The score for Abha and Jeddah decreased to 0.90 and 0.82, while the score for Dammam remained the same (0.73). The same trend was observed for the parabolic trough system.
While the ranking of cities remains consistent, the SAW-AHP approach offers a more robust and comprehensive decision-making framework. By assigning weights to the criteria based on expert judgment and pairwise comparisons, SAW-AHP allows for a more nuanced analysis, considering the relative importance of each criterion. This approach better aligns with real-world decision-making scenarios where criteria often have different levels of significance. Furthermore, the SAW-AHP methodology enhances the decision-making process by providing a systematic and transparent approach for evaluating and prioritizing alternatives. The ability to capture the preferences and priorities of stakeholders leads to more effective decision outcomes. By incorporating the SAW-AHP methodology, the study aims to provide decision-makers with valuable insights and guidance in selecting the most suitable city for solar energy system implementation in Saudi Arabia.

5. Theoretical Implications and Managerial Insights

Theoretical implications are the contributions and advancements that the study brings to existing knowledge and theories, while managerial insights are the practical implications and recommendations derived from the research findings. The findings of this research paper have several theoretical implications and provide valuable insights for managers and decision-makers in the field of renewable energy, which are discussed in this section.

5.1. Theoretical Implications

Comparative Analysis of Solar Technologies: This study contributes to the understanding of the performance and economic feasibility of two solar technologies, namely photovoltaic (PV) and solar thermal systems, in different geographical locations. By conducting a comprehensive analysis and comparison, the research highlights the factors influencing the suitability of each technology in specific contexts.
Multicriteria Decision-Making (MCDM) Model: The application of the MCDM model in evaluating and selecting the most suitable solar technology for different locations provides a theoretical framework for decision-making in the renewable energy sector. The study showcases the effectiveness of this model in considering multiple criteria, such as energy production, system losses, and greenhouse gas emissions, to inform technology selection and investment decisions.

5.2. Managerial Insights

Site Selection and Technology Adoption: The research outcomes offer valuable insights for managers and policymakers in identifying the most optimal locations for solar energy projects. By considering factors such as solar irradiance, energy production potential, and system losses, decision-makers can strategically select sites that maximize energy generation and minimize environmental impacts.
Technology-specific Considerations: The study emphasizes the importance of considering technology-specific factors when choosing between PV and solar thermal systems. Managers can use the insights provided to assess the suitability of each technology based on factors such as capital costs, maintenance requirements, and energy yield. This information can guide investment decisions and inform the development of renewable energy strategies.
Environmental Impact Assessment: The analysis of greenhouse gas emissions and carbon balance associated with solar energy systems offers managers valuable insights into the environmental benefits of renewable energy adoption. By considering the reduction in emissions and the potential for fossil fuel savings, decision-makers can prioritize solar energy projects that align with sustainability goals and contribute to carbon footprint reduction.

6. Limitations and Futuristic Scope

While this research paper contributes valuable insights and knowledge regarding the performance and economic feasibility of photovoltaic (PV) and solar thermal systems in different locations, it is important to acknowledge the limitations of the study. Additionally, several potential areas for future research can build upon the findings of this study.

6.1. Limitations

Generalizability: The findings of this research are specific to the selected cities in Saudi Arabia and may not be directly applicable to other regions or countries. The solar irradiance, climatic conditions, and economic factors in different locations may vary, influencing the performance and feasibility of solar technologies.
Simplified Economic Analysis: The economic analysis in this study focuses on a limited set of parameters, such as the levelized cost of electricity (LCOE), net present value (NPV), payback period, and electricity export revenue. Future research can explore additional economic factors and conduct a more comprehensive cost-benefit analysis.
Single Technology Focus: This study specifically compares PV and solar thermal technologies. However, there are other emerging solar technologies, such as concentrated solar power (CSP) and thin-film solar cells, that could be considered in future research to provide a more comprehensive understanding of the solar energy landscape.

6.2. Futuristic Scope

Technological Advancements: Future research can explore the potential impact of technological advancements in solar energy systems on their performance, efficiency, and economic viability. This could include advancements in PV module technology, energy storage solutions, and the integration of smart grid technologies.
Other renewable technologies: As the study only focuses on solar-related technologies for the cities in Saudi Arabia, future research can explore the potential of other renewable technologies such as wind, hydro, fuel cell, biomass, geothermal, wave, tidal, etc.
Dynamic Analysis: Conducting a dynamic analysis that considers the long-term performance and economic factors of solar energy systems over their entire lifespan can provide more accurate insights. This can include incorporating degradation rates, maintenance costs, and operational considerations into the analysis.
Policy and Regulatory Considerations: Investigating the impact of policy frameworks, subsidies, and incentives on the deployment of solar technologies can provide valuable insights for policymakers. Analyzing the influence of regulatory factors on the economic feasibility and adoption of solar energy systems can help shape supportive policies.
Environmental Impact Assessment: Future research can delve deeper into the environmental impacts of solar energy systems, considering factors beyond greenhouse gas emissions. This could include assessing the life cycle’s environmental impacts, such as embodied energy and materials, waste management, and land use implications.

7. Conclusions

The geographical location of Saudi Arabia makes it an ideal country for both domestic and industrial use of solar energy. Most regions of Saudi Arabia receive ample solar irradiance throughout the year. As the country relies heavily on fossil fuels for electricity generation, it is expected that Saudi Arabia will increasingly adopt renewable energy sources, including solar energy, to reduce greenhouse gas (GHG) emissions and preserve fossil fuel resources for export. In this study, two solar technologies, PV and solar thermal, were considered. 5 MW systems of both technologies were designed and analyzed in three different cities in Saudi Arabia. PVsyst software was used for PV simulation, while SAM was utilized for solar thermal analysis. The effective global irradiance was calculated, and the expected annual energy production was determined for the Abha, Jeddah, and Dammam regions. The system design also included the evaluation of GHG emission balance, system losses, and performance ratio for all three sites. The results of the analysis were then applied to the Multi-Criteria Decision Making (MCDM) model to identify the most suitable technology for each site. The results showed that for PV systems, Abha (0.91) ranked first, followed by Jeddah (0.83), and then Dammam (0.73). For the thermal systems, Jeddah (0.96) ranked first, followed by Abha (0.91), and then Dammam (0.86). Overall, solar thermal technology demonstrated better performance than PV systems in Saudi Arabia, thanks to the country’s higher temperature. Conducting feasibility analyses of PV plants before installation can help determine the maximum electricity production potential. This study provides valuable insights for decision-makers in identifying the most optimal site based on factors such as energy production, irradiance, system losses, and GHG emissions.

Author Contributions

Methodology, A.A. and M.A.; Software, A.A.; Formal analysis, A.A. and M.A.; Writing—original draft, A.A. and M.A.; Funding acquisition, M.A. All authors have read and agreed to the published version of the manuscript.

Funding

The authors extend their appreciation to the Deputyship for Research and Innovation, Ministry of Education in Saudi Arabia, for funding this research work through project number 223202.

Data Availability Statement

Data available on request.

Conflicts of Interest

The authors declare no conflict of interest.

References

  1. Dincer, F. The analysis on wind energy electricity generation status, potential and policies in the world. Renew. Sustain. Energy Rev. 2011, 15, 5135–5142. [Google Scholar] [CrossRef]
  2. Raheem, A.; Abbasi, S.A.; Memon, A.; Samo, S.R.; Taufiq-Yap, Y.H.; Danquah, M.K.; Harun, R. Renewable energy deployment to combat energy crisis in Pakistan. Energy Sustain. Soc. 2016, 6, 16. [Google Scholar] [CrossRef] [Green Version]
  3. Ashfaq, A.; Ianakiev, A. Features of fully integrated renewable energy atlas for Pakistan; wind, solar and cooling. Renew. Sustain. Energy Rev. 2018, 97, 14–27. [Google Scholar] [CrossRef] [Green Version]
  4. Ludin, N.A.; Mustafa, N.I.; Hanafiah, M.M.; Ibrahim, M.A.; Teridi, M.A.M.; Sepeai, S.; Zaharim, A.; Sopian, K. Prospects of life cycle assessment of renewable energy from solar photovoltaic technologies: A review. Renew. Sustain. Energy Rev. 2018, 96, 11–28. [Google Scholar] [CrossRef]
  5. Qu, M.; Ahponen, P.; Tahvanainen, L.; Gritten, D.; Mola-Yudego, B.; Pelkonen, P. Chinese university students’ knowledge and attitudes regarding forest bio-energy. Renew. Sustain. Energy Rev. 2011, 15, 3649–3657. [Google Scholar] [CrossRef]
  6. Lucas, H.; Pinnington, S.; Cabeza, L.F. Education and training gaps in the renewable energy sector. Sol. Energy 2018, 173, 449–455. [Google Scholar] [CrossRef]
  7. Trop, P.; Goricanec, D. Comparisons between energy carriers’ productions for exploiting renewable energy sources. Energy 2016, 108, 155–161. [Google Scholar] [CrossRef]
  8. Fornara, F.; Pattitoni, P.; Mura, M.; Strazzera, E. Predicting intention to improve household energy efficiency: The role of value-belief-norm theory, normative and informational influence, and specific attitude. J. Environ. Psychol. 2016, 45, 1–10. [Google Scholar] [CrossRef]
  9. Mardani, A.; Jusoh, A.; Zavadskas, E.; Cavallaro, F.; Khalifah, Z. Sustainable and Renewable Energy: An Overview of the Application of Multiple Criteria Decision Making Techniques and Approaches. Sustainability 2015, 7, 13947–13984. [Google Scholar] [CrossRef] [Green Version]
  10. Borovik, M.R.; Albers, J.D. Participation in the Illinois solar renewable energy market. Electr. J. 2018, 31, 33–39. [Google Scholar] [CrossRef]
  11. Kousksou, T.; Bruel, P.; Jamil, A.; El Rhafiki, T.; Zeraouli, Y. Energy storage: Applications and challenges. Sol. Energy Mater. Sol. Cells 2014, 120, 59–80. [Google Scholar] [CrossRef]
  12. Stigka, E.K.; Paravantis, J.A.; Mihalakakou, G.K. Social acceptance of renewable energy sources: A review of contingent valuation applications. Renew. Sustain. Energy Rev. 2014, 32, 100–106. [Google Scholar] [CrossRef]
  13. Tsagarakis, K.P.; Mavragani, A.; Jurelionis, A.; Prodan, I.; Andrian, T.; Bajare, D.; Korjakins, A.; Magelinskaite-Legkauskiene, S.; Razvan, V.; Stasiuliene, L. Clean vs. Green: Redefining renewable energy. Evidence from Latvia, Lithuania, and Romania. Renew. Energy 2018, 121, 412–419. [Google Scholar] [CrossRef]
  14. Zografakis, N.; Sifaki, E.; Pagalou, M.; Nikitaki, G.; Psarakis, V.; Tsagarakis, K.P. Assessment of public acceptance and willingness to pay for renewable energy sources in Crete. Renew. Sustain. Energy Rev. 2010, 14, 1088–1095. [Google Scholar] [CrossRef]
  15. Bayulgen, O.; Benegal, S. Green Priorities: How economic frames affect perceptions of renewable energy in the United States. Energy Res. Soc. Sci. 2019, 47, 28–36. [Google Scholar] [CrossRef]
  16. Keramitsoglou, K.M.; Mellon, R.C.; Tsagkaraki, M.I.; Tsagarakis, K.P. Clean, not green: The effective representation of renewable energy. Renew. Sustain. Energy Rev. 2016, 59, 1332–1337. [Google Scholar] [CrossRef]
  17. Rad, M.A.V.; Ghasempour, R.; Rahdan, P.; Mousavi, S.; Arastounia, M. Techno-economic analysis of a hybrid power system based on the cost-effective hydrogen production method for rural electrification, a case study in Iran. Energy 2020, 190, 116421. [Google Scholar] [CrossRef]
  18. Hoseinzadeh, S.; Garcia, D.A. Techno-economic assessment of hybrid energy flexibility systems for islands’ decarbonization: A case study in Italy. Sustain. Energy Technol. Assess. 2022, 51, 101929. [Google Scholar] [CrossRef]
  19. Ali, M.; Wazir, R.; Imran, K.; Ullah, K.; Janjua, A.K.; Ulasyar, A.; Khattak, A.; Guerrero, J.M. Techno-economic assessment and sustainability impact of hybrid energy systems in Gilgit-Baltistan, Pakistan. Energy Rep. 2021, 7, 2546–2562. [Google Scholar] [CrossRef]
  20. Kumar, D.; Tewary, T. Techno-economic assessment and optimization of a standalone residential hybrid energy system for sustainable energy utilization. Int. J. Energy Res. 2022, 46, 10020–10039. [Google Scholar] [CrossRef]
  21. Seedahmed, M.M.A.; Ramli, M.A.M.; Bouchekara, H.R.E.H.; Shahriar, M.S.; Milyani, A.H.; Rawa, M. A techno-economic analysis of a hybrid energy system for the electrification of a remote cluster in western Saudi Arabia. Alex. Eng. J. 2022, 61, 5183–5202. [Google Scholar] [CrossRef]
  22. Akan, A.E. Techno-economic analysis of an off-grid hybrid energy system with homer pro. Icontech Int. J. 2021, 5, 56–61. [Google Scholar] [CrossRef]
  23. Khan, F.A.; Pal, N.; Saeed, S.H.; Yadav, A. Techno-economic and feasibility assessment of standalone solar Photovoltaic/Wind hybrid energy system for various storage techniques and different rural locations in India. Energy Convers. Manag. 2022, 270, 116217. [Google Scholar] [CrossRef]
  24. Gielen, D.; Boshell, F.; Saygin, D.; Bazilian, M.D.; Wagner, N.; Gorini, R. The role of renewable energy in the global energy transformation. Energy Strategy Rev. 2019, 24, 38–50. [Google Scholar] [CrossRef]
  25. Lange, M.A. Impacts of Climate Change on the Eastern Mediterranean and the Middle East and North Africa Region and the Water–Energy Nexus. Atmosphere 2019, 10, 455. [Google Scholar] [CrossRef] [Green Version]
  26. Khan, M.; Asif, M.; Stach, E. Rooftop PV Potential in the Residential Sector of the Kingdom of Saudi Arabia. Buildings 2017, 7, 46. [Google Scholar] [CrossRef] [Green Version]
  27. Almasoud, A.H.; Gandayh, H.M. Future of solar energy in Saudi Arabia. J. King Saud Univ.-Eng. Sci. 2015, 27, 153–157. [Google Scholar] [CrossRef] [Green Version]
  28. Amran, Y.H.A.; Amran, Y.H.M.; Alyousef, R.; Alabduljabbar, H. Renewable and sustainable energy production in Saudi Arabia according to Saudi Vision 2030; Current status and future prospects. J. Clean. Prod. 2020, 247, 119602. [Google Scholar] [CrossRef]
  29. Tlili, I. Renewable energy in Saudi Arabia: Current status and future potentials. Environ. Dev. Sustain. 2015, 17, 859–886. [Google Scholar] [CrossRef]
  30. Alnatheer, O. The potential contribution of renewable energy to electricity supply in Saudi Arabia. Energy Policy 2005, 33, 2298–2312. [Google Scholar] [CrossRef]
  31. Boretti, A. Cost and production of solar thermal and solar photovoltaics power plants in the United States. Renew. Energy Focus 2018, 26, 93–99. [Google Scholar] [CrossRef]
  32. Patel, H.; Agarwal, V. Maximum Power Point Tracking Scheme for PV Systems Operating Under Partially Shaded Conditions. IEEE Trans. Ind. Electron. 2008, 55, 1689–1698. [Google Scholar] [CrossRef]
  33. Bishoyi, D.; Sudhakar, K. Modeling and performance simulation of 100 MW PTC based solar thermal power plant in Udaipur India. Case Stud. Therm. Eng. 2017, 10, 216–226. [Google Scholar] [CrossRef]
  34. Pohekar, S.D.; Ramachandran, M. Application of multi-criteria decision making to sustainable energy planning—A review. Renew. Sustain. Energy Rev. 2004, 8, 365–381. [Google Scholar] [CrossRef]
  35. Kumar, N.M.; Kumar, M.R.; Rejoice, P.R.; Mathew, M. Performance analysis of 100 kWp grid connected Si-poly photovoltaic system using PVsyst simulation tool. Energy Procedia 2017, 117, 180–189. [Google Scholar] [CrossRef]
  36. Dehghan, H.; Pourfayaz, F.; Shahsavari, A. Multicriteria decision and Geographic Information System-based locational analysis and techno-economic assessment of a hybrid energy system. Renew. Energy 2022, 198, 189–199. [Google Scholar] [CrossRef]
  37. Mahesh, A.; Sandhu, K.S. A genetic algorithm based improved optimal sizing strategy for solar-wind-battery hybrid system using energy filter algorithm. Front. Energy 2020, 14, 139–151. [Google Scholar] [CrossRef]
  38. Al Garni, H.Z.; Awasthi, A. Solar PV Power Plants Site Selection. In Advances in Renewable Energies and Power Technologies; Elsevier: Amsterdam, The Netherlands, 2018; pp. 57–75. [Google Scholar] [CrossRef]
  39. Diemuodeke, E.O.; Addo, A.; Oko, C.O.C.; Mulugetta, Y.; Ojapah, M.M. Optimal mapping of hybrid renewable energy systems for locations using multi-criteria decision-making algorithm. Renew. Energy 2019, 134, 461–477. [Google Scholar] [CrossRef]
  40. Konneh, D.; Howlader, H.; Shigenobu, R.; Senjyu, T.; Chakraborty, S.; Krishna, N. A Multi-Criteria Decision Maker for Grid-Connected Hybrid Renewable Energy Systems Selection Using Multi-Objective Particle Swarm Optimization. Sustainability 2019, 11, 1188. [Google Scholar] [CrossRef] [Green Version]
  41. Dehshiri, S.S.H. A new application of multi criteria decision making in energy technology in traditional buildings: A case study of Isfahan. Energy 2022, 240, 122814. [Google Scholar] [CrossRef]
  42. Ibrahim, A.; Surya, R.A. The Implementation of Simple Additive Weighting (SAW) Method in Decision Support System for the Best School Selection in Jambi. J. Phys. Conf. Ser. 2019, 1338, 012054. [Google Scholar] [CrossRef] [Green Version]
  43. Xu, X.; Li, Y.; Huang, T.; Xue, Y.; Peng, K.; Qi, L.; Dou, W. An energy-aware computation offloading method for smart edge computing in wireless metropolitan area networks. J. Netw. Comput. Appl. 2019, 133, 75–85. [Google Scholar] [CrossRef]
  44. Mostafaeipour, A.; Sedeh, A.S. Investigation of solar energy utilization for production of hydrogen and sustainable chemical fertilizer: A case study. Int. J. Energy Res. 2019, 43, er.4829. [Google Scholar] [CrossRef]
  45. Zhou, S.; Yang, P. Risk management in distributed wind energy implementing Analytic Hierarchy Process. Renew. Energy 2020, 150, 616–623. [Google Scholar] [CrossRef]
  46. Raghav, L.P.; Kumar, R.S.; Raju, D.K.; Singh, A.R. Analytic Hierarchy Process (AHP)—Swarm intelligence based flexible demand response management of grid-connected microgrid. Appl. Energy 2022, 306, 118058. [Google Scholar] [CrossRef]
  47. Baseer, M.A.; Rehman, S.; Meyer, J.P.; Alam, M.M. GIS-based site suitability analysis for wind farm development in Saudi Arabia. Energy 2017, 141, 1166–1176. [Google Scholar] [CrossRef] [Green Version]
  48. Kharrich, M.; Kamel, S.; Alghamdi, A.S.; Eid, A.; Mosaad, M.I.; Akherraz, M.; Abdel-Akher, M. Optimal Design of an Isolated Hybrid Microgrid for Enhanced Deployment of Renewable Energy Sources in Saudi Arabia. Sustainability 2021, 13, 4708. [Google Scholar] [CrossRef]
  49. Almasad, A.; Pavlak, G.; Alquthami, T.; Kumara, S. Site suitability analysis for implementing solar PV power plants using GIS and fuzzy MCDM based approach. Sol. Energy 2023, 249, 642–650. [Google Scholar] [CrossRef]
  50. Mashal, I.; Alsaryrah, O.; Chung, T.-Y.; Yuan, F.-C. A multi-criteria analysis for an internet of things application recommendation system. Technol. Soc. 2020, 60, 101216. [Google Scholar] [CrossRef]
  51. Kumar, N.; Singh, T.; Grewal, J.S.; Patnaik, A.; Fekete, G. A novel hybrid AHP-SAW approach for optimal selection of natural fiber reinforced non-asbestos organic brake friction composites. Mater. Res. Express 2019, 6, 065701. [Google Scholar] [CrossRef]
  52. Mohammad, G.S.; Alizadeh, M.S.; Hayati, S.S.H. A Fuzzy MADM Approach for Selecting the Best Cyanide Removal Method from a Gold Mine Wastewater. Res. Sq. 2021. [Google Scholar] [CrossRef]
  53. Mu, E.; Pereyra-Rojas, M. Practical Decision Making Using Super Decisions v3; Springer International Publishing: Cham, Switzerland, 2018. [Google Scholar] [CrossRef]
  54. Al-Badi, A.; Al Wahaibi, A.; Ahshan, R.; Malik, A. Techno-Economic Feasibility of a Solar-Wind-Fuel Cell Energy System in Duqm, Oman. Energies 2022, 15, 5379. [Google Scholar] [CrossRef]
  55. Riayatsyah, T.M.I.; Geumpana, T.A.; Fattah, I.M.R.; Rizal, S.; Mahlia, T.M.I. Techno-Economic Analysis and Optimisation of Campus Grid-Connected Hybrid Renewable Energy System Using HOMER Grid. Sustainability 2022, 14, 7735. [Google Scholar] [CrossRef]
  56. Shahzad, M.K.; Zahid, A.; Rashid, T.U.; Rehan, M.A.; Ali, M.; Ahmad, M. Techno-economic feasibility analysis of a solar-biomass off grid system for the electrification of remote rural areas in Pakistan using HOMER software. Renew. Energy 2017, 106, 264–273. [Google Scholar] [CrossRef]
  57. Wahid, S.S.A.; Arief, Y.Z.; Mubarakah, N. Optimization of Hybrid Renewable Energy in Malaysia Remote Rural Area Using HOMER Software. In Proceedings of the 2019 3rd International Conference on Electrical, Telecommunication and Computer Engineering (ELTICOM), Medan, Indonesia, 16–17 September 2019; pp. 111–115. [Google Scholar] [CrossRef]
  58. Awan, A.; Zubair, M. Performance Analysis and Optimization of a Parabolic Trough Solar Power Plant in the Middle East Region. Energies 2018, 11, 741. [Google Scholar] [CrossRef] [Green Version]
  59. Gong, J.; Huang, J.; Hu, X.; Wang, J.; Lund, P.D.; Gao, C. Optimizing research on large-aperture parabolic trough condenser using two kinds of absorber tubes with reflector at 500 °C. Renew. Energy 2021, 179, 2187–2197. [Google Scholar] [CrossRef]
  60. Nelson, S.; Luu, M.T.; Suo, S.; Milani, D.; Abbas, A. A CFD study of a direct solar-driven desorption process for carbon capture under transient conditions. Sustain. Energy Technol. Assess. 2021, 47, 101516. [Google Scholar] [CrossRef]
  61. Ghazouani, M.; Bouya, M.; Benaissa, M.; Anoune, K.; Ghazi, M. Thermal energy management optimization of solar thermal energy system based on small parabolic trough collectors for bitumen maintaining on heat process. Sol. Energy 2020, 211, 1403–1421. [Google Scholar] [CrossRef]
  62. Turkdogan, S. Design and optimization of a solely renewable based hybrid energy system for residential electrical load and fuel cell electric vehicle. Eng. Sci. Technol. Int. J. 2021, 24, 397–404. [Google Scholar] [CrossRef]
  63. Chisale, S.W.; Mangani, P. Energy Audit and Feasibility of Solar PV Energy System: Case of a Commercial Building. J. Energy 2021, 2021, 1–9. [Google Scholar] [CrossRef]
  64. Solangi, Y.A.; Shah, S.A.A.; Zameer, H.; Ikram, M.; Saracoglu, B.O. Assessing the solar PV power project site selection in Pakistan: Based on AHP-fuzzy VIKOR approach. Environ. Sci. Pollut. Res. 2019, 26, 30286–30302. [Google Scholar] [CrossRef]
  65. Irfan, M.; Zhao, Z.Y.; Ahmad, M.; Rehman, A. A techno-economic analysis of off-grid solar PV system: A case study for Punjab province in Pakistan. Processes 2019, 7, 708. [Google Scholar] [CrossRef] [Green Version]
  66. Tahir, S.; Ahmad, M.; Abd-ur-Rehman, H.M.; Shakir, S. Techno-economic assessment of concentrated solar thermal power generation and potential barriers in its deployment in Pakistan. J. Clean. Prod. 2021, 293, 126125. [Google Scholar] [CrossRef]
  67. Abdelhady, S. Performance and cost evaluation of solar dish power plant: Sensitivity analysis of levelized cost of electricity (LCOE) and net present value (NPV). Renew. Energy 2021, 168, 332–342. [Google Scholar] [CrossRef]
  68. Wang, G.; Chao, Y.; Jiang, T.; Chen, Z. Facilitating developments of solar thermal power and nuclear power generations for carbon neutral: A study based on evolutionary game theoretic method. Sci. Total Environ. 2022, 814, 151927. [Google Scholar] [CrossRef]
  69. Yan, H.; Li, X.; Liu, M.; Chong, D.; Yan, J. Performance analysis of a solar-aided coal-fired power plant in off-design working conditions and dynamic process. Energy Convers. Manag. 2020, 220, 113059. [Google Scholar] [CrossRef]
  70. Huang, C.; Hou, H.; Hu, E.; Liang, M.; Yang, Y. Impact of power station capacities and sizes of solar field on the performance of solar aided power generation. Energy 2017, 139, 667–679. [Google Scholar] [CrossRef]
  71. Li, C.; Zhai, R.; Sun, Y. Thermal and economic performances comparison of different pulverized coal power systems augmented by solar trough or tower technologies. Case Stud. Therm. Eng. 2022, 34, 102009. [Google Scholar] [CrossRef]
  72. Baneshi, M.; Hadianfard, F. Techno-economic feasibility of hybrid diesel/PV/wind/battery electricity generation systems for non-residential large electricity consumers under southern Iran climate conditions. Energy Convers. Manag. 2016, 127, 233–244. [Google Scholar] [CrossRef]
  73. Fazelpour, F.; Soltani, N.; Rosen, M.A. Economic analysis of standalone hybrid energy systems for application in Tehran, Iran. Int. J. Hydrogen Energy 2016, 41, 7732–7743. [Google Scholar] [CrossRef]
  74. Shami, S.H.; Ahmad, J.; Zafar, R.; Haris, M.; Bashir, S. Evaluating wind energy potential in Pakistan’s three provinces, with proposal for integration into national power grid. Renew. Sustain. Energy Rev. 2016, 53, 408–421. [Google Scholar] [CrossRef]
  75. Anwar, K.; Deshmukh, S.; Rizvi, S.M. Feasibility and Sensitivity Analysis of a Hybrid Photovoltaic/Wind/Biogas/Fuel-Cell/Diesel/Battery System for Off-Grid Rural Electrification Using homer. J. Energy Resour. Technol. 2020, 142, 061307. [Google Scholar] [CrossRef]
  76. Rehmani, A.M.; Akhter, P. Techno-Economic analysis of hybrid renewable energy systems for rural area energization in Pakistan. In Proceedings of the 2019 3rd International Conference on Energy Conservation and Efficiency (ICECE), Lahore, Pakistan, 23–24 October 2019; pp. 1–6. [Google Scholar] [CrossRef]
  77. Nesamalar, J.J.D.; Suruthi, S.; Raja, S.C.; Tamilarasu, K. Techno-economic analysis of both on-grid and off-grid hybrid energy system with sensitivity analysis for an educational institution. Energy Convers. Manag. 2021, 239, 114188. [Google Scholar] [CrossRef]
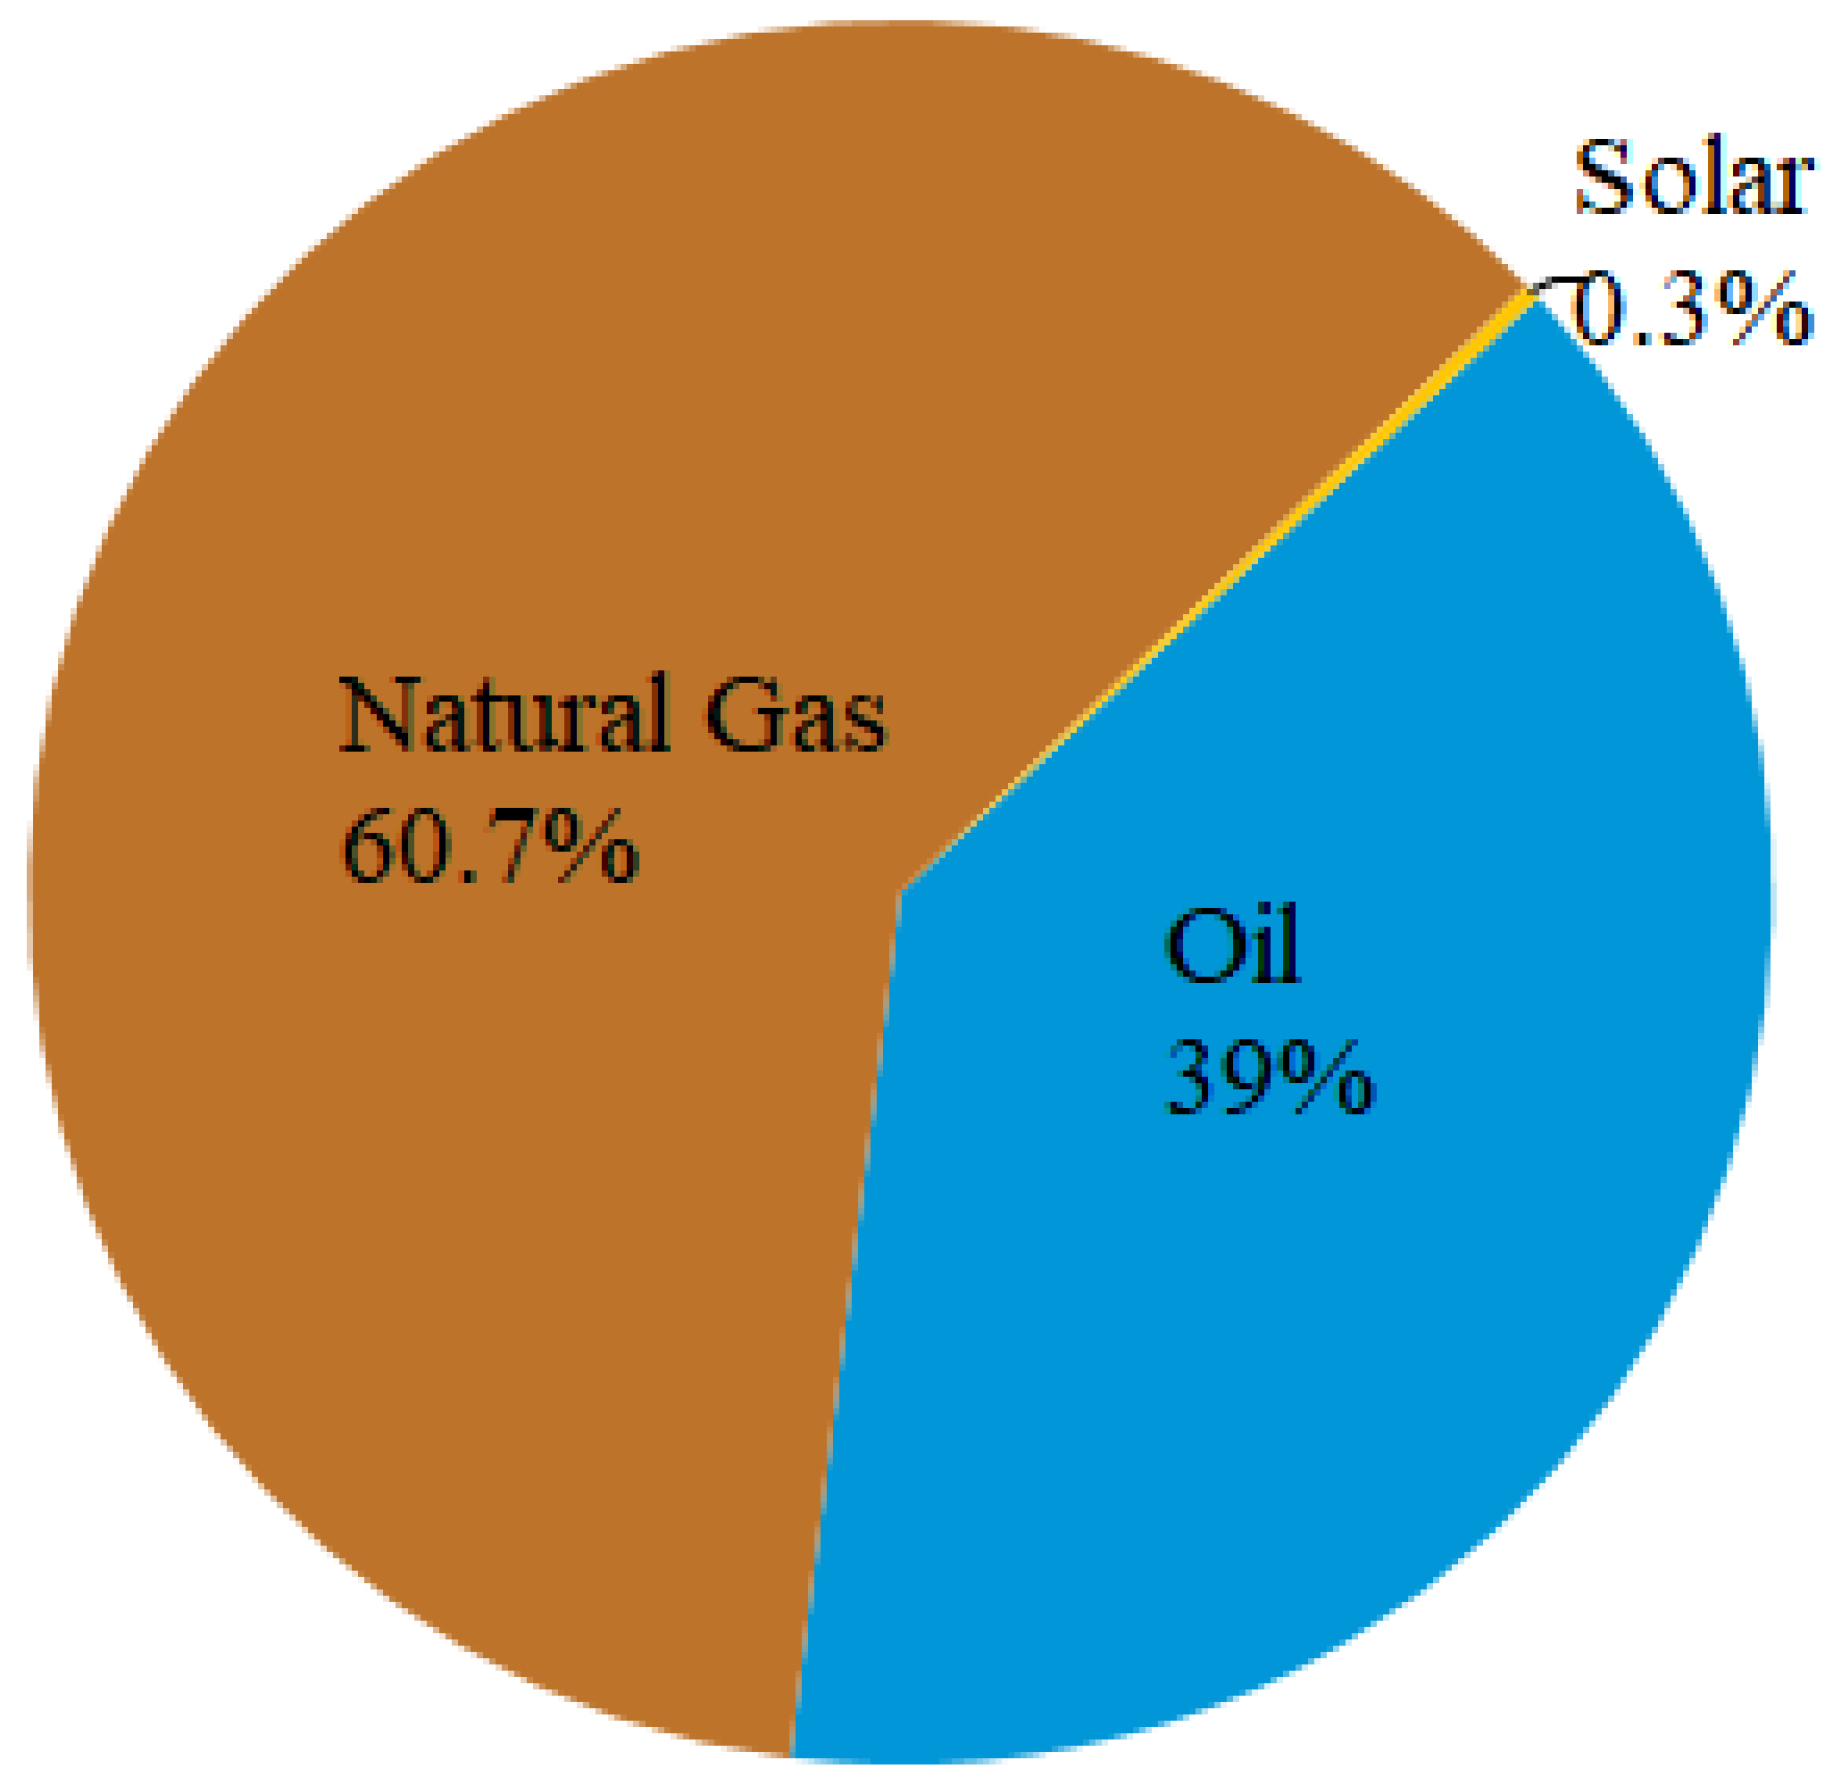
Figure 1. Electricity Energy Mix of Saudi Arabia [25].
Sustainability 15 10228 g001
Figure 2. The Potential of Renewable Resources in Saudi Arabia [26].
Sustainability 15 10228 g002
Figure 3. The Potential of Solar Irradiance in Saudi Arabia [27].
Sustainability 15 10228 g003
Figure 4. Methodology of the Proposed System.
Sustainability 15 10228 g004
Figure 5. Parameters selected as criteria for the MCDM.
Sustainability 15 10228 g005
Figure 6. Weightage of Each Criterion (%).
Sustainability 15 10228 g006
Figure 7. Location of the three selected sites.
Sustainability 15 10228 g007
Figure 8. Annual Solar Irradiance and Incident Losses.
Sustainability 15 10228 g008
Figure 9. Annual Energy Yield.
Sustainability 15 10228 g009
Figure 10. Annual Losses in PV system.
Sustainability 15 10228 g010
Figure 11. (a). Single Line Diagram for Parabolic Trough Systems. (b). Annual Losses in Parabolic Trough System.
Sustainability 15 10228 g011
Figure 12. Annual GHG Emissions saved.
Sustainability 15 10228 g012
Figure 13. Soiling Losses.
Sustainability 15 10228 g013
Figure 14. MCDM analysis of the PV system.
Sustainability 15 10228 g014
Figure 15. MCDM analysis of the Parabolic Trough system.
Sustainability 15 10228 g015
Figure 16. MCDM Analysis of both Solar Systems.
Sustainability 15 10228 g016
Table 1. Selected Criteria Details.
Criteria NameTypeCriteria NameType
C1: Solar IrradianceClimateC8: NPVEconomical
C2: TemperatureClimateC9: Payback periodEconomical
C3: WindClimateC10: Electricity Export RevenueEconomical
C4: HumidityClimateC11: GHG EmissionsEnvironmental
C5: Energy YieldTechnicalC12: Soiling LossEnvironmental
C6: System LossesTechnicalC13: Population DensitySocial
C7: LCOEEconomical
Table 2. Pairwise Comparison Scaling [52,53].
Intensity of ImportanceDefinitionExplanation
1Equal ImportanceTwo factors contribute equally to the objective
3Somewhat more importantExperience and Judgement slightly favor one over the other
5Much more importantExperience and Judgement strongly favor one over other
7Very much more importantExperience and Judgement very strongly favor one over the other. Its importance is demonstrated in one over the other
9Absolutely more importantThe evidence favoring one over the other is of the highest possible validity
2, 4, 6, 8Intermediate ValuesWhen compromise is needed
Table 3. Pairwise Values of the Comparison Matrix.
Solar IrrAir TempWindHumidityEnergy YieldSystem LossLCOENPVPAY BACKElectricity
Export Revenue
GHG Emissions
Saving
Soiling
Loss
Population
Density
Solar Irr15640.2543252242
Air Temp0.210.520.110.50.50.170.50.120.170.330.14
Wind0.172130.17350.220.140.1730.2
Humidity0.250.50.3310.14220.220.170.1720.14
Energy
Yield
4967176352276
System
Loss
0.2520.330.50.14120.220.140.1220.14
LCOE0.3320.20.50.170.510.170.50.140.170.51
NPV0.56550.3356170.5262
PAYBACK0.220.50.50.20.520.1410.170.1730.2
Electricity
Export Revenue
0.58760.577261273
GHG Emissions
saving
0.56660.5860.560.5183
Soiling Loss0.2530.330.50.140.520.170.330.140.1210.2
Population
Density
0.57570.17710.550.330.3351
Sum8.6553.538.19433.824643.510.2542.337.3510.4248.8319.02
Table 4. Normalized Pairwise Matrix.
Solar IrrAir TempWindHumidityEnergy YieldSystem LossLCOENPVPAY BACKElectricity
Export Revenue
GHG Emissions
Saving
Soiling
Loss
Population
Density
Solar Irr0.1160.0930.1570.0930.0650.0870.0690.1950.1180.2720.1920.0820.105
Air Temp0.0230.0190.0130.0470.0290.01090.0110.0170.0120.0160.0160.0070.007
Wind0.020.0370.0260.070.0450.06520.1150.020.0470.0190.0160.0610.011
Humidity0.0290.0090.0090.0230.0370.04350.0460.020.0470.0230.0160.0410.007
Energy
Yield
0.4620.1680.1570.1630.2620.15220.1380.2930.1180.2720.1920.1430.315
System
Loss
0.0290.0370.0090.0120.0370.02170.0460.020.0470.0190.0120.0410.007
LCOE0.0380.0370.0050.0120.0450.01090.0230.0170.0120.0190.0160.010.053
NPV0.0580.1120.1310.1160.0860.10870.1380.0980.1650.0680.1920.1230.105
PAYBACK0.0230.0370.0130.0120.0520.01090.0460.0140.0240.0230.0160.0610.011
Electricity
Export Revenue
0.0580.150.1830.140.1310.15220.1610.1950.1420.1360.1920.1430.158
GHG Emissions
saving
0.0580.1120.1570.140.1310.17390.1380.0490.1420.0680.0960.1640.158
Soiling Loss0.0290.0560.0090.0120.0370.01090.0460.0170.0080.0190.0120.020.011
Population
Density
0.0580.1310.1310.1630.0450.15220.0230.0490.1180.0450.0320.1020.053
Table 5. Overall Weightage for each Criterion.
C1C2C3C4C5C6C7C8C9C10C11C12C13
0.1270.0180.0420.0270.2180.0260.0230.1150.0260.1490.1220.0220.085
Table 6. Parameters for the PV System.
ParameterValue
Field TypeFixed Tilted Plane
System typeGrid Connected System
System Size5 MW
PV modulesPolycrystalline Silicon Suntech.STP_350_72_Vfh
PV Module Price 0.18 $/W ($65)
nominal power350 Wp
maximum power point (Pmpp)350.5 W
open circuit voltage (Voc)46.6 V
maximum power point voltage (Vmpp)39.2 V
maximum power point current (Impp)8.930 A
short circuit current of PV module (Isc)9.520 A
Modules per String 19
Total Strings752
InverterSungrow
Inverter unit power1000
Inverter Price$22,000
Inverter Efficiency98.79%
Inverter Quantity5
Table 7. Collector, Receiver, and HTF details.
Heat Transfer FluidHITEC Solar SaltCollectorSkyFuel Sky TroughReceiverSchott PTR80
HTF Cost60 $/m2Solar Field Cost150 $/m2Power Plant Cost910 $/kWe
Flow rate of Min Single loop1 kg/sAperture of Reflective656 m2Absorber Tube Inner Diameter0.076 m
Flow rate of Max Single Loop12 kg/sWidth of Area Aperture6 mAbsorber Tube Outer Diameter0.08 m
Min Velocity field flow0.268562 m/sCollector assembly length115 mTotal Receiver Losses207.35 W/m
Max Velocity field flow3.74479 m/sWater usage Per wash0.7 L/m2Washes per year63
Table 8. Geographical Location of the Selected Cities.
ParameterAbhaJeddahDammam
Latitude18.2268°21.4433°26.3542°
Longitude42.5387°39.2303°50.1703°
Altitude2198 m16 m21 m
Tilt Angle22°21°24°
Azimuth Angle
Table 9. Climate Criteria Values.
CriteriaSub-CriteriaAbhaJeddahDammam
ClimaticSolar Irradiation (kWh/m2/year)247021922019
Temperature (°C)19.628.827.3
Wind Speed (m/s)3.12.54.3
Relative Humidity (%)48.858.246.5
Table 10. (a). Global Effective Irradiance at the Collector (kWh/m2). (b) Global Incident Losses (kWh/m2).
(a)
AbhacJeddahDammam
January233.8181.3148.5
February212.6172.5143.2
March229.5184.6153.9
April218.1198.8173.0
May193.1203.6188.7
June180.0188.1190.8
July172.0188.0193.5
August173.8182.3188.0
September195.8181.7184.1
October225.2191.2169.7
November216.5164.6145.7
December219.7155.5140.0
Year2470.02192.22019.2
(b)
January2.42.3653.212
February2.42.5042.997
March3.03.1574.450
April3.03.2313.984
May4.03.7614.395
June4.24.0864.154
July5.04.3404.197
August4.94.1294.147
September3.43.2123.035
October2.82.7723.426
November1.92.6993.321
December1.53.1353.321
Year38.439.39144.639
Table 11. Total Energy Yield Produced by the Solar Systems.
Photo Voltaic
Energy Yield (MWh)
Parabolic Trough
Energy Yield (MWh)
AbhaJeddahDammamAbhaJeddahDammam
January1058.0807.9689.31068.2961.258,276.9
February956.0763.3657.31000.81041.253,225.9
March1025.0809.7692.11202.41285.060,010
April972.0857.7759.91265.21302.661,632.9
May857.0867.9803.51259.61289.269,892.5
June795.0802.7800.61191.81396.582,652.5
July760.0798.2806.31141.11383.285,352.7
August768.0775.4785.51110.41181.286,439.3
September862.0780.2779.71110.11240.272,097
October995.0822.4735.41256.81079.165,319.2
November972.0724.4654.31121.1890.856,363.1
December999.0694.3644.61109.0949.557,827.4
Year11,019.09504.28808.813,873.1214,000.1413,754.31
Table 12. Losses in the PV System.
Temperature Losses
(MWh)
Inverter Efficiency Loss
(MWh)
Total Losses in the System
(MWh)
AbhaJeddahDammamAbhaJeddahDammamAbhaJeddahDammam
January66.966.626.712.89.97.85282.078.82537.764
February68.268.833.011.28.97.72281.880.17443.719
March79.581.048.812.39.38.59894.893.46761.848
April78.9100.874.211.610.79.25993.4114.70187.443
May73.7114.3107.010.210.69.57487.9128.671120.969
June72.2105.0120.39.89.59.39986.2118.596133.853
July67.1109.2127.79.69.49.60281.8122.960141.499
August68.1103.5121.79.49.89.66482.3117.419135.511
September81.496.5109.510.49.59.12095.1109.172121.655
October89.3100.483.712.310.08.435104.4113.17295.561
November70.970.448.111.58.48.06884.381.50959.489
December61.456.130.211.48.27.85674.367.40541.377
Year877.61072.6930.8132.3114.1105.1491080.5881226.0811048.3
Table 13. Losses in the Parabolic Trough System.
Total Thermal Losses
(MWt)
Total Electrical Losses
(MWh)
AbhaJeddahDammamAbhaJeddahDammam
January34.6433.6032.288.898.637.016
February31.6131.3831.318.098.16.99
March35.2734.7534.3410.1313.677.036
April33.9333.4333.5911.0115.46 8.154
May34.5034.8634.3910.6814.158.83
June33.0533.5533.4011.2913.849.528
July34.0034.3334.7011.0913.719.111
August34.1334.6833.8310.1910.919.094
September33.0532.9832.919.5112.789.061
October33.9933.7733.509.2514.188.379
November33.3131.9232.959.219.96.899
December34.0733.7833.539.28.76.552
Year405.59403.08400.78119.12144.0296.649
Table 14. CO2 Emission Balance.
AbhaJeddahDammam
PVParabolicPVParabolicPVParabolic
System Production (MWh/yr)11,018.61 13,873.129504.2514,000.148808.82 13,754.31
Grid Lifecycle Emission (gCO2/kWh)743 743 743743 743743
Lifetime (Years)30 303030 3030
Annual Degradation1%1%1%1%1%1%
Replaced Emission (tCO2)245,604.9 309,231.84211,849.6312,063.12196,348.6306,583.56
PV Cycle Emission
(tCO2)
5075.995737.324379.385783.044059.485694.16
Saved CO2 Emission (tCO2)240,528.91303,494.52207,470.22306,280.08192,289.12300,889.40
Table 15. Economic Criteria.
CriteriaSub-CriteriaAbhaJeddahDammamAbhaJeddahDammam
PVThermal
EconomicLevelized Cost of Electricity ($/Mwh)323740152 147155
NPV ($)2,614,1381,835,2081,477,2603,685,9803,697,3103,680,650
Payback Period (Year)4.65.66.310.510.210.9
Electricity Export Revenue ($/Mwh)518,86444,6121421,693649,256655,220639,587
Table 16. Assigning Values to Alternatives (PV).
C1C2C3C4C5C6C7C8C9C10C11C12C13
Abha247019.63.148.811,0851080.5322,614,1384.6518,864240,52878.32,344,220
Jeddah219228.82.558.298041226371,835,2085.6446,121207,47069.79,251,157
Dammam201927.34.346.592081048401,477,2606.3421,693192,28964.351,303,588
Table 17. Assigning Values to Alternatives (Parabolic).
C1C2C3C4C5C6C7C8C9C10C11C12C13
Abha247019.63.148.813,87314801553,685,98010.5649,256303,49497.12,344,220
Jeddah219228.82.558.214,00015261473,697,31010.2655,220306,280989,251,157
Dammam201927.34.346.513,75414181503,680,65010.9639,587300,88996.41,303,588
Table 18. Assigning Values to Alternatives.
C1 C2 C3 C4 C5C6C7C8C9C10C11C12C13
A1(PV)247019.63.148.811,0851080.5322,614,1384.6518,864240,52878.32,344,220
A1(PT)247019.63.148.813,87314801553,685,98010.5649,256303,49497.12,344,220
A2(PV)219228.82.558.298041226371,835,2085.6446,121207,47069.79,251,157
A2(PT)219228.82.558.214,00015261473,697,31010.2655,220306,280989,251,157
A3(PV)201927.34.346.592081048401,477,2606.3421,693192,28964.351,303,588
A3(PT)201927.34.346.513,75414181503,680,65010.9639,587300,88996.41,303,588
Disclaimer/Publisher’s Note: The statements, opinions and data contained in all publications are solely those of the individual author(s) and contributor(s) and not of MDPI and/or the editor(s). MDPI and/or the editor(s) disclaim responsibility for any injury to people or property resulting from any ideas, methods, instructions or products referred to in the content.