Article

Shaking Table Test for Seismic Response of Nuclear Power Plant on Non-Rock Site

1
Key Laboratory of Earthquake Engineering and Engineering Vibration, Institute of Engineering Mechanics, China Earthquake Administration, Harbin 150080, China
2
Institute of Disaster Prevention, Sanhe 065201, China
3
China Nuclear Power Engineering Co., Ltd., Beijing 100840, China
*
Author to whom correspondence should be addressed.
Sustainability 2023, 15(13), 10366; https://doi.org/10.3390/su151310366
Submission received: 30 May 2023 / Revised: 24 June 2023 / Accepted: 25 June 2023 / Published: 30 June 2023
(This article belongs to the Special Issue Earthquake Engineering Technology and Its Application)

Abstract

:
In order to compare and analyze the seismic response characteristics of a safety-related nuclear structure on a non-rock site in the condition of raft and pile group foundations under unidirectional and multidirectional seismic motion input, a large-scale shaking table test of the soil-nuclear structure system was carried out in this paper. In the test, the soil was uniform silted clay, and the shear wave velocity was 213 m/s. Considering the similarity of the superstructure natural frenquency, the actual nuclear power structure was simplified to a three-story frame shear wall structure model. The annular laminated shear model box was used to take the boundary effect of soil into consideration; the seismic motions = were input in only one horizontal direction or three directions at the same time for the shaking table test, and the results were analyzed. The results of the test show that the acceleration response of the safety-related nuclear plant is affected by the directions of input seismic motion and the forms of the foundation. When the seismic motion is input simultaneously in three directions, the acceleration responses of the horizontal motion and vertical rocking of the safety-related plant are larger than those of the single-direction input. The acceleration response of the horizontal motion and vertical rocking of the safety-related structure with the pile group foundation is smaller than that with the raft foundation. The values of most frequency bands in the horizontal acceleration Fourier amplitude spectrum at the top of the pile-foundation structure are smaller than that at the top of the raft-foundation structure, while the displacement is basically the same as that of the raft-foundation structure. This is related to the relation between the frequency component of input seismic motion and the natural frequency of the structure system. Therefore, it is more reasonable to use three-dimensional seismic input in the seismic response analysis of nuclear power plants. The seismic performance of nuclear power plants can be enhanced by using pile group foundations.

1. Introduction

Clean and efficient nuclear power is an important way to solve the global energy problem. However, it is the safety performance of the plant structure that must be given adequate consideration while vigorously developing the nuclear power industry. At present, most of the nuclear power plants built or under construction in China are located in coastal hard bedrock areas, according to the design specifications of nuclear power plants. In view of the decreasing number of sites that meet the requirements of standard design, it is inevitable to turn to inland non-rock sites when selecting bases for new nuclear power plants in the future. Although there are many examples of non-rock nuclear power plant construction abroad, according to statistics, 60% of nuclear power plants in France and 50% in the United States are located in soft rock or sandy soil [1]. The construction of nuclear power plants in China started later, and the theory and specifications are relatively imperfect. Compared with the structural dynamic analysis of nuclear power plants with high-quality bedrock site conditions, the seismic response analysis of safety-related nuclear structures on non-rock sites is more complicated and has more uncertainties. The influence of many factors involved has not been recognized [2].
Nuclear power plant structures have the characteristics of large mass, large stiffness, and high displacement control requirements, which are different from general civil buildings [3]. Currently, some scholars have completed partial research work on the seismic response of nuclear structures on non-rock sites. Ying Jianian et al. [4] calculated the impedance function of a pile foundation under a nuclear power plant with different methods, then suggested that the impedance of the pile foundation should be selected carefully for specific projects and the field test results should be used to assist in the determination of impedance for major projects; Mohamed A. Sayed et al. [5] calculated the dynamic response of a simplified nuclear power plant model; Li Weixin and Wang Guixuan [6,7] established a quasi-three-dimensional finite element model of the pile-soil-CPR1000 nuclear island plant structure and compared the seismic reaction of the plant before and after using a pile group foundation on a soil base; Luo Chuan et al. [8] compared the consequences of nuclear structures with and without piles in horizontally layered sites under earthquakes; Zou Degao et al. [9] analyzed the response of the three-dimensional pile foundation nuclear island model under earthquakes beyond the design basis; Yang Jianhua et al. [10] discussed the key influencing factors in the numerical calculation of the dynamic performance of a nuclear plant with a pile foundation; Zhu Shengdong et al. [11] completed a nonlinear seismic behavior analysis of the piled raft foundation AP1000 nuclear island structure; Chen Shaolin et al. [12] proposed a partition analysis method to improve the efficiency of time-domain soil–structure interaction analysis and applied it to seismic response analysis of nuclear structures.
The numerical simulation method adopted in the above research can reflect the dynamic response characteristics of nuclear power structures to a certain extent. However, the model test method is more intuitive and real, which can provide a reference for evaluating the reliability of various theoretical and numerical models. Jeong Gon Ha et al. [13] compared the results of field tests and centrifuge tests (horizontal unidirectional seismic input) of the seismic reaction of a nuclear power plant containment on a soil site in Hualien and advanced that centrifuge tests can be employed to simulate the soil–foundation–structure interaction of the actual nuclear power plant containment. Li Xiaojun et al. [14,15] conducted a shaking table test of the soil–structure system under three-dimensional seismic motion input with the research object of the CAP1400 nuclear power plant; Peng Lingyun et al. [16] tested the seismic performance of a plant structure with rigid foundations near the bottom plate edge in the CAP1400 nuclear power plant by shaking table test and numerical simulation; Zhang Xueming et al. [17] verified the applicability of the method for establishing a uniform hazard spectrum in actual nuclear power structures by a shaking table test of a nuclear power plant with rigid foundations; Zhou Zhiguang et al. [18,19] completed the shaking table test of the AP1000 nuclear power plant with and without isolation on rigid and soil base; Gao Yongwu et al. [20] studied the floor response spectrum of a nuclear power plant on a soil site under horizontal earthquakes.
This paper is a part of the project “Research on the dynamic response of nuclear island plants on soft soil bases”, which is carried out by a nuclear power company for further analysis of the site adaptability of the safety-related nuclear structure of the third-generation nuclear power plant on a soil base. The shaking table test of the safety-related plant under unidirectional horizontal and multi-directional earthquakes was completed using a simplified model. By comparing the dynamic response of the safety-related plant under unidirectional and multi-directional seismic motion, the influence of multi-directional seismic motion on the horizontal seismic performance of the plant is analyzed, and by comparing the dynamic response of the safety-related plant with pile group and raft foundations, the seismic response characteristics of the plant with different foundation forms on a non-rock site are discussed. The research results in this paper can provide a reference for the seismic design of nuclear power plants on non-rock sites.

2. Overview of the Test

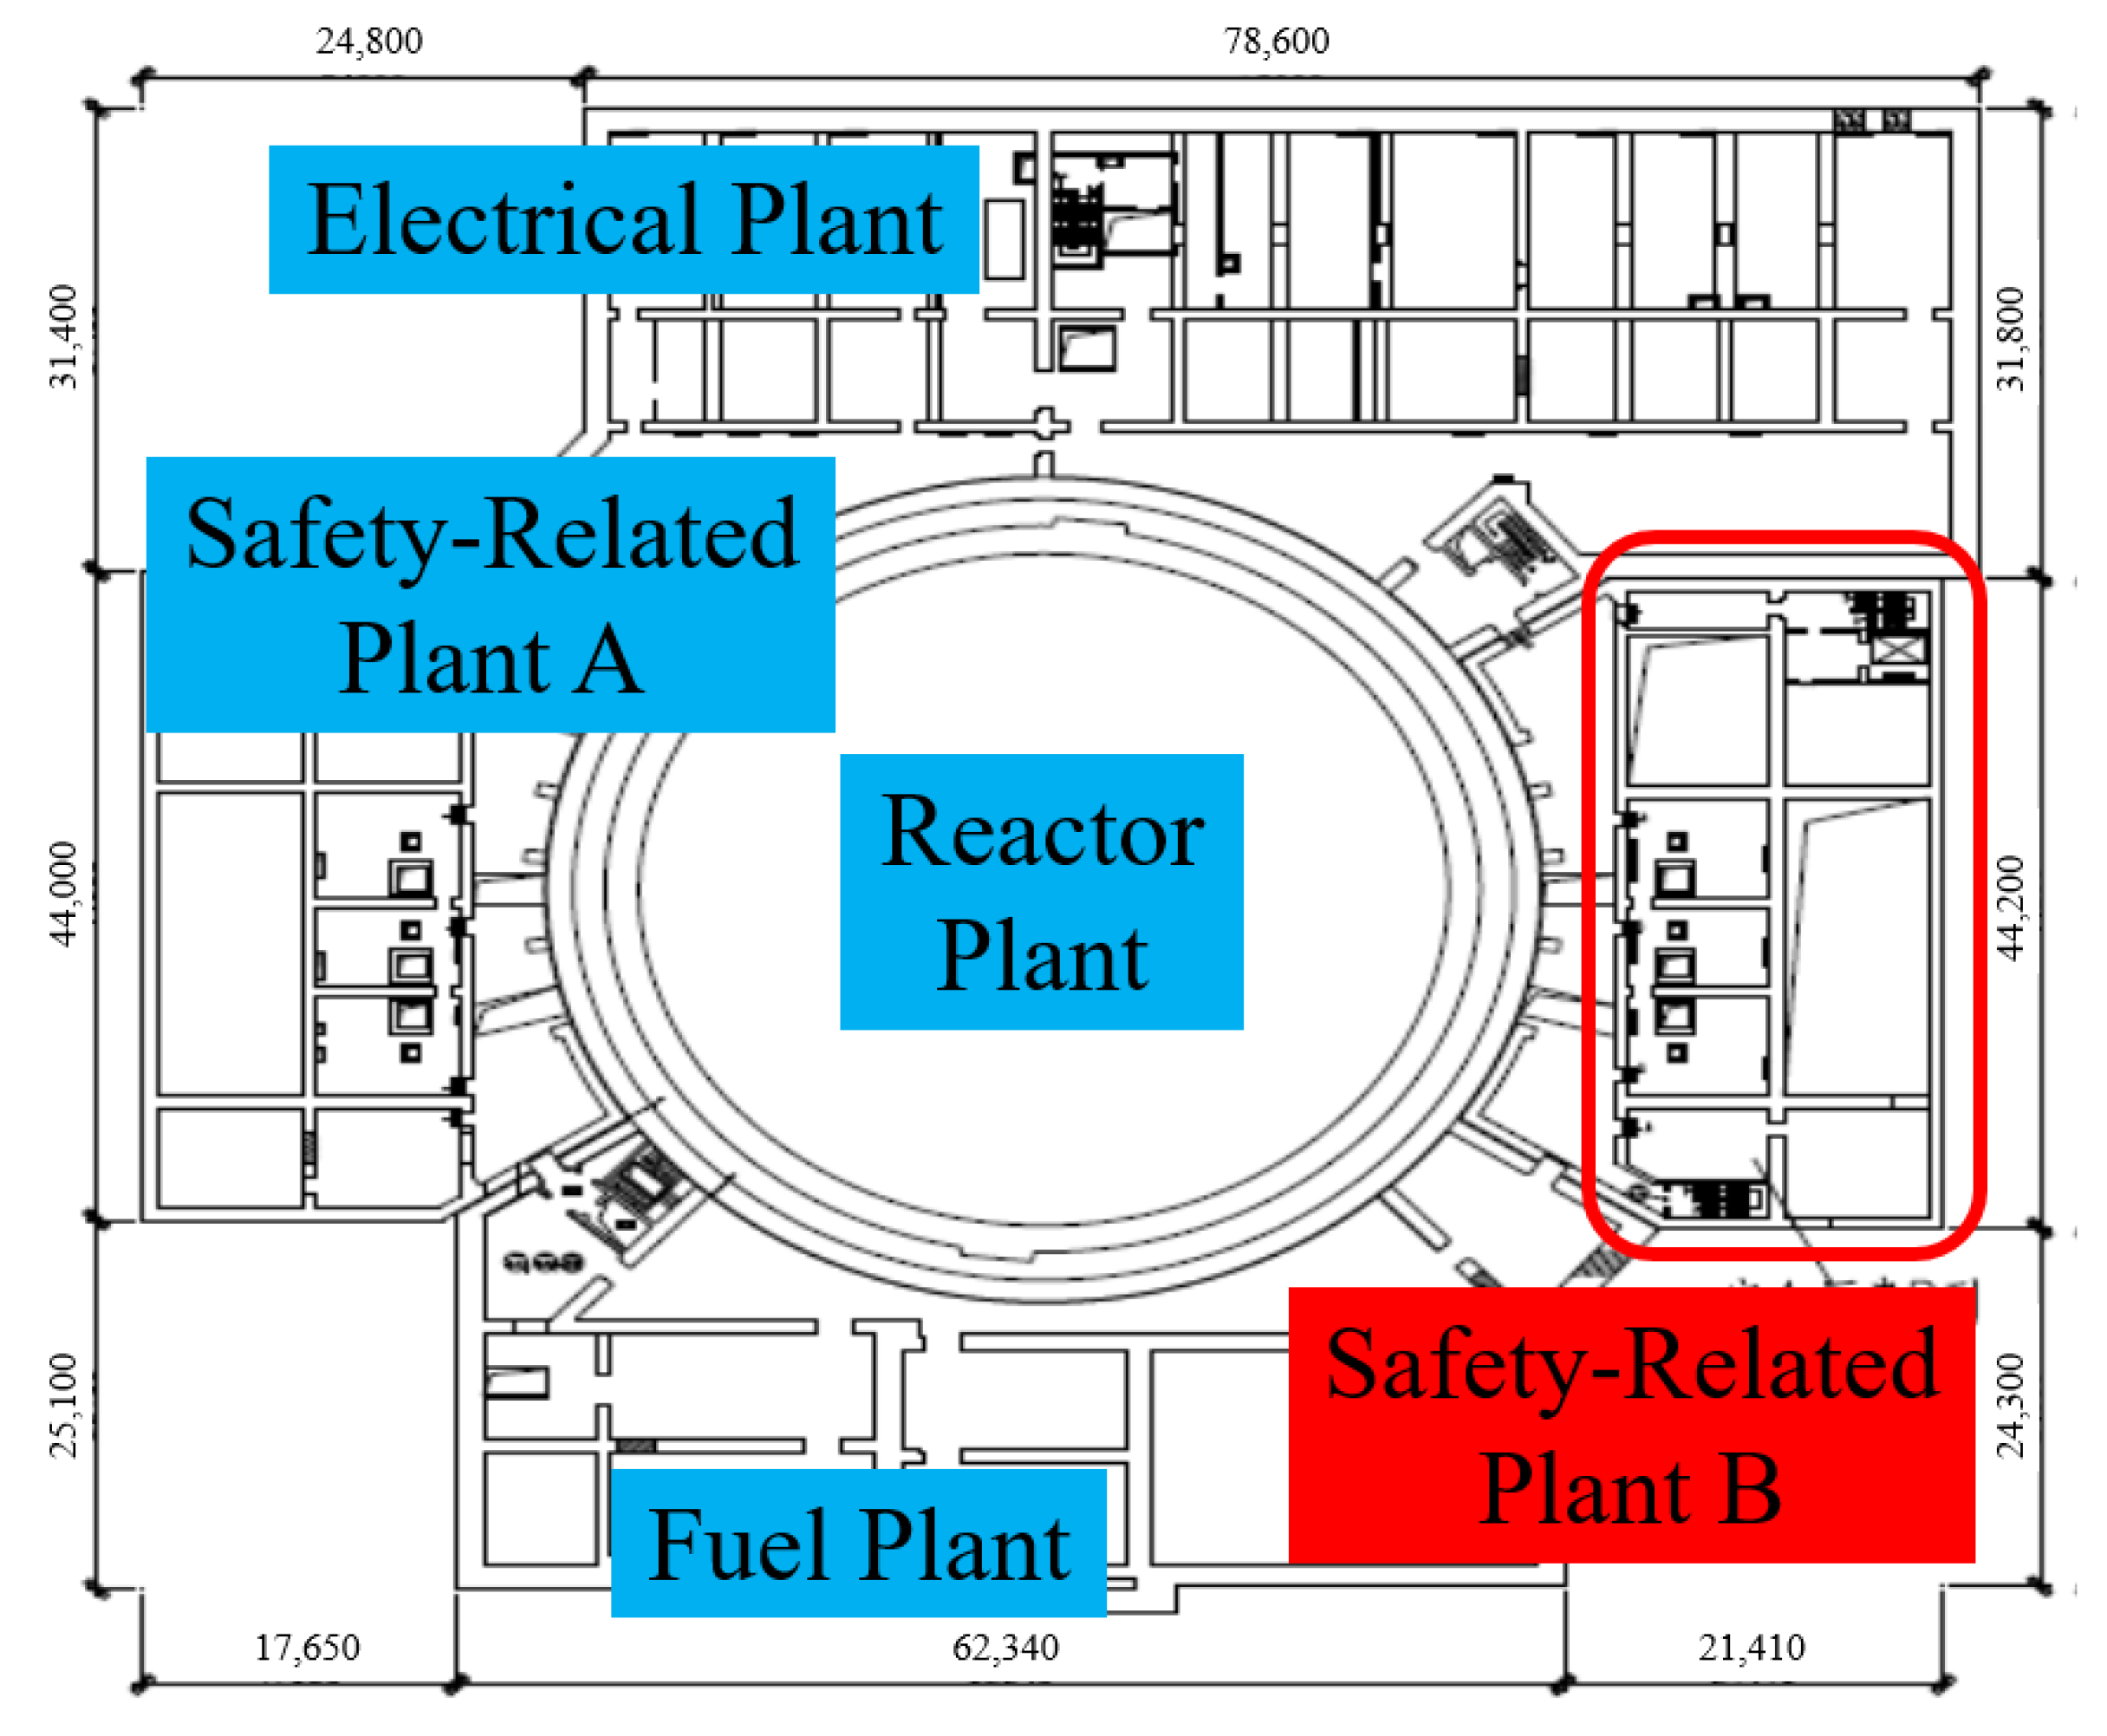
2.1. Background of the Project

The study subject in this paper is a third-generation nuclear island plant, whose layout is shown in Figure 1, including the reactor plant, fuel plant, electrical plant, safety-related plant, etc. All the nuclear plants above share a raft foundation. This study mainly takes safety-related plant B as the research object, which consists of walls and plates with 10 stories and 40 m in height. The base characteristics refer to the typical soil site in China, and the pile foundation contains rock-socketed piles with a diameter of 1.5 m and a length of 40 m.

2.2. The Shaking Table

The shaking table system used in this experiment is a 5 m × 5 m three-direction, six-degree-of-freedom large-scale seismic simulation shaking table system of the Institute of Engineering Mechanics, China Earthquake Administration. The maximum acceleration input is 2 g, the maximum distance is 0.5 m, and the effective bearing capacity is 30 t.

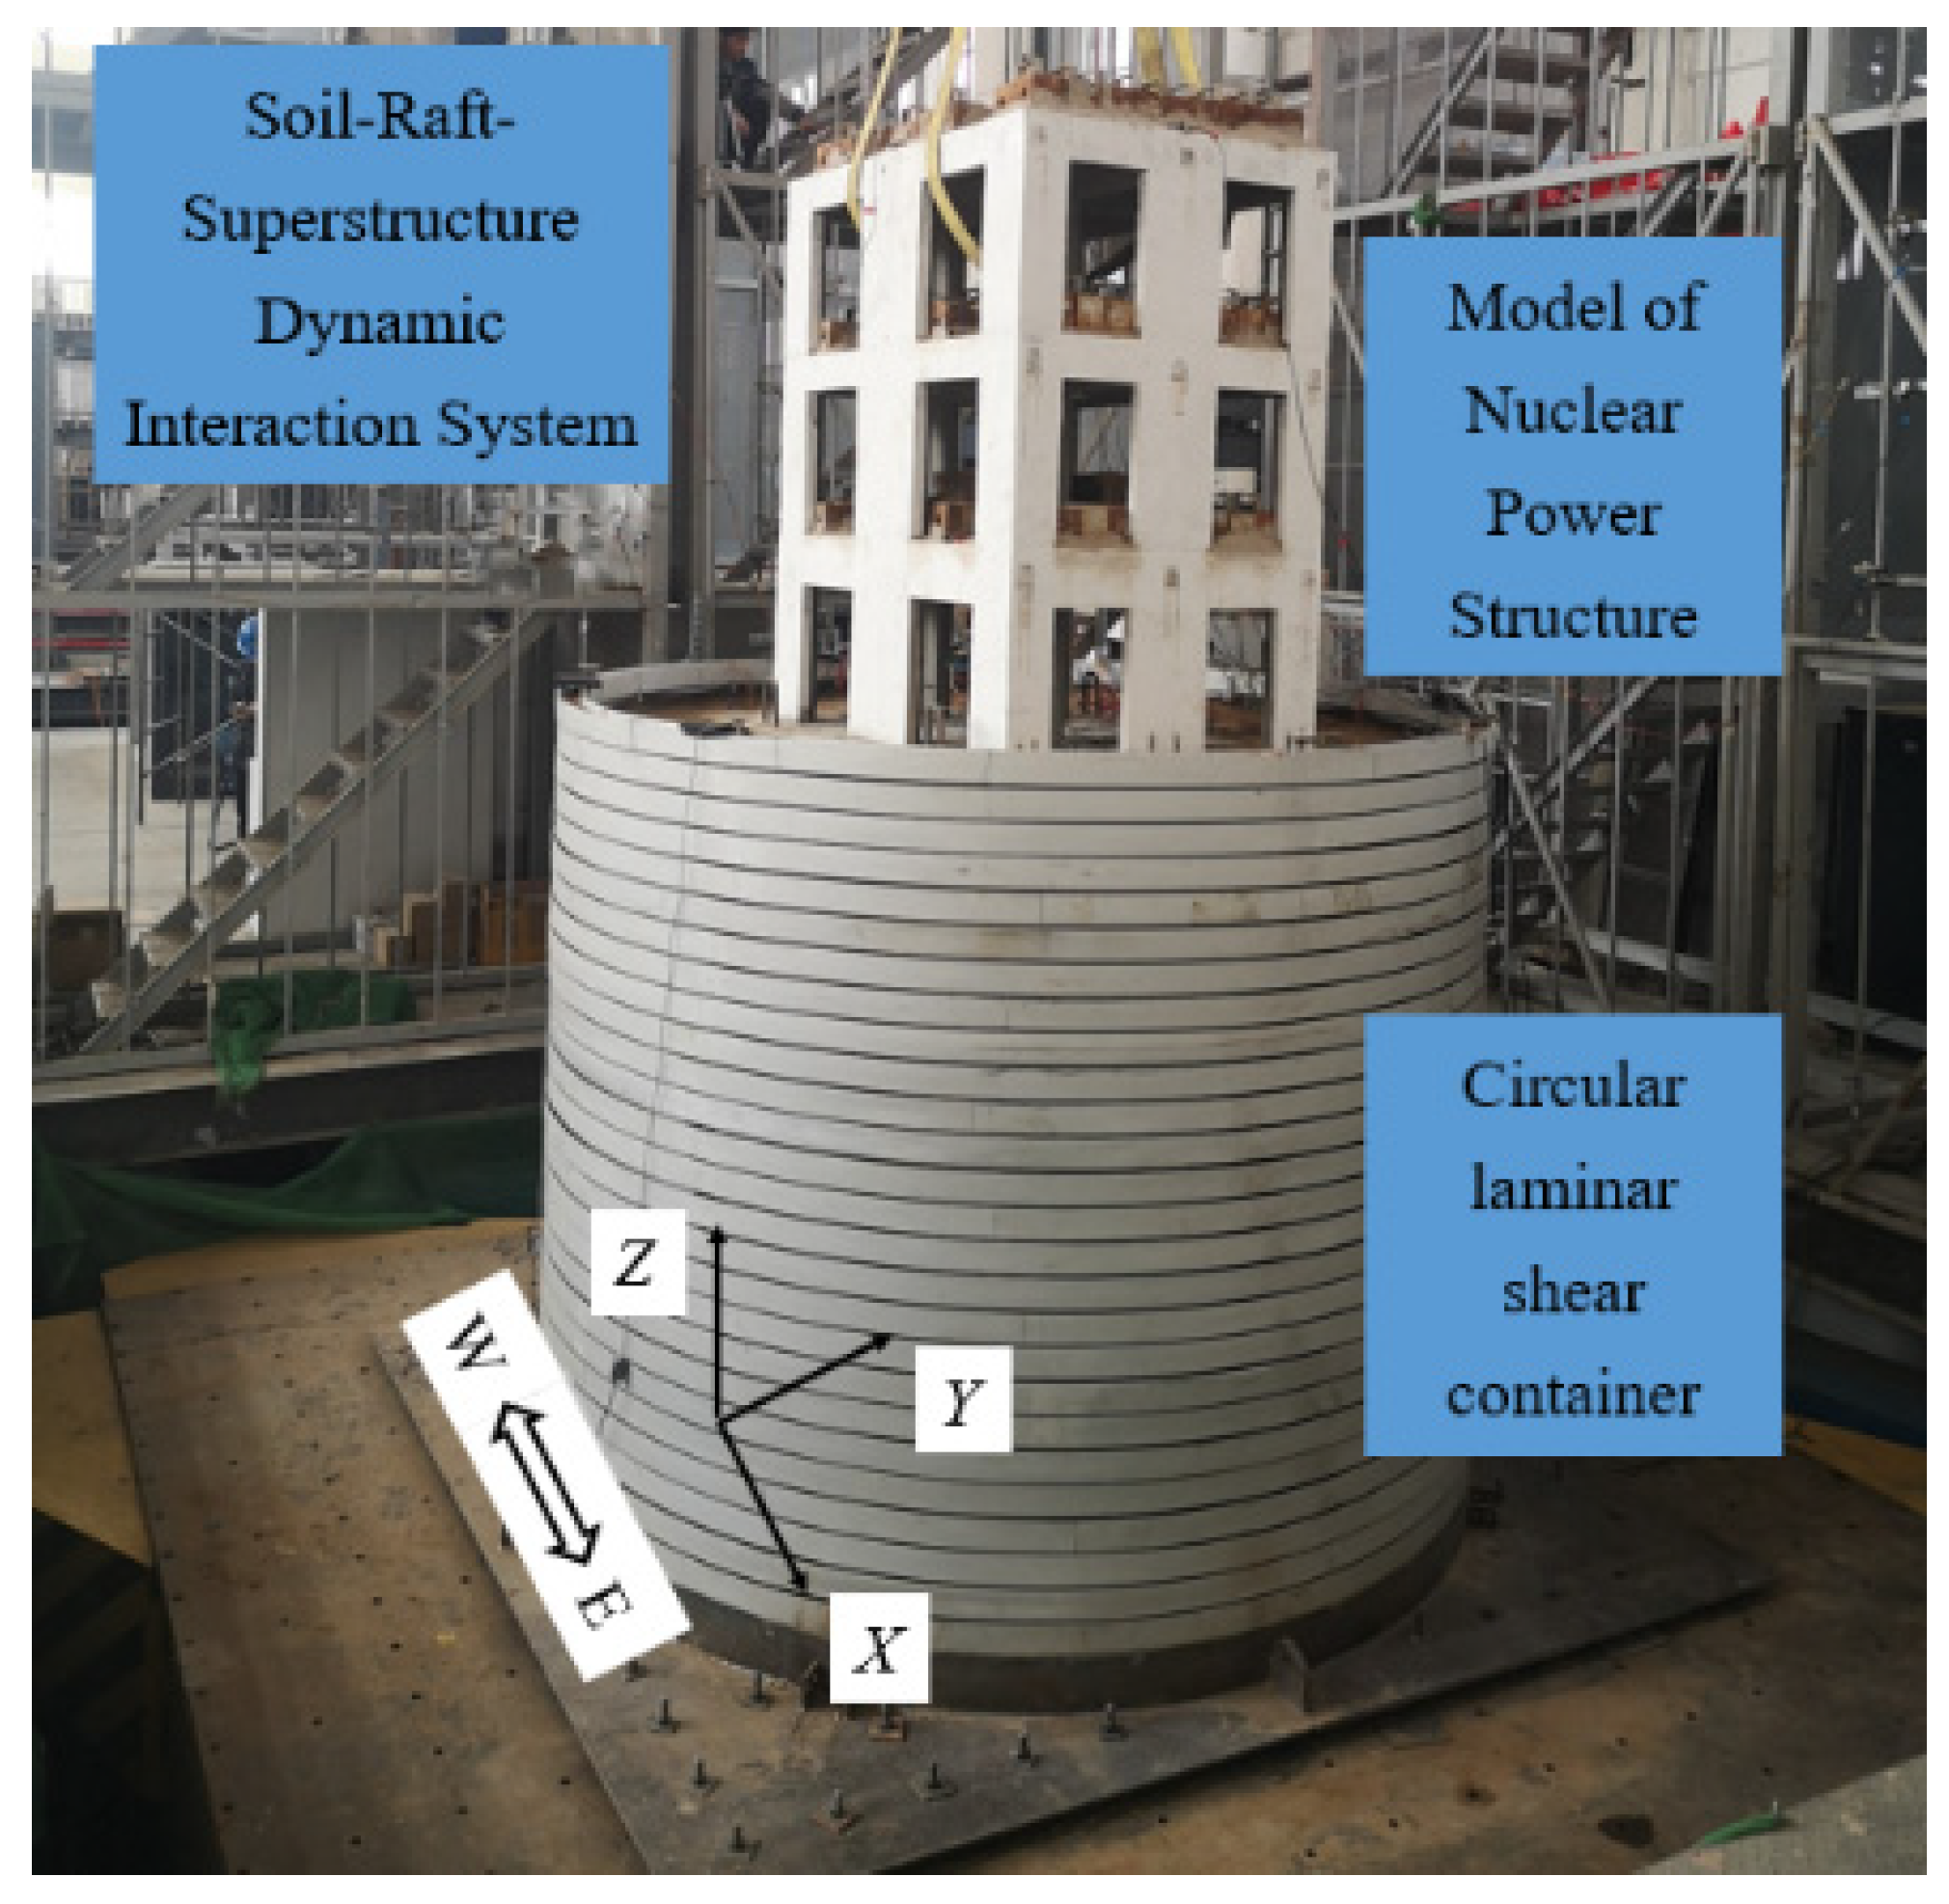
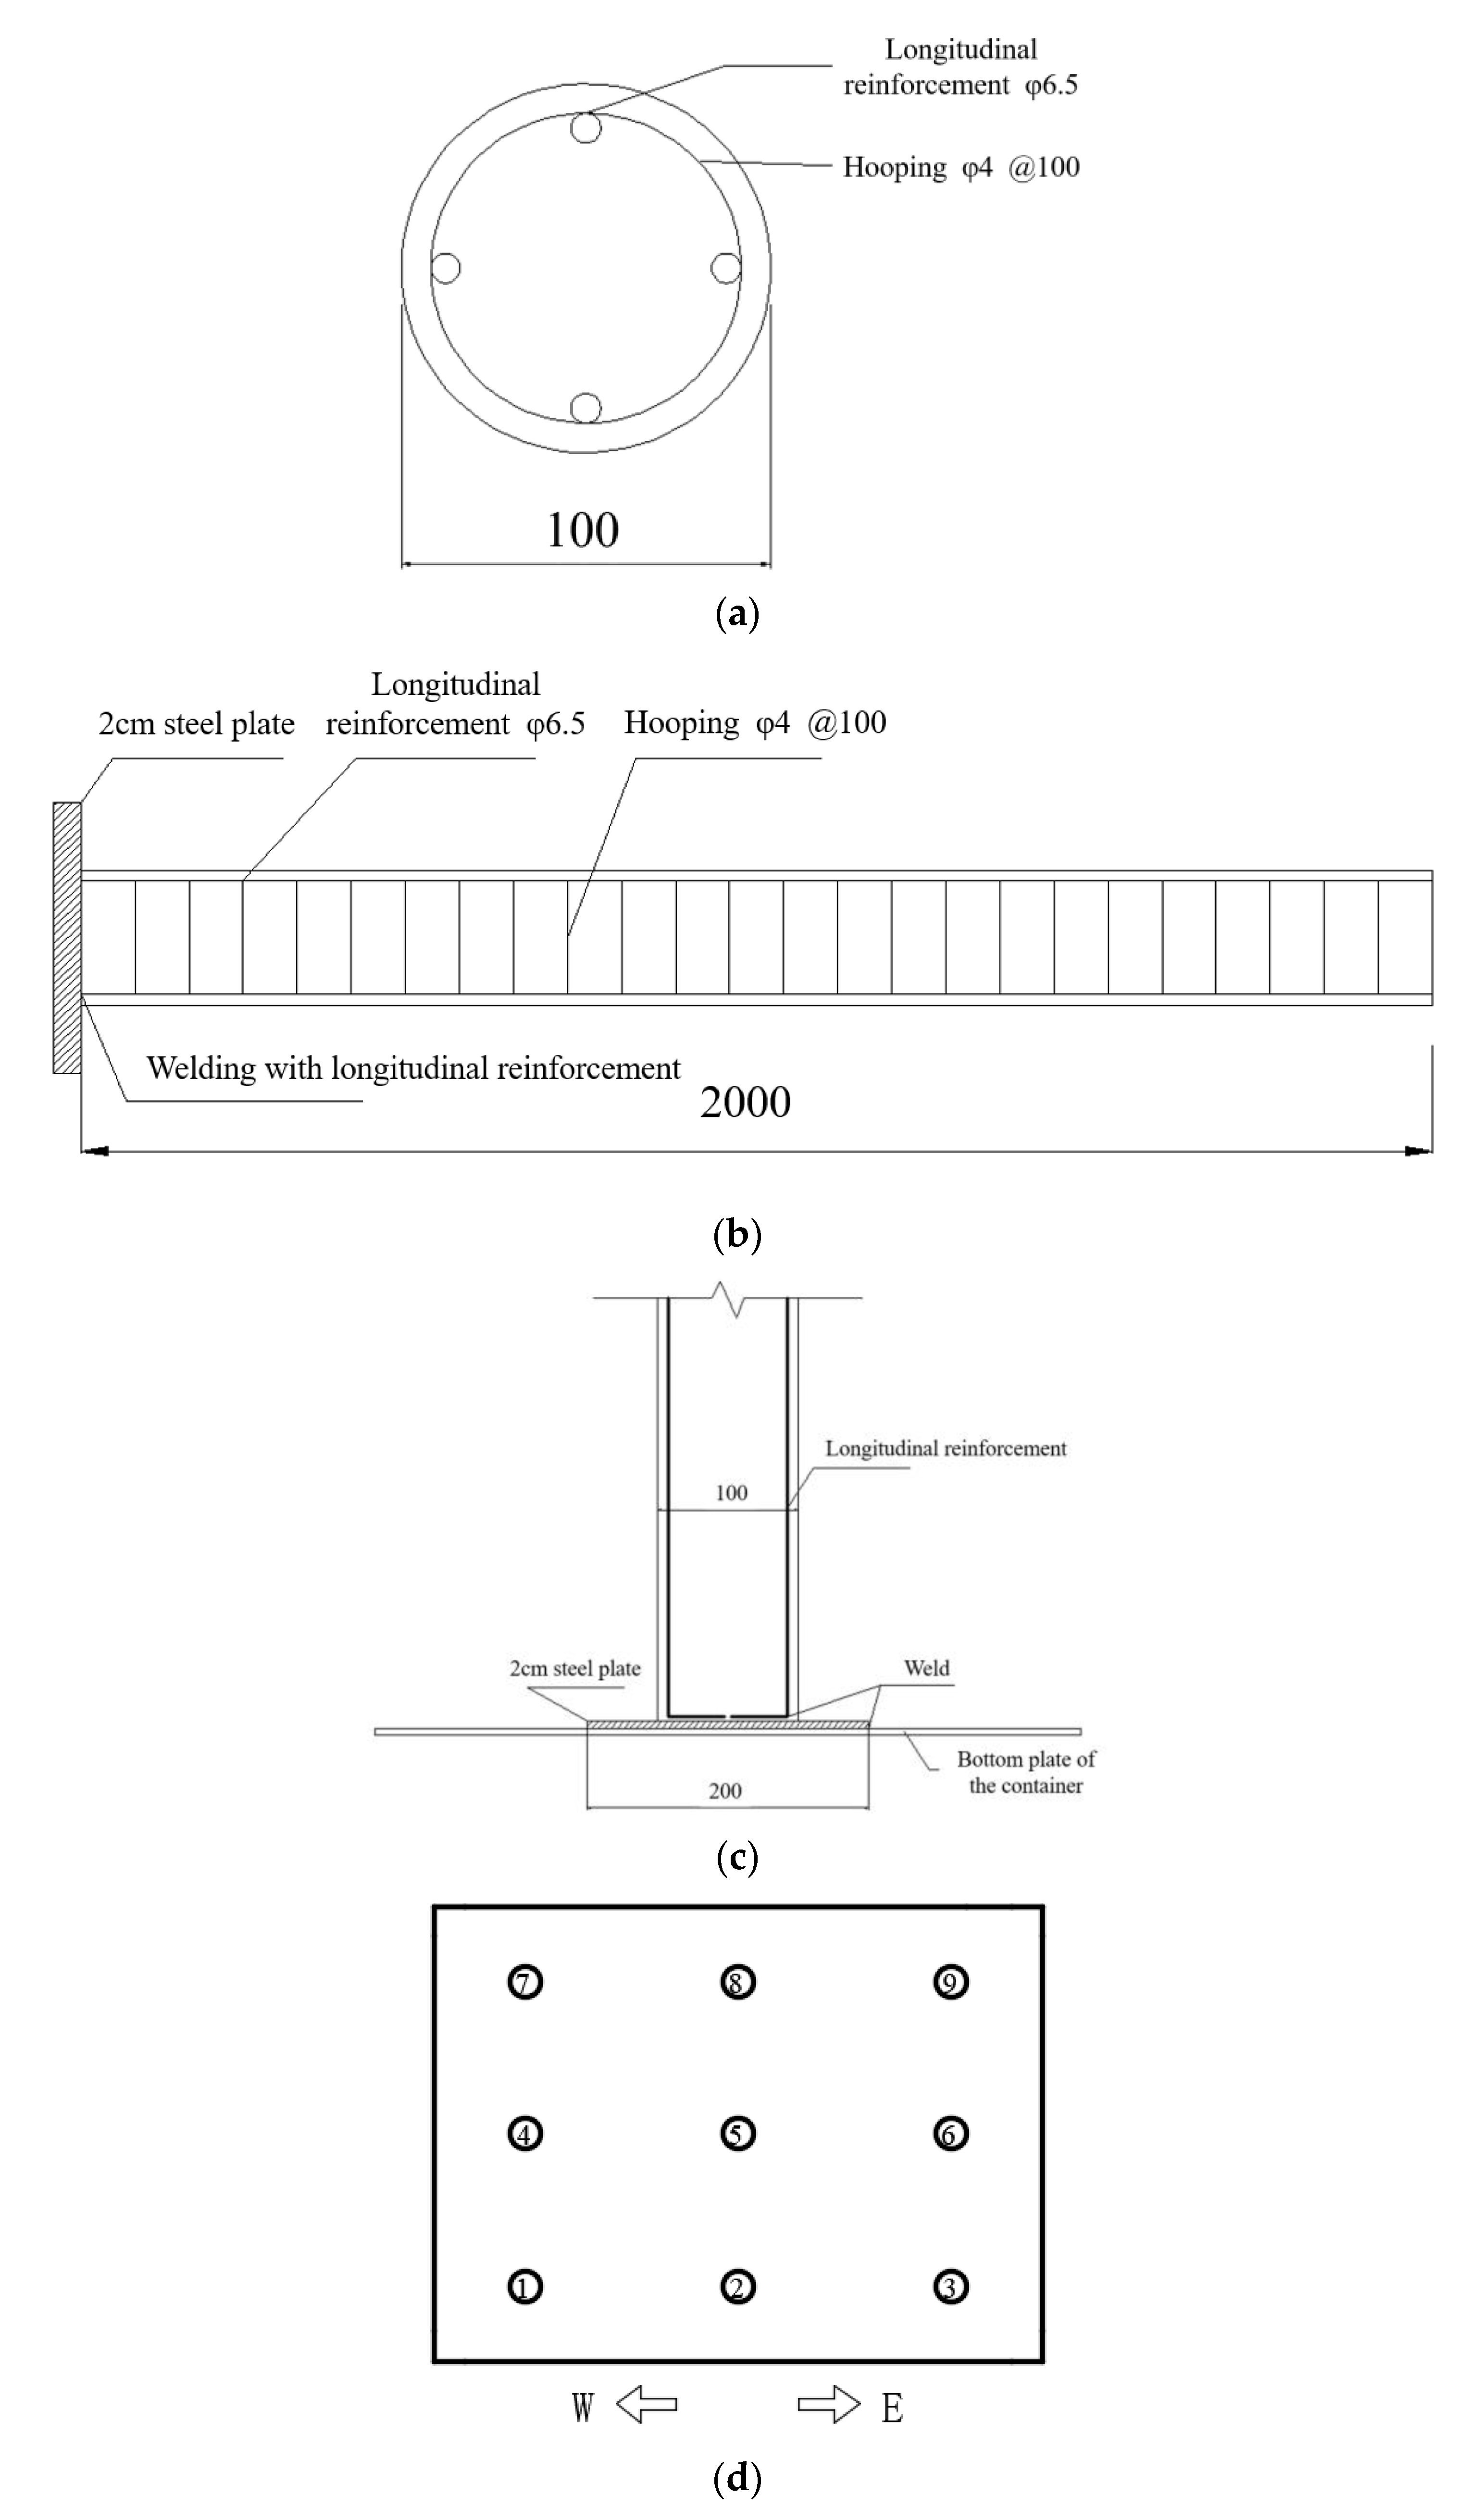
2.3. Annular Layered Shear Box

A self-developed cylindrical laminated shear model box was adopted in the test. The model box is 2.5 m in height and 2.8 m in inner diameter. It is composed of several H-shaped frames. Three-way movable support elements are set between the frames, which can produce relative motion and simulate the shear deformation of the soil during vibration, as shown in Figure 2.

2.4. Design and Modeling of Superstructure

In order to reflect the dynamic characteristics of the prototype structure quantitatively in the dynamic test, the model should meet the similarity relation. The soil–structure interaction model of the large-scale seismic simulation shaking table test includes two parts: the soil mass model and the scaled structure model. In principle, the scaled structure model can approximately satisfy the experimental similarity relation by appropriately applying artificial mass and selecting the fabrication material. However, since the soil is a three-phase dispersion with strong nonlinearity, the shaking table test of the soil is difficult to meet the similarity relation of physical quantities such as modulus and force at the same time under the condition of constant Gravitational acceleration. Therefore, it is impossible to find strict similarity relations in the large-scale shaking table test of soil structure [21]. It is feasible to take the similarity between the safety-related nuclear plant with a pile or raft foundation and the prototype structure into reasonable consideration in the design of the model. However, due to the difficulty in meeting the similarity relation of the soil, the practical significance of this approach is limited. Based on this, various factors are taken into comprehensive consideration to design the experimental model, such as the size and upper load limit of the shaking table, the size of the soil container, and the relation between the natural frequencies of the safety-related nuclear plant model and the prototype (the ratio of the two is preliminarily determined to be 4:1), and the final determination is that the length of the structure model is 1.6 m, the width is 1.1 m, and the total height is 1.85 m. It is designed as a three-layer building; the height of the first layer is 0.65 m, and both the second and third layers are 0.60 m. The model is made of microconcrete. The concrete strength grades of the model structure and the floor are C30 and C40, respectively. The thickness of the walls and floors is 40 mm and 30 mm, respectively. The reinforcement is made of two-direction double-row galvanized iron wire mesh with a diameter of 2 mm and a grid spacing of 10 mm.
In order to facilitate the connection between the superstructure and the pile cap, two test models were designed in total for the shaking table test of the raft and pile group foundation. The baseplate thickness of the superstructure with the raft foundation model is 300 mm, which is also used as the raft foundation. The baseplate thickness of the superstructure with the pile group foundation model is 150 mm, which is connected with the pile cap (with a thickness of 150 mm) by high-strength screws. The length and width of the superstructure baseplates in both test models are 2.0 m and 1.5 m, respectively, and the only difference is the thickness of the baseplates. The natural frequencies of the safety-related plant B and two experimental models are shown in Table 1. The ratios of natural frequencies between the models and the prototype in the X and Y directions are close to 4:1, which meets the design requirements. A model of the nuclear power safety-related plant with a raft foundation is shown in Figure 2.

2.5. Model of Soil Mass

According to the difference in shear wave velocity, the base soil is classified in the Code for Seismic Design of Buildings (GB50011-2010) [22]. The shear wave velocity ranges of soft soil, medium soft soil, medium hard soil, and hard soil are less than 150 m/s, 150 m/s~250 m/s, 250 m/s~500 m/s, and greater than 500 m/s, respectively. In addition, the Code for Seismic Design of Nuclear Power Plants (GB50267-2019) [23] holds that soil mass with a shear wave velocity of less than 300 m/s can be regarded as a relatively weak base. Therefore, the classification limit for medium hard soil and hard soil bases of nuclear structures can be changed from 500 m/s to 300 m/s. Considering that the pile in the shaking table test model is made of fine aggregate concrete, the measured elastic modulus is about 22 GPa, while the elastic modulus of ordinary C30 concrete is about 30 GPa, and the ratio of the two is about 0.7, it can be calculated that the ratio of shear wave velocity is about 0.8 when the density and Poisson ratio are close. As a result, in the shaking table test of this paper, the shear wave velocity range of the aforementioned different types of soil needs to be reduced by 0.8 times to obtain the shear wave velocity range for the classification of nuclear structure subsoil that can match the pile group foundation in the model. The shear wave velocity ranges of soft soil, medium soft soil, medium-hard soil, and hard soil base after reduction are less than 120 m/s, 120~200 m/s, 200~240 m/s, and greater than 240 m/s, respectively.
The ordinary silted clay and medium-fine sand were mixed according to a mass ratio of 2:1 and then formed in the soil container when preparing the soil mass model in this experiment. The filling height was 2.3 m, and manual compaction was performed after each 100 mm filling to ensure the uniformity of the soil. The average density of the soil measured by the cutting ring method is 1.80 g/cm3, and the shear wave velocity of the soil measured by the resonance column test method is 213 m/s. It can be judged that this is a medium-hard soil base according to the shear wave velocity range of different types of subsoil discussed above.

2.6. Model of Pile Group Foundation

The 3 × 3 arrangement of 9 foundation piles is adopted, and the net distance of foundation piles in the east–west and north–south directions is 0.6 m and 0.4 m, respectively. The foundation pile is a circular pile with a diameter of 100 mm and a length of 2 m, of which size and reinforcement are shown in Figure 3a,b, and the bottom steel plate is welded with the bottom of the soil container to simulate the rock-socketed end bearing pile, as shown in Figure 3c. The pile head and cap are poured integrally. The diagram of the pile group arrangement is shown in Figure 3d, where the circles with numbers represent the piles.

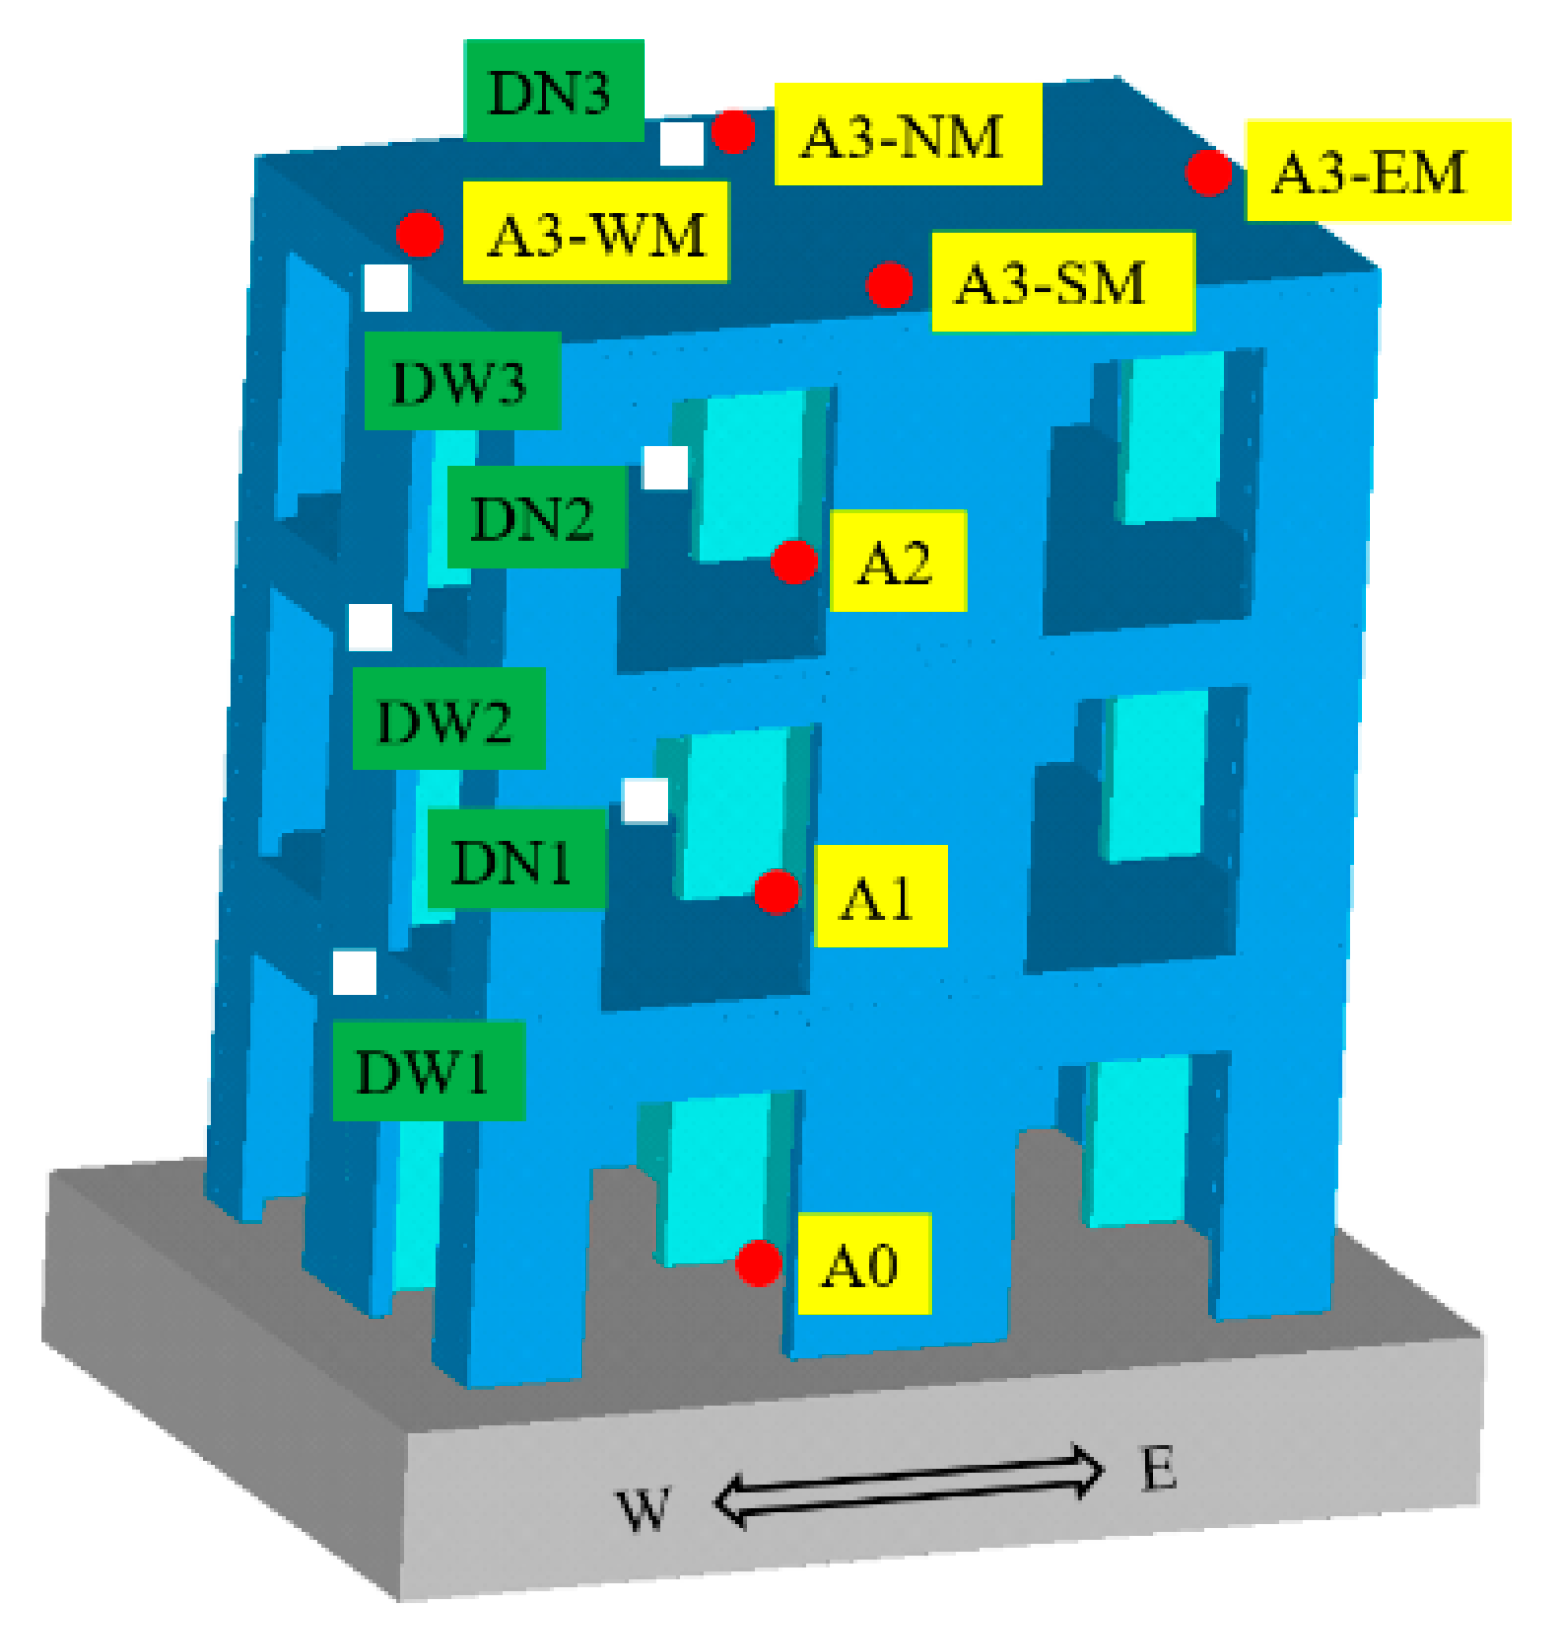
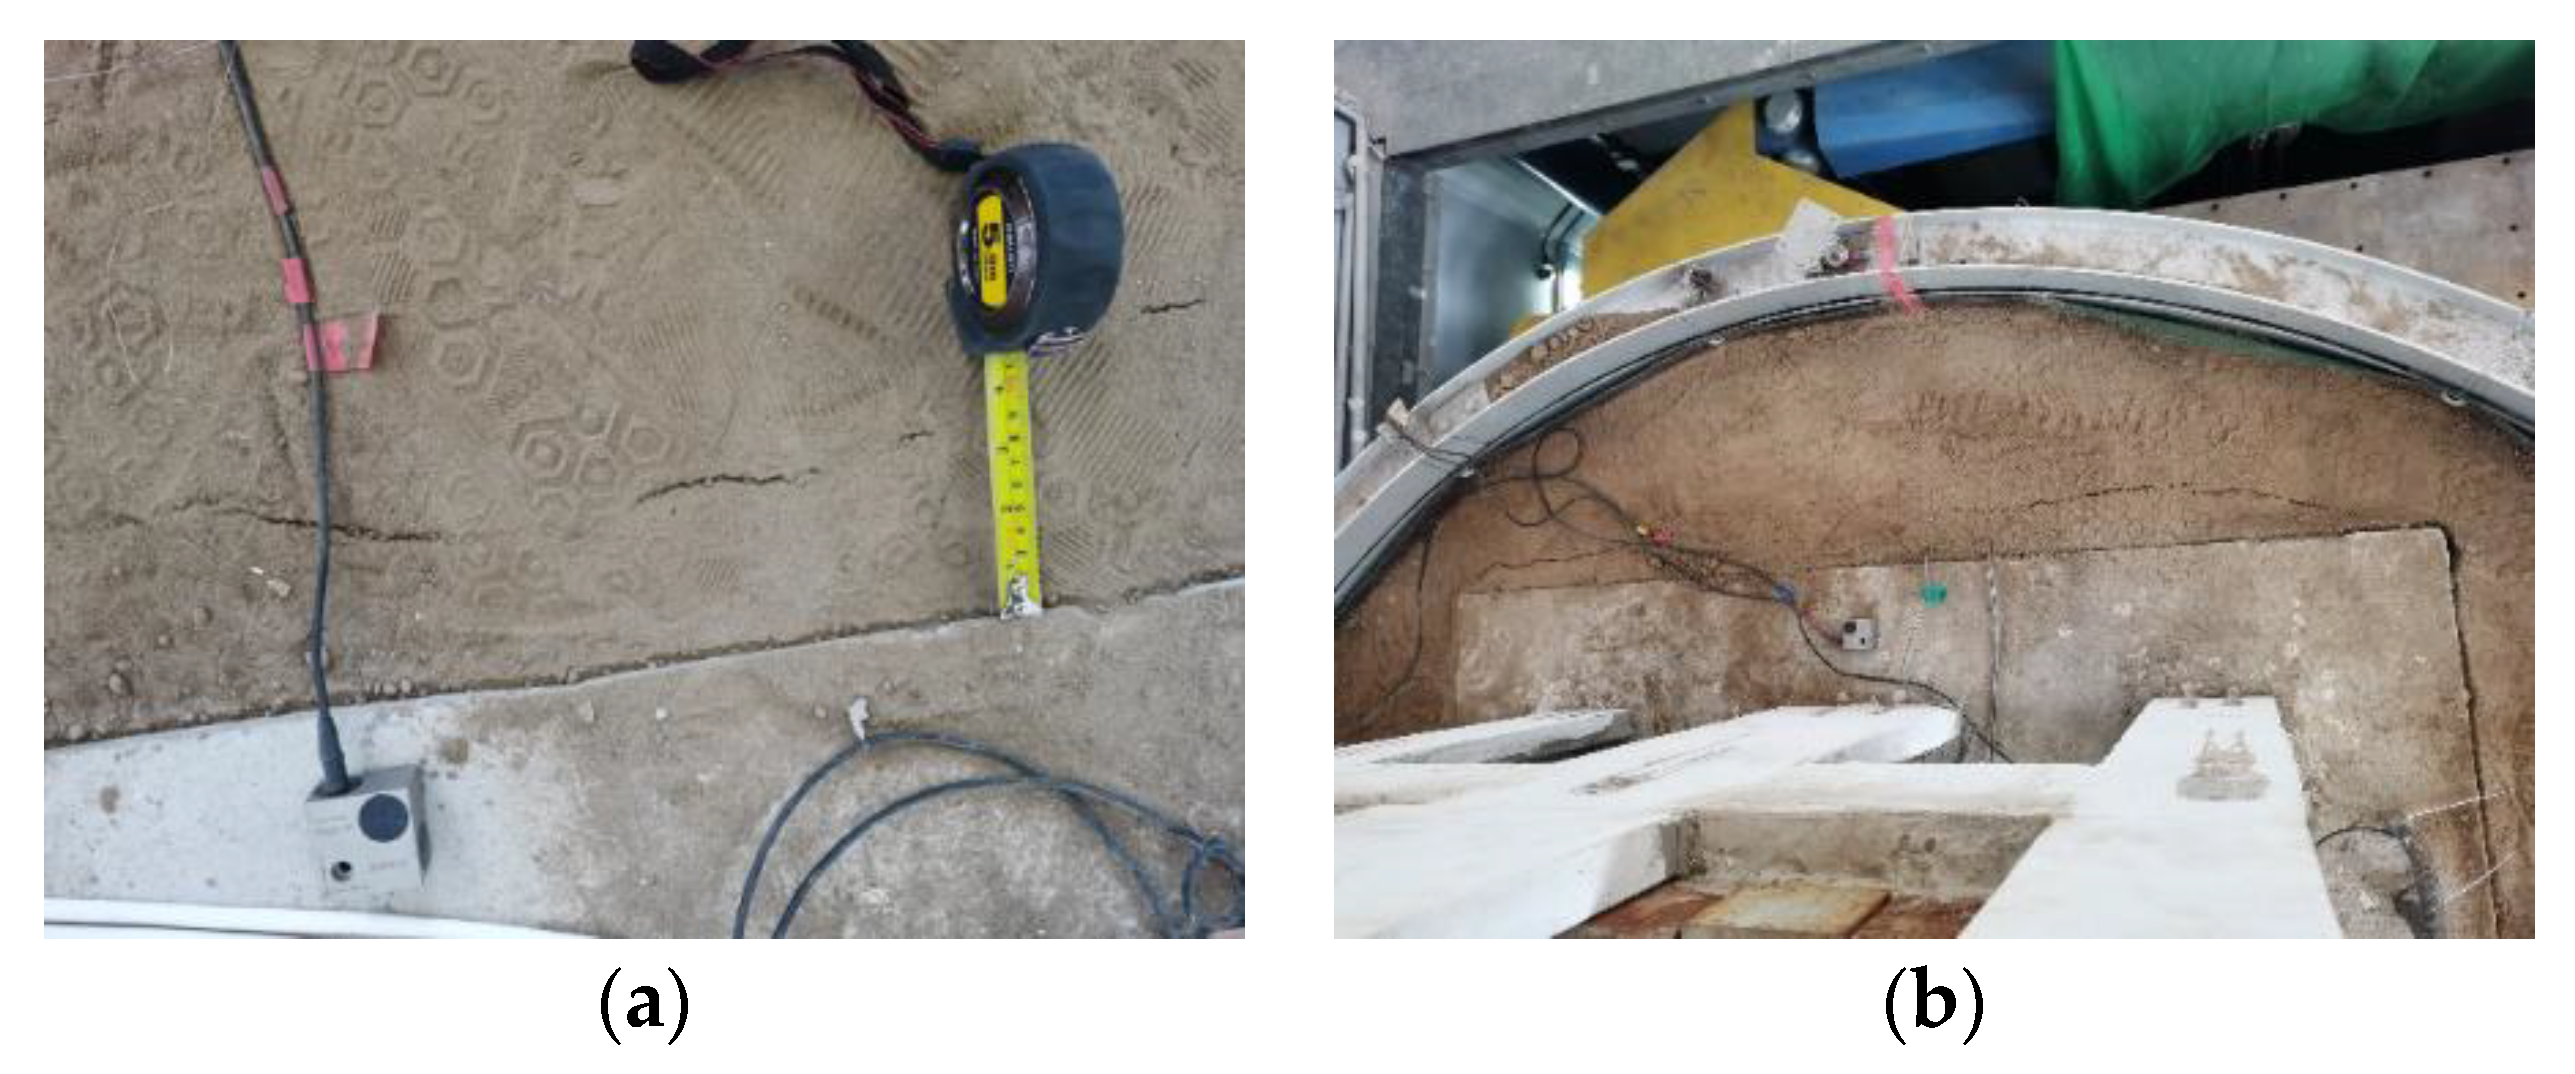
2.7. Instrumentation

Since it is the dynamic response of the upper safety-related plant structure in different seismic motion input directions and different foundation conditions that is compared in this paper, only the monitoring sites of three-direction acceleration sensors and draw-wire displacement sensors arranged in each layer of the superstructure are explained. The layout of the sensors is shown in Figure 4, where the red circle and the white rectangle represent the acceleration and displacement monitoring sites, respectively. Acceleration sensors are arranged at the center of the upper surface of the floor in each layer of the structure, and the bottom-up numbers are A0~A2. For the analysis of the plant structure’s rocking motion, acceleration sensors are arranged at the midpoints of the eastern, western, southern, and northern edges of the structure, numbered A3-EM, A3-WM, A3-SM, and A3-NM, respectively. Monitoring sites of draw-wire displacement sensors are arranged at the midpoint of the western and northern edges of the top of each layer in the structure, and the bottom-up numbers are DW1~DW3 (western side) and DN1~DN3 (northern side).

2.8. Scheme of Dynamic Load Input

In the shaking table test, artificial acceleration time histories and actual strong earthquake records are generally selected as input motions for the test model. So, the artificially synthesized seismic motion according to the RG1.60 response spectrum commonly used in the United States nuclear power design (hereinafter referred to as RG1.60 seismic motion) and the two natural seismic motions, Landers and Chichi, are applied in the test. The normalized acceleration time history and Fourier amplitude spectrum of input seismic motions are shown in Figure 5.
After amplitude modulation of the selected seismic motions to 0.05 g, 0.10 g, and 0.20 g, they are input into the test model along only one direction (X) and three directions at the same time (X, Y, and Z, see Figure 2). When the motions were input in three directions simultaneously, the amplitude ratio of acceleration in the X, Y, and Z directions is 1:0.85:0.65 [22]. The graded loading increases with the amplitude mentioned above in the test. In addition, to get the natural vibration characteristics of the model at different stages of the test, white noise is input before and after all levels of loading.

3. Analysis of Test Results

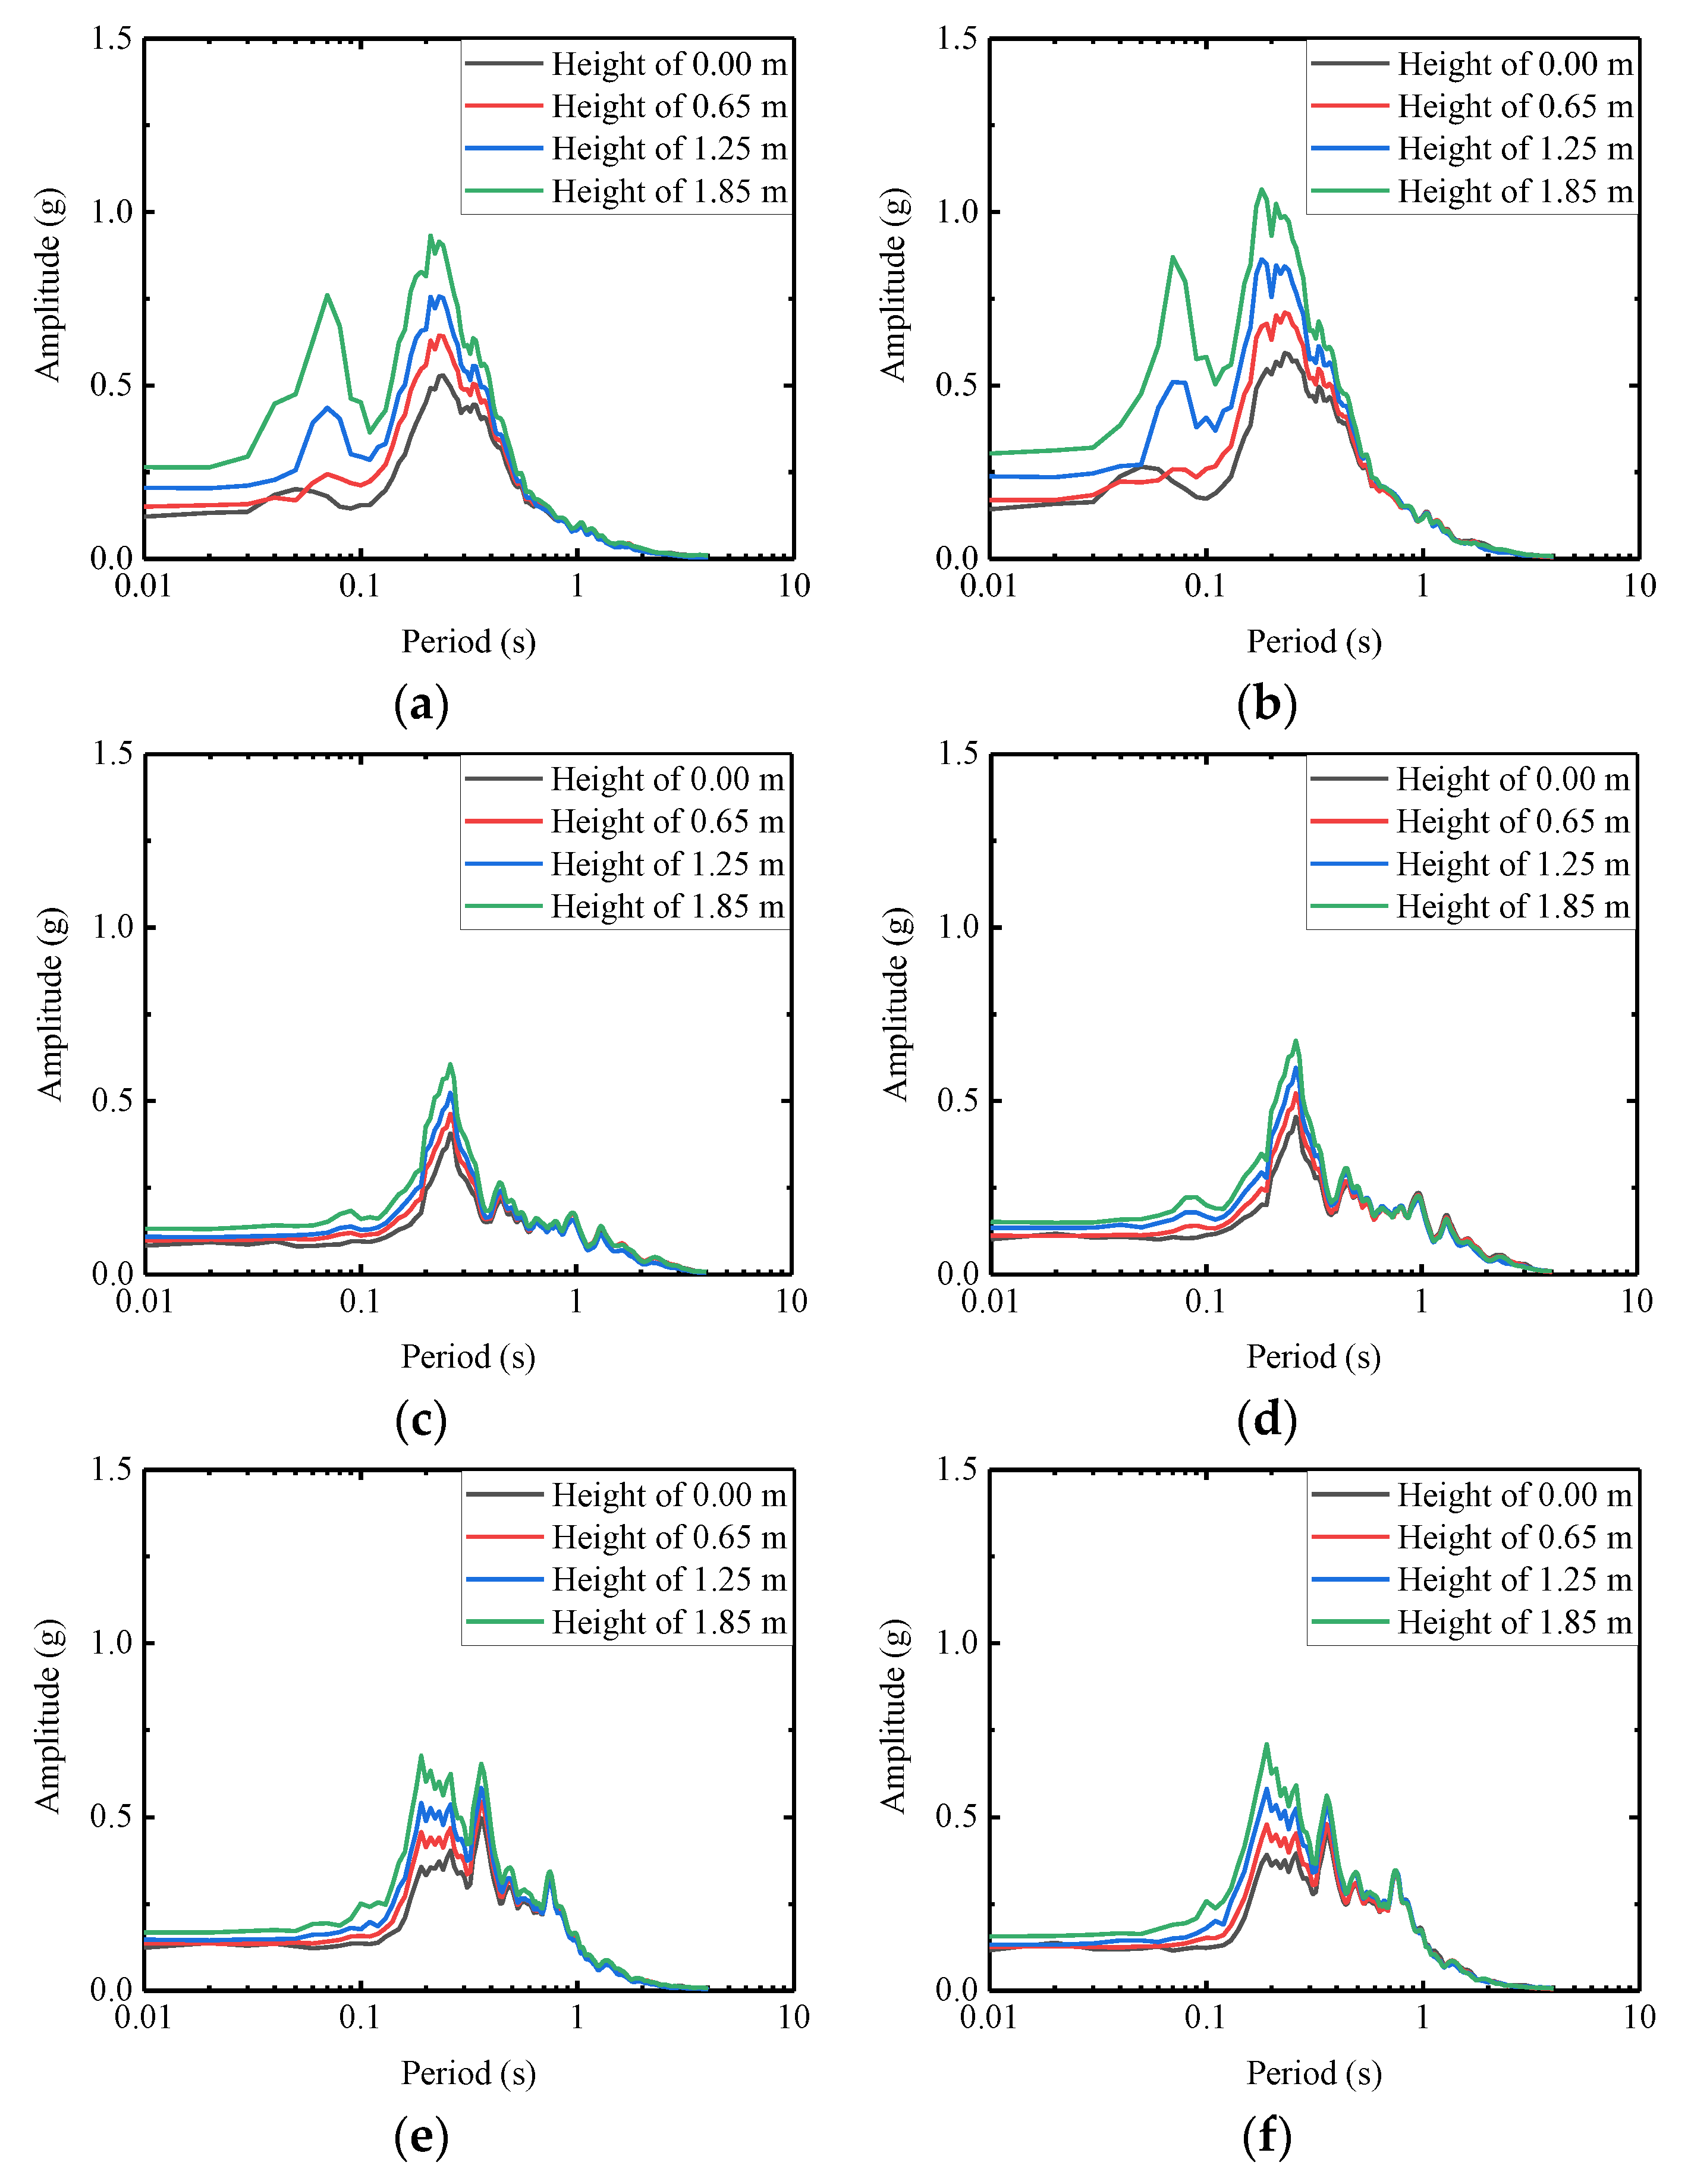
3.1. Experimental Phenomena and Structural System’s Natural Frequency

In the process of most seismic input, the vibration amplitude of the two foundation-structure integral model systems is generally small, the soil container has no obvious relative deformation, and the structural baseplate has good contact with the surrounding soil layer. Only when the amplitude of input is 0.20 g is the structural baseplate separated from the surrounding soil, and cracks appear on the surface of the soil (Figure 6). Except for the obvious vertical rocking motion of the superstructure when the RG1.60 seismic motion is input into the raft foundation model with an amplitude of 0.20 g, the motion of the superstructure in other test cases can be regarded as approximate translation. It can be preliminarily judged that the two test models are intact and were not damaged during the test. The white noise method is used to analyze the frequency of the whole model. The results are shown in Table 2. It can be seen that the natural frequency of the models does not change before and after the test, which is consistent with the experimental phenomenon.

3.2. Test Results Comparison of Seismic Motion Unidirectional and Three Directional Input

For the analysis of the energy transfer law in the process of seismic wave propagation, the Arias seismic motion intensity index Ia [24] is introduced, and its expression is
I a = π 2 g 0 T d a t 2 d t
where a t is the acceleration time history of the monitoring sites, whose unit is m/s2, T d is the duration of the seismic motion, and g is the gravity acceleration (m/s2). The Arias intensity amplification factor is defined as the ratio of Arias intensity in the roof of each layer to the baseplate of the superstructure. Under the action of a unidirectional earthquake, the amplification factor is obtained from the unidirectional acceleration response of each monitoring site. Under the action of a multi-directional earthquake, the horizontal total acceleration response of each monitoring site is obtained along the synthetic direction of horizontal earthquake input (the angle with the X axis is 40°), and the amplification factor is acquired.
The Arias intensity amplification factor curve of the nuclear power plant on the pile group foundation is shown in Figure 7. It can be seen from Figure 7: (1) The Arias intensity of each floor increases with height under unidirectional or multi-directional earthquakes. (2) The amplification factor of each floor decreases with the increase in the input seismic motion amplitude, but the change is small. This is because the safety-related structure is not significantly damaged and is in the nonlinear elastic stage; (3) When the same seismic motion input is unidirectional and three-directional, the amplification factor of each layer of the structure in the unidirectional input case is slightly greater than that in the three-directional input case. The amplification factors at the top of RG1.60 seismic motion along one-way and three-way input are 2.42~3.07 and 2.22~2.85, respectively, of Landers seismic motion are 1.82~1.85 and 1.67~1.76, and of Chichi seismic motion are 1.79~1.93 and 1.65~1.86; (4) The amplification factor of the safety-related plant structure in the case of RG1.60 input is greater than that in the case of Landers and Chichi input. From Figure 5, it can be seen that this is because the main frequency components of Landers and Chichi are below 10 Hz, while RG1.60 still has more components from 10~20 Hz, which is located near the natural frequency of the test models and has a more obvious amplification effect.
The values of Arias intensity at the top of the safety-related structure under unidirectional and multi-directional earthquakes are compared in Table 3. Although the amplification factor of the safety-related structure under multi-directional seismic motion input is smaller than that under unidirectional input, the values of Arias intensity at each layer of the safety-related plant in multi-directional input cases are basically larger than those in horizontal unidirectional input cases. In the condition of three-way input, the Arias intensity values at the top of the superstructure are 0.98–1.58 times those of the same seismic input in a single direction.
Figure 8 shows the floor spectra of the safety-related plant structure with a pile group foundation under a 0.05 g amplitude input case. In cases of unidirectional input, the floor spectra are generated by the one-way acceleration response of each monitoring site. In cases of multi-directional input, the floor spectra are generated by the horizontal total acceleration response along the synthetic direction of horizontal earthquake input (the angle with the X axis is 40°) of each monitoring site. It can be seen from Figure 8 that (1) in the case of any seismic motion input, the shape of the floor spectrum of each floor of the structure is basically the same; only the amplitude is different, increasing with the height; and (2) while the same seismic motion is input along a single direction or a multi-direction, the shape of the floor spectra of the safety-related plant is relatively consistent, and the peak period is generally unchanged.
Figure 9 shows the variation of the Arias intensity values of the rocking motion at the top of the safety-related plant with the input seismic motion amplitude. The solution of the intensity values is as follows: in the condition that the seismic motion is input in the X direction, subtract the average values of the records in the Z direction (as shown in Figure 2) of A4-EM and A4-WM—acceleration sensors on the eastern and western sides at the top of the structure—from the two records separately to obtain two new time histories and calculate the Arias intensity values of the new time histories. Then, the average value of Arias intensity values obtained from new time histories is acquired to represent the intensity of rocking motion. The calculation method for the seismic motion three-direction input condition is similar, except that the average value recorded by four sensors at the top is subtracted. The intensity values in the east–west and north–south directions are calculated separately using the above method and then summed up for the total intensity value.
It can be drawn from Figure 9 that when the selected three seismic motions are input into the test model with different amplitudes, the rocking motion at the top of the plant model, when the seismic motion is input from three directions, is more violent than that when the seismic motion is input from the X direction, and the Arias intensity value is about 1.14~1.62 times that when the seismic motion is input from the X direction. According to Table 2, the Arias intensity value of the rocking motion of the pile-foundation structure model accounts for about 1.3% to 4.0% of the horizontal motion at the same position. In addition, though the duration of the RG1.60 seismic motion is the shortest of the three input motions, the Arias intensity value of the rocking motion at the top of the structure is the largest, which indicates that the safety-related plant is more sensitive to high-frequency seismic motion input.
Figure 10 is used to illustrate the displacement calculation basis of the three-way input condition of seismic motion in this experiment. When the test model generates displacement along the direction of the actual movement in Figure 10, the actual displacement ① at the monitoring site of the draw-wire displacement sensor is larger than the measured displacement ② in this direction. However, since the actual displacement ③ in the other horizontal direction is much smaller than the length of the wire of the displacement sensor, it can be approximately considered that the angle between the wire before and after the motion is very small, and the actual variation of the wire length (obtained by the initial length of the wire minus ②) is basically the same as the variation of the same seismic motion input along the single direction (obtained by the initial length of the wire minus ①). It can be found that ① is basically the same as ②, and the measured ② can be used to replace the real ① in the experiment. Because, in fact, ① is greater than ②, this practice will lead to a smaller measured value of structural displacement in the three-dimensional seismic motion input condition. Figure 11 shows the displacement amplitude at different heights of the nuclear power plant when the amplitude of input seismic motion is 0.05 g. Due to the large stiffness of the plant model, the displacement amplitude at different heights in the same test condition is generally the same; the interlayer displacement of the structure is small and can be approximately regarded as a translation of a rigid body. When the seismic motion is input from three directions, the horizontal displacement amplitude is about 1.07~1.19 times that of X unidirectional input. As a result of the fact that the displacement measured in the three-way input condition is less than the true value, the difference between the actual displacement value of the three-dimensional input and the one-dimensional input condition is greater.

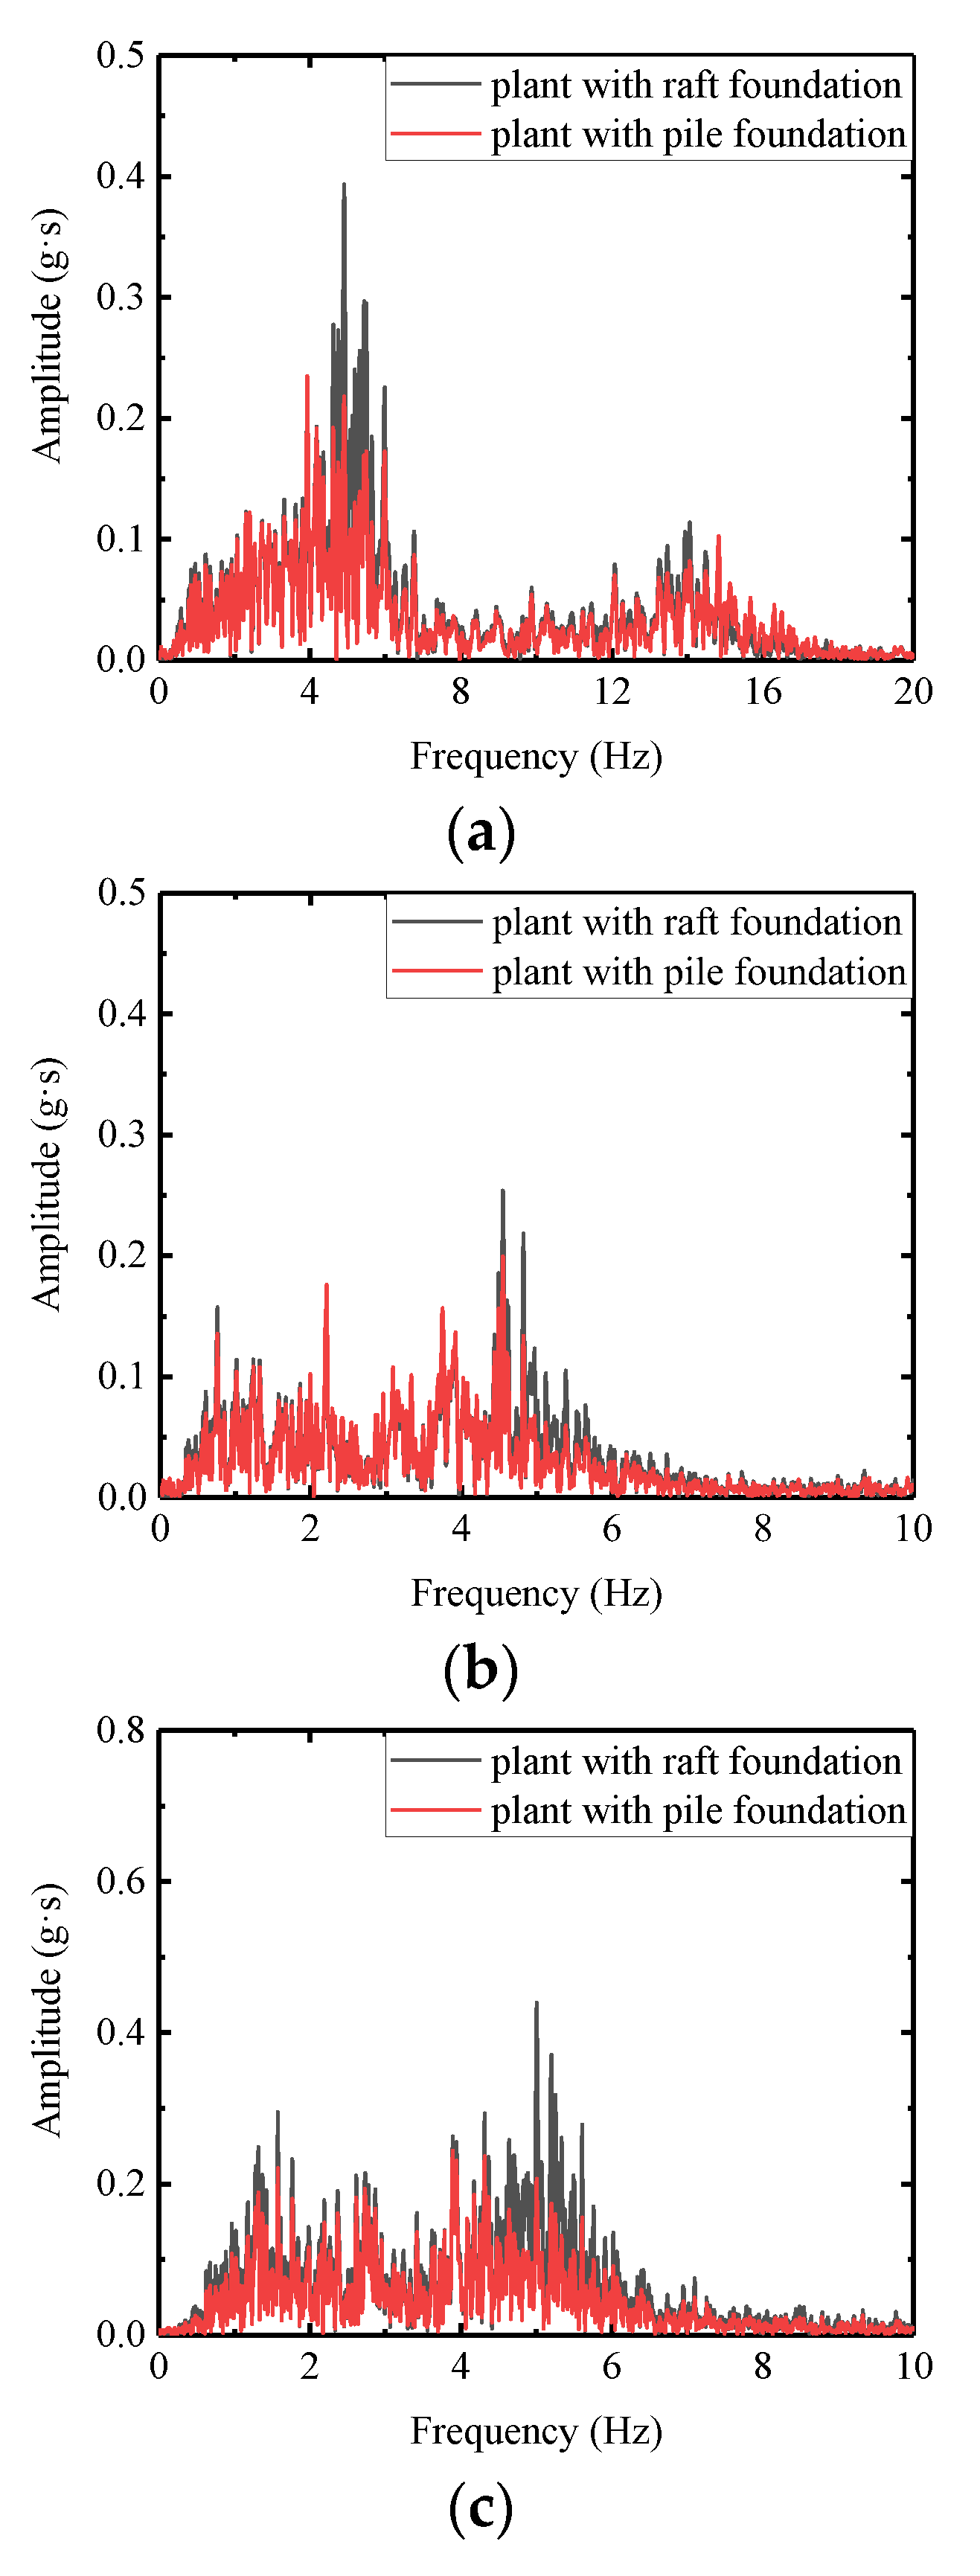
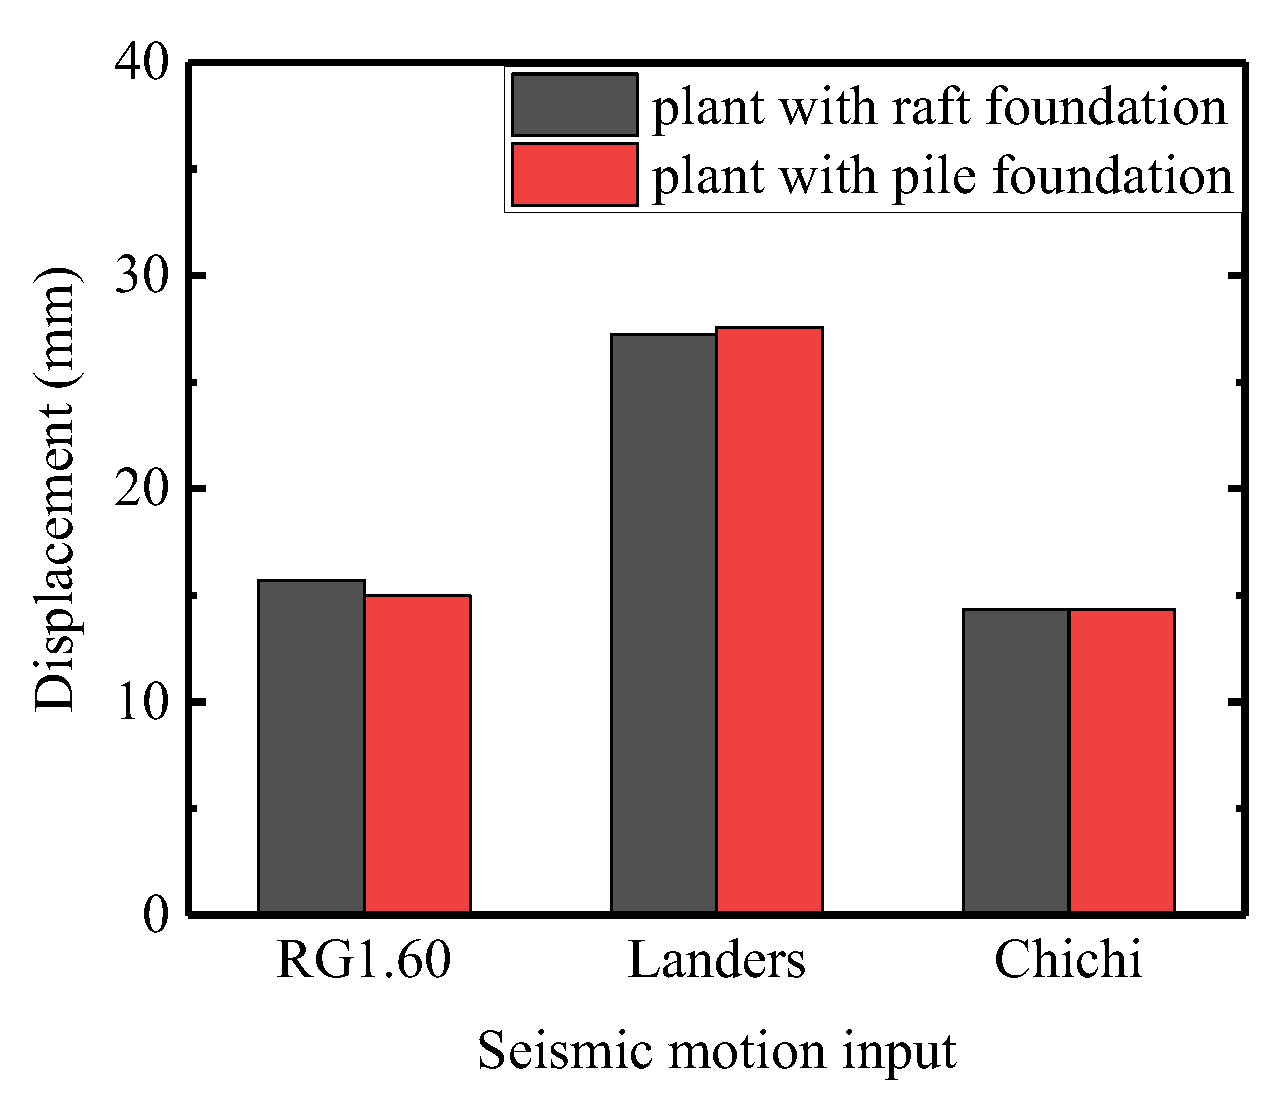
3.3. Comparison of Structures with Different Foundations Test Results

Figure 12 and Figure 13 are the comparison results of the Arias intensity values at each height and the Fourier amplitude spectrum at the top of the nuclear safety-related plant with different foundation forms under 0.05 g amplitude seismic motion input. The maximum Arias intensity appears at the top of the structure model, regardless of the foundation forms. When the pile group foundation is applied, the Arias intensity values at each height of the structure model are smaller than those for raft foundation conditions. While RG1.60, Landers, and Chichi seismic motion input, the Arias intensity values at the top of the structure on pile group foundation are reduced by 41%, 32%, and 48%, respectively, compared with the structure on raft foundation. The shapes of the acceleration Fourier spectra at the top of the plant structure with different foundation forms are similar. However, the amplitude of Fourier spectra at the top of the plant on the raft foundation is larger than that of the plant on the pile group foundation in most frequency bands. This is because the natural frequencies of both the two model systems of plants with different foundation forms are high, and components of the input seismic motions are mainly in the relatively low-frequency zone. The natural frequency of the model system in the case of a pile group foundation is higher than that in the case of a raft foundation. So the difference between most frequency components in the input seismic motions and the natural frequency of the test model is greater in the pile foundation case than in the raft foundation case, and the amplification effect is weakened.
Figure 14 shows the comparison results of Arias intensity values of rocking motion at the top of the plant with raft and pile group foundations. The rocking motion of the raft-foundation structure caused by the three seismic motions selected in the test is greater than that of the pile-foundation structure, which indicates that the pile group foundation is beneficial to reduce the vertical rocking motion of the nuclear safety-related plant. The rocking motion of the plant caused by RG1.60 seismic motion is the most intense.
Due to the large stiffness of the nuclear power plant model, the displacement at each height is basically the same, and only the displacement amplitude at the top of the plant with raft and pile group foundation is given, as shown in Figure 15. It can be seen from Figure 15 that the displacement of the nuclear structure model with two foundation forms is generally the same. This is because the components of displacement response are mainly in the low-frequency zone, which differs significantly from the high natural frequencies of nuclear power structure systems.

4. Conclusions

In this paper, based on the shaking table test of a subsoil-safety-related nuclear structure system on a non-rock site, the acceleration and displacement responses of a safety-related nuclear structure with a pile group and raft foundation under horizontal unidirectional and multi-directional seismic motion input are compared. The following three conclusions can be drawn:
(1)
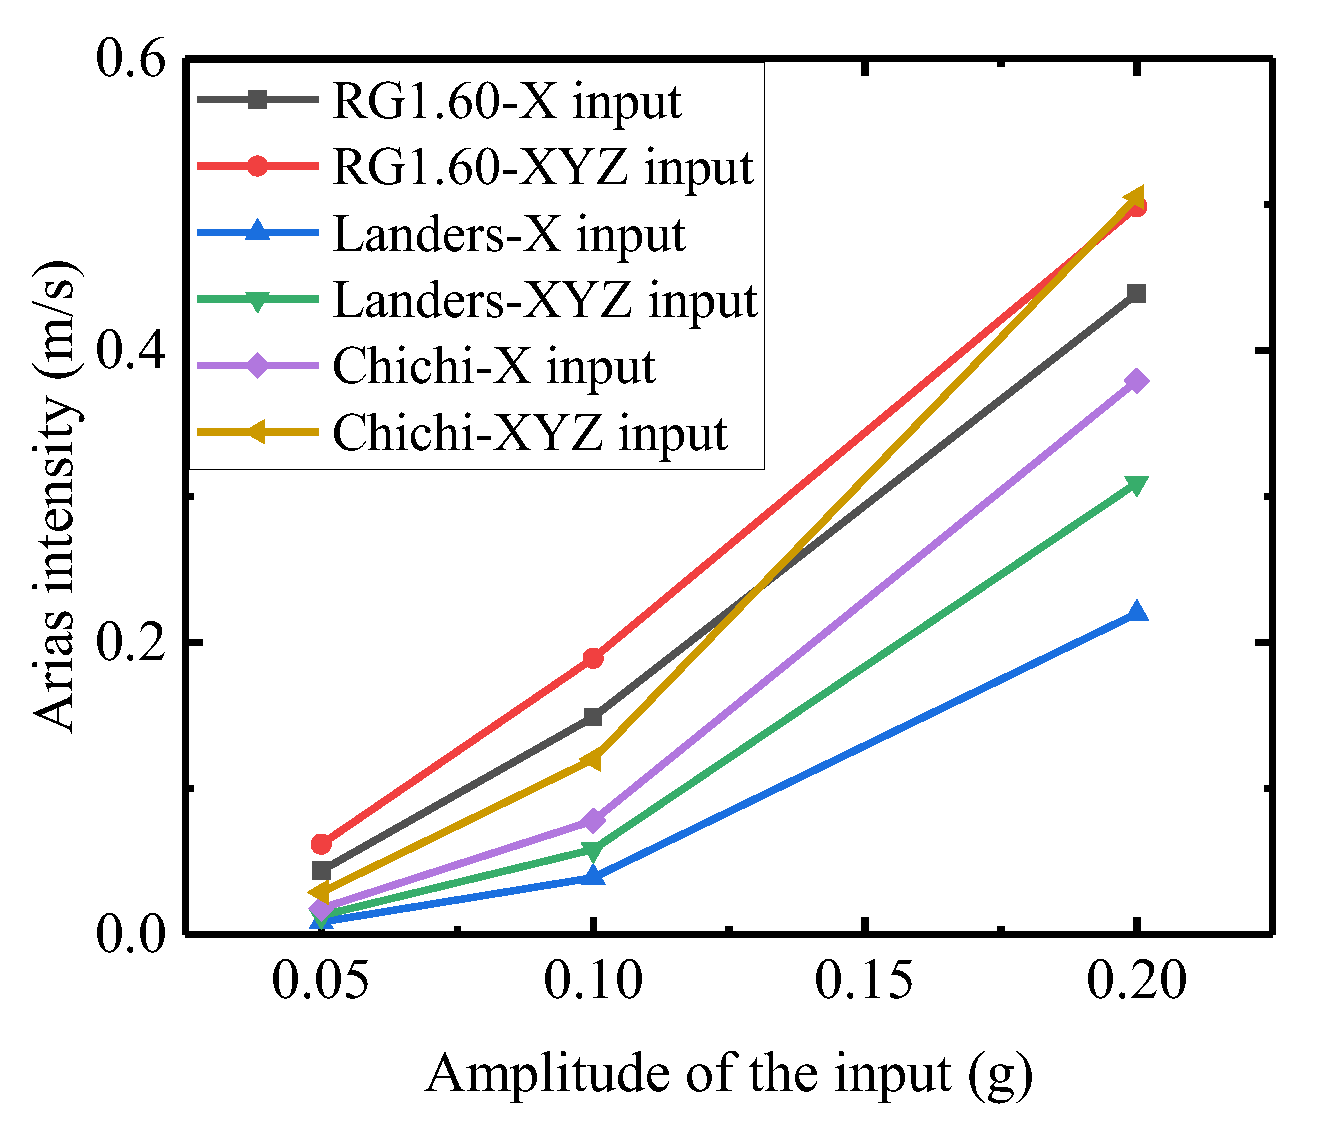
The Arias intensity amplification factor at different heights of the safety-related plant is related to the frequency components of seismic motion input, which is larger under RG1.60 seismic motion input than that of the other two natural seismic motion input cases. That is because RG1.60 seismic motion has more components near the natural frequency of the soil–structure system model. In addition, the high-frequency components of the RG1.60 seismic motion cause a more severe vertical rocking motion of the nuclear power plant than the other two natural seismic motions.
(2)
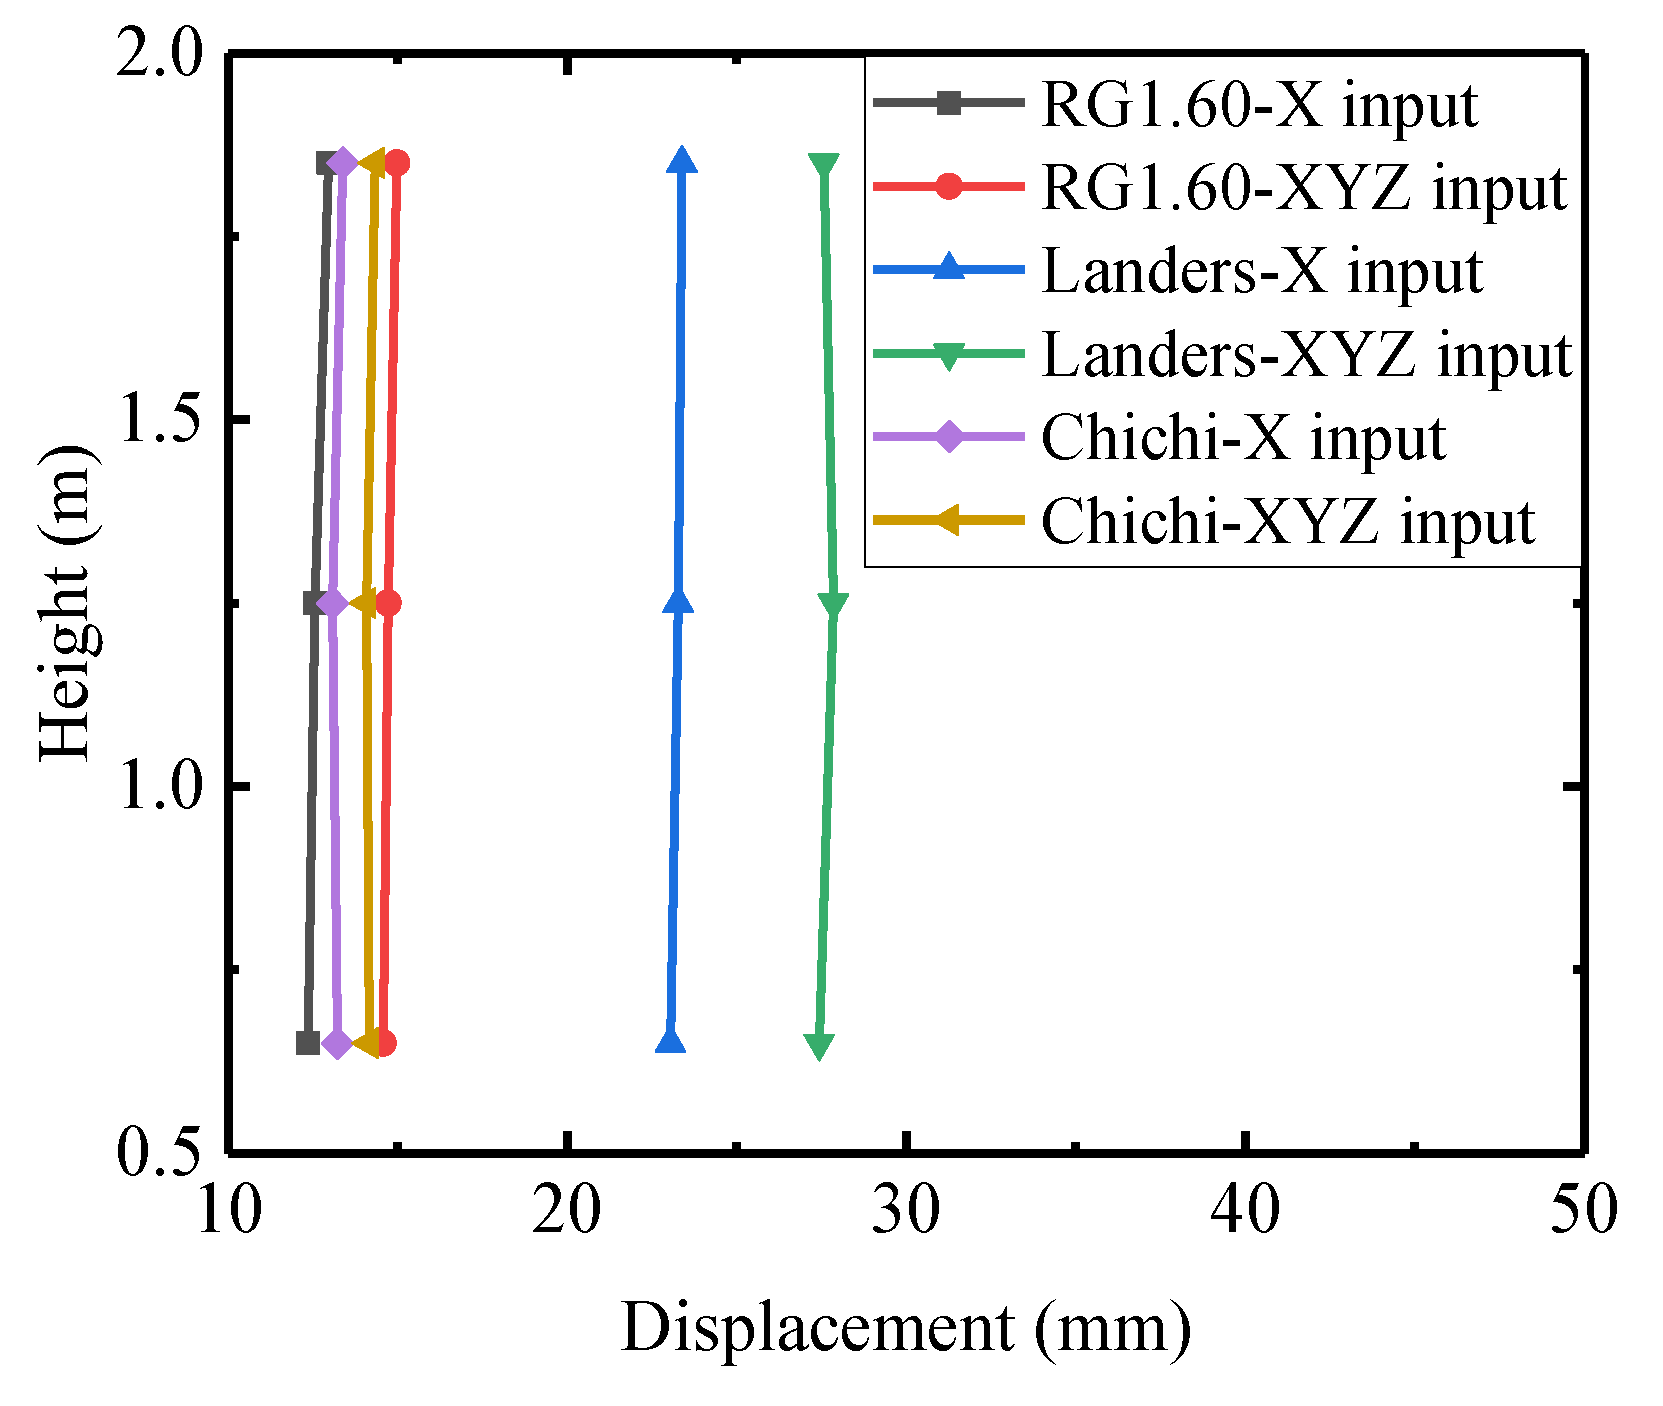
When the seismic motion is input in three directions simultaneously, the Arias intensity value, displacement, and degree of vertical rocking motion of the safety-related plant are largerthan in unidirectional input cases. The shape of the floor spectrum is basically the same as that of the unidirectional input, and the peak period changes little.
(3)
The Arias intensity value and rocking motion amplitude of the pile group-foundation safety-related plant are less than those of the raft-foundation safety-related plant. In most frequency bands, the value of the Fourier amplitude spectrum at the top of the raft-foundation structure is greater than that of the pile group-foundation structure. The reason for this is that the frequency of the input seismic motion is lower than the natural frequency of the test model system, and the natural frequency of the pile-foundation model system is higher than that of the raft-foundation model system, so the amplification effect is weakened. The displacement of the safety-related plant on different foundation forms is basically the same because the frequency of the input displacement is low and far away from the natural frequency of the model systems.
Based on the above conclusions, it is recommended to use three-dimensional seismic motion input in the seismic response analysis of nuclear power plants on non-rock sites to make the results less underestimated and more reasonable. In addition, the seismic performance of a nuclear power plant on a non-rock site can be enhanced by setting pile group foundations.

Author Contributions

Conceptualization, X.L. and L.J.; Methodology, X.L.; Writing—original draft, X.L.; Visualization, Y.M.; Project administration, W.Q. and J.Y. All authors have read and agreed to the published version of the manuscript.

Funding

This research was funded by Scientific Research Fund of Institute of Engineering Mechanics, China Earthquake Administration (Grant No. 2019B10).

Institutional Review Board Statement

Not applicable.

Informed Consent Statement

Not applicable.

Data Availability Statement

Data available in a publicly accessible repository.

Conflicts of Interest

The authors declare no conflict of interest.

References

  1. Du, N. Exploration and practice of quality assurance for haixing nuclear power plant soft foundation treatment. In Proceedings of the Progress Report on China Nuclear Science and Technology (Roll VI)-Proceedings of the 2019 Annual Academic Meeting of the Chinese Nuclear Society Volume 10 (Nuclear Safety Subsection and Nuclear Security Subsection), Baotou, China, 20–23 August 2019; pp. 70–77. [Google Scholar]
  2. Wang, F. Study on the Effect of Non-Rock Site on Seismic Behavior of Safety-Related Nuclear Structure; Institute of Geophysics, China Earthquake Administration: Beijing, China, 2021. [Google Scholar]
  3. Chen, J.; Ma, J.; Jiang, D. Dynamic analysis for isolation structures of nuclear power plants. Ind. Constr. 2016, 46, 105–110. [Google Scholar]
  4. Ying, J.; Wang, R.; Yu, Z. Earthquake response analysis of soil-pile-nuclear power station auxiliary workshop structure interaction system. Earthq. Eng. Eng. Dyn. 1995, 1, 44–52. [Google Scholar]
  5. Sayed, M.; Kim, D.; Cho, S.G. Seismic Analysis of Base Isolated Nuclear Power Plant Considering Nonlinear Pile-Soil Interaction; Transactions, SMiRT-22: San Francisco, CA, USA, 2013; pp. 18–23. [Google Scholar]
  6. Li, W.; Yin, X.; Wang, G. Seismic response analysis of nuclear power plant on soil foundation considering pile-soil-structure dynamic interaction. J. Seismol. Res. 2016, 39, 40–45+180. [Google Scholar]
  7. Wang, G.; Zhang, R.; Zhao, J. Analysis on seismic bearing capacity of natural and pile foundations about a coastal nuclear power plant in soft ground. J. Seismol. Res. 2016, 39, 15–21+179–180. [Google Scholar]
  8. Luo, C.; Yang, X.; Zhan, C.; Jin, X.; Ding, Z. Nonlinear 3D finite element analysis of soil-pile-structure interaction system subjected to horizontal earthquake excitation. Soil Dyn. Earthq. Eng. 2016, 84, 145–156. [Google Scholar] [CrossRef]
  9. Zou, D.G.; Sui, Y.; Chen, K. Plastic damage analysis of pile foundation of nuclear power plants under beyond-design basis earthquake excitation. Soil Dyn. Earthq. Eng. 2020, 136, 106179. [Google Scholar] [CrossRef]
  10. Yang, J.; Ma, Y.; Cai, J. Research on the seismic response analysis of nuclear island buildings with pile foundation. Ind. Constr. 2021, 51, 31–36. [Google Scholar]
  11. Zhu, S.; Chen, G.; Jiang, P.; Chen, W.; Gao, W. 3D nonlinear response characteristics of the pile-raft-supported AP1000 nuclear island building in soft deposits subjected to strong ground motions. Eng. Mech. 2021, 38, 129–142. [Google Scholar]
  12. Chen, S.L.; Lv, H.; Zhou, G.L. Partitioned analysis of soil-structure interaction for nuclear island building. Earthq. Eng. Struct. Dyn. 2022, 51, 2220–2247. [Google Scholar] [CrossRef]
  13. Ha, J.G.; Lee, S.H.; Kim, D.S.; Choo, Y.W. Simulation of soil–foundation–structure interaction of Hualien large-scale seismic test using dynamic centrifuge test. Soil Dyn. Earthq. Eng. 2014, 61–62, 176–187. [Google Scholar] [CrossRef]
  14. Li, X.; Wang, X.; He, Q. Shaking table tests for evaluation of seismic behavior of nuclear power plants on non-rock site. Nucl. Power Eng. 2017, 38, 31–35. [Google Scholar]
  15. Wang, X.H.; Li, X.J.; Liu, A.W.; He, Q.; Hou, C. Seismic analysis of soil-structure system of nuclear power plant on non-rock site via shaking table test. Soil Dyn. Earthq. Eng. 2020, 136, 106209. [Google Scholar]
  16. Peng, L.Y.; Kang, Y.J.; Tang, Z.Y.; Chen, H.T. Seismic Performance of CAP1400 Nuclear Power Station considering Foundation Uplift. Shock. Vib. 2018, 2018, 16. [Google Scholar] [CrossRef] [Green Version]
  17. Zhang, X.; Yan, W.; Sun, Y.; Chen, S.; He, H. Shaking table test of nuclear power plant considering uniform hazard spectrum. Nucl. Power Eng. 2018, 39, 80–84. [Google Scholar]
  18. Zhou, Z.; Guo, J.; Wei, X.; Zhang, J. Research of Coupling effect of horizontal and vertical seismic response of nuclear structures considering SSI effect. Struct. Eng. 2018, 34, 82–87. [Google Scholar]
  19. Zhou, Z.; Zhou, L.; Zhao, J. Shaking table test study of AP1000 base-isolated nuclear power plant. Earthq. Eng. Eng. Dyn. 2020, 40, 64–72. [Google Scholar]
  20. Gao, Y.; Wang, T.; Dai, J. Experimental research on seismic responses of a new type of nuclear power plant under different site conditions. Eng. Mech. 2020, 37, 116–124. [Google Scholar]
  21. Jing, L.; Wang, G.; Li, J.; Sun, Y.; Zhou, Z.; Qi, W. Shaking table tests and numerical simulations of dynamic interaction of soil-pile-nuclear island system. Chin. J. Geotech. Eng. 2022, 44, 163–172+207–208. [Google Scholar]
  22. GB50011-2010; Ministry of Housing and Urban-Rural Development of the People’s Republic of China. Code for Seismic Design of Buildings. China Architecture Press: Beijing, China, 2010.
  23. GB50267-2019; Ministry of Housing and Urban-Rural Development of the People’s Republic of China. Code for Seismic Design of Nuclear Power Plants. China Planning Press: Beijing, China, 2019.
  24. Arias, A. A Measure of Earthquake Intensity, in Seismic Design for Nuclear Power Plants; MIT Press: Cambridge, UK, 1970. [Google Scholar]
Figure 1. Diagram of nuclear power plant.
Sustainability 15 10366 g001
Figure 2. Model of soil–raft superstructure system.
Sustainability 15 10366 g002
Figure 3. Diagram of pile group foundation. (a) Cross-section of single pile reinforcement. (b) Vertical section of single pile reinforcement. (c) Diagram of connection between piles and soil container. (d) Layout of pile group.
Sustainability 15 10366 g003
Figure 4. Layout of sensors.
Sustainability 15 10366 g004
Figure 5. Acceleration time history and Fourier amplitude spectrum of input seismic motion. (a) Time history of RG1.60. (b) Fourier spectrum of RG1.60. (c) Time history of Landers. (d) Fourier spectrum of Landers. (e) Time history of Chichi. (f) Fourier spectrum of Chichi.
Sustainability 15 10366 g005
Figure 6. Cracks on surface of soil around the foundations after 0.20 g seismic motion input. (a) Test of pile group foundation model. (b) Test of raft foundation model.
Sustainability 15 10366 g006
Figure 7. Arias intensity amplification factor curve of structure model with pile group foundation. (a) RG1.60 unidirectional input. (b) RG1.60 multi-directional input. (c) Landers unidirectional input. (d) Landers multi-directional input. (e) Chichi unidirectional input. (f) Chichi multi-directional input.
Sustainability 15 10366 g007
Figure 8. Floor spectra of structure model with pile group foundation. (a) RG1.60 unidirectional input. (b) RG1.60 multi-directional input. (c) Landers unidirectional input. (d) Landers multi-directional input. (e) Chichi unidirectional input. (f) Chichi multi-directional input.
Sustainability 15 10366 g008
Figure 9. Arias intensity values of rocking motion at the top of superstructure with pile group foundation.
Sustainability 15 10366 g009
Figure 10. Diagram of displacement calculation in condition of multi-directional seismic motion input.
Sustainability 15 10366 g010
Figure 11. Maximum displacement of superstructure with pile group foundation.
Sustainability 15 10366 g011
Figure 12. Comparison of Arias intensity values of superstructure with different foundation forms. (a) RG1.60 input. (b) Landers input. (c) Chichi input.
Sustainability 15 10366 g012
Figure 13. Comparison of spectrum of superstructure with different foundation forms. (a) RG1.60 input. (b) Landers input. (c) Chichi input.
Sustainability 15 10366 g013
Figure 14. Comparison of Arias intensity of rocking motion of superstructure with different foundation forms.
Sustainability 15 10366 g014
Figure 15. Comparison of displacement of superstructure with different foundation forms.
Sustainability 15 10366 g015
Table 1. The natural frequencies of structural models and the prototype.
The PrototypeThe Structural Model with Raft FoundationThe Structural Model with Pile Group Foundation
In X direction5.2020.2020.67
In Y direction3.9116.5517.75
Table 2. Results of frequency using white noise method (Hz).
ConditionsPile Group Foundation ModelRaft Foundation Model
Before the test16.1014.14
After the test16.1413.92
Table 3. Arias intensity values at the top of structure model with pile group foundation (m/s).
Type of Seismic MotionUnidirectional InputMulti-Directional Input
0.05 g0.10 g0.20 g0.05 g0.10 g0.20 g
RG1.601.1724.00512.1391.5465.49313.666
Landers0.3171.4027.4720.4992.08411.342
Chichi1.3454.35119.1601.3166.26223.674
Disclaimer/Publisher’s Note: The statements, opinions and data contained in all publications are solely those of the individual author(s) and contributor(s) and not of MDPI and/or the editor(s). MDPI and/or the editor(s) disclaim responsibility for any injury to people or property resulting from any ideas, methods, instructions or products referred to in the content.

